

Abstract
The intertropical convergence zone (ITCZ) accounts for more than 30% of the global precipitation and its variability has a great effect on the people living in the tropical area. It is the manifestation of the Hadley circulation, tropical dynamic and thermodynamic coupling and the air-sea interaction. Therefore, it is essential to understand the changes and variability of the ITCZ, including its position and intensity. Using observed precipitation from GPCP and TRMM 3B43, as well as the ERA5 reanalysis data, we examine the ITCZ variations over the global and seven regions from 1998–2018. These data sets show consistent ITCZ climatology and inter-annual variability. Except over Atlantic and eastern Pacific where ITCZ stays in the northern hemisphere, the ITCZ crosses the equator after equinoxes over other sections. There is no overall significant shift of annual mean ITCZ position over the globe and seven regions, except over the America section where the GPCP data show a significant increase trend of 0.8° decade−1 and over the western Pacific section where ERA5 data show a significant decrease trend of −1.2° decade−1. The ITCZ positions over the globe and Africa are related to both ENSO and NAO, while ITCZ position over eastern Pacific is significantly affected by ENSO and the Atlantic ITCZ is mainly related to NAO. Except for the western Pacific, all other sections are significantly related to local meridional surface temperature gradient, particularly over America, Atlantic and eastern Pacific. The meridional gradient variation of the vertically integrated moist static energy has generally good agreement with the shift of the intertropical convergence zone, particularly for the seasonal climatology over the Africa region. The relationship between ITCZ position and intensity shows complicated patterns, with positive correlation over the globe, but different correlations over different sections. The two observed data sets are more or less consistent, but ERA5 shows discrepancies over some sections. It is also found that the local meridional temperature gradient has more influences on the ITCZ positions than the global one.
Export citation and abstract BibTeX RIS

Original content from this work may be used under the terms of the Creative Commons Attribution 4.0 license. Any further distribution of this work must maintain attribution to the author(s) and the title of the work, journal citation and DOI.
1. Introduction
The intertropical convergence zone (ITCZ) is the location with strong convection and maximum rainfall (Philander et al 1996) and controls the tropical precipitation over both ocean and land (Nicholson 2018). Its cloudiness has important contribution to the planetary albedo and the latent heat release in the convective cloud system plays an important role in the atmospheric energy balance (Waliser and Gautier 1993). It counts for 32% of the global precipitation (Kang et al 2018) and is related to the important atmospheric circulation—Hadley circulation, reflecting the dynamic and thermodynamic coupling in the tropics and air-sea interactions over the oceans. Therefore, it is essential to understand the variability of the ITCZ.
It has been difficult for models to represent the ITCZ position correctly (Flato et al 2013, Shonk et al 2018), the double ITCZ (two rainbands) persists in modern models where the precipitation is overestimated over southern tropical oceans and underestimated over equatorial Pacific (Li and Xie 2014, Zhang et al 2015, Adam et al 2016, Loeb et al 2016), which may be associated with the southeastern Pacific sea surface temperature (SST) bias (Ma et al 1996, Song and Zhang 2016), tropical North Atlantic SST bias (Song and Zhang 2017) and model resolution (Song and Zhang 2020). Some studies in recent years have shown the influences of extratropical forcings on the ITCZ shift (Frierson and Hwang 2012), such as the increase in Northern Hemisphere (NH) sea ice coverage can lead to the southward shift of the ITCZ position (Chiang and Bitz 2005), the hemispheric albedo imbalance change will alternate the ITCZ position (Haywood et al 2016), and the cloud bias over the Southern Ocean can be responsible for the double‐ITCZ bias (Hwang and Frierson 2013, Hyder et al 2018). All these changes will alternate the hemispheric energy imbalances, causing deviations in the cross equatorial energy and water vapor transport (Kang et al 2008, Donohoe et al 2013) and affecting the Hadley circulation. The ITCZ shift can be a response to a distant perturbation in the energy budget (Vellinga and Wood 2002, Broccoli et al 2006, Schneider et al 2014, Adam et al 2016), and/or the effective atmospheric heat capacity (Song et al 2018a) in the energy budget. Therefore changes of cloud or factors affecting the effective atmospheric heat capacity over remote regions in addition to the ITCZ area, can alter the ITCZ position, thereby hindering understanding of ITCZ variation simulated by models.
Due to the complex land/sea distributions, the ITCZ characteristics over different sections can be different. Using the ECMWF (European Centre for Medium-Range Weather Forecasts) reanalysis, Wang and Fu (2002) found that the rain band variation over South America is closely associated with the change of the local meridional wind direction. The rainband is mainly located to the north of the equator during the southerly cross-equatorial wind and shifts toward the Amazon basin and subtropical South America during the northerly wind. Using satellite observations, Hattori et al (2011) found that different cross-equatorial wind patterns can affect rainbands at different locations. Li et al (2016) also found the regional tropical precipitation is related to the ENSO events. The earlier study of Waliser and Gautier (1993) showed some distinct features of ITCZ climatology over different tropical sections using satellite observed high reflected cloud data set. Various studies have been carried out on this topic using theoretical frameworks (Fletcher 1945, Hastenrath 1968), model simulations (Goswami et al 1983, Shonk et al 2018, Byrne et al 2018), atmospheric reanalyses (Berry and Reeder 2014, Wodzicki and Rapp 2016, Weller et al 2017) and observations (Waliser and Gautier 1993, Chiang and Friedman 2012, Donohoe and Voigt 2017, Kang et al 2018). We will re-visit the ITCZ characteristics using the latest precipitation data sets including observations of GPCP, TRMM 3B43 and the ERA5 atmospheric reanalysis, focusing on its sectional position variations. Relationships with Multivariate ENSO Index (MEI, Wolter and Timlin 1998), Pacific Decadal Oscillation (PDO, Trenberth and Hurrell 1994) index and North Atlantic Oscillation (NAO, Jones et al 1997) index, as well as the surface temperature gradient and the vertically integrated moist static energy gradient between both sides of the equator, are also investigated, in order to have further understanding of the ITCZ variations and assess the capability of ERA5 in the description of ITCZ characteristics.
2. Data and method
In this study, the observed precipitation data are from GPCP (Global Precipitation Climatology Project) of resolution 1° × 1° (Adler et al 2008) and TRMM 3B43 (Tropical Rainfall Measuring Mission) of resolution 0.25° × 0.25° (Kikuchi and Wang 2008), and the precipitation data from ERA5 (Hersbach et al 2020) are also employed. ERA-Interim does not include a realistic representation of volcanic aerosols (Allan et al 2014; Liu et al 2015, 2017), but this is corrected in ERA5, and initial comparison in outgoing longwave radiation between ERA5 and observations shows good variability agreement. It must be borne in mind that the observational data have some uncertainties originated from different retrieving algorithms (Kummerow et al 2001; Liu et al 2012). Although large amount of data have been assimilated to the atmospheric model, the precipitation from ERA5 reanalysis cannot be regarded as the truth, but it is included for comparison and evaluation purpose in this study. We use these three data sets to check consistence and discrepancies of the defined ITCZ, in order to obtain robust results. Surface temperature from ERA5 is used to calculate the temperature gradient between the north and south of the equator. The influences of MEI, PDO and NAO indices on ITCZ variability are also investigated. All data sets and brief descriptions are listed in table 1.
Table 1. Datasets.
| Data set | Period | Resolution | References |
|---|---|---|---|
| GPCP precipitation | 1997–2019 | 1° × 1° | Global, daily. (Adler et al 2008) |
| TRMM 3B43 precipitation | 1998–2019 | 0.25° × 0.25° | Monthly; ocean and land covering 50° N–50° S (http://trmm.gsfc.nasa.gov/3b43.html) (Kikuchi and Wang 2008) |
| ERA5 (surface temperature, total precipitation, vertically integrated moist static energy) | 1979–2020 | 0.25° × 0.25° | Monthly. (Hersbach et al 2020) |
| MEI (Multivariate ENSO Index) | www.webberweather.com/multivariate-enso-index.html (Wolter and Timlin 1998) | ||
| PDO | https://ds.data.jma.go.jp/tcc/tcc/products/elnino/decadal/pdo.html | ||
| NAO | www.ncdc.noaa.gov/teleconnections/nao/ |
There are many ways to define the ITCZ (Nicholson 2018), such as the minimum pressure, surface wind convergence (Grodsky et al 2003), maximum rainfall (Philander et al 1996, Sultan and Janicot 2000), maximum vorticity (Magnusdottir and Wang 2008), the minimum outgoing longwave radiation (Gu and Zhang 2002) and the maximum cloudiness (Waliser and Gautier 1993). In this study, the ITCZ position is determined by the maximum zonal mean precipitation. For the global mean ITCZ, the maximum zonal mean precipitation between 20°S–20°N is taken as the ITCZ intensity and the corresponding latitude is the ITCZ position. For the seven sections defined in table 2, the ITCZ is defined the same as that for the global one, but the zonal mean precipitation is averaged over that section. The area mean surface temperature difference (ΔT) between 0–5°N and 0–5°S is used to represent the meridional temperature gradient, and the global and local mean ΔT values are calculated separately. The area mean vertically integrated moist static energy difference (ΔSe) between 0–5°N and 0–5°S is also computed.
Table 2. The months for the ITCZ crossing the equator and at the most northern and the most southern points. They are based on three data sets and the exceptional month is in bracket. The range in the last column is months taken by the ITCZ traveling from the most northern point to the most southern point.
| Section | Longitude range | South to north | North to south | Most northern point | Most southern point | Range |
|---|---|---|---|---|---|---|
| Global | 180°W–180°E | 3–4 | 12–1 | 8 | 2 | 6 |
| America | 80–49°W | 4–5 | 10–11 (11–12 for ERA5) | 10 (9 for GPCP) | 12 (1 for ERA5) | 2 (4) |
| Africa | 9–43.5°E | 4–5 | 10–11 | 8 (7 for TRMM) | 1 | 5 (6) |
| Atlantic | 49°W–9°E | 8 | 3 | 7 | ||
| Indian Ocean | 43.5–104°E | 4–5 (5–6 for ERA5) | 8–9 (9–10 for GPCP) | 6 (7 for GPCP) | 3 | 9 (8) |
| Western Pacific | 104–162.5°E | 5–6 (4–5 for ERA5) June | 11–12 (10–11 for GPCP) | 8 | 2 (1 for TRMM) | 6 (5) |
| Central Pacific | 162.5°E–139.5°W | 3–4 | 12–1 | 10 | 1 | 3 |
| Eastern Pacific | 139.5–80°W | 9 | 3 | 6 |
3. Results
3.1. ITCZ climatology
The multiannual mean precipitation over 2000–2018 from GPCP, TRMM 3B43 and ERA5, together with the zonal means, are shown in figure 1. The ITCZ two dimensional (2D) structures and zonal means from three data sets are very similar, but ERA5 shows a stronger zonal mean precipitation peak north of the equator. The peak latitudes are 6.0°N, 5.875°N and 6.75°N for GPCP, TRMM 3B43 and ERA5 data, respectively. The mean ITCZ position is clearly to the north of the equator over eastern Pacific and Atlantic, characterized by the narrow and bright rainbands, but the mean ITCZ position is mainly to the south of the equator over Indian Ocean. Due to the existing south Pacific convergence zone (SPCZ) over the western and central Pacific, the heavy precipitation occurs on both sides of the equator over the western Pacific and central Pacific, the rainband becomes wide and it is difficult to get the exact ITCZ position over these regions. The rainband over the America continent covers a wide area around the equator and looks discontinuous compared with those over the eastern Pacific and Atlantic, which is explained by the convection-suppressing influence of the cold water brought to the surface by the coastal upwelling (Waliser and Gautier 1993). The mean precipitation over the Africa section is weaker compared with other sections, mainly due to the average over a wide latitude range as the rainband shifts long distances as shown in figure 2(c). The precipitation intensities from TRMM over North Atlantic and South Pacific storm regions are stronger than that in other two data sets, but the precipitation intensity in the North Pacific storm region is weaker than that in GPCP and ERA5.
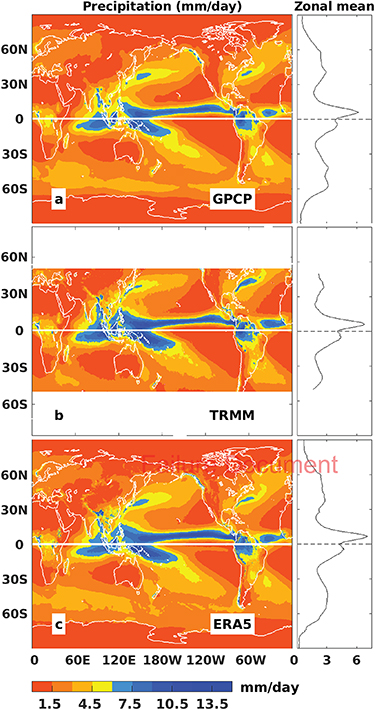
Figure 1. Left column is multiannual mean (2000–2018) precipitation showing ITCZ positions from GPCP, TRMM 3B43 and ERA5. The equator is highlighted by the white thick line. The right column is the zonal mean precipitation distribution.
Download figure:
Standard image High-resolution image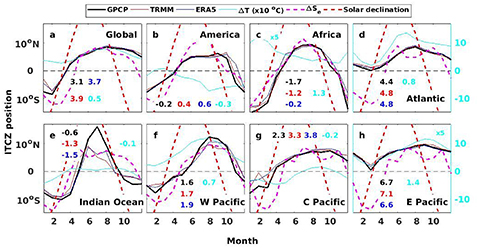
Figure 2. Climatology of ITCZ positions from precipitation of GPCP, TRMM 3B43 and ERA5 for global and seven sections. The average period is from 2000–2018. The domain area mean surface temperature difference (ΔT) between 0–5°N and 0–5°S is plotted and multiplied by 10, except for the Africa and eastern Pacific sections where multiplication of 5 is applied. The area mean vertically integrated moist static energy difference (ΔSe) between 0–5°N and 0–5°S is plotted in magenta, it is normalized (minus mean and divided by one standard deviation) and multiplied by 8 for comparison purpose. The solar declination is plotted and the multiannual means of ITCZ positions from different data sets and the mean surface temperature difference are also displayed in the plot.
Download figure:
Standard image High-resolution imageThe seasonal climatology of ITCZ positions over 2000–2018 for different sections are shown in figure 2, together with the regional area mean temperature differences ΔT (0–5°N minus 0–5°S, multiplied by 10 to enlarge the variation, except for that over Africa and eastern Pacific sections where it is multiplied by 5). Also shown is the area mean vertically integrated moist static energy difference ΔSe (between 0–5°N and 0–5°S) which is normalized (minus mean and divided by one standard deviation) and multiplied by 8 for comparison purpose, and the solar declination (thick dashed red line). Multiannual means for each section from different data sets and the mean surface temperature difference are also displayed in the plot. There is an overall good agreement of the ITCZ position between three data sets. The months for the ITCZ crossing the equator and at the most northern and the southern points are listed in table 2. It can be clearly seen from figure 2 that the ITCZ position in each section has seasonal variation and the time crossing the equator varies, but it generally passes the equator from south to north around April and reaches the most northern point around August, and then moves back to the south again around November, except that ITCZ positions over Atlantic and eastern Pacific are always to the north of the equator, but they also show similar seasonal variability with those in other sections. The ITCZ climatology over different sections are consistent with the previous results of Waliser and Gautier (1993). The time for the ITCZ crossing the equator is always later than the equinox in both Spring and Autumn, which can be seen in figure 2 and table 2. The northward crossing time over western Pacific is quite late and around May-June in observations. The time for ITCZ reaching the most northern point is also different, but most of them are in August, while it is in October over America continent and central Pacific, and between June and July over Indian Ocean.
Compared with the global ΔT variation in figure 2(a) and the local ΔT over other seven sections, the ITCZ positions and ΔT show similar seasonal variability over the global and ocean sections. However the relationship is reversed over two land sections, implying that ΔT is not the main driver of the ITCZ position shift over these two sections. On the one hand, the distinct geographic characteristics in these two sections may play a role, the surface temperature south of the equator is higher than that north of the equator over the America section, so the mean local ΔT is negative most of the time, while the surface temperature north of the equator is higher than that south of the equator over the Africa section, and the mean local ΔT is always positive. On the other hand, the seasonal cycle of temperature is also affected by precipitation variation. During the wet season, more clouds with more rainfall will reduce the incoming solar radiation and moisten the soil, meaning more net energy is used up evaporating water rather than heating the soil; both effects act to reduce the surface temperature. So the ΔT variation may be affected by these combined factors, resulting in little relationship between seasonal variations of ΔT and ITCZ position over these two land sections. However, reasons for the ΔT variation over these two land sections may be more complicated and further work is needed. Another possible factor driving the ITCZ shift is the vertically integrated moist static energy meridional gradient (Song et al 2018b) which is calculated as the area mean difference (ΔSe) between 0–5°N and 0–5°S and is plotted as solid magenta line in figure 2. ΔSe has better agreement in seasonal variability with ITCZ shift over some sections than ΔT, particularly over Africa section where ΔSe matches the ITCZ position seasonal variability.
The global tropical area mean surface temperature to the north of equator is always higher than that south of the equator. The multiannual mean global ITCZ positions are at 3.1, 3.9 and 3.7°N from three data sets, respectively. There is very good agreement of the ITCZ positions between three data sets throughout the year except around January, which is mainly contributed from African and central Pacific sections, and may be related to the fast movement of the rain belt around that time. The overall mean ITCZ positions have good sign agreement for each sections except over the America continent where GPCP shows the ITCZ position at 0.2°S, while it is 0.4 and 0.6°N for TRMM and ERA5, this is partly from the earlier southward movement of ITCZ position around October in GPCP and the further southward position (∼7.8°S) than the northward position (∼5.2°N), so the cancellation of north and south positions makes the annual mean ITCZ position around the equator.
The persistent positions to the north of the equator over the eastern Pacific and Atlantic produce a stronger and narrower mean rainfall band than over other sections in figure 1. The ITCZ positions from three data sets are quite consistent and the most southward positions are all in March, while the most northward positions are in August for Atlantic and September for eastern Pacific. The ITCZ position seasonal variation in the eastern Pacific is quite consistent with the local mean ΔT and the mechanism of the ITCZ annual cycle was explained in detail by Mitchell and Wallace (1992). Over the central Pacific, the mean ITCZ positions are north of the equator from April to December and only to the south of the equator from January to March, which causes the narrow ITCZ rain belt in figure 1. The multiannual mean positions over Africa and the Indian Ocean are all south of the equator. The ITCZ can reach further south (∼14°S) than further north (∼9°N) over Africa and the ITCZ stays at the latitude of 8–9°S longer over Indian Ocean, causing the overall mean position south of the equator. The sharp northward movement of the ITCZ over the Indian Ocean is related to the onset of the Indian monsoon.
3.2. ITCZ variability
The annual mean time series of the ITCZ position for the global and seven different sections are plotted in figure 3 and the correlation coefficients (r) between GPCP and other two data sets are also displayed, with significant correlation (applying the two tailed test using Pearson critical values at the level of 5%) in bold. The only insignificant correlation is between GPCP and ERA5 data sets over America as shown in figure 3(b). The correlation coefficients between two observational data sets are all significant, with the highest one of r = 0.94 over eastern Pacific and the lowest one of r = 0.41 over western Pacific. After using the Mann–Kendall test at a significance level of 0.05 (Hipel and Mcleod 1994), it is found that only two annual mean time series have significant trends, one is from GPCP data over the America section and another from ERA5 data over western Pacific section. Over the America section, both observed annual mean ITCZ positions show an increasing trend and the trend of 0.8° decade−1 from GPCP is significant, while the ERA5 data show insignificant decreasing trend. Over the western Pacific section, all data sets show decreasing trends, but only the trend of −1.2° decade−1 from ERA5 is significant, implying the southward shift of ITCZ position over this time period. However, the significant southward shift from ERA5 could relate to inhomogeneity in the observing system used since it is not seen in the independent observations.
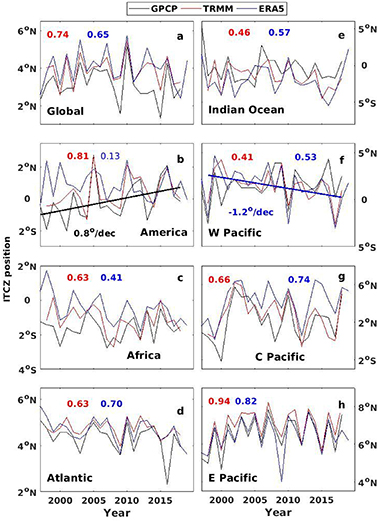
Figure 3. Annual mean ITCZ position time series for global and seven sections. The correlation coefficients between GPCP and TRMM (red) and between GPCP and ERA5 (blue) are also displayed. Significant values are in bold.
Download figure:
Standard image High-resolution imageIn order to investigate reasons for the annual mean position variability, the correlation coefficients are calculated between the ITCZ position and NAO, MEI, PDO indices and ΔT and results are listed in table 3. The scatter plots between ITCZ position and NAO index are shown in figures 4(a)–(d). There are some significant correlations between them over the global, Atlantic and Indian Ocean, and the correlations over Africa are also close to the significant value as shown in table 3, so they are also plotted in figure 4(b). NAO is the weather phenomenon in the north Atlantic of fluctuations in the difference of atmospheric pressure at sea level between the Icelandic Low and the Azores High. Through fluctuations in the strength of the Icelandic low and the Azores high, it controls the strength and direction of westerly winds and location of storm tracks across the North Atlantic (Hurrel 2003). Figure 4 shows that there are significant negative correlations over the globe in all three data sets. Correlations over both Atlantic and Indian Ocean are negative and significant for TRMM data. It is easy to understand the negative correlation over the Atlantic, since the positive NAO normally implies the anomalous high pressure at Azores High, leading to stronger trade wind toward the equator, pushing the ITCZ position southward (Souza and Cavalcanti 2009). Previous studies have found that the Arctic Oscillation (AO)/North Atlantic Oscillation (NAO) is related to tropical intraseasonal time scale variations (Zhou and Miller 2005, Cassou 2008, Lin et al 2009, Yuan et al 2011). In a simulation study, Lin and Brunet (2011) confirmed that the NAO can trigger wind anomalies over the Indian Ocean within about 10 d, influencing the ITCZ positions. Gong et al (2013) also found that the AO and Indian Ocean ITCZ are closely related. It was found by McHugh and Rogers (2001) that the southeast Africa rainfall is closely related to the NAO due to the anomalous equatorial westerly flow from the subtropical Atlantic and traversing the Africa continent. Figure 4(b) shows that the correlations over Africa are all positive but insignificant.

Figure 4. Left column is the scatter plot between ITCZ position and NAO index and the right column is between ITCZ position and MEI. Lines are from the least square fitting and the thick line indicates significant correlation.
Download figure:
Standard image High-resolution imageTable 3. Correlation coefficients between ITCZ position and NAO, MEI, PDO, area mean ΔT (T0−5°N − T0−5°S, local and global), area mean vertically integrated moist static energy ΔSe (Se 0–5°N − Se 0–5°S, local) and ITCZ intensity over 1998–2018. Three numbers in each cell are based on ITCZ positions from GPCP/TRMM/ERA5. The significant values are in bold after applying the two tailed test using Pearson critical values at the level of 5%.
| Section | NAO | MEI | PDO | ΔT(Local) (T0−5°N − T0−5°S) | ΔT(Global) (T0−5°N − T0−5°S) | ΔSe (Local) (E0−5°N − E0−5°S) | ITCZ intensity |
|---|---|---|---|---|---|---|---|
| Global | −0.6/−0.5/−0.4 | −0.3/−0.1/−0.2 | −0.1/0.0/−0.1 | 0.3/0.1/0.2 | 0.3/0.1/0.2 | 0.1/0.0/0.1 | 0.4/0.2/0.4 |
| America | 0.1/−0.2/−0.3 | 0.2/0.1/0.0 | 0.2/0.1/−0.1 | −0.6/−0.6/−0.0 | 0.0/0.0/−0.1 | 0.6/0.6/−0.1 | −0.2/−0.3/0.2 |
| Africa | 0.3/0.4/0.1 | 0.3/0.4/0.4 | 0.2/0.3/0.3 | −0.2/−0.2/−0.5 | −0.1/−0.1/−0.5 | 0.2/0.3/0.2 | −0.1/−0.2/0.5 |
| Atlantic | −0.3/−0.5/−0.2 | 0.0/−0.4/0.1 | −0.0/−0.3/0.1 | 0.6/0.6/0.5 | 0.2/0.4/−0.1 | 0.5/0.6/0.6 | 0.2/0.2/−0.2 |
| Indian Ocean | −0.2/−0.5/−0.5 | 0.0/−0.4/−0.1 | 0.1/−0.3/0.0 | 0.7/−0.1/0.3 | 0.04/0.4/0.3 | 0.5/0.1/0.1 | −0.6/−0.3/−0.3 |
| W Pacific | 0.2/0.0/0.2 | −0.1/−0.1/−0.1 | −0.1/−0.2/−0.1 | 0.2/−0.03/0.1 | 0.07/0.1/0.2 | 0.5/0.5/0.6 | 0.4/−0.1/−0.4 |
| C Pacific | −0.3/−0.3/−0.1 | 0.3/−0.1/0.2 | 0.4/0.1/0.3 | 0.2/0.4/0.2 | 0.1/0.5/0.3 | 0.3/0.5/0.4 | 0.6/0.4/0.6 |
| E Pacific | −0.2/−0.2/−0.2 | −0.4/−0.4/−0.4 | −0.2/−0.1/−0.1 | 0.7/0.8/0.7 | 0.4/0.5/0.5 | 0.4/0.3/0.3 | −0.3/−0.3/0.2 |
Correlations between ITCZ position and MEI is plotted in figures 4(e)–(g). Although the significant correlation only occurs over eastern Pacific, the data over the global and Africa sections are also plotted, since their correlation coefficients are reasonably high and consistent between three data sets. For the global mean ITCZ position, three data sets show consistent negative correlations with MEI, but none of them is significant (figure 4(e)). There are positive correlations over Africa, again they are all insignificant. The negative correlations over eastern Pacific are all significant for three data sets. The negative correlations can be explained by the negative correlations between ENSO index and sea surface temperature anomaly over ATL3 region (20°W–0°, 3°S–3°N) (Zebiak 1993, Münnich and Neelin 2005), and the warmer Atlantic sea surface temperature during La Niña causes the pressure around the equator to be lower than normal, so the ITCZ will be pushed towards the equator. There is no significant correlations between ITCZ position and PDO index, which could simply be the short record since for decadal modes of variability there are not many cycles permitted in just 20 years, so they are not plotted.
Those non-local drivers, including ENSO, NAO and PDO, affect the ITCZ position variation by changing the local factor, such as the surface temperature gradient ΔT. In this study, both the global area mean ΔT between 0–5°N and 0–5°S and the local ΔTs between 0–5°N and 0–5°S bounded by the section longitudinal boundaries listed in table 2 are calculated. It is noted from table 3 that the correlation between ITCZ position and local ΔT in each section is generally higher than that using global ΔT. Except for the western Pacific where the correlations are all low, significant correlations are found over all other sections. The scatter plots are shown in figure 5. The distinct feature is that all correlations are positive over ocean sections, but correlations are negative over two land sections due to the reversed ΔT variations over these two domains as shown in figures 2(b) and (c). Both observations show significant negative correlations with ΔT (r = −0.6) over the America section and the correlation for ERA5 data is not plotted because it is very weak (−0.02). The plot for the Africa section shows similar negative correlation to the America section, but both observed correlations are not significant, while the ERA5 data show strong significant correlation (r = −0.5). The correlations over all ocean sections are positive and the strongest correlation occurs over eastern Pacific section (r ⩾ 0.7), followed by the Atlantic section (r ⩾ 0.5), and all three data sets show consistent correlations over these two sections.

Figure 5. Scatter plot between ITCZ position and local area mean surface temperature difference (0–5°N minus 0–5°S, in °C). Lines are from the least square fitting and the thick line indicates significant correlation.
Download figure:
Standard image High-resolution imageAnother more physically intuitive factor driving the ITCZ shift is the moist static energy meridional gradient ΔSe (Song et al 2018b). The correlation coefficients between ΔSe and ITCZ position over different sections are listed in table 3. There are significant correlations over all ocean sections and the America land section, particularly over the Atlantic and western Pacific sections where r ⩾ 0.5 for all data sets. Despite good seasonal variability agreement between ΔSe and ITCZ position over the Africa land section (figure 2(c)), the correlation coefficients are low (⩽0.3). The scatter plot between normalized ΔSe and ITCZ position over sections with significant correlations is shown in figure 6. Over America section, ΔSe has significant positive correlations with observed ITCZ positions. Over the Atlantic, western and eastern Pacific, ΔSe has significant positive correlations with ITCZ position shift from three data sets. However, only the ITCZ position variation from GPCP data has significant positive correlation with ΔSe over the Indian Ocean section.

Figure 6. Scatter plot between ITCZ position and local area mean vertically integrated moist static energy difference (0–5°N minus 0–5°S). Lines are from the least square fitting and the thick line indicates significant correlation.
Download figure:
Standard image High-resolution imageThe maximum zonal mean precipitation between 20°S and 20°N is taken as the ITCZ intensity. The intensity changes of the ITCZ are also investigated and the correlations between ITCZ position and intensity are listed in table 3 and plotted in figure 7. The relationships are quite diverse and most of them are not significant. For the global one, all three data sets show positive correlations which are significant for GPCP and ERA5. Observations over both land sections show weak negative correlations, while ERA5 data show weak positive correlations. Considering negative correlation in figure 7(c) and positive correlation in figure 4(b), the correlation between Africa precipitation and NAO should be negative, consistent with the observation of McHugh and Rogers (2000) in southeast Africa. Both observations show consistent correlations over ocean sections except for the western Pacific where TRMM data show weak negative correlation and GPCP data show positive correlation. The correlations are generally higher over Indian Ocean and central Pacific sections where all three data sets show good agreement. The ERA5 correlation show opposite signs to observations over land sections, Atlantic, western and eastern Pacific. The relationship between ITCZ position and intensity have shown complicated patterns. The two observed data sets are more or less consistent, but ERA5 shows discrepancies over some sections.

Figure 7. Scatter plot between ITCZ position and the corresponding ITCZ intensity. Lines are from the least square fitting and the thick line indicates significant correlation.
Download figure:
Standard image High-resolution image
4. Summary
Using observed precipitations from GPCP and TRMM 3B43 and the atmospheric reanalysis data from ERA5, the ITCZ climatology and its variation are studied, and the relationship between the ITCZ position and NAO, MEI, PDO indices and area mean meridional temperature gradient ΔT are investigated over the globe and seven sections. The ITCZ position climatology and the multiannual mean (1998–2018) seasonal variation show high consistency between three data sets, and the results are very similar to previous study of Waliser and Gautier (1993) using satellite observed highly reflective cloud data set. The multiannual mean ITCZ positions over the Atlantic and eastern Pacific are always north of the equator, and it stays north of the equator over central Pacific most of the time, causing the narrow and bright rainbands over those sections (figure 1).
The annual mean ITCZ position variability over different sections shows high consistency between three data sets, and the correlations between two observed data sets are all significant, with the highest r = 0.94 over eastern Pacific and the lowest r = 0.41 over western Pacific. The large discrepancy between ERA5 and observations happens over America continent section where observed annual mean ITCZ positions show an increasing trend, while the ERA5 data show a decreasing trend. There is no overall significant shift of ITCZ position over the globe and seven sections, except that over the America section where the GPCP data show significant increasing trend of 0.8° decade−1 and over the western Pacific section where ERA5 data show a significant decreasing trend of −1.2° decade−1.
As expected, the greatest effect of ENSO events on ITCZ position is over eastern Pacific where the warmer sea surface temperature anomaly around the equator during ENSO events will draw the ITCZ close to the equator, leading to the significant negative correlation between ITCZ position and MEI. There is no significant correlations between ITCZ position and PDO index, which may be due to the short period relative to decadal variability. However the ITCZ positions over the global, Atlantic and Indian Ocean are strongly related to the NAO index.
The ITCZ positions over each section are strongly influenced by local ΔT. The distinct feature is the positive correlations over the oceans and negative correlations over the land sections where ΔT shows reverse variations compared with those over oceans, the reason for this reversed relationship over two land sections is complicated. On the one hand, the seasonal cycle of temperature can be driven by precipitation variation over land sections, more clouds with more rainfall will reduce the incoming solar radiation and moisten the soil and thereby reduce the surface temperature; on the other hand, the distinct geographic characteristics may also play a role, which merits further investigation. The correlations over all ocean sections are positive and the strongest correlations occur over the eastern Pacific section (r ⩾ 0.7), followed by the Atlantic section (r ⩾ 0.5), and all three data sets show consistent correlations over these two sections.
The meridional gradient variation of the vertically integrated moist static energy has generally good agreement with the shift of the intertropical convergence zone, particularly for the seasonal climatology over Africa section. The relationship between ITCZ position and intensity varies from section to section. Both observations show consistent signs of correlation over all sections, but ERA5 data show different signs from observations over land sections, Atlantic, western and eastern Pacific. All discrepancies will be investigated in the next study.
Acknowledgments
This work was supported by the scientific research start-up grant of Guangdong Ocean University R20001 and the grant of Southern Marine Science and Engineering Guangdong Laboratory (Zhanjiang) ZJW-2019-08. Richard Allan has been supp-orted by the UK Natural Environment Research Council (NERC) SMURPHS grant NE/N006054/1 and DEEP-C grant NE/K005480/1. Chunlei Liu is also supported by University of Reading as a visiting fellow. We acknowledge the ECMWF for providing ERA5 data and the teams making the GPCP, TRMM 3B43, MEI, PDO and NAO data available. The MEI data is downloaded from www.webberweather.com/multivariate-enso-index.html, the PDO from https://ds.data.jma.go.jp/tcc/tcc/products/elnino/decadal/pdo.html and the NAO from www.ncdc.noaa.gov/teleconnections/nao/. We thank two anonymous reviewers for reviewing this paper and providing constructive comments and suggestions.
Data availability statement
The data that support the findings of this study are available upon reasonable request from the authors.