Delineation of Copper Mineralization Zones at Wadi Ham, Northern Oman Mountains, United Arab Emirates Using Multispectral Landsat 8 (OLI) Data
 Fares M. Howari1* Habes Ghrefat2 Yousef Nazzal1 Mahmoud A. Galmed2 Osman Abdelghany3 Abdel Rahman Fowler3 Manish Sharma1* Fatima AlAydaroos4 Cijo M. Xavier1
- 1College of Natural and Health Sciences, Zayed University, Abu Dhabi, United Arab Emirates
- 2Geology Department, King Saud University, Riyadh, Saudi Arabia
- 3Geology Department, United Arab Emirates University, Al Ain, United Arab Emirates
- 4UAE Space Agency, Abu Dhabi, United Arab Emirates
Copper deposits in the ultramafic rocks of the Semail ophiolite massifs is found to be enormous in the region of northern Oman Mountains, United Arab Emirates. For this study, samples of copper were gathered from 14 different sites in the investigation area and were analyzed in the laboratory using the X-ray diffraction, GER 3700 spectroradiometer, and Inductively Coupled Plasma-Mass Spectrometer. Detection and mapping of copper-bearing mineralized zones were carried out using different image processing approaches of minimum noise fraction, principal component analysis, decorrelation stretch, and band ratio which were applied on Landsat 8 (OLI) data. The spectra of malachite and azurite samples were characterized by broad absorption features in the visible and near infrared region (0.6–1.0 µm). The results obtained from the principal component analysis, minimum noise fraction, band ratio, decorrelation stretch, spectral reflectance analyses, and mineralogical and chemical analyses were found to be similar. Thus, it can be concluded that multispectral Landsat 8 data are useful in the detection iron ore deposits in arid and semi-arid regions.
Introduction
Multispectral and hyperspectral remote sensing data (Landsat 8, ASTER, AVIRIS, and Hyperion) are important in the prior phases of exploration of mineral deposits, particularly in arid and semi-arid regions. Mineral exploration and geological mapping in these environments are examined using numerous image processing techniques, such as minimum noise fraction (MNF), principal component analysis (PCA), band ratio (BR), and image classification (Rowan and Mars, 2003; Qaid et al., 2009; Ciampalini et al., 2012; Pour and Hashim, 2012; Liu et al., 2014; Son et al., 2014).
The discrimination of rock units of the Semail ophiolite and hydrothermal mineralized zones were carried out by several authors using ASTER data (e.g., Rajendran et al., 2012; Rajendran et al., 2013; Rajendran and Nasir, 2014; Rajendran and Nasir, 2015; Rajendran and Nasir, 2017). In these studies different remote sensing techniques were selected such as decorrelation stretching (DS), BR, linear spectral unmixing, and mixture tuned matched filtering. Least Square Fit, BR, and MNF were used to distinguish copper mineralization in the northern west of Iran using ASTER data (Nouri et al., 2013). Several image processing techniques such as BR, PCA, MNF, and support vector machine, were applied to ASTER and Sentinel-2A to map the Shibanjing ophiolite complex of Beishan orogenic in Inner Mongolia, China (Ge et al., 2018). Various methods of remote sensing such as BR, false color combinations, Least Square Fit, PCA, and spectral angle mapper were applied to ASTER data to identify copper alterations in Sarbishe, Iran (Shirazi et al., 2018). Fan and Wang (2020) used ASTER and IKONOS data to identify copper–lead–zinc deposits in the Heiqia area of the West Kunlun Mountains, China. The results showed that in IKONOS (band 3, 2, and 1 synthesis) images, the copper mineralization zone exhibits interlaced graywhite, blue-gray, and blue tones in a narrow strip-like pattern. The target of this study is to detect and map high economic areas of copper mineralization in the Moho transition zone in the ultramafic rocks forming the Semail massifs. Various image transform techniques, such as PCA, MNF, BR, and DS were used for analysis. Remote sensing results were validated through comparison with X-ray diffraction (XRD) analysis, field reconnaissance, and laboratory spectral measurements.
Area of Study and Geologic Setting
The Oman Mountains lie at the eastern extremity of the Arabian plate and run in a broad bend corresponding to the Gulf of Oman coastline (Figure 1). The average width of these mountains is about 75 km. These mountains reach a maximum of 130 km in the central part and rise to an elevation of about 3,000 m. Formation of the Oman Mountains can be credited to two principle orogenic events, namely the Late cretaceous and the mid-Tertiary. The former resulted from the Late cretaceous (Coniacian-Maastrichtian) obduction of the Semail ophiolite and the related sedimentary and volcanic rocks (Sumeini, Hawasina, and Haybi groups) onto the eastern edge of the Arabian platform (Glennie et al., 1973; Coleman and Hopson, 1981; Lippard et al., 1986; Nolan et al., 1986; Boote et al., 1990; Robertson et al., 1990; Searle et al., 2004; Warren et al., 2005). The latter happened in the Late Eocene-Miocene and was the main reason for the formation of foreland folds (Warrak, 1996) and the folding of Maastrichtian–Tertiary neoautochthonous units in the foredeep (Boote et al., 1990). The neoautochthonous sequence and the underlying ophiolite and allochthonous units were deformed due to post-obduction pressure, resulting in belts of thrust faults and folds along the western front of the Oman Mountains.
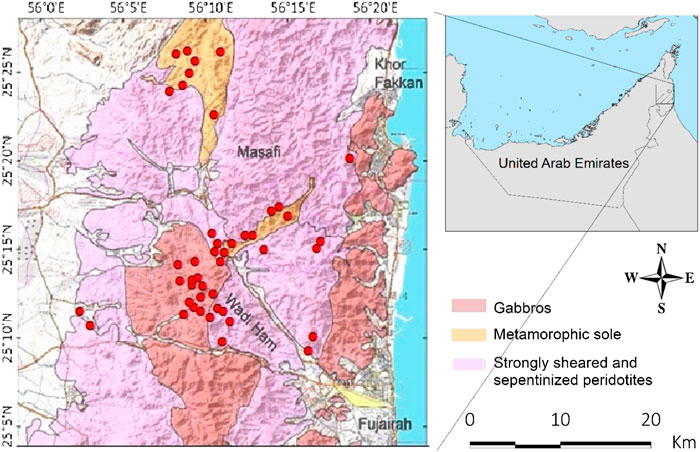
FIGURE 1. Geological and location map of the Wadi Ham area. The locations of copper occurrence are shown in red circles.
The area of study is located along Wadi Ham (Figure 1) in the Northern Oman Mountains, United Arab Emirates, which is an area consisting of Semail ophiolite. The Wadi Ham zone is a narrow NW-SE trending valley within the Semail ophiolite. The rocks exposed along Wadi Ham include the metamorphic sole of the Semail ophiolite.
The southern ophiolite zone extends south from Wadi Ham to Wadi Hatta (Figure 2). The ophiolite complex is divided into two units: The mantle sequence and the crustal sequence, which consist of the cumulus and non-cumulus. This zone comprises a sequence of complex north-trending belts whose composition becomes more basic from east to west.
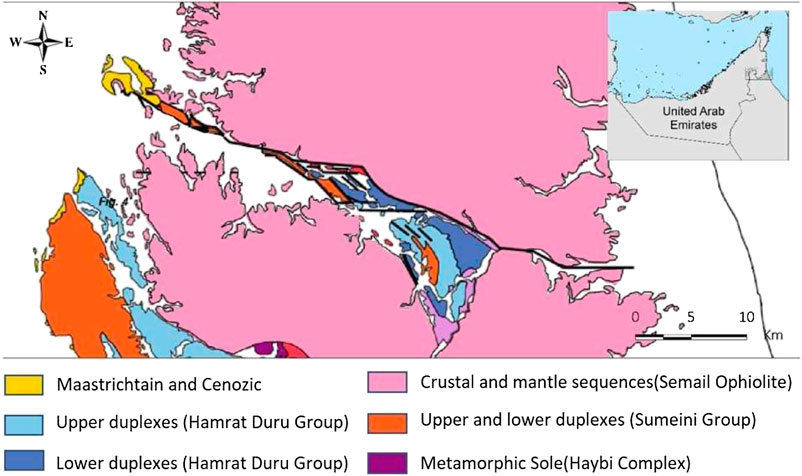
FIGURE 2. Modified geological map of the Hatta region, updated after Glennie et al. (1974).
The layers of rock in the southern zone, which constitute the ophiolite suite, typically shows a dip in the eastern and eastern-northeast dip, though numerous changes occur locally in the region. There is little evidence of small-scale folding and minor fractures, other than those with north-westerly trends that show no preferred orientation.
The major fractures rule the origin and the trends of many of the larger Wadis, those are Wadi Mudayq and Wadi Munayi, trend north-west to north-north-west and is roughly parallel to the Wadi Ham zone. The principal copper mineralized zones occur in these Wadis and has similar trend.
A difference in outcrop patterns of the main units is also apparent on either side of Wadi Ham. In the south, the gabbro units enclose areas of ultrabasic rocks, which are commonly bounded, at least in part, by faulting. It is considered that the contact between these two units is undulating, but essentially flat lying. Many of the enclosed areas of ultramafics form windows created during erosion of the overlying gabbro units. The area that is north of Wadi Ham shows different outcrop patterns, which may be related to a deeper erosion level. Here, it is envisaged that the area of flat-lying contact zone between the two units, which corresponds to the area that is south of Wadi Ham, has been removed.
In the study area, the alteration processes that aided the developing of copper mineralization at Wadi Ham are widely varied in composition and type. Such as mineralization, some features of sulfurization and epidotization predominate, grading outwards into a zone of secondary Cu-mineralization (dominated by Malachite and Mn minerals). Certain processed are well developed in the outer zones, such as carbonization and the production of secondary iron oxides. The zone of secondary Cu-Mn oxides is characterized by the development of hydrated oxides of Cu and Mn. This zone is remarkable as there is a drastic increase in the abundance of Cu, Mg, Zn, and Ni. On the contrary, there is a decrease in the amount of Al and trace metals, including Sr and V. This indicates the destruction of feldspar mineral from the original rock and the build-up of new secondary oxide minerals. The gossan zone is characterized by remarkable reddish-brown colors of hematite and limonite. This zone is particularly developed at the roof and also on sides of the orebody. The wide gossan zone is the outermost alteration zone of Cu mineralization in Wadi Ham due to the high mobility and abundance of Fe in the secondary environment. The zone is characterized by a remarkable increase in Cu, MgO, V, Zn, and Ni. This indicates that most of the Fe and its associated elements are derived from the alteration of pyrite and other sulfide minerals together with mafic minerals, such as pyroxene and amphiboles. The gossan zone is remarkably depleted in alumina, thereby demonstrating the decomposition of feldspar from the original parent rock and its mobility.
The copper mineralization along Wadi Hamm, south of Masafi (location shown on Figure 13) is one of more than 120 known occurrences of copper mineralization in the United Arab Emirates, all located in the mountain areas between Dibba and Kalba. In the Wadi Hamm occurrence the main ore is a 50–60 m long thin massive sulfide lens extending north and dipping steeply. This ore body is not evident at the surface but has been proved by drilling and geophysical survey (Robins et al., 2006). The ore body is controlled by two NW-trending shear zones of the Wadi Hamm Fault. The mineralization is located at the intersection of these shears with high temperature metamorphic rocks including calc-silicate gneisses, amphibolite and gneissic quartzites. The primary ores consist of chalcopyrite, pyrite and pyrrhotite, associated with quartz gangue, forming mineralized veins and stockworks at surface exposures (Robins et al., 2006). The deposit was investigated by Hunting Geology and Geophysics Limited (1983) and found to be sub-economic with estimated reserves of about 1,000 T Cu. The grade is low, typically 1% Cu in the sulfide-bearing rocks and reaching 7% Cu in selected samples.
It was originally supposed that the deposit was a Cyrus-type volcanic exhalative, however, detailed mapping has shown it to be a hydrothermal deposit of probable metamorphic origins. The original disseminated sulfides have been oxidized to form a limonitic gossan with copper carbonate and minor manganese oxides remobilized in the weathering zone.
The structure of the deposit is shown in Figure 3 from Hunting Geology and Geophysics Limited (1983), which was redrawn by Robins et al. (2006). The figure shows that the disseminated sulfides bodies form lenses and irregular bodies within the schist and calc-silicate rock.
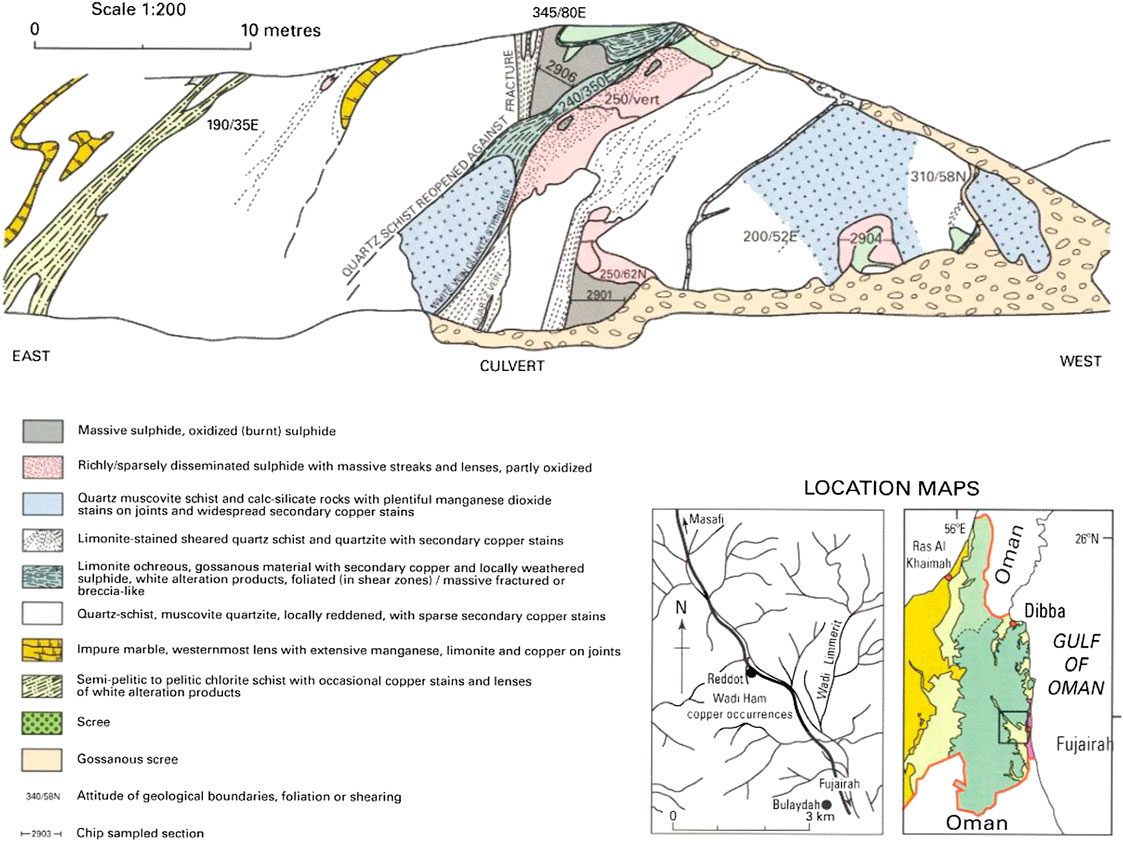
FIGURE 3. Detail of the Wadi Ham copper occurrence, which is looking toward the north in figure. [From Hunting Geology and Geophysics Limited (1983), redrawn by Robins et al. (2006).]
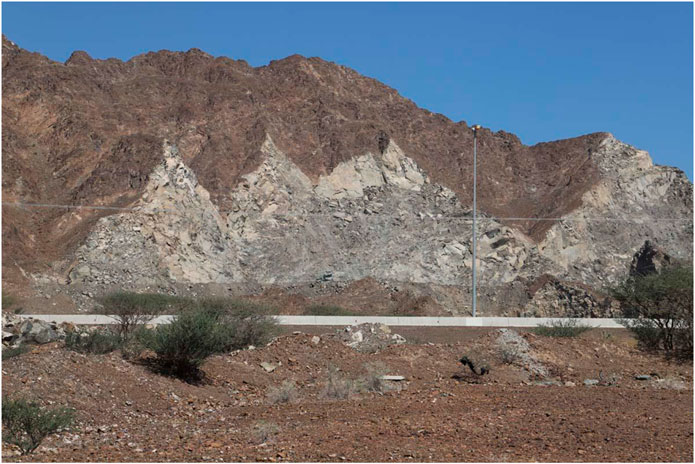
FIGURE 4. Freshly exposed serpentinized peridotite of the Semail Ophiolite in an abandoned quarry along the Hatta Road. The serpentinized peridotite is pale to dark green in the unweathered state. It becomes characteristically dark brown when weathered.
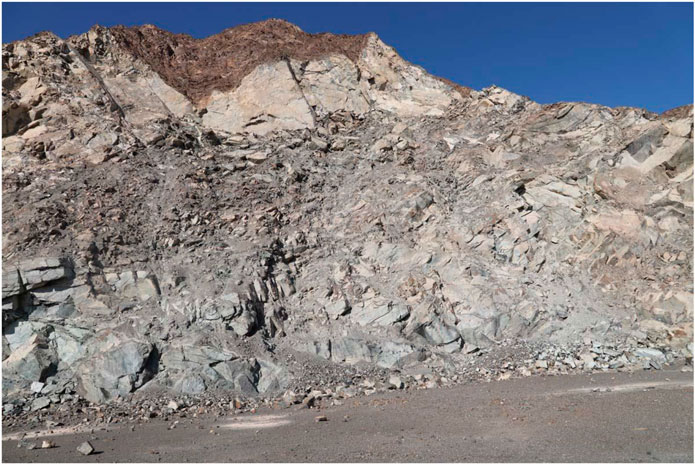
FIGURE 5. It is very similar to one above. It shows the freshly exposed unweathered serpentinized peridotite in more detail. It also shows intense fracture zones, some of which are joints, others are spaced faults and narrow ductile shears. Some of the close spaced fracture sets are related to the quarrying process.
Materials and Methods
Spectral Properties of Landsat 8 Data
On 4th February, 2013, Landsat-8 was launched from Vandenberg Air Force Base, California. Landsat 8 image comprises of 11 spectral channels; five in the visible and near-infrared (VNIR) region, two in the thermal infrared region, two in the shortwave infrared red region, and one panchromatic channel (band 8) (Roy et al., 2014). The spatial resolutions of these bands vary from 15 to 100 m (Table 1). Two additional bands, which represent the difference between Landsat 7 ETM+ and Landsat 8 are shortwave-infrared cirrus band and deep blue coastal/aerosol band.
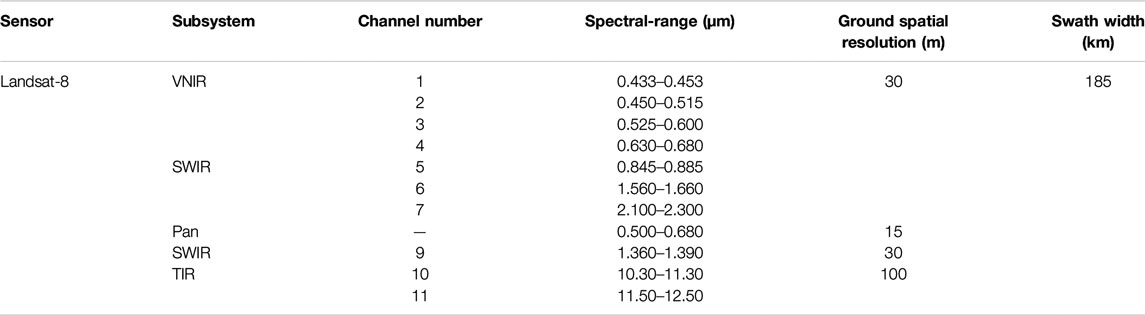
TABLE 1. Spectral characteristics of remote sensing data used in this study.
Image Preprocessing of Landsat 8 Data
Data processed in the present study is of L1T type—Landsat 8 (OLI), which were acquired on December 20, 2017. The Landsat 8 L1T data processing included systematic geometric correction, radiometric calibration, precision correction assisted by ground control chips, and the use of a digital elevation model to correct parallax error due to local topographic relief (Lee et al., 2014). ENVI 5.1 (the Environment for Visualizing Images) software is used for processing the Landsat 8 data.
The Quick Atmospheric Correction method (ITT 2009) is performed here for calibration of Landsat 8 L1T data to reflectance data. Red–Green–Blue (RGB) color combination images were primarily selected on the basis of the reflectance spectra of dominant rock types in the study area (Cloutis et al., 1986; Crosta and Moore, 1989; Evans and Hill, 1990).
Image Processing
PCA used the principal components transformation technique to reduce dimensionality of the correlated multispectral data. Investigation was based on multivariate statistical techniques that chose uncorrelated linear combinations (eigenvector loadings) of variables such that each successively extracted linear combination, or principal component, had a smaller variance (Singh and Harrison, 1985). MNF transformation is a data reduction method designed to increase apparent signal-to-noise by calculating noise statistics from the data, and segregating it to higher order eigen channels, while still retaining much of the original signal (Green et al., 1988).
The MNF transformation is same as PCA transformation, except the fact that MNF considers the noise separately from the noise, whereas PCA considers the overall data variation using a single covariance matrix (Smith et al., 1985; Richards, 1994). Generally, the signal which is a high information content, is concentrated in the lower order eigenchannels, whereas the noisy bands are concentrated in the higher order eigenchannels.
BR is used to display the spectral variations (Goetz et al., 1983; Shalaby et al., 2010) by dividing the brightness values (digital numbers, DN) at peaks/maxima and troughs/minima in a reflectance curve, after removing the atmospheric affects (Jensen, 1996; Vincet, 1997). DS is used to enhance (stretch) the color differences found in a color image. It also includes the removal of inter-channel correlation found in the input pixels (Alley, 1996). This method requires three bands for input, which should be stretched byte data or may be selected from an open color display.
Field Verification and Spectral Measurement
Azurite and malachite samples were collected from 14 different sites in the study area (Figure 7). A photograph was taken for each sample, and the geographic coordinates of each locality were noted using the GPSMAP 276C. All the powder samples were analyzed for mineralogy using XRD. The chemical analysis of the collected samples was carried out using the ICP-MS, and included the analysis of Br, Cd, Cu, K, Mn, Ni, and Pb.
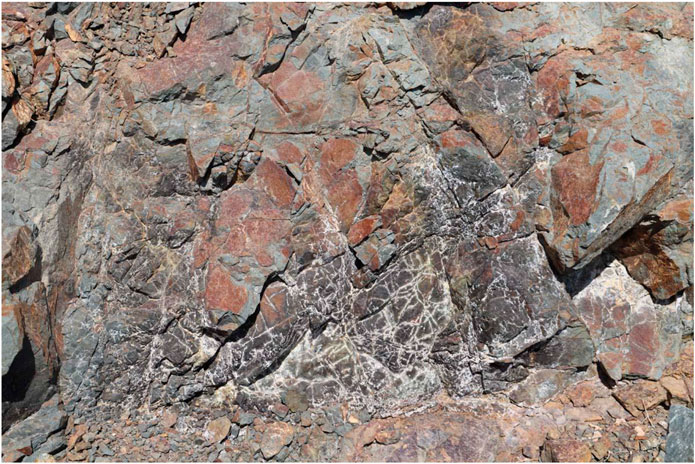
FIGURE 6. A close-up view of the serpentinized peridotite showing natural fracture sets. There are black manganese oxide stains and brown ferric hydroxide fracture coating related to minor weathering. There are also white carbonate and sulfate encrustations along minor fractures related to groundwater evaporation in the arid climate conditions.
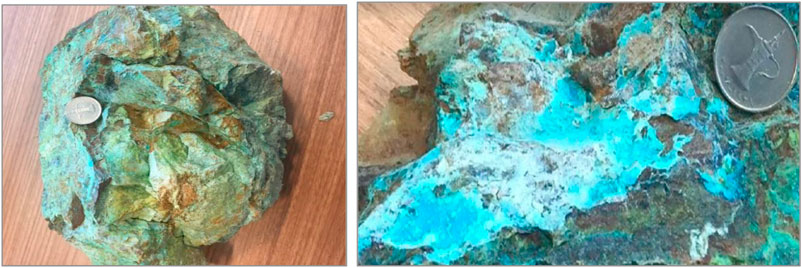
FIGURE 7. Photographs of malachite and azurite.
Reflectance spectra derived in Laboratory in the visible to shortwave infrared region of the electromagnetic spectrum (0.4–2.5 µm) were measured for all the collected azurite and malachite samples using a GER 3700 spectrometer (Geophysical and Environmental Research Corporation 1999). GER 3700 spectrometer measurements require an outer light source with a distance of approximately 25 cm between the sensor and sample. The source of illumination was a halogen lamp 500 W, which was set at around 45°. The spectrometer sensor position was located vertically above the sample. The instrument had 640 channels between 315 and 2,519 nm with spectral sampling between 1.5 and 12 nm. The ground field of view was approximately 100 cm2. GER 3700 spectrometer has been selected in this study because of its very fast scan time (50 ms and up) and the relatively small weight of the optics head (approx. 10 kg). This instrument can be operated in a helicopter as well as mounted on the goniometer or on a normal tripod in the field. The instrument is calibrated using a reflectance standard (Spectralon panel) made from polytetrafluoroethylene. The standard is a white reflecting material and has been selected because of its qualities in spatial and spectral uniformity and stability with time.
Results and Discussion
Mineralogical and Geochemical Analyses
The XRD results tells that the gathered samples were mainly composed of azurite and malachite (Figures 8, 9). Table summarizes the chemical analysis of the studied samples. The results demonstrated that copper concentrations in the collected azurite and malachite samples were 322,975 and 691,775 mg/kg, respectively. The azurite samples were dominated by Cu, Mn, K, and Cr, whereas Cu, K, Cd, and Mn dominated the malachite samples (Table 2).
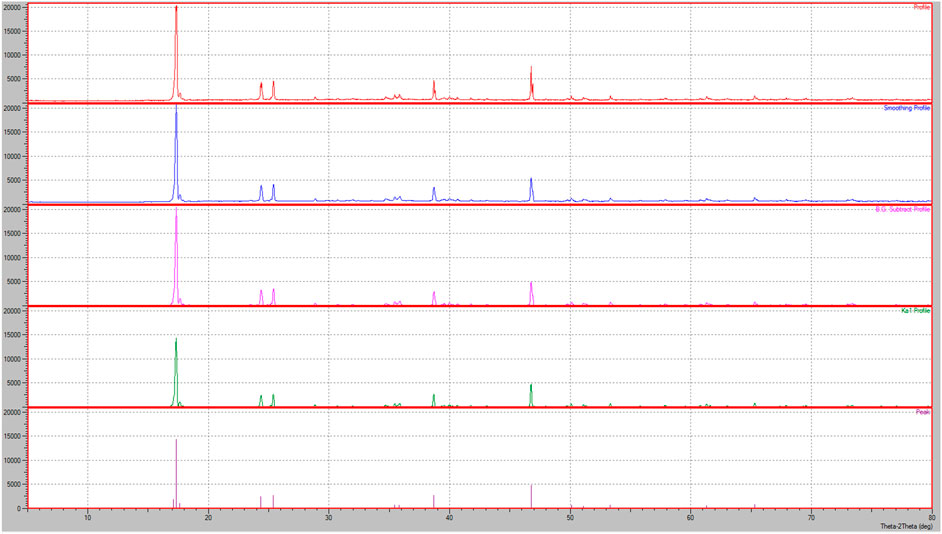
FIGURE 8. Azurite sample diffractogram.
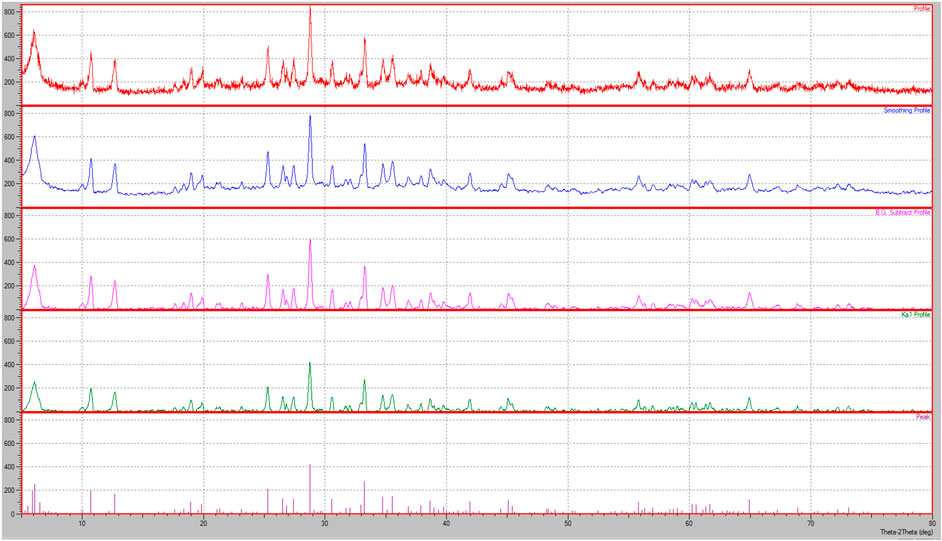
FIGURE 9. Malachite sample diffractogram.
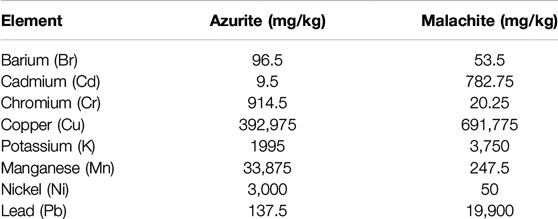
TABLE 2. Heavy metal analysis for the collected azurite and malachite samples.
Interpretation of the Spectral Measurements
The laboratory spectra investigated from the gathered samples that were measured using the GER 3700 spectroradiometer are shown in Figure 10. Figure 11 shows the United States Geological Survey (Clark, 1999) spectral reflectance curves of selected iron, sulfur, and copper-containing minerals (e.g., hematite, pyrite, chalcopyrite, azurite, and malachite). Hematite showed intervalence charge transfer and Fe3+ crystal field bands in the VNIR wavelength range. The absorption features located at about 0.53, 0.63, and 0.88 µm distinguished the spectrum of hematite.
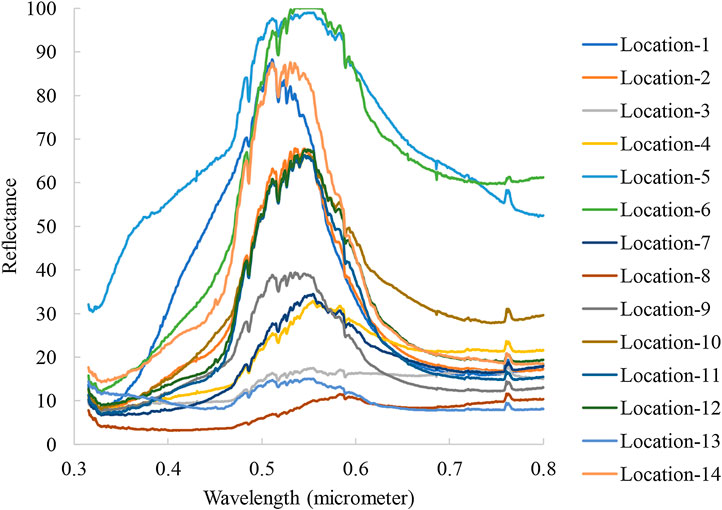
FIGURE 10. Reflectance spectra of the collected samples.
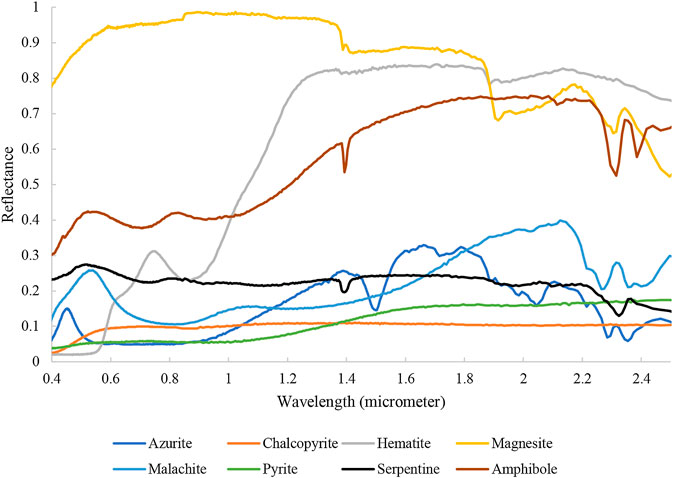
FIGURE 11. United States Geological Survey spectral reflectance curves of selected iron, sulfur, copper minerals (Clark, 1999).

FIGURE 12. Lithology and main geological features in study area.
According to Abrams et al. (1988), the spectrum of serpentine shows a relatively flat spectral response. The reflectance spectra of serpentines show a characteristic absorption peak at 2.3 µm as a result of vibrational processes of Mg-OH bond (Rajendran and Nasir, 2014). In addition, according to the spectral features of serpentine minerals displayed in Figure 6, there is an absorption feature located at 1.4 µm due to OH. The VNIR reflectance spectra of azurite and malachite exhibited a characteristic spectral signature, showing blue and green peaks at around 0.54 and 0.4 μm, respectively. A broad absorption feature in the range of 0.6–1.0 μm characterized the spectra of malachite and azurite. The spectra also displayed absorption features at 2.3 μm due to the presence of CO (Glennie et al., 1973). The most important absorption features on igneous rock surfaces were due to the presence of Mg–OH and Al–OH in clays, micas, serpentine, and amphiboles. Absorptions produced around 2.2 μm is due to Al–OH, whereas Mg–OH produced features at about 2.3 μm. There were features in the infrared region due to vibrations within molecular water (Hunt et al., 1971; Hunt, 1977; Hunt and Ashley, 1979; Rajendran et al., 2011).
Mineralization: Delineation and Mapping
The bands 7–4–2 Landsat 8 image (Figure 13) was selected in order to highlight geological features of the study area. Generally, these color-combinations show little color variation corresponding to serpentinized peridotite, gabbro, and metamorphic sole.
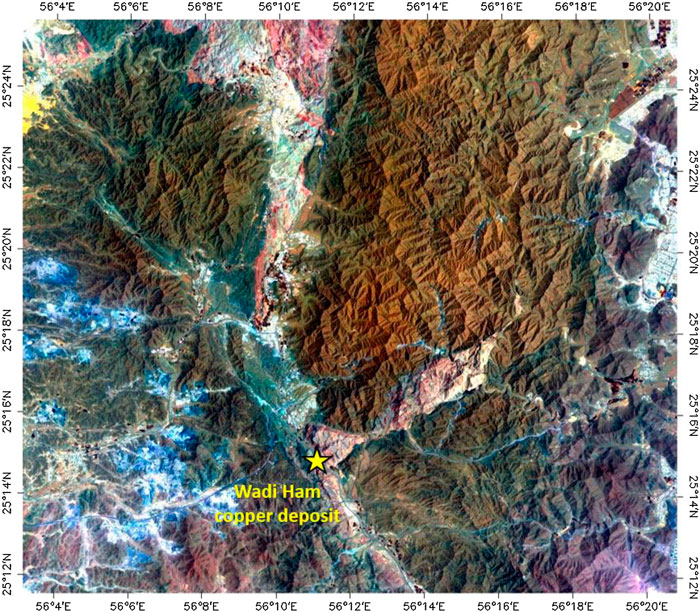
FIGURE 13. Red–Green–Blue (RGB) (R: 7, G: 4, B: 2) composite image of the study area. The metamorphic sole is represented by the light pixels, where the dark pixels represent gabbro and peridotite rocks. The geographic reference for the location of the Wadi Hamm copper occurrence is 417,984 and 2,792,388.
Spatially coherent information is clearly indicated in PC1, PC2, PC3, PC4, and PC6. PCA bands 1, 2, and 3 in RGB with respect to the studied region are shown in Figure 14. The gabbro, serpentinized peridotite, gabbro, and metamorphic sole present in the investigation area are discriminated using false color PCA composite image. Copper zones are mainly associated with peridotite and gabbro rocks. Some copper is found in the metamorphic sole. MNF results showed that MNF1, MNF2, MNF3, MNF4, and MNF5 contain most of the spatially coherent information. Figure 15 shows MNF band 2 with respect to the study area. Metamorphic sole is shown in white pixels, while gabbro and serpentinized peridotite rocks exhibit dark colors.
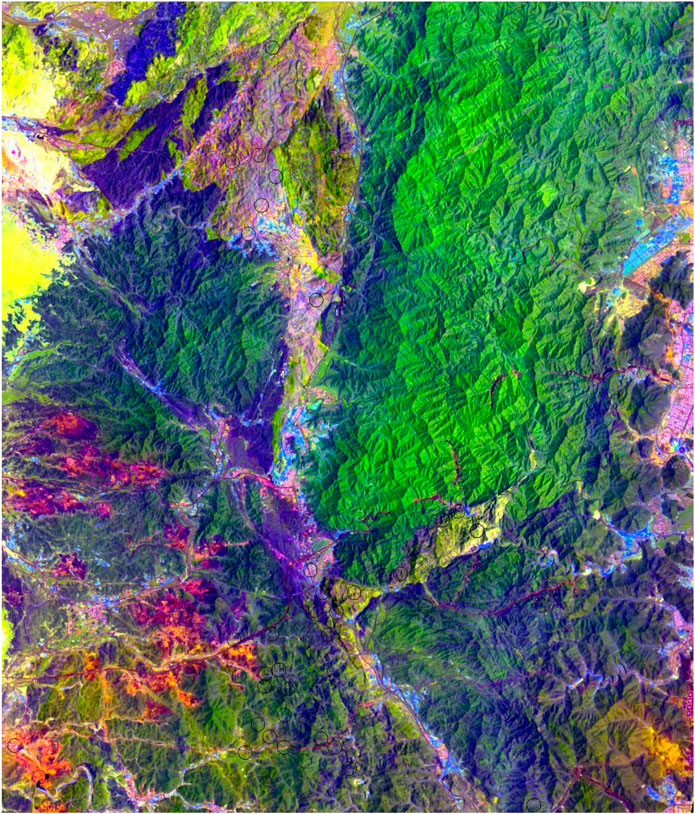
FIGURE 14. False color composite images of principal components PC1, PC2, PC3 displayed in R-G-B for the study area. The dark purple colors pixels represent gabbro, peridotite is displayed in green colors, and metamorphic sole is shown in yellowish green. The locations of copper is shown in black circles.
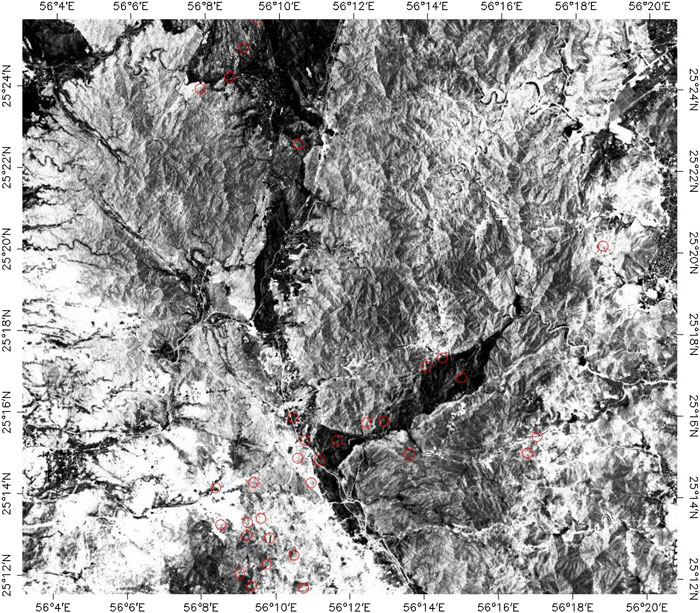
FIGURE 15. Image of MNF2 for the study area. Metamorphic sole is shown in white pixels, while gabbro and serpentinized peridotite rocks exhibit dark colors. The locations of copper is shown in red circles.
The whitest zones in the 7/6 BR image represented the distribution of metamorphic sole in the examined area (Figure 16), while the dark pixels represent peridotite and gabbro. A decorrelation-stretched image of the study area is shown in Figure 17 (R: band 7, G: band 6, B: band 2). In this image, red color corresponds to metamorphic sole, green to serpentinized peridotite rocks, and pinkish blue to gabbro. The lithology of ophiolite is well recognized and separated using the decorrelation-stretched image.
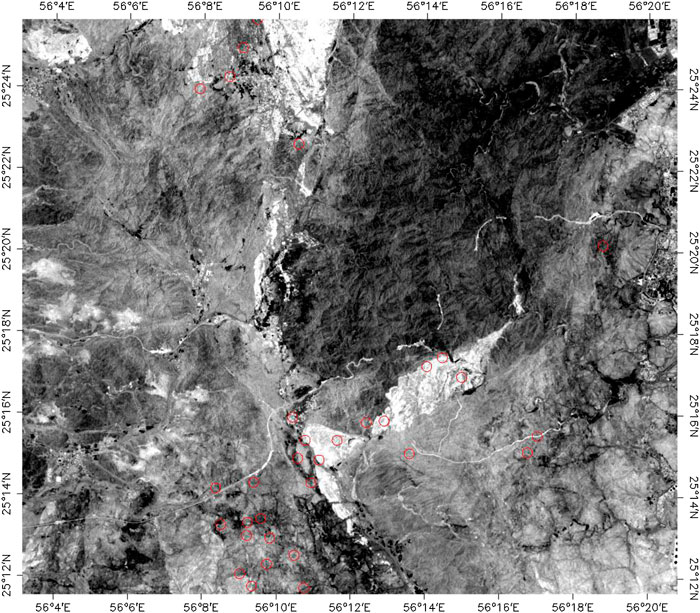
FIGURE 16. Ratio image of band 7/6 of the study area. The metamorphic sole is displayed in white pixels. The locations of copper is shown in red circles.
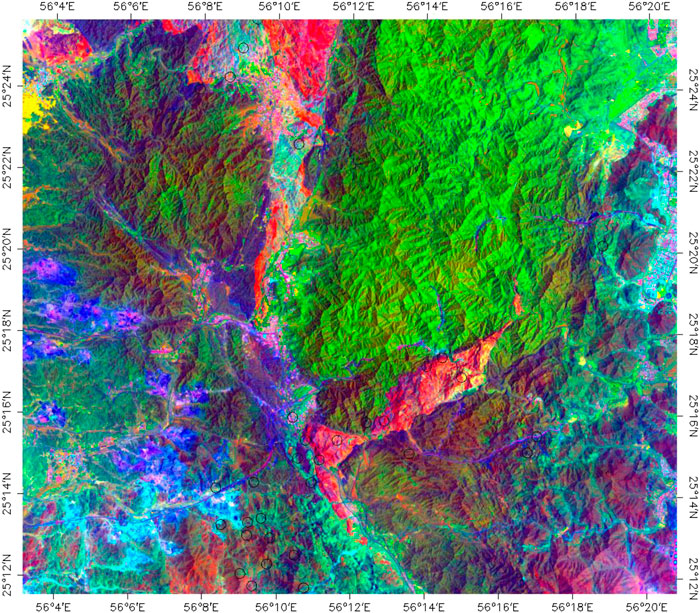
FIGURE 17. False color composite images of decorrelation stretching of band combination 7:6:2 displayed in RGB for the study area. The pinkish blue pixels represent metamorphic sole, while copper mineralization zones are displayed in the green color. The locations of copper is shown in black circles.
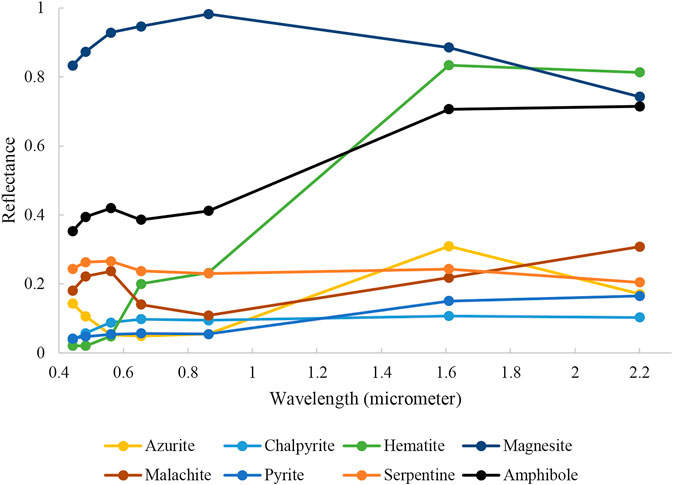
FIGURE 18. Spectral plot of convolved laboratory measured spectrum of selected minerals.
The mineralization maps of copper obtained from MNF, PCA, BR, and DS were verified on the ground through field work and were compared with the published geological map of the study area (Figure 19). A good correspondence was observed among the transform techniques, field data, and geologic maps. New copper mineralization zones in the study area were clearly observed using these remote sensing methods.
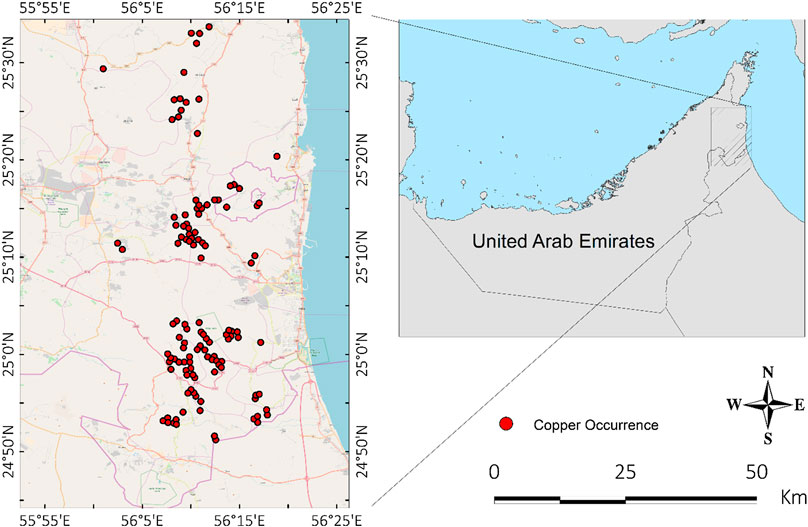
FIGURE 19. Copper occurrence map in the United Arab Emirates. The ultramafic rocks are in shades of purple, layered gabbros in pale green, younger gabbros in dark green, and higher-level gabbros in pale green and sheeted dykes in mid-green.
Conclusions
Present study revealed the usefulness of the multispectral Landsat 8 (OLI) data (0.4–2.5 µm) with respect to the detection and mapping of copper mineralization zones. Targeting mineral resources over large arid and semi-arid environments can be achieved using multispectral Landsat 8 data. In the present study, various image transforms techniques, including PCA (bands PC1, PC2, PC3), MNF (band MNF2), BR (7/6), and decorrelation stretch (bands 7, 6, 2) were used to reveal useful spectral information. The arid environment facilitated the use of remote sensing techniques for mineral exploration in the study area. The results of the various methods used in the study area provided interesting perspectives on the possibility of detecting new exploitable copper deposits in arid and semi-arid environments. Future work concerns with the drone hyperspectral remote sensing exploration for delineation of mineralization zones and economic exploration of minerals.
Data Availability Statement
The raw data supporting the conclusions of this article will be made available by the authors, without undue reservation.
Author Contributions
FH: Supervision, Writing. HG, YN, and MG: Conceptualization, Methodology and Resources. OA, ARF, MS, and CX: Software, Validation and Investigation. FAA: Funding acquisition.
Funding
The author would like to extend our thanks and appreciation to UAE Space Agency for funding this research Z01-2016-001.
Conflict of Interest
The authors declare that the research was conducted in the absence of any commercial or financial relationships that could be construed as a potential conflict of interest.
References
Abrams, M. J., Rothery, D. A., and Pontual, A. (1988). Mapping in the Oman ophiolite using enhanced landsat thematic mapper images. Tectonophysics 151, 387–401. doi:10.1016/0040-1951(88)90254-5
Boote, D. R. D., Mou, D., and White, R. I. (1990). “Structural evolution of the Suneinah Foreland, central Oman Mountains,” in The geology and tectonics of the Oman region. Editors A. H. F. Robertson, M. P. Searle, and A. C. Ries (London, UK: Geological Society, Special Publication), 49, 397–418.
Ciampalini, A., Garfagnoli, F., Antonielli, B., Del Ventisette, C., and Moretti, S. (2012). Photo-lithological map of the southern flank of the Tindouf Basin (Western Sahara). J. Maps 8 (4), 453–464. doi:10.1080/17445647.2012.746947
Ciampalini, A., Garfagnoli, F., Antonielli, B., Moretti, S., and Righini, G. (2013). Remote sensing techniques using Landsat ETM+ applied to the detection of iron ore deposits in western Africa. Arab. J. Geosci. 6, 4529–4546. doi:10.1007/s12517-012-0725-0
Clark, R. N. (1999). “Chapter 1: spectroscopy of rocks and minerals, and principles of spectroscopy,” in Manual of remote sensing. Editor A. N. Rencz (New York, NY: John Wiley and Sons), Vol. 3, 3–58.
Cloutis, E. A., Gaffey, M. J., Jackowski, T. L., and Reed, K. L. (1986). Calibrations of phase abundance, composition, and particle size distribution for olivine-orthopyroxene mixtures from reflectance spectra. J. Geophys. Res. 91, 11641–11653. doi:10.1029/jb091ib11p11641
Coleman, R. G., and Hopson, C. A. (1981). Introduction to the Oman ophiolite special issue. J. Geophys. Res. 86, 2495–2496. doi:10.1029/jb086ib04p02495
Crosta, A. P., and Moore, J. M. (1989). “Enhancement of Landsat thematic mapper imagery for residual soil mapping in SW Minais Gerais State, Brazil a prospecting case history in Greenstone belt terrain,” in Proceedings of 7th ERIM thematic conference: remote sensing for exploration geology, Calgary, CA, October 2–6, 1989, 1173–1187.
Evans, D. L., and Hill, J. M. (1990). Landsat TM versus MSS data for forest type identification. Geocarto Int. 5 (3), 13–20. doi:10.1080/10106049009354264
Fan, Y., and Wang, H. (2020). Application of remote sensing to identify copper–lead–zinc deposits in the Heiqia area of the west Kunlun Mountains, Chinas. Sci. Rep. 10, 12309. doi:10.1038/s41598-020-68464-7
Ge, W., Cheng, Q., Jing, L., Armenakis, C., and Ding, H. (2018). Lithological discrimination using ASTER and sentinel-2A in the Shibanjing ophiolite complex of Beishan orogenic in inner Mongolia, China. Adv. Space Res. 62 (7), 1702–1716. doi:10.1016/j.asr.2018.06.036
Glennie, K. W., Boeuf, M. G., Hughes-Clarke, M. H. W., Moody-Stuart, M., Pilaar, W. F., and Reinhardt, B. (1973). Late Cretaceous nappes in the Oman mountains and their geologic evolution. Bull. Am. Assoc. Petrol. Geol. 57, 5–27.
Glennie, K. W., Boeuf, M. G., Hughes-Clarke, M. H. W., Moody-Stuart, M., Pilaar, W. F., and Reinhardt, B. (1974). Geology of the Oman mountains. The Hague, Netherlands: Verhandelingen Koninklijk Nederlands Geolo-Gisch Mijnbouwkundidg Genootschap, Vol. 31.
Goetz, A. F. H., Rock, B. N., and Rowan, L. C. (1983). Remote sensing for exploration; an overview. Econ. Geol. 78, 573–590. doi:10.2113/gsecongeo.78.4.573
Green, A. A., Berman, M., Switzer, P., and Craig, M. D. (1988). A transformation for ordering multispectral data in terms of image quality with implications for noise removal. IEEE Trans. Geosci. Remote Sens. 26 (1), 65–74. doi:10.1109/36.3001
Hunt, G. R. (1977). Spectral signatures of particulate minerals in the visible and near infrared. Geophysics 42, 501–513. doi:10.1190/1.1440721
Hunt, G. R., and Ashley, R. P. (1979). Spectra of altered rocks in the visible and near infrared. Econ. Geol. 74, 1613–1629. doi:10.2113/gsecongeo.74.7.1613
Hunt, G. R., Salisbury, J. W., and Lenhoff, C. J. (1971). Visible and near-infrared spectra of minerals and rocks. IV. Sulphides and sulphates. Mod. Geol. 3, 1–4.
Hunting Geology and Geophysics Limited (1983). Investigation of copper and chromite prospects 1982–83. Wadi Ham copper prospect. Hunting Geology and Geophysics Limited for Ministry of Petroleum and Mineral Resources, Vol. 4.
Jensen, J. R. (1996). Introduction digital image processing: a remote sensing perspective. 2nd Edn. New York, NY: Prentice Hall.
Lee, D. S., Storey, J. C., Choate, M. J., and Hayes, R. W. (2014). Four years of Lansat-7 on- orbit geometric calibration and performance. IEEE Trans. Geosci. Remote Sens. 42 (12), 2786–2795. doi:10.1109/TGRS.2004.836769
Lippard, S. J., Shelton, A. W., and Gass, I. G. (1986). “Geological society memoir no. 11,” in The ophiolite of northern Oman. London, UK: Blackwell Scientific Publications, 178.
Liu, G., Zhang, L., Zhang, Q., Musyimi, Z., and Jiang, Q. (2014). Spatio-temporal dynamics of wetland landscape patterns based on remote sensing in Yellow River Delta, China. Wetlands 34, 787–801. doi:10.1007/s13157-014-0542-1
Nolan, S. C., Clissold, B. P., Smewing, J. D., and Skelton, P. W. (1986). “Late campanian to tertiary paleogeography of the central and northern Oman mountains,” in Symposium on the hydrocarbon potential of intense thrust zones. Kuwait, Abu Dhabi: Ministry of Petroleum and Mineral Resources, UAE and OPEC, 175–200.
Nouri, R., Jafari, M., Arian, M., Feizi, F., and Afzal, P. (2013). Prospection for copper mineralization with contribution of remote sensing, geochemical and mineralographical data in abhar 1:100,000 sheet, Nw Iran/poszukiwania zasobów rud miedzi z zastosowaniem zdalnych technik wykorzystujących dane geochemiczne I mineralogiczne w pokładzie geologicznym Abhar 1:100,000 w północno-zachodnim Iranie. Arch. Min. Sci. 58 (4), 1071–1084. doi:10.2478/amsc-2013-0074
Pour, A. B., and Hashim, M. (2012). The application of ASTER remote sensing data to porphyry copper and epithermal gold deposits. Ore Geol. Rev. 44, 1–9. doi:10.1016/j.oregeorev.2011.09.009
Qaid, A. M., Basavarajappa, H. T., and Rajendran, S. (2009). Integration of VNIR and SWIR spectral reflectance for mapping mineral resources; a case study, north east of Hajjah, Yemen. J. Indian Soc. Remote Sens. 37, 305–315. doi:10.1007/s12524-009-0025-7
Rajendran, S., Al-Khirbash, S., Pracejus, B., Nasir, S., Al-Abri, A. H., Kusky, T. M., et al. (2012). ASTER detection of chromite bearing mineralized zones in Semail Ophiolite Massifs of the northern Oman Mountains: exploration strategy. Ore. Geol. Rev. 44, 121–135. doi:10.1016/j.oregeorev.2011.09.010
Rajendran, S., and Nasir, S. (2017). Characterization of ASTER spectral bands for mapping of alteration zones of volcanogenic massive sulphide deposits. Ore. Geol. Rev. 88, 317–335. doi:10.1016/j.oregeorev.2017.04.016
Rajendran, S., and Nasir, S. (2014). Hydrothermal altered serpentinized zone and a study of Ni-magnesioferrite-magnetite-awaruite occurrences in Wadi Hibi, northern Oman Mountain: discrimination through ASTER mapping. Ore. Geol. Rev. 62, 211–226. doi:10.1016/j.oregeorev.2014.03.016
Rajendran, S., Nasir, S., Kusky, T. M., Ghulam, A., Gabr, S., and El-Ghali, M. A. K. (2013). Detection of hydrothermal mineralized zones associated with listwaenites in central Oman using ASTER data. Ore. Geol. Rev. 53, 470–488. doi:10.1016/j.oregeorev.2013.02.008
Rajendran, S., and Nasir, S. (2015). Mapping of high pressure metamorphics in the As Sifah region, NE Oman using ASTER data. Adv. Space Res. 55 (4), 1134–1157. doi:10.1016/j.asr.2014.11.026
Rajendran, S., Thirunavukkarasu, A., Balamurugan, G., and Shankar, K. (2011). Discrimination of iron ore deposits of granulite terrain of southern peninsular India using ASTER data. J. Asian Earth Sci. 41, 99–106. doi:10.1016/j.jseaes.2011.01.004
Richards, J. A. (1994). Remote sensing digital image analysis: an introduction. New York,NY: Springer-Verlag, 271–275.
Robertson, A. H. F., Kemp, A. E. S., Rex, D. C., and Blome, C. D. (1990). “Sedimentary and structural evolution of a continental transform lineament: the Hatta zone, northern Oman Mountains,” in The geology and tectonics of the Oman region. Editors A. F. H. Robertson, M. P. Searle, and A. C. Ries (London,UK: Geological Society of London, Special Publication), 49, 285–305.
Robins, N. S., Benham, A. J., and Mitchell, C. J. (2006). The geology and Geophysics of the United Arab Emirates. Economic geology and hydrogeology. Keyworth, Nottingham: British Geological Survey, Vol. 3.
Rowan, L. C., and Mars, J. C. (2003). Lithologic mapping in the Mountain Pass, California area using advanced spaceborne thermal emission and reflection radiometer (ASTER) data. Remote Sens. Environ. 84 (3), 350–366. doi:10.1016/s0034-4257(02)00127-x
Roy, D. P., Wulder, M. A., Loveland, T. R., Woodcock, C. E., Allen, R. G., Anderson, M. C., et al. (2014). Landsat-8: science and product vision for terrestrial global change research. Remote Sens. Environ. 145, 154–172. doi:10.1016/j.rse.2014.01.009
Searle, M. P., Warren, C. J., Waters, D. J., and Parrish, R. R. (2004). Structural evolution, metamorphism and restoration of the Arabian continental margin, Saih Hatat region, Oman Mountains. J. Struct. Geol. 26, 451–473. doi:10.1016/j.jsg.2003.08.005
Shalaby, M., Bishta, A., Roz, M., and El-Zalaky, M. (2010). Integration of geologic and remote sensing studies for the discovery of uranium mineralization in some granite plutons, Eastern Desert, Egypt. J. King Abdulaziz Univ. Earth Sci. 21, 1–25. doi:10.4197/ear.21-1.1
Shirazi, A., Shirazy, A., and Karami, J. (2018). Remote sensing to identify copper alterations and promising regions, Srbishe, South Khorasan, Iran. Int. J. Geol. Earth Sci. 4 (2), 36–52. doi:10.18178/ijges
Singh, A., and Harrison, A. (1985). Standardized principal components. Int. J. Remote Sens. 6, 883–896. doi:10.1080/01431168508948511
Smith, M. O., Johnson, P. E., and Adams, J. B. (1985). Quantitative determination of mineral types and abundances from reflectance spectra using principal components analysis. J. Geophys. Res. 90, 792–804. doi:10.1029/jb090is02p0c797
Son, Y.-S., Kang, M.-K., and Yoon, W.-J. (2014). Lithological and mineralogical survey of the Oyu Tolgoi region, southeastern Gobi, Mongolia using ASTER reflectance and emissivity data. Int. J. Appl. Earth Obs. Geoinf. 26, 205–216. doi:10.1016/j.jag.2013.07.004
Vincent, R. K. (1997). Fundamentals of geological and environmental remote sensing. Upper Saddle River, NJ: Prentice-Hall.
Warrak, M. (1996). Origin of the hafit structure: implications for timing the tertiary deformation in the northern Oman mountains. J. Struct. Geol. 18, 803–818. doi:10.1016/s0191-8141(96)80014-9
Keywords: copper, Landsat 8, mapping, ophiolite, spectra, United Arab Emirates
Citation: Howari FM, Ghrefat H, Nazzal Y, Galmed MA, Abdelghany O, Fowler AR, Sharma M, AlAydaroos F and Xavier CM (2020) Delineation of Copper Mineralization Zones at Wadi Ham, Northern Oman Mountains, United Arab Emirates Using Multispectral Landsat 8 (OLI) Data. Front. Earth Sci. 8:578075. doi: 10.3389/feart.2020.578075
Received: 30 June 2020; Accepted: 01 September 2020;
Published: 18 September 2020.
Edited by:
Maged Marghany, Syiah Kuala University, IndonesiaReviewed by:
Sobhi Jaber Nasir, Sultan Qaboos University, OmanSalem Mohamed Salem, National Authority for Remote Sensing and Space Sciences, Egypt
Copyright © 2020 Howari, Ghrefat, Nazzal, Galmed, Abdelghany, Fowler, Sharma, AlAydaroos and Xavier. This is an open-access article distributed under the terms of the Creative Commons Attribution License (CC BY). The use, distribution or reproduction in other forums is permitted, provided the original author(s) and the copyright owner(s) are credited and that the original publication in this journal is cited, in accordance with accepted academic practice. No use, distribution or reproduction is permitted which does not comply with these terms.
*Correspondence: Fares M. Howari, Fares.howari@zu.ac.ae, Manish Sharma, Manish.Sharma@zu.ac.ae