A Retrospective Ecological Status Assessment of the Lakes Based on Historical and Current Maps of Submerged Vegetation—A Case Study from Five Stratified Lakes in Poland


Hydroacoustic Laboratory, Inland Fisheries Institute, Oczapowskiego 10, 10-719 Olsztyn, Poland
Water 2020, 12(9), 2607; https://doi.org/10.3390/w12092607
Submission received: 4 August 2020
/
Revised: 14 September 2020
/
Accepted: 16 September 2020
/
Published: 18 September 2020
(This article belongs to the Section Water Quality and Contamination)
Abstract
:This article presents and tests a new method for the retrospective assessment of ecological status assessment of the lakes in accordance with the Ecological State Macophyte Index (ESMI), which is formally used in biological monitoring in Poland. The proposed method is based on three metrics, the Z colonization index, the average maximum depth of lake vegetation Cmax, and the Secchi disk depth. Mathematical functions of ecological class were developed on the basis of the mean values of these three indicators in summer for different ecological status classes in 88 stratified lakes in northern Poland and the Łęczyńsko-Włodawskie Lake District and five lakes in the catchment area of the Wel River (published data). The new metrics were validated on the basis of literature data—ESMI, Cmax, Z and SD values from 11 lakes near Olsztyn (Poland). The obtained results are similar to those calculated based on macrophyte field surveys and can be an alternative of the Ecological State Macophyte Index (ESMI), which is formally used in biological monitoring in Poland. The proposed method makes it possible to compare long-term changes in the ecological state of lakes, because it enables an analogous assessment on the basis of data calculated from historical bathymetric maps showing the distribution of hydro macrophytes (parameters Z and Cmax) as well as contemporary data, collected, among others, during hydroacoustic research.
1. Introduction
According to the EU Water Framework Directive (WFD) [1], the quality of inland waters should be evaluated based on biological elements, physicochemical and hydromorphological elements. The systems for assessing aquatic ecosystems should differentiate between the processes that occur naturally and those driven by anthropogenic pressure. The process of developing such systems begins with the determination of the natural state of various lake types as the reference conditions. The reference conditions are then compared with the existing state to determine the extent to which the ecological status of the analyzed ecosystems deviates from the natural state [2,3,4,5,6]. However, pursuant to the provisions of the WFD, in addition to minimally transformed ecosystems, the reference conditions can also be determined based on historical data. Unfortunately, in many countries, historical data as well as the results of long-term lake monitoring studies are rarely available, and the period when the ecological status of water bodies began to deteriorate under anthropogenic pressure is difficult to identify [5]. Paleolimnological investigations are carried out to assess environmental change, identify the causes of change and determine the current ecological status of aquatic ecosystems, including lakes [7]. Despite their effectiveness, as demonstrated by a study of Lake Pappjärv in Estonia [5], paleolimnological methods can only be applied to selected lakes.
An alternative approach could involve a retrospective evaluation of the ecological status of lakes, with the use of formalized methods, based on various types of historical data available in the rich limnological literature. The results of a paleolimnological study carried out in Estonia [5] suggest that the search for reference conditions in Eastern European lakes should begin in the early years the second half of the 20th century. Even if many lakes had already been strongly modified by anthropogenic pressure at the time, retrospective methods could be useful in developing a cohesive system for assessing human impact on aquatic ecosystems in recent decades. Previous studies where a retrospective method was deployed to evaluate the ecological status of a lake based on a map presenting the historical distribution of submerged hydrophytes and reed communities demonstrated that the data gathered with the use of at least two indicators of macrophyte abundance could be the basis for retrospective assessment [8]. Despite the above, a comprehensive method for performing such comparisons has not been developed to date.
In Poland, the ecological status of lakes is evaluated with the Ecological State Macrophyte Index (ESMI) based on the original method for assessing the development of lake ecosystems, which was developed in the late 1970s [3,9]. This method was developed to determine an ecosystem’s status in the ecological succession of plant life [10]. The ESMI relies on the phytocenotic diversity index and the macrophyte abundance index. The ESMI was calibrated in view of the provisions of the EU Water Framework Directive [1,3,11,12,13], and it has been formally used in Polish monitoring studies since 2007 [14].
The Inland Fisheries Institute has an archive of historical bathymetric maps (approximately 800 maps), which were developed based on the results of surveys conducted in the mid-20th century and which present the distribution of hydrophytes (submerged hydrophytes and emergent vegetation) before 1968. The archive could be a valuable resource for assessing the ecological status of many Polish lakes provided that a relevant multi-metric index was proposed, comparable with the generally recognized and commonly used macrophyte-based method for assessing the ecological status of lakes.
The purpose of this research was to indicate the assumptions useful for developing a new indicator enabling retrospective assessment of the ecological status of lakes based on the historical distribution of aquatic vegetation. It was assumed that the new method of retrospective assessment of the ecological status of lakes should be based on the values of relevant indicators from historical maps and should be consistent with the ESMI approach adopted in Poland, thanks to which it should also allow for a comparable assessment based on the contemporary data.
The aim of the study was to develop mathematical functions enabling the assessment of the ecological state of lakes on the basis of data obtained from maps containing information on the distribution of hydrophytes and on the basis of analogous contemporary data. Such an assessment should possibly be consistent with the official method of assessing the ecological status on the basis of macrophytes in Poland, i.e., ESMI. This suggests that a new index should be calibrated in relation to the ESMI. It was assumed that this would be possible thanks to the developed mathematical functions for assessment of five stratified lakes in the catchment area of the Wel River and a preliminary verification of their suitability carried out on the basis of the data available from the literature. I hypothesized that it is possible to estimate the ecological status of lakes on the basis of three variables (Z—colonization index, Cmax—maximum vegetation depth; SD—Secchi disc) instead of macrophyte field studies.
2. Materials and Methods
2.1. Assumptions of the Method
The assumptions of the new method, which, if it is to be useful for the assessment of changes in the ecological status of lakes over a long period of time, should enable not only a retrospective assessment of the ecological status, but also a comparison with an identically performed assessment on data collected recently. Moreover, in order for such comparisons to have some cognitive value, the proposed method should enable obtaining results that can be an alternative of WFD system (in this case the ESMI).
The ESMI is a negative logarithmic function that evaluates two main aspects of macrophyte communities, i.e., taxonomic composition and abundance [12]:
where H is the biocenotic diversity index H [15], Hmax is the maximum biocenotic diversity index H, N is total phytolittoral area, P is lake area and Z is the colonization index Z [10], calculated with the use of the below formula [12]:
where Pisob.2.5 is the potential phytolittoral area bounded by the 2.5 m isobath, i.e., the lake area with a depth of less than 2.5 m (ha). To calculate the N index, the average range (depth) of Cmax vegetation and the average percentage coverage of phytolittoral with vegetation are needed.
The ESMI function approximates horizontal asymptote 1, and its values are determined in the range of 0 to 1, where 1 is indicative of pristine ecosystems (reference status) and 0 denotes highly degraded habitats [12].
Both indicators that are used in the ESMI approach, i.e., Z (directly incorporated into the formula) and Cmax (used to calculate N), can be determined based on historical maps. These indicators play different roles in the calculation of the ESMI, and the mean values of these indicators for different ecological status classes are given in the literature [9]. Therefore, it was assumed that the new WFD-compliant method could rely on a system of equations describing the relationships between the indicators and ESMI values describing the ecological status of lakes.
Previous research into the ESMI method demonstrated that Secchi disc (SD) visibility measured in summer also supports the determination of the ecological status of lakes based on the values of parameters Z, Cmax and H in the ESMI formula (Equation (1)) [3,9,10]. Therefore, due to the limited number of components that could be used in the new index (reconstructed based on historical maps describing the distribution of macrophytes in lakes), it was found that SD could be a useful supplementary parameter.
2.2. Lakes and Datasets
2.2.1. Data for Model Calculation
An attempt to calculate equations to a retrospective evaluation of the ecological status of lakes was carried out on the basis of data from the publication by Ciecierska et al. [9]. These mean values of the indicators used in the ESMI approach (Z and N) and mean SD in summer for different ecological status classes (on a scale of 1–5) were calculated by Ciecierska et al. [3] for stratified 88 lakes in northern Poland and the Łęczyńsko-Włodawskie Lake District (Table 1). A detailed list of the above lakes (with the hydromorphological characteristics) was presented by Ciecierska [3]. These lakes are evenly distributed north of the ice cover during the glaciation of the last Vistula (Weichselian) (from 14°21′ to 23°30′ E; 51°51′ to 54°49′ N). According to [16], over 95% of Polish lakes with an area of more than 1 ha are in the above region.
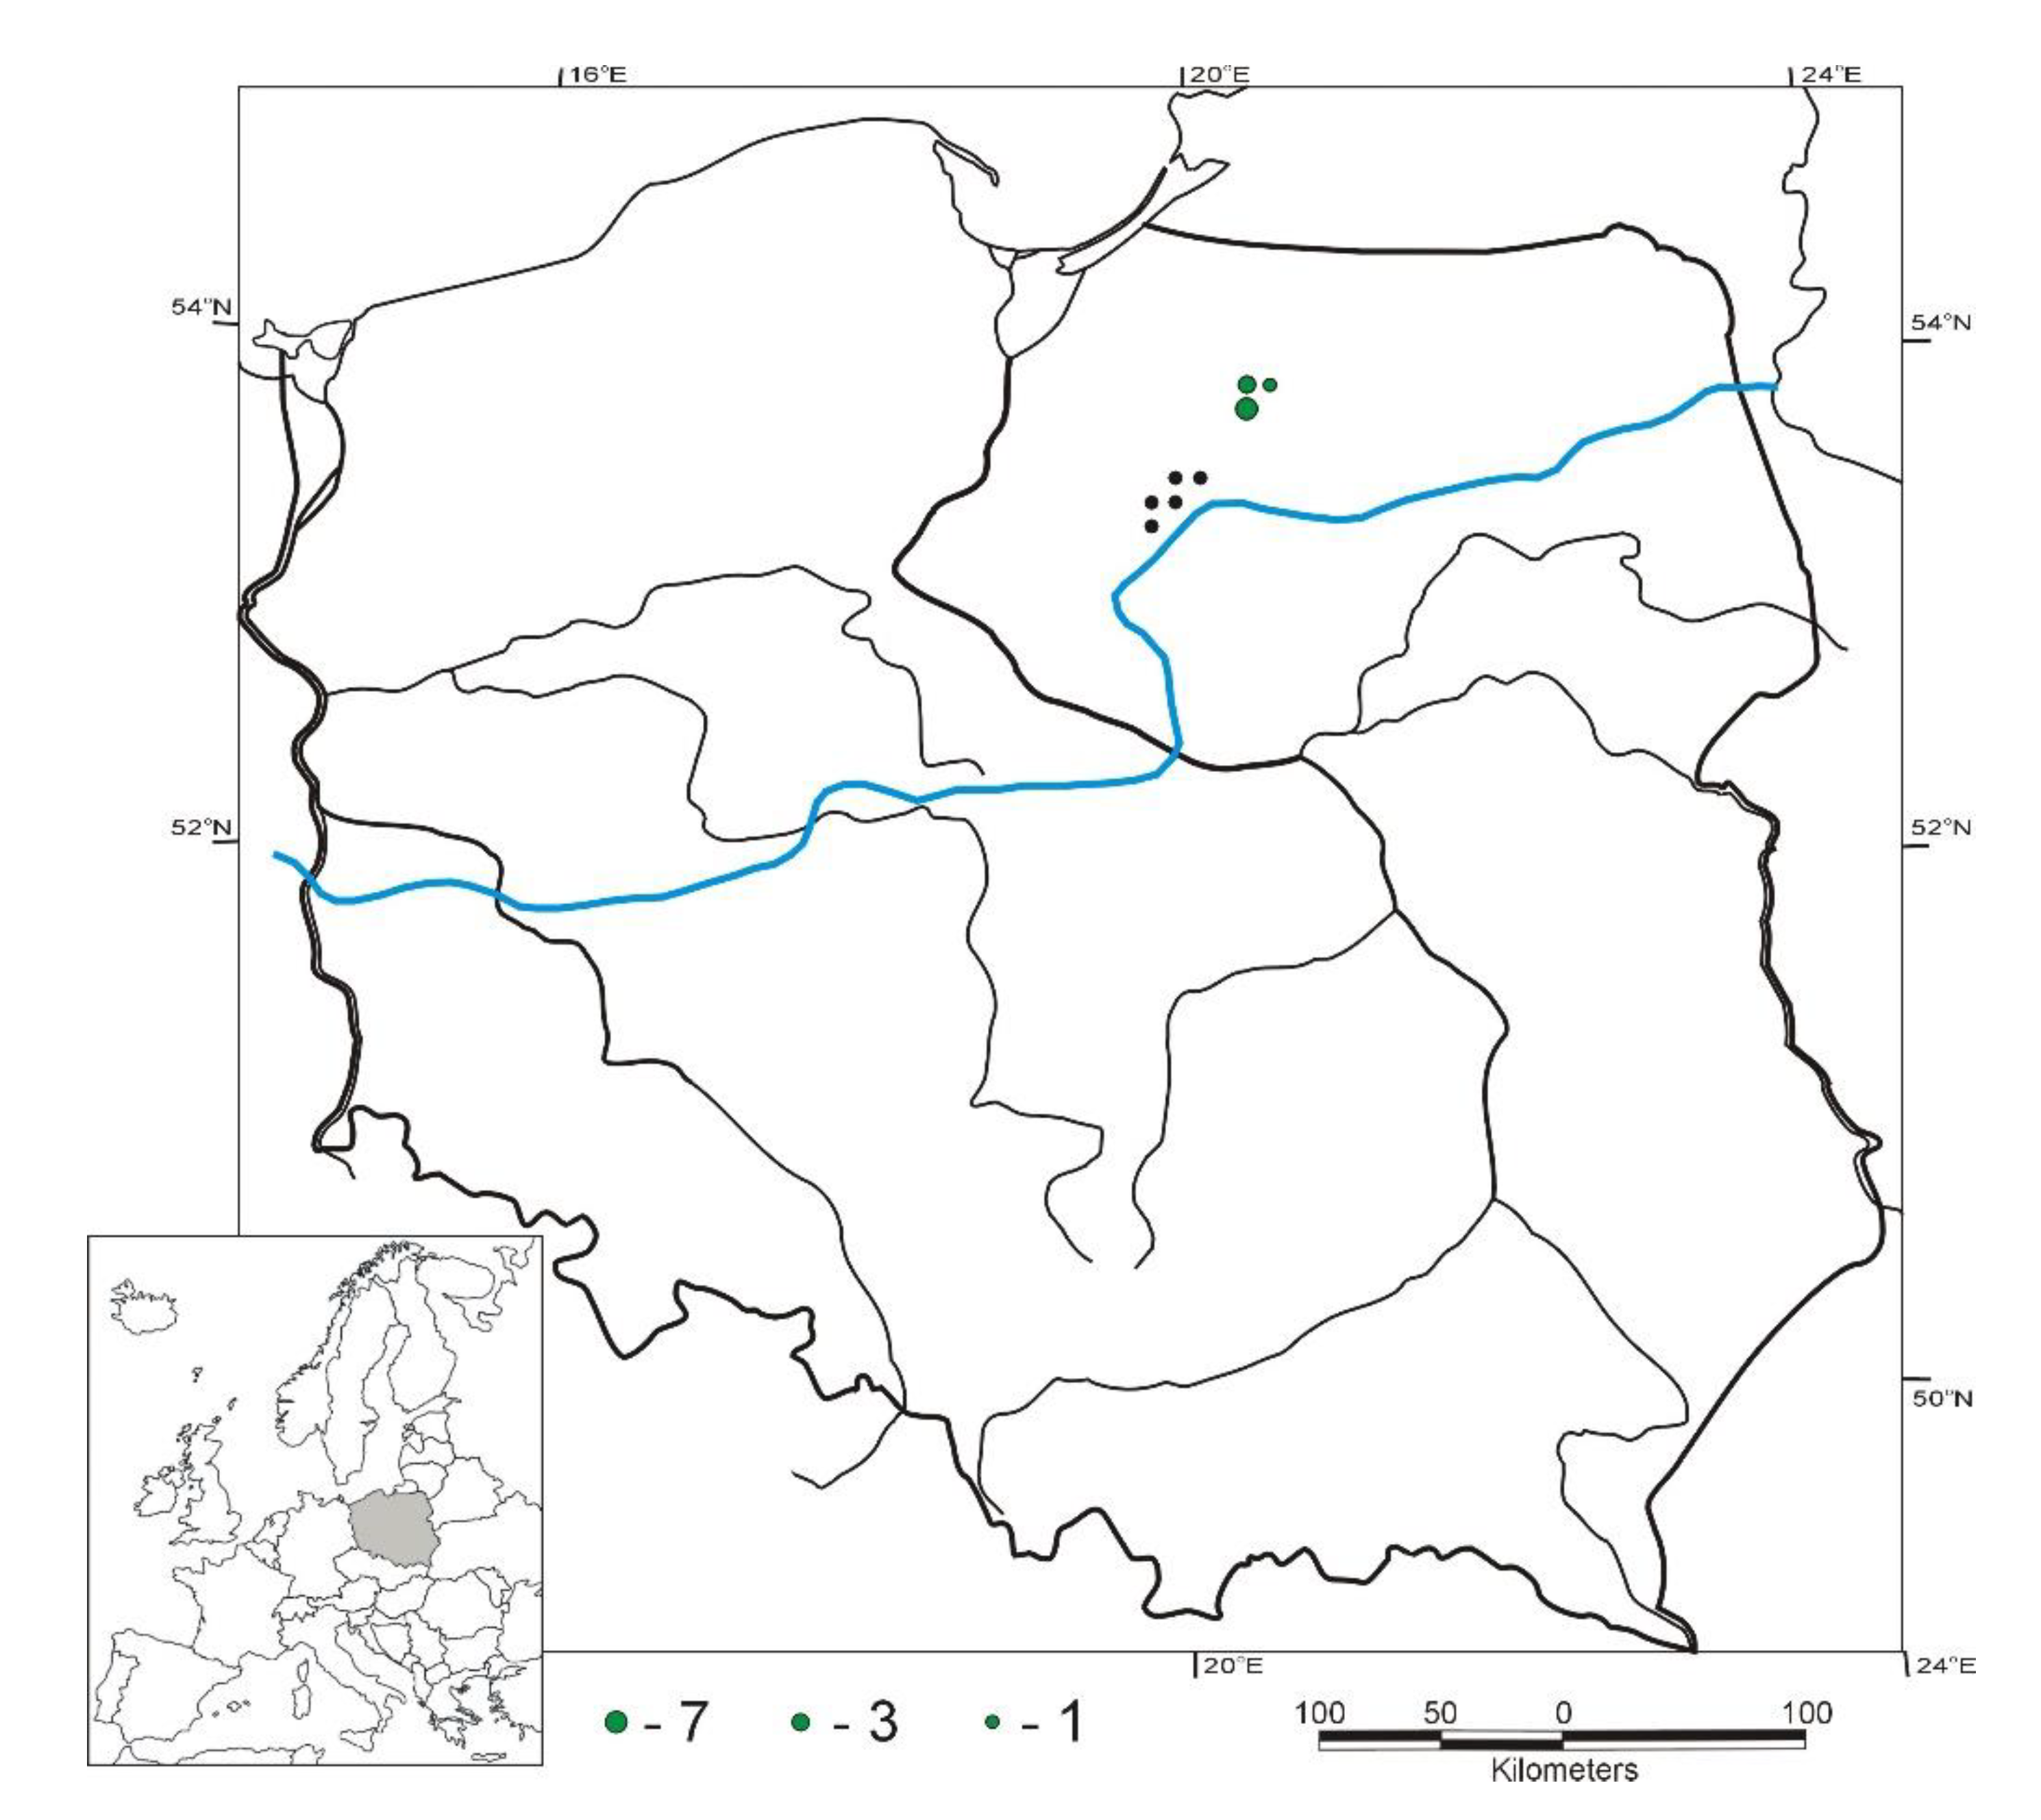
The data presented by Kolada et al. [17] and Soszka and Ochocka [18] for five stratified lakes in the catchment area of the Wel River (from 19°47′31″ to 20°09′05″ E; 53°15′32″ to 53°26′08″ N; Figure 1) was also used in the calculations (Table 2). These data included the colonization index (Z), the maximum vegetation depth (Cmax), the Ecological State Macrophyte Index (ESMI) in the growing season of 2009 [17] and Secchi disc visibility (SD) [18].
2.2.2. Data for the Validation of Mathematical Functions
The developed equations were validated based on the data presented by Dunalska et al. [19] for 11 lakes (separately four Basins of the Lake Ukiel) located near Olsztyn (Figure 1; Table 3). These data included the colonization index (Z), maximum vegetation depth (Cmax), Ecological Status Macrophyte Index (ESMI) in the 2016 growing season and the average value of the Secchi disc visibility (SD) in the summer of 2015 and 2016.
2.2.3. Data for the Calculation of a Retrospective Ecological Status Assessment
The historical ecological status of the same five lakes in the Wel Landscape Park was evaluated based on data describing the area colonized by reeds and submerged plants calculated (Table 4) from historical maps from the fisheries management reports [20,21,22,23,24]. The surface occupied by rushes and submerged macrophytes was measured directly from the bathymetric chart (after it had been digitized) with the measuring program Multiscan by Computer Scanning Systems (Poland) with the module that permitted measuring the surface area of fields.
The depth at which hydrophytes occurred (Cmax) was determined by extrapolating the depths between known isobaths neighboring the limit of submerged macrophytes occurrence based on the lake bottom profiles along each transect. The bottom profile was created by placing within the coordinate system the distance from the shore (and depth) of the intersection point of the transect line with subsequent isobaths from the shoreline [8]. This method was checked by determining the mean error between the determined values of Cmax and the actual values from the hydroacoustic tests. The mean value of Cmax determined by each method (from echograms and interpolation between isobats on the bathymetric chart) differed from each other below 9 cm [8].
2.3. Minimum Number and Arrangement of Transects
One of the most important problems related to the study of macrophytes in lakes is the adoption of such a number of transects and designing their locations in such a way as to capture the full diversity of the lake vegetation, taking into account the morphometric diversity, the diversity of the coastal zone development and the ways of using the lake itself [9].
The ESMI method requires research on transects at least 30 m wide and long, covering the entire phytolitoral, up to the depth of plant occurrence. The minimum number of such transects is determined on the basis of the size and circumference of the lake, using a modified formula proposed by Keskitalo and Salonen [26], which is a function of the shoreline length and lake area. The minimum number of transects in the ESMI method ranges from 6 to 30 [9].
In the new method of assessing the ecological condition of lakes, the average macrophyte depth (Cmax) will be calculated on the basis of measurements taken along "transects". However, since the method is to enable retrospective assessment on the basis of historical maps, as well as data obtained with hydroacoustic methods, it was assumed that a transect is a line on the map along which Cmax will be determined or a strip on the bottom of a lake with a width of the hydroacoustic signal beam. The minimum number of such transects (i.e., points) at which the limit of the maximum macrophyte depth is determined must ensure the representativeness of the lake data.
In previous studies of this type, which were carried out on Lake Dobrąg, it was assumed that when calculating Cmax from a historical map, as well as in field work, the transects were located perpendicular to the lake shoreline at 60 m intervals [8]. Such density resulted from the accuracy with which bathymetric plans for lakes were prepared in the 1950s.
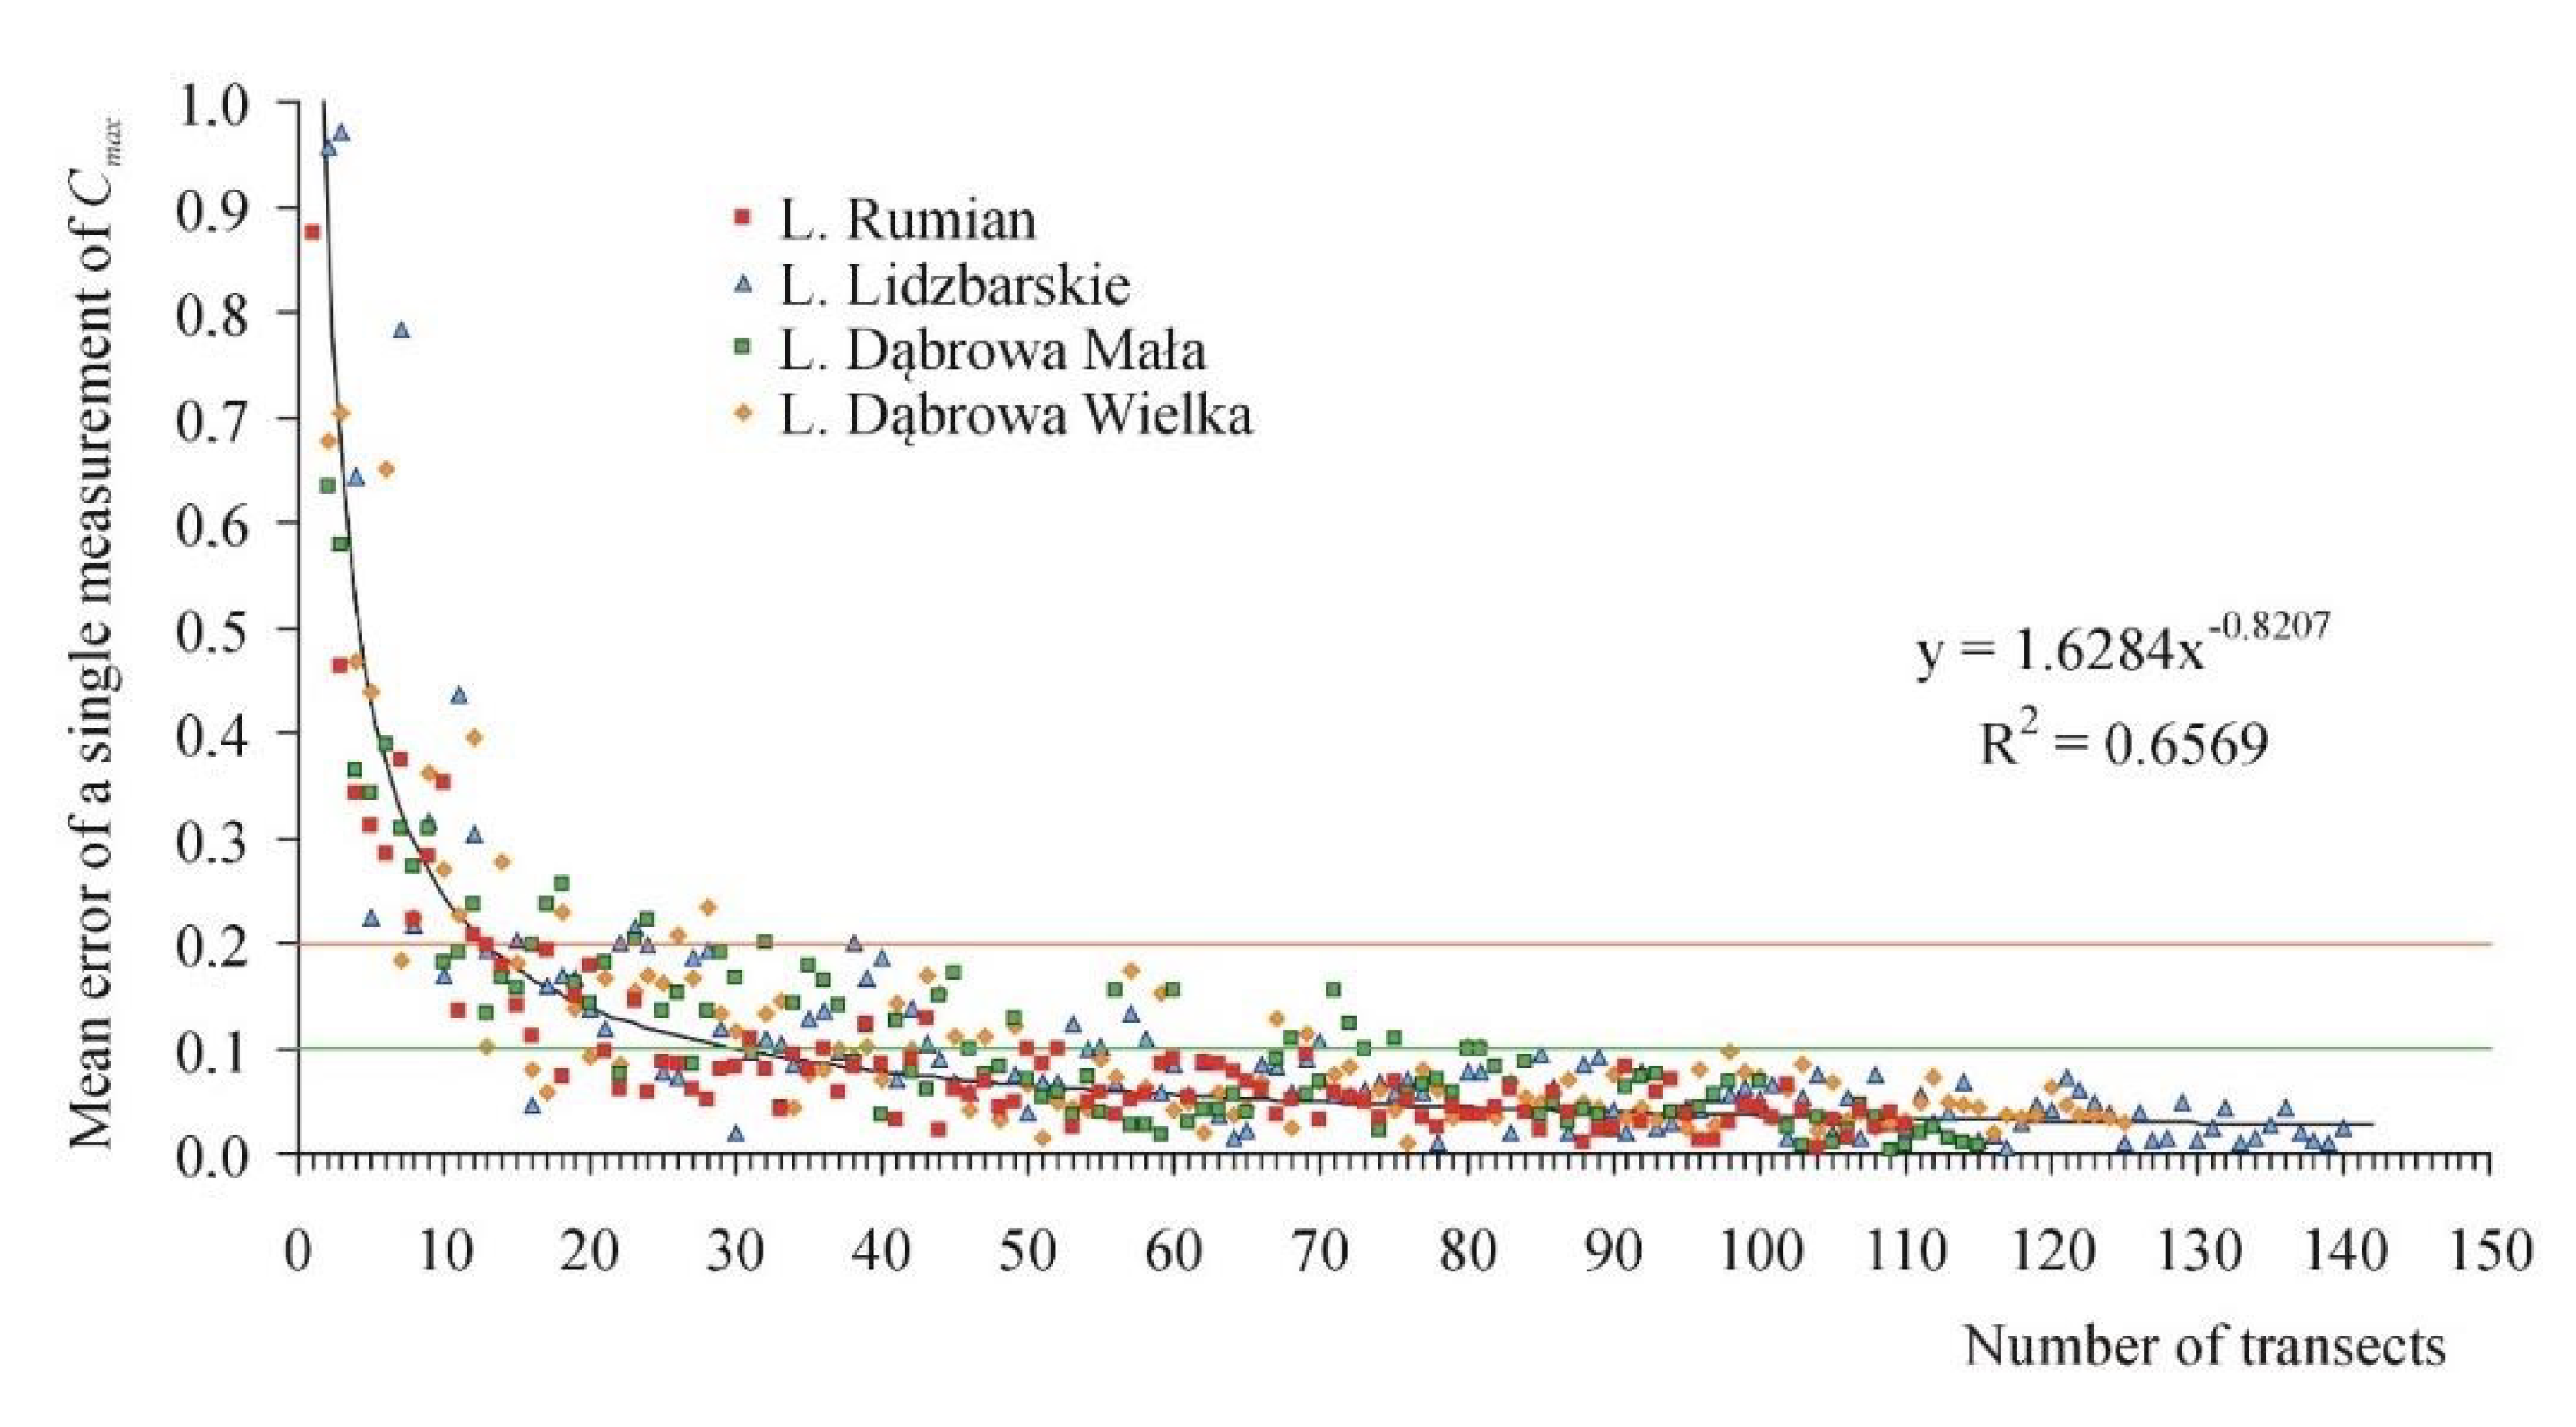
In order to determine this number for historical data, it was analyzed how the adopted number of transects influences the estimated Cmax value. The analysis was carried out on the basis of data obtained from historical bathymetric maps of the lakes of the Wel river catchment (Table 6). The mean error of a single measurement of Cmax (mi) was calculated:
where vi is the apparent error of a single measurement and n is the total number of measurements.
For each lake, a stepwise procedure for increasing the number of profiles was used, for each i changing from 1 to n − 1 profiles. The analysis applied the principle of even distribution of profiles along the shoreline of lakes, regardless of their number. The comparison of all values of mi allowed to show that regardless of the scale of the bathymetric plan and the number of profiles (from 111 to 143) adopted for the determination of Cmax, a similar distribution mi was obtained (Figure 2). Only analyzing more than 80 profiles ensures that the average error of a single Cmax measurement is less than 10 cm. Therefore, it can be assumed that the minimum number of transects for which the vegetation depth Cmax should be calculated is 81.
2.4. Estimation of the Equations
The equations for estimating the ecological status of lakes on a scale of 0 to 5, where 5 describes nearly pristine conditions and 0 denotes the most disturbed conditions, were derived in TableCurve v. 3.11 software [27]. This package offers the ability to fit over 3300 linear and non-linear equations to the X-Y data table. The linear equations are divided into families: (1) standard equations in a form of n-th polynomial of one variable, for n = 1 to 4, the (2) y-transformed equations in a form f(y) = a + bf(x) where f(y) = ln(y), 1/y, y2, sqrt(y); (3) y-transformed equations the different functions(x) in a form f(y) = a + bf1(x) + cf2(x) where f(y) = ln(y) and 1/y. The non-linear equations include the Gaussian. Lorentztian, Log-Normal, Extreme-Value, Logistic and Complementary Error Function peak equations. The fitting procedures for the solution vector (coefficients) for the linear equations, depending on the type of equation, are Direct Matrix Solution, Gaussian Elimination or Singular Value Decomposition, while the procedure for matrix inversion (errors, confidence, limits) are LU Decomposition or Singular Value Decomposition. The fit statistics for y-transformed equations are based upon true y-residuals, i.e., a function evaluation, which is conducted for each data point [27].
The individual equations were developed on the basis of the mean values of the ESMI indicators: Z, Cmax and SD in individual ecological status classes (on a scale from 0 to 5) in 88 Polish lakes, published by Ciecierska et al. [9]. The equations with the best fit for these data were selected based on the ranking of equations by TableCurve based on the coefficient of determination (R2).
As the function describing ESMI takes the form of an exponential function whose exponent is the product of the indices, it was assumed that the new metrics for Z, Cmax and SD will be integrated using the geometric mean.
The same software package was used to develop a formula for converting the mean values on a scale of 0 to 1, where 1 denotes lakes with the highest ecological status, and 0 indicates the most degraded habitats.
3. Results
3.1. Elaboration of the Equations
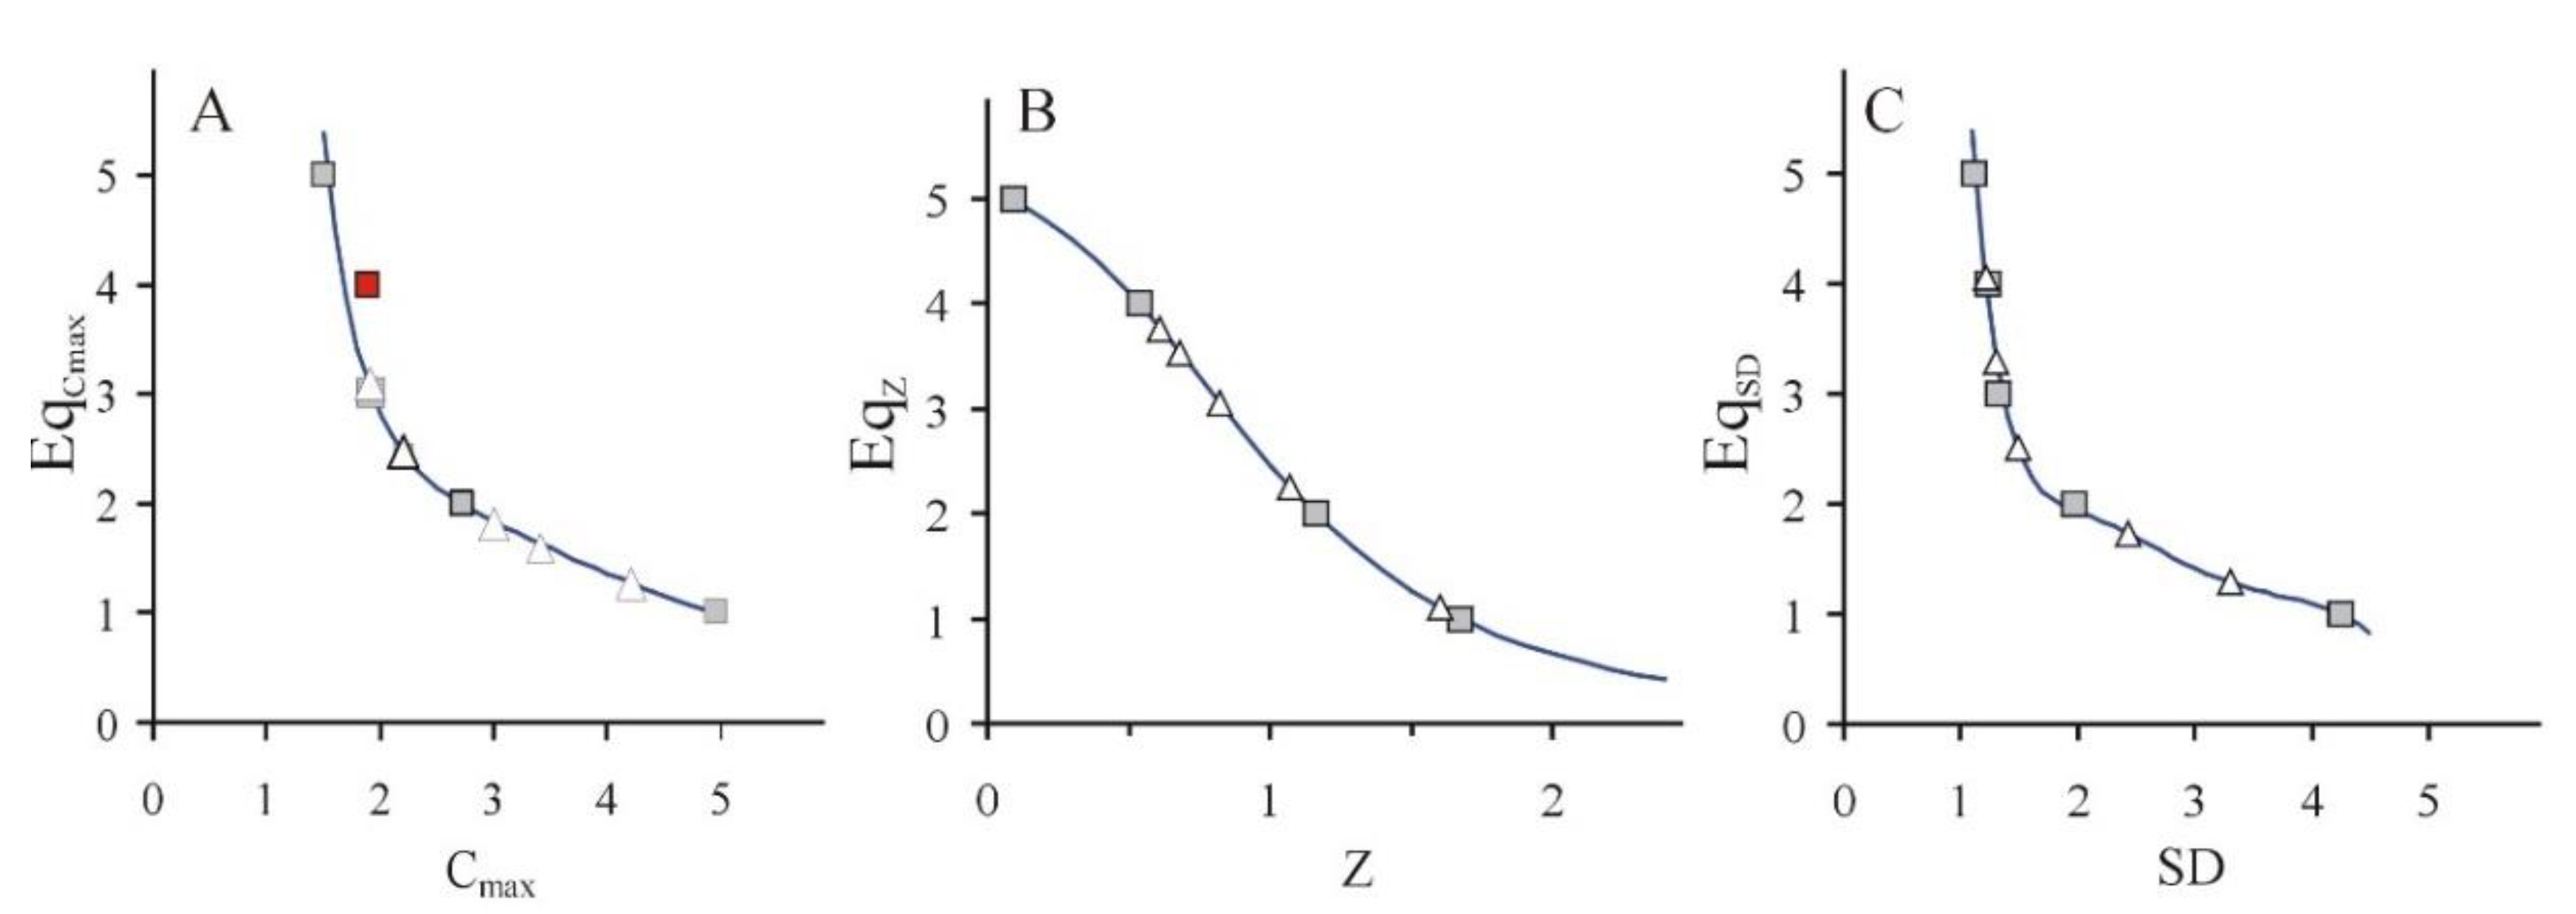
The individual equations were developed based on the regression between the indicators (Z, Cmax, SD) and classes of the ecological status of lakes were determined with the use of the ESMI method [9]. The relationship between the mean values of Cmax in 88 lakes vs. successive ecological status classes (EqCmax) were described by the following linear function (R2 = 0.99; Figure 3A):
where Cmax is the mean maximum vegetation depth in all transects where the maximum macrophyte depth could be determined [12].
The relationship between the mean values of the colonization index (Z) and successive ecological status classes (EqZ) was described by the following linear function (R2 = 1; Figure 3B):
where Z is the colonization index calculated according to the Equation (2), given by Ciecierska and Kolada [12].
The relationships between the mean values of SD visibility for different ecological status classes (EqSD) applicable to 88 lakes [9] and five lakes in the Wel Landscape Park [18] were most accurately (R2 = 0.98; Figure 3C) described by the following equation:
where SD is Secchi disc visibility at the peak of the growing season (July–August) [9,12,18].
The resulting three indices were averaged with the use of the below formula:
In order for the results of the Eq-based assessment to be comparable to ESMI, the values estimated based on the proposed formula (Equation (7)) are expressed using Equation (8), i.e., in the range of 1 (conditions close to natural) to 0 (severely affected), and therefore, are analogous to the assessment of the ecological status in the ESMI method:
3.2. Validation of the Equations
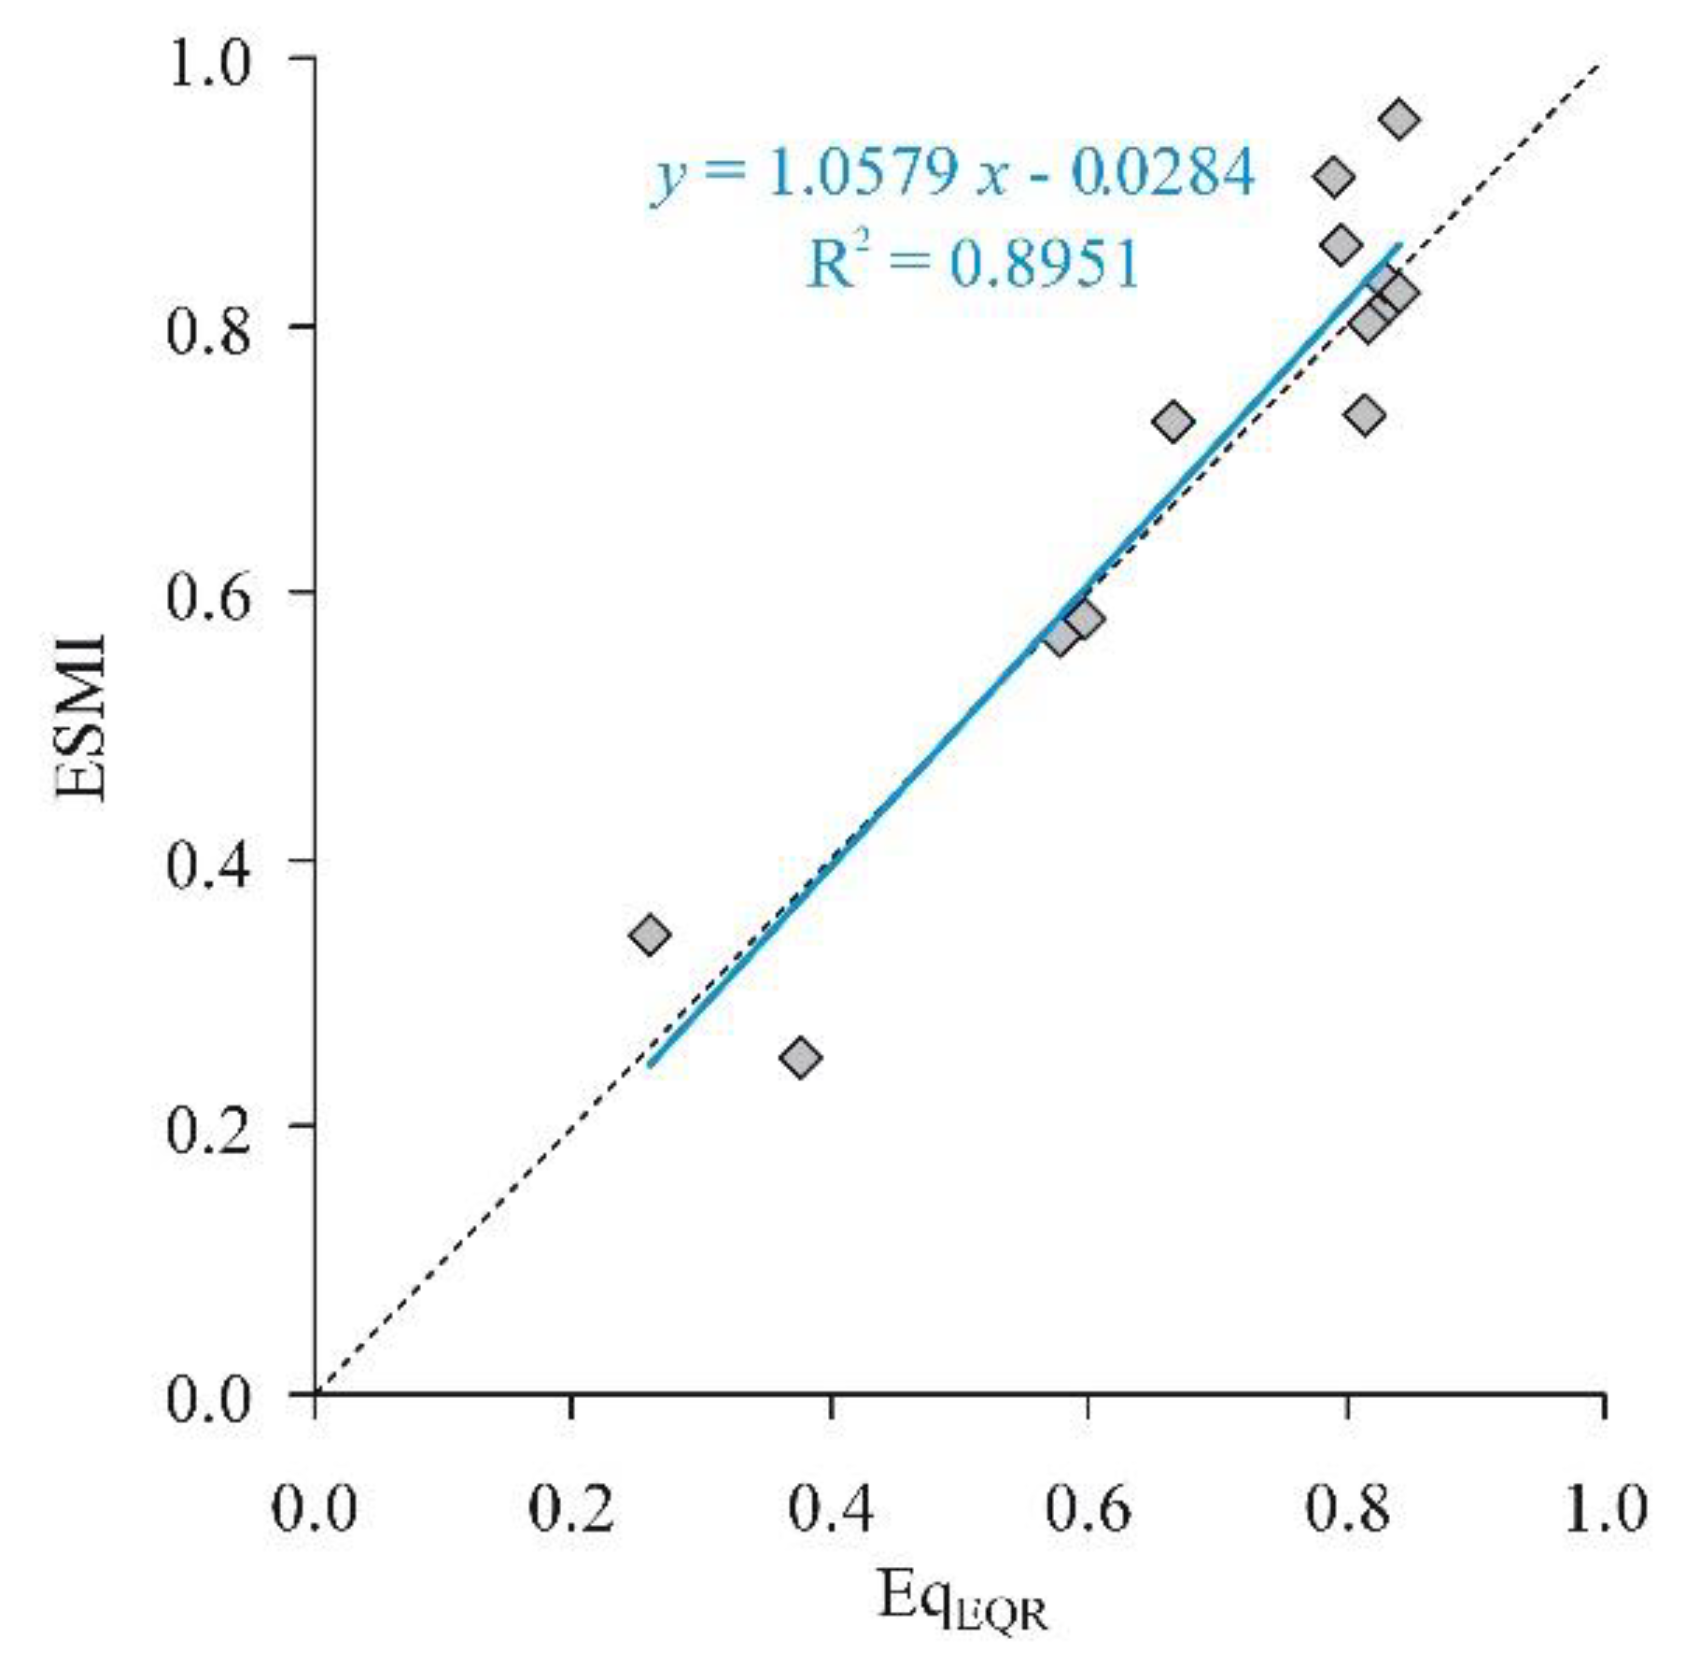
In principle, the EqEQR approach should produce similar results to the ESMI method; therefore, in order to verify the correctness of the assessment made using Equations (4)–(8), the estimated in this way values were compared with the ESMI values in the growing season of 2016 for the 11 lakes in the vicinity of Olsztyn [16]. Then, the ecological status assessment of the lakes was compared, carried out by both methods. The distribution of ESMI and EqEQR values did not differ significantly between the compared methods (coefficient of correlation R2 = 0.895; Figure 4), and the line slope (a = 1.058) indicates that the EqEQR adequately approximates the ESMI function (Equation (1)). Comparing ESMI and the EqEQR method showed that values were lower for eight lakes and higher for six lakes. The differences in the values of both methods in 79% of cases were determined in the range of ±0.082, and only in three cases ±0.122. When the ecological status of lakes was evaluated with the use of both indicators, 10 lakes were assessed identically (Table 7), and only one lake (L. Czarne) was classified in a worse ecological status (“Good“ instead of “High“) in the EqEQR approach.
3.3. The Retrospective Assessment
The applicability of the EqEQR method was presented with the example of five lakes in the Wel river basin. The retrospective assessment of the ecological status of five lakes showed that only in one of them (Dąbrowa Mała) in the period of 40–50 years (from the beginning of the second half of the 20th century to 2009), there was a clear deterioration of the ecological status (Table 8). Decrease in the EqEQR value by 0.248 was due to a reduction of all three variables, Cmax, Z and SD, by 25%, 34% and 25% of their 1960s values, respectively (Table 2 and Table 4). Similar changes of these three variables were recorded in Lake Rumian (Cmax—by 35%, Z—by 33% and SD—by 32%), which in the 1960s had a good ecological status, did not cause such a large change in EqEQR (decrease by 0.092). Admittedly, this was accompanied by a change in the assessment of the ecological status (from good to moderate), but the value of the EqEQR index (0.407) in 2009 differed from the value of the good/moderate boundary (0.410) only by −0.003 According to the ESMI index, the ecological status of Lake Rumian in 2009 was rated higher (good), but the ESMI value was only 0.005 above the limit value (Table 8). Similar (0.089) to Lake Rumian, the change in EqEQR was also recorded in Lake Kiełpińskie, but in this case, Cmax was 48% higher than in the 1960s and the colonization rate Z was similar in both compared periods (Table 8), while the visibility of the Secchi disc was significantly lower (by 21%) in 2009. However, in this case, these changes to the variables did not contribute to the deterioration of the lake’s ecological status assessment.
The assessment of the ecological condition of Lake Dąbrowa Wielka and Lake Lidzbarskie has not changed (Table 8). The EqEQR in the 1960s and 2009 differed by 0.002 and 0.016, respectively. In both of these lakes there was a significant decrease in water transparency (by 47% and 29%, respectively) and a similar increase in the Z colonization index in Lake Dąbrowa Wielka (by 42%) or the maximum depth of macrophytes (by 27%) in Lake Lidzbarskie. In both of these lakes, the change in the third element of the assessment did not exceed 10%, as in Lake Kiełpińskie.
4. Discussion
Environmental indicators must be sensitive to moderate change that is repeatable, meaningful and practical while representing the ecological and biological condition of a water body [28]. This type of method is probably ESMI, which includes two negatively correlated components—diversity index H and abundance index Z [12]. The EqEQR-method, unlike the ESMI approach, evaluates only the abundance of macrophyte communities, which, according Søndergaard et al. [29], can be expressed by macrophyte coverage and/or maximum colonization depth. Both methods rely on the same indices, i.e., the maximum macrophyte depth Cmax and the colonization index Z, which is the ratio of the lake area colonized by macrophytes in the area potentially available to plants [12]. The ESMI approach relied on the assumption that the phytolittoral area of lakes with at least a good ecological status is not smaller than the littoral area to a depth of 2.5 m [3,10].
Secchi disc visibility was also used in the evaluation as a simple metric of light availability in lakes. Light considerably influences macrophyte abundance, and all changes in water transparency induce variations in plant structure, in particular submerged vegetation, plant density and depth [28,30,31,32,33]. An increase in the concentration of biogenic substances generally contributes to phytoplankton density and decreases water transparency, ultimately leading to the disappearance of plant species characteristic of water bodies that are less abundant in nutrients, and to excessive growth of filamentous green algae, species of the genus Potamogeton and helophytes [34,35,36,37]. In addition to colonization depth and the percentage cover of submerged macrophytes, Secchi disc visibility is also used in the multi-criteria method proposed by Sender et al. [33] for the ecological assessment of lakes. For these reasons, the aim of this study was to show that it is possible to make a comparable assessment of the ecological status of lakes based on three variables (Z, Cmax and SD) and ESMI.
The discussion of the obtained results is difficult, because this study shows (due to the high time-consuming nature) the results of the back assessment of the ecological status of only five lakes in Poland. Only Lake Dobrąg was studied in a similar way before [8]. At that time, it was only possible to compare the obtained values of individual indicators (Z, Cmax and SD) with the confidence intervals for the mean of these indicators for individual classes of the ecological status of 88 stratified lakes in Poland. These confidence intervals were determined using the mean values of these indicators according to Ciecierska [3] and Ciecierska et al. [9].
In the 1960s, the colonization index Z and mean SD in Lake Dobrąg were smaller than the borderline values of the mean confidence intervals of these parameters for the class high (with a confidence level higher than 99.8%), while the maximum colonization depth (Cmax) was within the limits of the confidence interval for Cmax in a high ecological status (determined at a confidence level of 96%). This problem was even more visible when trying to determine the ecological status of this lake on the basis of data from 2016. The use of SD and Cmax evaluation elements made it difficult to overlap the boundaries of the confidence intervals of the mathematical mean of these indicators. It has been estimated that clear differences between the confidence intervals determined for the good and moderate classes can only occur with the probability of P = 22% for SD, and for Cmax P = 2% [8]. It could only be concluded that the lake’s condition deteriorated, as none of the indicators allowed it to be classified as having “high ecological status.” The lack of an assessment system made it impossible to integrate these indications and clearly define the ecological state of the lake.
The calculation of the EqEQR index using Equations (4)–(8) confirms the thesis about the deterioration of the state of Lake Dobrąg. The change in the EqEQR value in Lake Dobrąg (0.314) is therefore greater than the one shown in this study in Lake Dąbrowa Mała (0.248). In both of these lakes, classified as in “high ecological status” in the 1960s, a significant decrease in Cmax, Z and SD was noted (in Lake Dobrąg by 24%, 23% and 52% of the values from the 1960s, respectively [8]). It should be emphasized that similar changes in these three variables in Lake Rumian, classified as in ‘good’ in the 1960s, did not cause such a large change in EqEQR (decrease by 0.092). This suggests an attempt to determine (on the basis of a larger number of data) the fit of the models explaining the relationship between the variables and ESMI, which could be helpful in determining the weights showing the different significance of each of these variables. However, since the uncertainty associated with each element of the assessment may also affect the risk of misclassification [38], it is reasonable to undertake an analysis of the uncertainty associated with the assessment based on each of the three variables (Cmax, Z and SD) in the future.
The presented results indicate that it is possible to estimate the ecological condition of lakes based on three variables (Z, Cmax and SD) instead of macrophyte field studies. It can therefore be assumed that the results do not exclude the possibility of developing a new index as a system for assessing the state of lakes comparable with the index of ecological status macrophytes (ESMI), especially to determine changes over time based on modern and historical data.
5. Conclusions
5.1. Limitations of the Study
The study presented in this article had to be subject to a number of limitations that were relevant to the discussion of the results obtained.
A significant limitation concerned a limited set of data that could be used in the calculations and validation of mathematical functions. At this stage of the research, only the data available in publications was used. Hence, a small number of lakes was studied—only five. After the results of the research have confirmed the possibility to estimate the ecological condition of lakes based on three variables (Z, Cmax and SD) instead of macrophyte field studies, this problem will be solved by starting cooperation with other centers conducting ecological assessment of lakes. For example, at the validation stage, it was only possible to demonstrate a fairly high convergence of the ecological status assessment, without determining the uncertainty of the ecological status assessment related to the application of the proposed mathematical functions, i.e., the risk of erroneous assessment based on the EqEQR with respect to the ESMI assessment.
5.2. Conclusions and Future Research Directions
The established relationships between ESMI and EqEQR indicate that it is possible to create equations enabling evaluation of the ecological status of lakes based on the abundance of macrophyte communities and that the results obtained will be consistent with the results of assessments that account for biological diversity.
This research indicates the possibility of supplementing the knowledge about long-term changes in the ecological state of lakes. The work presented in this paper demonstrated the possibility of developing lake ecological status assessments alternative to WFD systems based on three variables (Z—colonization index, Cmax—maximum vegetation depth, SD—Secchi disc) instead of macrophyte field studies. The proposed evaluation system allows for a direct comparison of the results of backward evaluation (made on the basis of historical data) with the evaluation made on the basis of the same mathematical equations on the basis of the results obtained today, and by definition such evaluation is to be as similar as possible to the officially adopted method (properly calibrated). This is important for the assessment of the directions and pace of changes in the ecological status of lakes and may be helpful in the selection of lake reclamation methods.
Based on the limitations and discussions mentioned in the previous section, it is possible to indicate the following future directions of research:
- Determining mathematical functions between the adopted indicators (Z, Cmax and SD) and the assessment of the ecological state of lakes using ESMI based on a different set of data.
- Carrying out the assess of the risk of misclassification of lakes with EqEGR against ESMI.
- Carrying out (in several stages) a retrospective assessment of the ecological status of lakes (possible for about 800 reservoirs) and determining changes in the ecological status by comparing these results with the assessment made on the basis of contemporary data.
Funding
This research was supported by the Inland Fisheries Institute under research project number S-029.
Acknowledgments
The author thanks the anonymous reviewers for their constructive comments on previous drafts.
Conflicts of Interest
The author declares no conflict of interest. The funders had no role in the design of the study; in the collection, analyses or interpretation of data; in the writing of the manuscript, or in the decision to publish the results.
References
- Directive 2000/60/EC; European Union. Directive 2000/60/EC of the European Parliament and of the Council of 23 Oct. 2000 Establishing a Framework for Community Action in the Field of Water Policy. Off. J. Eur. Commun. 2000, 327, 1–72. [Google Scholar]
- Schaumburg, J.; Schranz, C.; Hofmann, G.; Stelzer, D.; Schneider, S. Macrophytes and phytobenthos as indicators of ecological status in German lakes—A contribution of the implementation of the Water Framework Directive. Limnologica 2004, 34, 302–314. [Google Scholar] [CrossRef] [Green Version]
- Ciecierska, H. Macrophyte Based Indices of the Ecological State of Lakes—Dissertations and Monographs 139; Wyd. Uniwersytetu Warmińsko-Mazurskiego: Olsztyn, Poland, 2008; pp. 1–302. [Google Scholar]
- Kolada, A.; Ciecierska, H. Methods for lake macrophyte surveying in the light of biological monitoring required by water framework directive. Ochr. Śr. Zasobów Nat. 2006, 37, 9–23. [Google Scholar]
- Heinsalu, A.; Alliksaar, T. Palaeolimnological assessment of the reference conditions and ecological status of lakes in Estonia—Implications for the European Union Water Framework Directive. Est. J. Earth Sci. 2009, 58, 334–341. [Google Scholar] [CrossRef]
- Bolpagni, R.; Bresciani, M.; Fenoglio, S. Aquatic biomonitoring: Lessons from the past, challenges for the future. J. Limnol. 2017, 76, 1–4. [Google Scholar] [CrossRef] [Green Version]
- Bennion., H.; Battarbee, R. The European Union Water Framework Directive: Opportunities for palaeolimnology. J. Paleolimnol. 2007, 38, 285–295. [Google Scholar] [CrossRef]
- Hutorowicz, A.; Białowąs, M.; Długoszowski, B.; Doroszczyk, L. An attempt to assess the ecological status of a lake based on historical and current maps of submerged vegetation. Arch. Pol. Fish. 2017, 25, 33–42. [Google Scholar] [CrossRef] [Green Version]
- Ciecierska, H.; Kolada, A.; Ruszczyńska, J. Assessment of the ecological state of lakes using macrophytes. In Biological methods for the ecological state assessing of the environment. In Water Ecosystems; Ciecierska, H., Dynowska, M., Eds.; Wyd. Mantis, Olsztyn: Olsztyn, Poland, 2013; Volume 2, pp. 106–128. [Google Scholar]
- Rejewski, M. Lake Vegetation of the Laska Region in the Tuchola Forests; Treatises of Mikołaj Kopernik University Toruń: Toruń, Poland, 1981; pp. 1–178. [Google Scholar]
- Ciecierska, H.; Kolada, A.; Soszka, H.; Gołub, M. Development of methodological bases for biological monitoring of surface waters in terms of macrophytes and their pilot application for water bodies representing selected categories and types. Stage II Development of a methodology for field tests of macrophytes for the needs of routine water monitoring as well as a method for assessment and classification of ecological status of waters based on macrophytes. In Lakes; National Fund for Environmental Protection and Water Management IOŚ-UWM: Warszawa/Olsztyn, Poland, 2006; Volume 2, pp. 1–57. Available online: http://www.gios.gov.pl/images/dokumenty/pms/monitoring_wod/ESMI_metodyka.pdf (accessed on 7 March 2019).
- Ciecierska, H.; Kolada, A. ESMI: A macrophyte index for assessing the ecological status of lakes. Environ. Monitor. Assess. 2014, 186, 5501–5517. [Google Scholar] [CrossRef] [PubMed] [Green Version]
- Portielje, R.; Bertrin, V.; Denys, L.; Grinberga, L.; Karottki, I.; Kolada, A.; Krasovskienė, J.; Leiputé, G.; Mäemets, H.; Ott, I.; et al. Water Framework Directive Intercalibration Technical Report: Central Baltic Lake Macrophyte Ecological Assessment Methods; Publications Office of the European Union: Luxembourg, 2014; pp. 1–126. [Google Scholar] [CrossRef]
- Regulation of the Minister of the Environment. Regulation on the Classification of Ecological Status, Ecological Potential and Chemical Status of Surface Water Bodies; Official Journal of the Laws of 2008, No. 162, Item 1008; Regulation of the Minister of the Environment: Warszawa, Poland, 2008. [Google Scholar]
- Shannon, C.E.; Weaver, W. The Mathematical Theory of Communication; Urbana University of Illinois Press: Champaign, IL, USA, 1949; pp. 1–117. [Google Scholar]
- Choiński, A. Catalog of Polish Lakes; Wyd. Nauk. UAM: Poznań, Poland, 2006; pp. 1–600. [Google Scholar]
- Kolada, A.; Ciecierska, H.; Ruszczyńska, J.; Mjedle, M.; Dziedzic, J.; Dynowski, P.; Jasnorzeski, A. Macrophytes. In Ecological Status Assessment of the Waters in the Wel River Catchment. Guidelines for Integrated Assessment of Ecological Status of Rivers and Lakes to Support River Basin Management Plans; Soszka, H., Ed.; Wyd. IRS: Olsztyn, Poland, 2011; pp. 169–185. [Google Scholar]
- Soszka, H.; Ochocka, A. Supporting physico-chemical elements. In Ecological Status Assessment of the Waters in the Wel River Catchment. Guidelines for Integrated Assessment of Ecological Status of Rivers and Lakes to Support River Basin Management Plans; Soszka, H., Ed.; Wyd. IRS: Olsztyn, Poland, 2011; pp. 249–256. [Google Scholar]
- Dunalska, J.A.; Ciecierska, H.; Napiórkowska-Krzebietke, A.; Ruszczyńska, J.; Sieńska, J.; Szymański, D. Olsztyn Lakes—The Most Beautiful Gift of Nature. Trophic and Ecological Status; Wyd. Mantis: Olsztyn, Poland, 2017; pp. 1–164. [Google Scholar]
- Fisheries Management Reports for Lake Dąbrowa Mała; Inland Fisheries Institute: Olsztyn, Poland, 1968; pp. 1–17.
- Fisheries Management Reports for Lake Dąbrowa Wielka; Inland Fisheries Institute: Olsztyn, Poland, 1968; pp. 1–19.
- Fisheries Management Reports for Lake Kiełpińskie; Inland Fisheries Institute: Olsztyn, Poland, 1968; pp. 1–11.
- Fisheries Management Reports for Lake Lidzbarskie; Inland Fisheries Institute: Olsztyn, Poland, 1968; pp. 1–16.
- Fisheries Management Reports for Lake Rumian; Inland Fisheries Institute: Olsztyn, Poland, 1968; pp. 1–12.
- Regulation of the Minister of the Environment. Regulation of the Minister of the Environment of 21 July 2016 on How to Classify the Status of Surface Water Bodies and Environmental Quality Standards for Priority Substances; Official Journal of the Laws of 2016, Item 1187; Regulation of the Minister of the Environment: Warszawa, Poland, 2016. [Google Scholar]
- Keskitalo, J.; Salonen, K. Manual for Integrated Monitoring Subprogramme Hydrobiology of Lakes; Vesi-Ja Ympäristöhallinnon Julkaisuja, Sarja B 16; National Board of Waters and the Environment: Helsinki, Finland, 1994; pp. 28–30. [Google Scholar]
- TableCurve (Curve Fitting Software); Version 3.11; Manual; Systat Software: San Jose, CA, USA, 1992.
- Clayton, J.; Edwards, T. Aquatic plants as environmental indicators of ecological condition in New Zealand lakes. Hydrobiologia 2006, 570, 147–151. [Google Scholar] [CrossRef]
- Søndergaard, M.; Phillips, G.; Hellsten, S.; Kolada, A.; Ecke, F.; Mäemets, H.; Mjelde, M.; Azzella, M.M.; Oggioni, A. Maximum growing depth of submerged macrophytes in European lakes. Hydrobiologia 2013, 704, 165–177. [Google Scholar] [CrossRef]
- Chambers, P.A.; Kalff, J. Depth distribution and biomass of submersed aquatic macrophyte communities in relation to Secchi depth. Can. J. Fish. Aquat. Sci. 1985, 42, 701–709. [Google Scholar] [CrossRef]
- Poikane, S.; van den Berg, M.; Hellsten, S.; de Hoyosd, C.; Ortiz-Casas, J.; Pall, K.; Portielje, R.; Phillips, G.; Solheim, A.L.; Tierney, D.; et al. Lake ecological assessment systems and intercalibration for the European Water Framework Directive: Aims, achievements and further challenges. Procedia Environ. Sci. 2011, 9, 153–168. [Google Scholar] [CrossRef] [Green Version]
- Lukács, B.A.; Tóthmérész, B.; Borics, G.; Várbíró, G.; Juhász, P.; Kiss, B.; Müller, Z.; G-Tóth, L.; Erȍs, T. Macrophyte diversity of lakes in the Pannon Ecoregion (Hungary). Limnologica 2015, 53, 74–83. [Google Scholar] [CrossRef]
- Sender, J.; Maślanko, W.; Różańska-Boczula, M.; Cianfaglione, K. A new multi-criteria method for the ecological assessment of lakes: A case study from the Transboundary Biosphere Reserve ‘West Polesie’ (Poland). J. Limnol. 2017, 76, 60–74. [Google Scholar] [CrossRef] [Green Version]
- Ozimek, T.; Kowalczewski, A. Long-term changes of the submerged macrophytes in eutrophic lake Mikołajskie (North Poland). Aquat. Bot. 1984, 19, 1–11. [Google Scholar] [CrossRef]
- Røslett, B. Principal determinants of aquatic macrophyte richness in northern European lakes. Aquat. Bot. 1991, 39, 173–193. [Google Scholar] [CrossRef]
- Arts, G.H.P. Deterioration of Atlantic soft water macrophyte communities by acidification, eutrophication and alkalinisation. Aquat. Bot. 2002, 73, 373–393. [Google Scholar] [CrossRef]
- Kolada, A. Role of biological indicators in the assessment of selected surface water bodies protected areas quality. Ochr. Śr. Zasobów Nat. 2008, 38, 24–42. [Google Scholar]
- Moe, J.; Lyche Solheim, A. Integrated ecological status assessment and risk assessment of incorrect classification. In Ecological Status Assessment of the Waters in the Wel River Catchment. Guidelines for Integrated Assessment of Ecological Status of Rivers and Lakes to Support River Basin Management Plans; Soszka, H., Ed.; Wyd. IRS: Olsztyn, Poland, 2011; pp. 267–290. [Google Scholar]
Figure 1.
Location of study lakes in Poland. Black Circles—five lakes in the catchment area of the Wel River; Green circles—11 lakes located near Olsztyn. 1,3,7—number of the lakes. Blue line determines the area of the last glaciation.
Figure 1.
Location of study lakes in Poland. Black Circles—five lakes in the catchment area of the Wel River; Green circles—11 lakes located near Olsztyn. 1,3,7—number of the lakes. Blue line determines the area of the last glaciation.

Figure 2.
Relationships between the number of transects in maps and the relative error of the mean error of a single measurement of maximum macrophyte depth (Cmax) in for lakes in the Wel Landscape Park. The green line indicates an error of 0.1 m. The orange line indicates an error of 0.2 m.
Figure 2.
Relationships between the number of transects in maps and the relative error of the mean error of a single measurement of maximum macrophyte depth (Cmax) in for lakes in the Wel Landscape Park. The green line indicates an error of 0.1 m. The orange line indicates an error of 0.2 m.

Figure 3.
Relationships between: (A) maximum macrophyte depth Cmax (Equation (4)); (B) colonization index Z (Equation (5)) and (C) Secchi disc visibility SD (Equation (6)) in ecological status classes on a scale of 1–5 in Polish stratified lakes (marked with squares; orange square—point eliminated from analyses) and five lakes in the Wel Landscape Park (marked with triangles). Source of data: Ciecierska et al. [9]; Kolada et al. [17].

Figure 4.
Correlation between the ESMI calculated for 11 lakes in the vicinity of Olsztyn surveyed in 2016 with the original method ESMI [19] and the proposed Eq formulas (based on colonization index Z, maximum colonization depth Cmax and mean Secchi disc visibility in summer).
Figure 4.
Correlation between the ESMI calculated for 11 lakes in the vicinity of Olsztyn surveyed in 2016 with the original method ESMI [19] and the proposed Eq formulas (based on colonization index Z, maximum colonization depth Cmax and mean Secchi disc visibility in summer).


Table 1.
Mean values of the indicators used in the Ecological State Macrophyte Index (ESMI) approach (Z—colonization index, Cmax—maximum vegetation depth) and mean SD (Secchi disc) of 88 lakes in northern Poland and the Łęczyńsko-Włodawskie Lake District (after Ciecierska et al. [3]).
Table 1.
Mean values of the indicators used in the Ecological State Macrophyte Index (ESMI) approach (Z—colonization index, Cmax—maximum vegetation depth) and mean SD (Secchi disc) of 88 lakes in northern Poland and the Łęczyńsko-Włodawskie Lake District (after Ciecierska et al. [3]).
| Ecological Status | Cmax (m) | Z | SD |
|---|---|---|---|
| High | 4.96 | 1.67 | 4.2 |
| Good | 2.72 | 1.16 | 1.9 |
| Moderate | 1,92 | 0.49 | 1.3 |
| Poor | 1.90 | 0.54 | 1.2 |
| Bad | 1.50 | 0.09 | 1.1 |
Table 2.
Hydromorphological characteristics and aquatic vegetation parameters (Z—colonization index, Cmax—maximum vegetation depth; SD—Secchi disc) in the growing season of 2009 of lakes, which were used to develop the macrophyte-based method for a retrospective evaluation of the ecological status of lakes.
| Lake | Hydromorphological Characteristics | Aquatic Vegetation Parameters | ESMI 1 | ||||
|---|---|---|---|---|---|---|---|
| Area (ha) | Mean Depth (m) | Max. Depth (m) | Cmax (m) 1 | Z 1 | SD 2 | ||
| Lidzbarskie | 121.8 | 10.0 | 25.5 | 4.2 | 1.6 | 2.4 | 0.352 |
| Dąbrowa Wielka | 616.4 | 8.2 | 34.7 | 3.0 | 1.07 | 1.5 | 0.797 |
| Dąbrowa Mała | 173.4 | 10.0 | 34.5 | 2.2 | 0.68 | 1.3 | 0.518 |
| Rumian | 305.8 | 6.5 | 14.4 | 1.9 | 0.61 | 1.2 | 0.415 |
| Kiełpińskie | 60.8 | 6.1 | 11.0 | 3.4 | 0.82 | 3.3 | 0.425 |
Table 3.
Morphometric information, aquatic vegetation parameters (Z—colonization index, Cmax—maximum vegetation depth; SD—Secchi disc) and the values of the Ecological Status Macrophyte Index (ESMI) in lakes in vicinity Olsztyn in the growing season of 2016, after Dunalska et al. [19].
Table 3.
Morphometric information, aquatic vegetation parameters (Z—colonization index, Cmax—maximum vegetation depth; SD—Secchi disc) and the values of the Ecological Status Macrophyte Index (ESMI) in lakes in vicinity Olsztyn in the growing season of 2016, after Dunalska et al. [19].
| Lake | Area (ha) | Mean Depth (m) | Maximum Depth (m) | Cmax (m) | Z | SD (m) | ESMI |
|---|---|---|---|---|---|---|---|
| Czarne | 1.48 | 2.7 | 7.1 | 4.1 | 1.4 | 1.5 1 | 0.728 |
| Długie | 26.8 | 5.3 | 17.3 | 5.5 | 2.42 | 2.9 1 | 0.953 |
| Kortowskie | 89.7 | 5.9 | 17.2 | 3.7 | 1.17 | 1.4 1 | 0.580 |
| Podkówka | 6.92 | 2.85 | 6.0 | 1.9 | 0.39 | 1.6 1 | 0.253 |
| Redykajny | 29.9 | 8.0 | 20.6 | 6.3 | 1.81 | 2.2 1 | 0.861 |
| Skanda | 51.1 | 5.8 | 12.0 | 2.5 | 0.93 | 1.5 1 | 0.499 |
| Starodworskie | 6.0 | 9.0 | 23.3 | 2.9 | 0.9 | 2.3 1 | 0.568 |
| Sukiel | 20.8 | 6.6 | 25.0 | 6.7 | 2.16 | 1.3 2 | 0.911 |
| Trackie | 52.8 | 2.1 | 3.8 | 2.1 | 0.57 | 0.9 1 | 0.343 |
| Tyrsko | 18.6 | 9.6 | 30.4 | 6.4 | 1.78 | 4.1 1 | 0.814 |
| Ukiel | 412 | 10.6 | 43.0 | - | - | - | - |
| - Gutkowski Basin | - | - | - | 6.3 | 1.94 | 3.4 1 | 0.833 |
| - Łupstyski Basin | - | - | - | 5.6 | 1.8 | 3.8 1 | 0.734 |
| - Olsztyński Basin | - | - | - | 5.5 | 2.32 | 3.2 1 | 0.824 |
| - Przejma Basin | - | - | - | 5.6 | 1.88 | 3.6 1 | 0.802 |
1 Average value from the summer of 2015 and 2016; 2 Late summer 2016.
Table 4.
Survey dates and read from bathymetric plans the aquatic vegetation parameters (Z—colonization index, Cmax—maximum vegetation depth; SD—Secchi disc) in five lakes in the Wel Landscape Park in the 1960s.
Table 4.
Survey dates and read from bathymetric plans the aquatic vegetation parameters (Z—colonization index, Cmax—maximum vegetation depth; SD—Secchi disc) in five lakes in the Wel Landscape Park in the 1960s.
| Lake | Survey Dates | Aquatic Vegetation Parameters | ||||
|---|---|---|---|---|---|---|
| Bathymetric | Abundance | Water Transparency | Cmax (m) | Z | SD | |
| Lidzbarskie | March 1964 | 1964–1967 | 23/08/1967 | 1.5 | 0.56 | 1.7 |
| Dąbrowa Wielka | February 1963 | 1963–1967 | 27/08/1964 | 4.0 | 1.13 | 4.5 |
| Dąbrowa Mała | February 1959 | 1960–1967 | ? | 4.0 | 1.62 | 2.0 |
| Rumian | March 1962 | 1964–1967 | 29/08/1964 | 3.4 | 1.01 | 1.9 |
| Kiełpińskie | March1965 | 1965–1967 | 23/08/1967 | 2.3 | 0.86 | 4.2 |
Table 5.
Boundary values of the ESMI ecological status assessment index [25].
Table 5.
Boundary values of the ESMI ecological status assessment index [25].
| Ecological Status | ESMI Boundary Values |
|---|---|
| High | ≥0.680 |
| Good | ≥0.410 |
| Moderate | ≥0.205 |
| Poor | ≥0.070 |
| Bad | <0.07 |
Table 6.
Characteristics of lakes—the basis for determining the minimum number of transects on bathymetry plans to calculate the vegetation depth Cmax.
Table 6.
Characteristics of lakes—the basis for determining the minimum number of transects on bathymetry plans to calculate the vegetation depth Cmax.
| Lake | Scale of Map | Number of Transects | Maximum Number of Transects with mi > 10 cm |
|---|---|---|---|
| Lidzbarskie | 1:5000 | 143 | 70 |
| Dąbrowa Wielka | 1:10,000 | 126 | 81 |
| Dąbrowa Mała | 1:5000 | 116 | 75 |
| Rumian | 1:5000 | 111 | 43 |
Table 7.
Values of the Ecological Status Macrophyte Index ESMI (after Dunalska et al. [19]) and EqEQR in lakes in vicinity Olsztyn in the growing season of 2016.
Table 7.
Values of the Ecological Status Macrophyte Index ESMI (after Dunalska et al. [19]) and EqEQR in lakes in vicinity Olsztyn in the growing season of 2016.
| Lake | ESMI | EqEQR |
|---|---|---|
| Czarne | 0.728 | 0.666 |
| Długie | 0.953 | 0.841 |
| Kortowskie | 0.580 | 0.596 |
| Podkówka | 0.253 | 0.376 |
| Redykajny | 0.861 | 0.795 |
| Skanda | 0.499 | 0.516 |
| Starodworskie | 0.568 | 0.577 |
| Sukiel | 0.911 | 0.790 |
| Trackie | 0.343 | 0.259 |
| Tyrsko | 0.814 | 0.829 |
| Ukiel | - | - |
| - Gutkowski Basin | 0.833 | 0.830 |
| - Łupstyski Basin | 0.734 | 0.814 |
| - Olsztyński Basin | 0.824 | 0.841 |
| - Przejma Basin | 0.802 | 0.818 |
Table 8.
Values of the Ecological Status Macrophyte Index ESMI (after Kolada et al. [17]) and EqEQR in five lakes in the Wel Landscape Park in the 1960s and in the growing season of 2009.
Table 8.
Values of the Ecological Status Macrophyte Index ESMI (after Kolada et al. [17]) and EqEQR in five lakes in the Wel Landscape Park in the 1960s and in the growing season of 2009.
| Lake | 1959–1967 | 2009 | |
|---|---|---|---|
| EqEQR | EqEQR | ESMI 1 | |
| Dąbrowa Wielka | 0.799 | 0.801 | 0.797 |
| Dąbrowa Mała | 0.745 | 0.497 | 0.518 |
| Rumian | 0.499 | 0.407 | 0.415 |
| Lidzbarskie | 0.370 | 0.354 | 0.352 |
| Kiełpińskie | 0.536 | 0.447 | 0.425 |
1 Source: Kolada et al. [17].
© 2020 by the author. Licensee MDPI, Basel, Switzerland. This article is an open access article distributed under the terms and conditions of the Creative Commons Attribution (CC BY) license (http://creativecommons.org/licenses/by/4.0/).
Share and Cite
MDPI and ACS Style
Hutorowicz, A. A Retrospective Ecological Status Assessment of the Lakes Based on Historical and Current Maps of Submerged Vegetation—A Case Study from Five Stratified Lakes in Poland. Water 2020, 12, 2607. https://doi.org/10.3390/w12092607
AMA Style
Hutorowicz A. A Retrospective Ecological Status Assessment of the Lakes Based on Historical and Current Maps of Submerged Vegetation—A Case Study from Five Stratified Lakes in Poland. Water. 2020; 12(9):2607. https://doi.org/10.3390/w12092607
Chicago/Turabian StyleHutorowicz, Andrzej. 2020. "A Retrospective Ecological Status Assessment of the Lakes Based on Historical and Current Maps of Submerged Vegetation—A Case Study from Five Stratified Lakes in Poland" Water 12, no. 9: 2607. https://doi.org/10.3390/w12092607
Note that from the first issue of 2016, this journal uses article numbers instead of page numbers. See further details here.