Autumn Phenological Response of European Beech to Summer Drought and Heat
by
 , ,
, ,
Veronika Lukasová
1,* ,
,
Jaroslav Vido
2,
Jana Škvareninová
3,
Svetlana Bičárová
1,
Helena Hlavatá
4,
Peter Borsányi
5 and
Jaroslav Škvarenina
2,* 1
Earth Science Institute, Slovak Academy of Sciences, Stará Lesná, 059 60 Tatranská Lomnica, Slovakia
2
Faculty of Forestry, Technical University in Zvolen, T. G. Masaryka 24, 960 53 Zvolen, Slovakia
3
Faculty of Ecology and Environmental Sciences, Technical University in Zvolen, T. G. Masaryka 24, 960 53 Zvolen, Slovakia
4
Slovak Hydrometeorological Institute, Ďumbierska 26, 040 01 Košice, Slovakia
5
Slovak Hydrometeorological Institute, Zelená 5, 974 04 Banská Bystrica, Slovakia
*
Authors to whom correspondence should be addressed.
Water 2020, 12(9), 2610; https://doi.org/10.3390/w12092610
Submission received: 6 August 2020
/
Revised: 14 September 2020
/
Accepted: 16 September 2020
/
Published: 18 September 2020
(This article belongs to the Special Issue Impact of Natural Hazards on Forest Ecosystems and Their Surrounding Landscape under Climate Change)
Abstract
:The changes in precipitation and temperature regimes brought on by the current climate change have influenced ecosystems globally. The consequences of climate change on plant phenology have been widely investigated during the last few years. However, the underlying causes of the timing of autumn phenology have not been fully clarified yet. Here, we focused on the onset (10%) of leaf colouring—LCO—(Biologische Bundesanstalt, Bundessortenamt und Chemische Industrie (BBCH) 92) of European beech (Fagus sylvatica, L.) as an important native tree species growing throughout Europe. Studied beech stands are located along the natural distribution range of the European beech in Western Carpathians (Slovakia) at different altitudes from lowlands (300 m a.s.l.) to uplands (1050 m a.s.l.) and climatic regions from warm to cold. To define limiting climate conditions for LCO, we established several bioclimatic indices as indicators of meteorological drought: climatic water balance (CWB), standardized precipitation index (SPI), standardized precipitation-evapotranspiration index (SPEI), dry period index (DPI), and heat waves (HW). In addition, meteorological variables such as monthly mean temperatures and precipitation totals were taken into account. Throughout the 23-year period (1996–2018) of ground-based phenological observations of temperate beech forests, the timing of LCO was significantly delayed (p ≤ 0.05) in the middle to high altitudes, while in the lowest altitude, it remained unchanged. Over the last decade, 2009–2018, LCO in middle altitudes started at comparable to low altitudes and, at several years, even later. This resulted mainly from the significant negative effect of drought prior to this phenological phase (p ≤ 0.01) expressed through a 1-month SPI in September (SPIIX) at the stand at the low-altitude and warm-climatic region. Our results indicate that the meteorological drought conditioned by lower total precipitation and higher evapotranspirative demands in the warmer climate advance leaf senescence. However, at present time, growth in rising temperature and precipitation is acceptable for most beech stands at middle to high altitudes. Beech utilizes these conditions and postpones the LCO by 0.3–0.5 and 0.6–1.2 day per year at high and middle altitudes, respectively. Although we show the commencing negative effect of drought at mid-altitudes with lower (below 700 mm) total annual precipitation, the trend of LCO in favourable warm climates is still significantly delayed. The ongoing warming trend of summer months suggests further intensification of drought as has started to occur in middle altitudes, spreading from the continual increase of evapotranspiration over the next decades.
1. Introduction
Under climate change, there is an alteration in the temperature and precipitation regimes. The mean global air temperature has increased over the last decades, and the occurrence of temperature extremes has increased [1]. Furthermore, continued enhancement of frequency and severity of drought events, particularly in the Northern hemisphere, is expected [2,3,4]. Models of future climate for Central Europe predict increased frequency and severity of heat stress and drought [5,6]. For most of the temperate continental zone, an increase of annual mean temperature of 3–4 °C might be expected until the end of the century [7,8]. The increase in temperature is accompanied by enhanced evapotranspirative demand imposed on the forest [9] and agricultural ecosystems [10], and these, if undersupplied with water, will dry [11]. Heat waves and droughts have significant impacts on their own, but when they occur simultaneously, their negative effects could be greatly intensified. Although drought stress highly depends on meteorological conditions, it relates to the power of tolerance and resistance of plants.
This study focuses on the European beech (Fagus sylvatica, L., ssp. sylvatica) response to such changing climate evaluated in natural conditions. European beech is one of the most important native tree species in Europe with the spatial distribution covering most of the European continent [12]. Due to high genetic diversity and phenotypic plasticity, F. sylvatica is adapted to different environments and altitudinal zones within its natural range [13]. This makes it a good reference species for large-scale studies of plastic and adaptive responses in its fitness-related traits to climate change over its full distribution range [14]. With regard to the altitudinal distribution of European beech, it is assumed that beech forests growing at low altitudes will suffer from drought [8,15,16,17]. Forests exposed to drought are mostly endangered by biotic factors, such as documented declination of beech vitality followed by the biotic damage and mortality in Hungarian and Slovenian forests [15,18]. Furthermore, under limited water availability, beech may suffer from xylem embolism, restricted nutrient uptake capacity, and reduced growth. Similarly, negative impact on nutrient uptake and growth of beech could have waterlogged soils due to higher than average precipitation throughout the growing season [19]. In beech forests, the silvicultural practices today must be aware of the potential risks, which a changing climate may impose on sustainable forest management. Compared to other tree species, the competitive capacity of beech might be reduced under expected future climate conditions [19].
Since trees as long-lived plants adapt to the climatic seasonality through phenology, it is considered a good indicator of changing climate conditions [20,21,22,23,24,25]. Under climate actions, plants could shift the onset of phenological phases and thus extend or shorten their growing seasons as the photosynthetically active period modulates ecosystem carbon balance [26,27]. In temperate forests, the temperature [28,29,30,31] was determined to be the main driving factor for the onset of leafing, although the effect of photoperiod [32] and soil water content [33] as prominent factors are sometimes evoked. However, the clear determination of the response of leaf senescence to the associated environmental controls is more difficult. We considered potential indices in order to predict autumn phenological response to climate conditions and extreme events, those based on water movement in the plant–atmosphere system (evapotranspiration), those based on water availability (precipitation), and those based on temperature requirements and forcing (temperature).
We used three decades of meteorological observations (1989–2018) along with phenological observations (1996–2018) of beech stands growing at different altitudes and climate conditions in Central Europe (Slovakia) to analyse the consequences of drought and heat on beech autumn leaf colouration. We hypothesize the following:
- (1)
- The climate change causes significant changes in temperature and precipitation regimes and thus affects the timing of the onset of leaf colouring in European beech stands.
- (2)
- Temperature-, evapotranspiration- and precipitation-based bioclimatological indices and variables of summer months can explain the shifts of the onset of leaf colouring.
The results of the analysis provide an opportunity to consider under which conditions beech can utilize the changing climate to extend the vegetation period and where it is limited and less productive.
2. Materials and Methods
2.1. Field Observations and Stand Descriptions
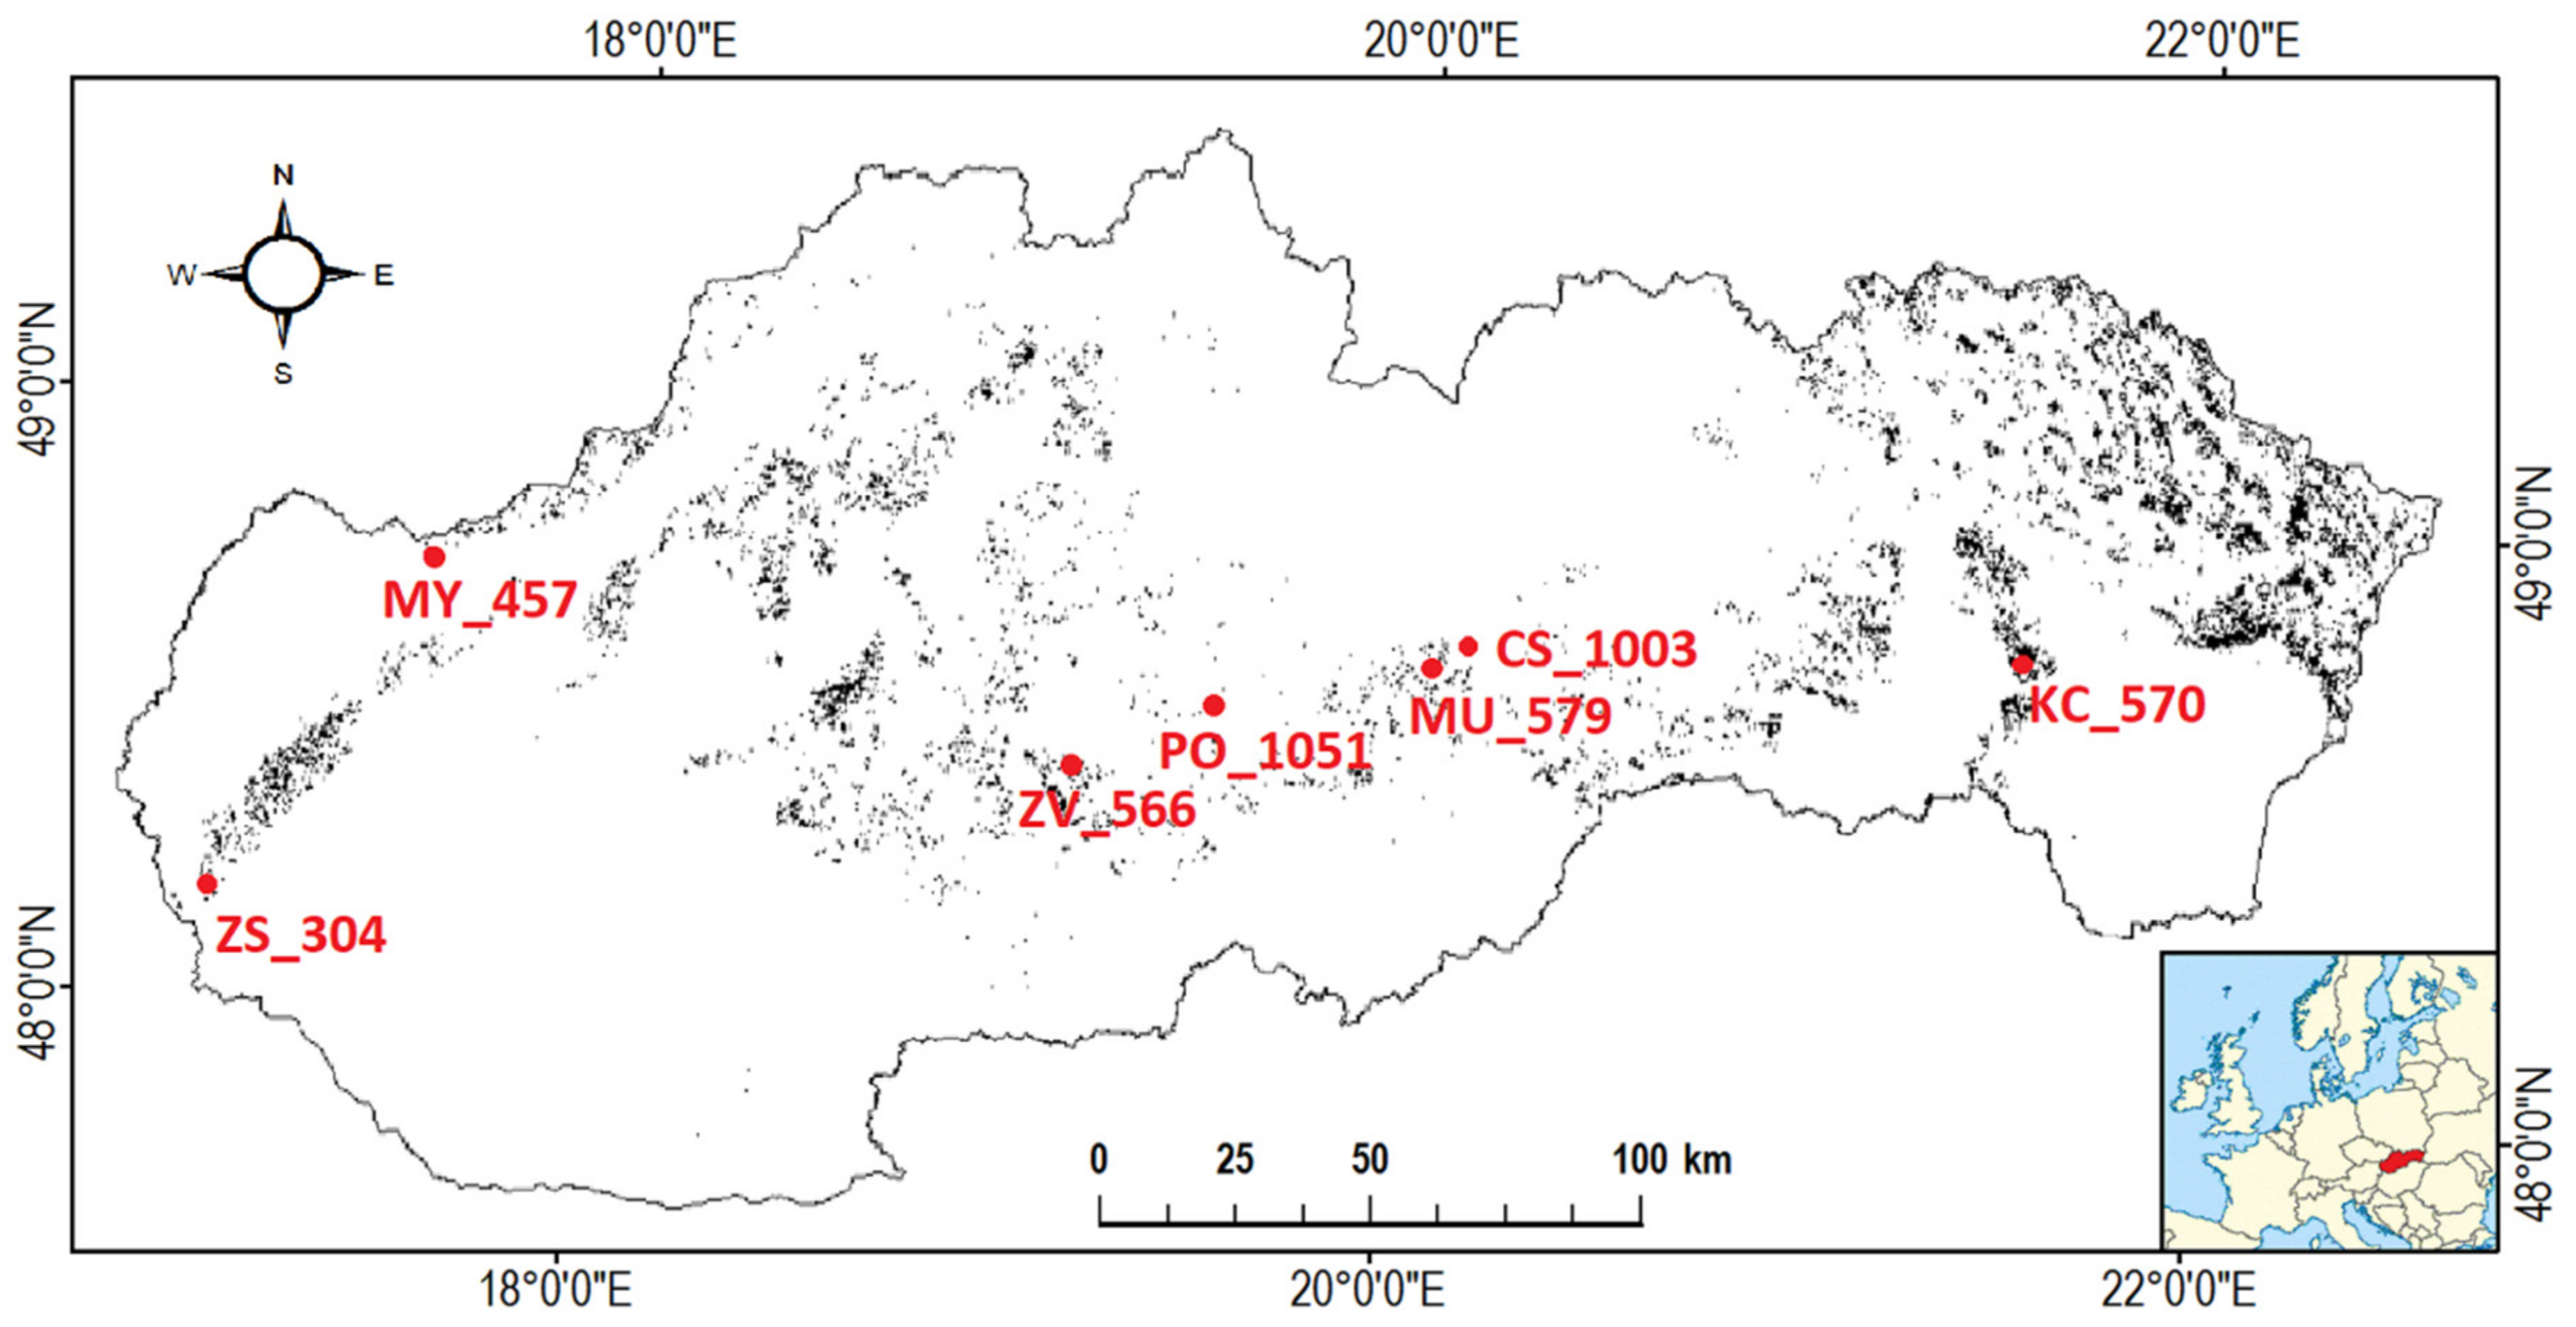
The studied beech stands are located in the Western Carpathians (Slovakia), in the latitude range between 48° and 49° N and in the longitude range between 17° and 22° E (Figure 1), and belong to the phenological network of the Slovak Hydrometeorological Institute (SHMI). SHMI is a specialized organization providing hydrological and meteorological services at the national and international levels. The phenological database of SHMI administrates a set of continual phenological observation data in natural conditions of the main ecosystems from 218 phenological stations [34]. This species-specific study focuses on seven beech-dominated (Fagus sylvatica, L.) stands located at different altitudes ranging between 300 m and 1050 m a.s.l. in three main climatic areas: warm, moderately warm, and cold. The characteristic of the climate was obtained from the Atlas of the Country of the Slovak Republic [35]. Temperature and precipitation conditions at each stand are characterized by temperature and precipitation normal in Table 1. Stands in this study are marked by the abbreviation of location and the altitude (Figure 1 and Table 1). The soil type present at all stands is deep cambisol with a slightly acidic to acidic reaction [36]. According to the altitude, we differentiated stands as low (below 500 m), middle (500–1000 m), and high altitude (above 1000 m). Here, we analysed a 23-year long (1996–2018) sequence of phenological data to evaluate the factors driving the onset of leaf colouring (LCO)) in different altitudes.
The evaluated phenological phase LCO represents the beginning of autumn phenological phases. According to the methodology of Slovak Hydrometeorological Institute (SHMI) [37], LCO occurs when 10% of leaves change their colour from green to yellow, red, or brown. According to the international phenological scale BBCH (Biologische Bundesanstalt, Bundessortenamt und Chemische Industrie) [38], this phenological phase corresponds to the code BBCH 92. The ground phenological measurements consist of visual observations of phenological phases performed by the same observer on the same 10 individual trees from the main canopy. The main canopy is formed by mature tree crowns of the upper layer. The onset days of the phenological phases of the individuals are noticed and averaged over this group of 10 trees. Only beech stands with trees of ages above 50 years creating the main canopy were included in the analysis. The position of the trees is inside the forest, at least 50 m from the forest edge. Phenological observations are carried out regularly during the onset of spring vegetative and generative phenological phases occur every 2–3 days; in the autumn, they occur at least once a week. The SHMI manages the observations performed by volunteers.

Table 1.
The basic characteristics of beech stands were obtained from the website of the National Forest Center (© NLC Zvolen, 2020) [39]. The stand identifier (ID) consist of the abbreviations of the stand location and the altitude. The characteristics of soils obtained from the soil portal (© VÚPOP Bratislava): retention capacity (Ret.) and permeability (Perm.) of soil have 3 main degrees—low (L), medium (M), and high (H)—and 2 intermediates—low to medium (L–M) and medium to high (M–H) [35].
| Beech Stand Location /Characteristics | Železná Studienka | Myjava | Zvolen | Kecerovce | Muráň | Červená Skala | Po’ana |
|---|---|---|---|---|---|---|---|
| Altitude (m a.s.l.) | 304 | 457 | 566 | 570 | 579 | 1003 | 1051 |
| Stand ID | ZS_304 | MY_457 | ZV_566 | KC_570 | MU_579 | CS_1003 | PO_1051 |
| Soil type | C 1 | C | C | C | C | C | C |
| Soil Ret./Perm. | L–M/M–H | H/M | H/M | H/M | H/M | H/M | M/M |
| Age | 150 | 65 | 80 | 75 | 115 | 75 | 155 |
| Tree height (m) | 26 | 19 | 25 | 22 | 28 | 15 | 24 |
| Trunk diameter (cm) | 36 | 22 | 23 | 25 | 32 | 18 | 45 |
| Climatic area | W 2 | M 3 | M | M | M | C 4 | C |
| TNy 5 (°C) | 10.1 | 9 | 8 | 8.1 | 7.9 | 5.2 | 5.7 |
| TNs 6 (°C) | 18 | 16.3 | 15.8 | 15.9 | 15.9 | 12.7 | 13 |
| PNy 7 (mm) | 675 | 729 | 745 | 703 | 689 | 857 | 863 |
| PNs 8 (mm) | 176 | 176 | 190 | 239 | 198 | 241 | 263 |
1 Cambisol, 2 warm, 3 moderately warm, 4 cold, 5 yearly temperature normal, 6 temperature normal of summer months (July–September), 7 yearly precipitation normal, and 8 precipitation normal of summer months (July–September).
We derived four meteorological drought indices which may act as weather stressors inducing the shifts in the beginning of leaf colouring (LCO) in beech-dominated stands: climatic water balance (CWB), standardized precipitation index (SPI), standardized precipitation-evapotranspiration index (SPEI) and dry period index (DPI), and the heat stress factor—heatwaves (HW). The meteorological data in daily and monthly time-steps entering into the calculations of those indices were acquired from the network of automatic meteorological stations of SHMI. The crucial criteria to linking data from the phenological and the meteorological stations were a maximum distance less than 20 km, similar altitude, and the same climatic area. The indices were modified according to their suitability to correlate with phenological events since they are usually calculated for a period of a year. The time scales are distinguished with indices bearing the number of analysed months.
2.2. Standardized Precipitation Index (SPI)
Standardized precipitation index (SPI) is a precipitation-based index developed by McKee et al. [40] to quantify a precipitation deficit for several time scales. It was designed to be an indicator of drought that recognizes the importance of time scales in the analysis of water availability and water use [41]. In this study, SPI is used as an indicator of meteorological drought, which is able to recognize both short-term and long-term precipitation deficits. In this study, we used SPI calculated for 1 and 3 months prior to leaf senescence to determine conditions inducing drought stress in plants leading to earlier beginning of leaf colouration. The time scales of SPI were set to cover the last months before leaf senescence start to determine conditions inducing drought stress in plants leading to an earlier beginning of leaf colouration. Since LCO generally begins at the beginning of October, we calculated the SPI of September and SPI of three summer months—July to September—and distinguished it with as index bearing the number of analysed months (SPIIX and SPIVII–IX). To compute the SPI, precipitation data series were fitted to a gamma probability distribution function as follows:
where
where x is precipitation in mm at a certain time scale, α represents the shape parameter, β is a scale parameter, and Γ(α) defines the gamma function. Since the gamma function is not defined for x = 0, the cumulative probability is calculated as follow:
where q is the probability of a zero estimated by m/n and m is the number of zeros in precipitation time series n.
Finally, the cumulative probability H(x) is transformed to the standard normal value (Z) or SPI using an approximation by Abramowitz and Stegun [42]:
and
where
c0 = 2.515517, c1 = 0.802853, c2 = 0.010328, d1 = 1.432788, d2 = 0.189269, and d3 = 0.001308.
2.3. Standardized Precipitation-Evapotranspiration Index (SPEI)
Temperature rise has a strong role in affecting the severity of droughts [44,45]. In this study, the importance of the effect of temperature on drought conditions through the potential evapotranspiration (PET) was taken into account by the use of the standardized precipitation-evapotranspiration index (SPEI). A crucial advantage of the SPEI over other widely used drought indices that consider the effect of PET on drought severity is that its multi-scalar characteristics enable the identification of different drought types and impacts in the context of global warming [46]. In the original version of the SPEI, the Thornthwaite equation [47] was applied to obtain the PET in SPEIbase v1.0. With a value for PETi, a simple measure of the water surplus or deficit (Di) for the analysed month i was calculated using a precipitation (Pi) as follows:
The calculated Di values are combined at different time scales, following the same procedure as that for the SPI. Standardization of SPEI using the probability density function of a three parameter Log-logistic distributed variable is described in Vicente-Serrano et al. [46]. The time scales for SPEI calculation were set to correspond with the SPI–SPEI of September (SPEIIX) and the SPEI of July to September SPEIVII–IX.
2.4. Climatic Water Balance (CWB)
CWB is an indicator of drought referring to the balance between income of water from precipitation and the outflow of water by potential evapotranspiration [16,48]. The potential evapotranspiration can be generally defined as the amount of water that could evaporate and transpire from a vegetated landscape without restrictions other than the atmospheric demand [49]. The negative CWB indicates the lack of disposed water in the environment. The climatic water balance was calculated according to the modified method of Thornthwaite and Mather [50], where the CWBm is the difference between the precipitation total (Pm) and potential evapotranspiration (PETm) of month m:
The potential evapotranspiration of the month PETm in mm was calculated as follows:
where Tm (°C) is the monthly mean temperature of analysed months and f is the correction factor depending on the month length and latitude:
where k is a coefficient of number of days and so is the maximum duration of sunshine during the day (h).
I is the temperature index as a sum of values of the monthly temperature indices:
a is an exponent calculated from the temperature index I:
In this study, we calculated CWB for September (CWBIX) and the incidence of meteorological drought was indicated, when the potential evapotranspiration transcended the actual precipitation. We created a classification scale differentiated into seven categories similar to that for SPI and SPEI. The thresholds for the drought levels were determined in consideration of the average monthly precipitation totals and average potential evapotranspiration totals (Table 3).
2.5. Dry Period Index (DPI)
We introduced DPI as an indicator of drought capable of identifying a small amount of rainfall as well as its irregular distribution over the season, and it complements the SPIVII–IX and SPEIVII–IX data. It is understood that, the more dry days in a row and the less precipitation over the period, the bigger the stress introduced on a tree is. The dry period characterizes a period of the year with precipitation less than 0.3 mm per day [51,52], provided that the precipitation is intercepted by aboveground parts of trees and evaporated as an unproductive evaporation [52,53]. In this study, we evaluated dry periods (DP) as periods of 5 or more consecutive days with precipitation less than 0.3 mm evaluated over three summer months: July–September. Duration of each DP was noticed and summarized over the studied period: DP = n (days ≥ 5, p ≤ 0.3 mm). Dry period index (DPI) considers the total number of days in DP and the precipitation total over the studied season as follow:
where DPi is the length of dry period i and Pm is the precipitation total (mm) of a month m. A classification scale was created to divide DPI values into four stages of drought (Table 4).
2.6. Heatwaves (HW)
A heatwave (HW) is a temperature-based indicator of meteorological drought inducing drying of the environment. In particular, heat waves occurring in summer result in an increased evapotranspirative demand from soil and plants, which, if not met by adequate water resources in the soil, eventually results in the development of concurrent drought stress [54]. The heatwave involves prolonged periods of extremely high temperatures for a particular region [11]. Regarding to the variety of HW definitions, here, we prefer the definition introduced by the Expert Team on Climate Change Detection and Indices (ETCCDI) adjusted according to Russo et al. [55]. Heatwave was characterized as 3 or more consecutive days that are above the 90th percentile temperature of the normal period between 1981–2010. The advantage of using relative-based thresholds such as high percentile values is allowance of the measurement of heatwaves across various locations over long periods when temperatures are substantially higher than normal. We calculated the 90th percentile from the daily average and maximum temperatures of the normal period 1981–2010 for all individual beech stands and noted all HWs longer than 3 days. The individual heatwave days were then aggregated into the total number of heatwave days over the hottest months: June–August. We used HWAVG when calculating HW from average daily temperatures and HWMAX when HW was calculated from the maximum daily temperatures. According to the duration of HW, we created the classification scale differentiated into 5 stages of HW strengths (Table 5). It is understood that, the more days in heatwave, the more stress could be induced to the tree. Since the occurrence of HWs depends on atmospheric circulation patterns [55], we evaluated the spatial difference of their incidence.
2.7. Statistical Analysis
The linear regression between autumn leaf colouring and bioclimatic indices and variables and the spring leaf onset were analysed. The shifts in leaf phenology per 1 degree increase in temperature (day °C−1) were determined using the regression coefficient of the corresponding linear regressions to compare the phenological sensitivities between altitudes (stands). The significant correlation was determined at p ≤ 0.05 and was highly significant at p ≤ 0.01.
The age of the studied beech trees is over 50 years. To examine the evolution of temperature and precipitation over the last 30 years, these meteorological variables were compared to the normal from the earlier growing stages of studied beech stands (1961–1990). The differences between actual and normal summer temperatures and precipitations were tested with the paired sample t-test. The H0 hypothesis supposed stable climatic conditions, while HA expected significant differences at the p level ≤ 0.05.
The evolution of beech phenology over the period between 1996–2018 along an altitudinal gradient and trends of bioclimatic indices and variables over 1989–2018 was evaluated by the nonparametric Mann–Kendal (M-K) trend test with the significance level set for p ≤ 0.05 and was highly significant for p ≤ 0.01. The shifts in leaf phenology per year increase were calculated using the Sen’s slopes of the M-K trend and compared between stands (altitudes).
3. Results
3.1. Precipitation and Indices Indicating the Drought
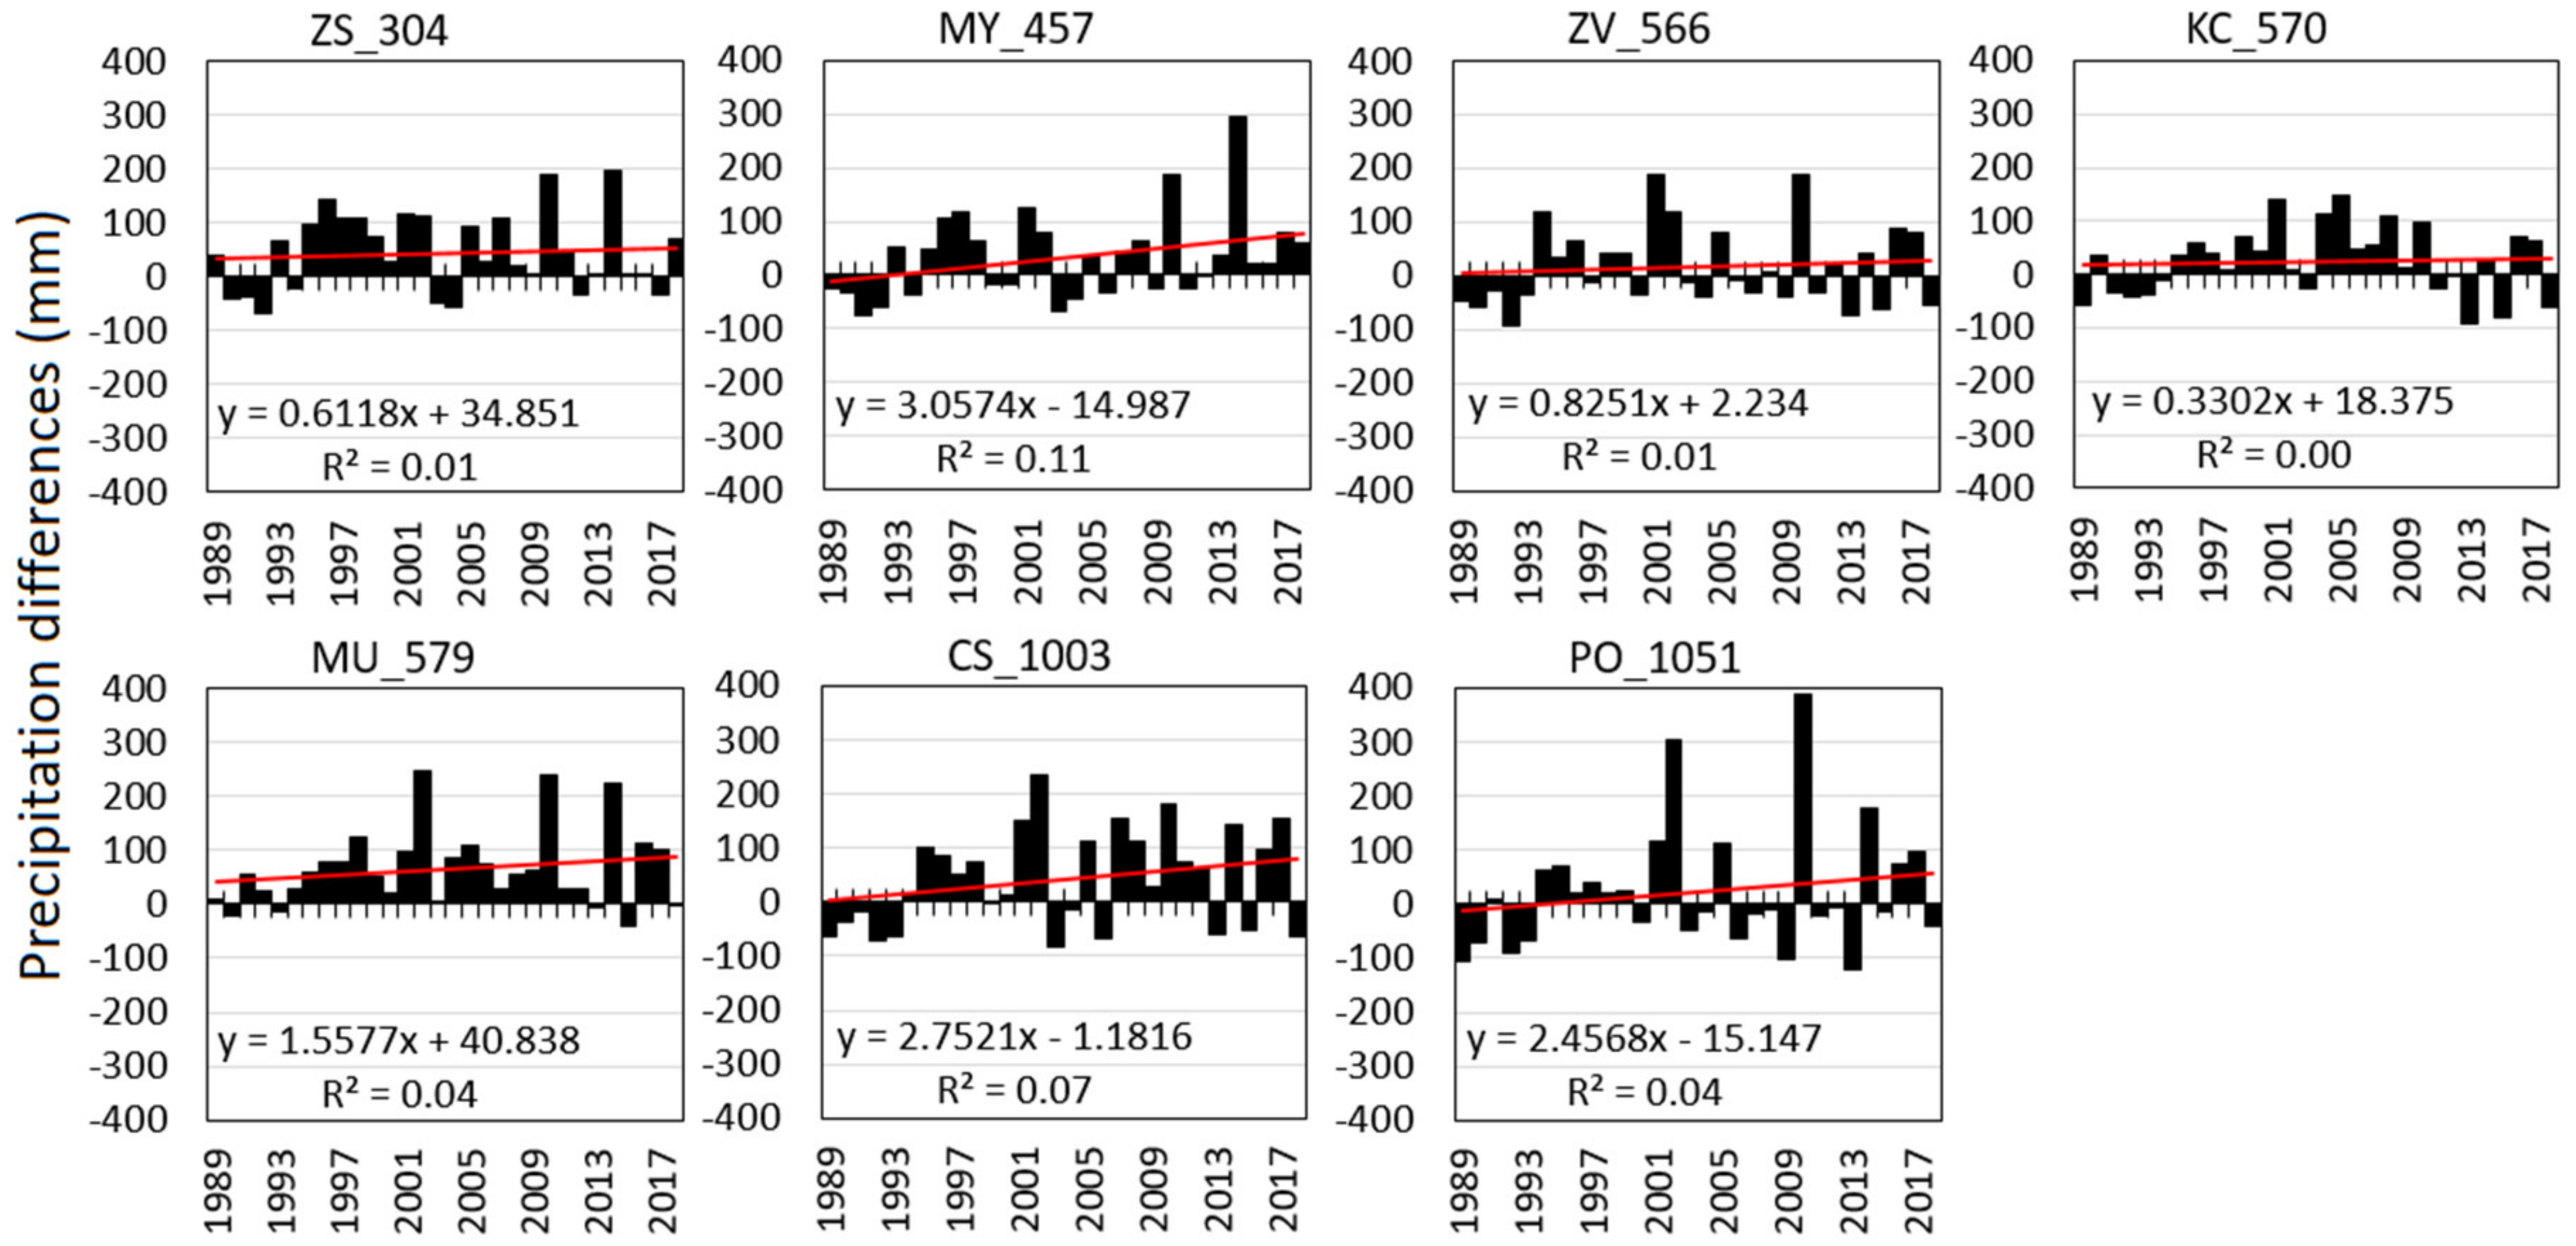
Compared to the normal period of 1961–1990, the precipitation totals in the summer periods (PVII-IX) over the studied recent 30 years indicate the increase of precipitation, particularly over the last 25 years (Figure 2). Using the paired sample T-test, significant positive differences (p ≤ 0.05) from normal (PNVII–IX in 1961–1990) were identified at ZV_304, MY_457, KC_570, MU_579, and CS_1003 (Table 6). At the stands ZV_566 and PO_1051, most summers had precipitation below normal. The linear temporal trends of the precipitation differences from normal were not significant because of the great interannual variability of precipitation. However, the regression coefficients obtained solely positive values, indicating the increasing precipitation at all stands (Figure 2) compared to 1961–1990. Although the precipitations itself rose (Figure 2 and Table A1), the M-K trend tests revealed nonsignificant changes of meteorological drought indices and variables over time (Table A1).
When we analysed the indices of September (Figure 3a–c), the incidence of severely to extremely dry Septembers were according to SPEIIX only in 2011 and according to SPIIX in 2006 and 2011. However, the CWBIX indicated Septembers in eight years to be severely to extremely dry (1989, 1991, 1999, 2003, 2004, 2006, 2009, and 2011). Furthermore, it implied the moderate to severely dry Septembers in many more years compared to the SPIIX or SPEIIX (Figure 3a–c), suggesting the potential higher rainfall deficit in environment. On the contrary, severely to extremely wet Septembers according to all indices occurred in four years (2001, 2007, 2010, and 2014).
When we evaluated the meteorological drought of summer seasons (July to September) in 1989–2018, the SPIVII–IX identified seasons 2011 (only MU_570) and 2013 to be severely to extremely dry while SPEIVII–IX classified only the season in 1992 (Figure 3d,e). By introducing the dry period index (DPIVII–IX), we were able to identify droughts that appeared over longer periods. DPIVII–IX hinted that the beech stands at low- to mid-altitudes are threatened by the combination of dry periods and low precipitation, resulting into the severe to extreme drought. At the stands at low to mid-altitudes, ZS_304, MY_457, and ZV_566, this drought occurred commonly throughout the entire studied period 1989–2018. However, in the last decade, severe to extreme drought started to occur more frequently at the rest of mid-altitude stands: KC_570 and MU_579 (Figure 3f). The longest dry period took 24 days, and it occurred twice in ZS_304 (2000 and 2013) and once each at MY_457 (2013) and PO_1051 (1990). Regarding the higher precipitations at high altitudes, such a long period without precipitation at PO_1051 induced only moderate dryness (Figure 3f).
3.2. Temperature and Heat Waves
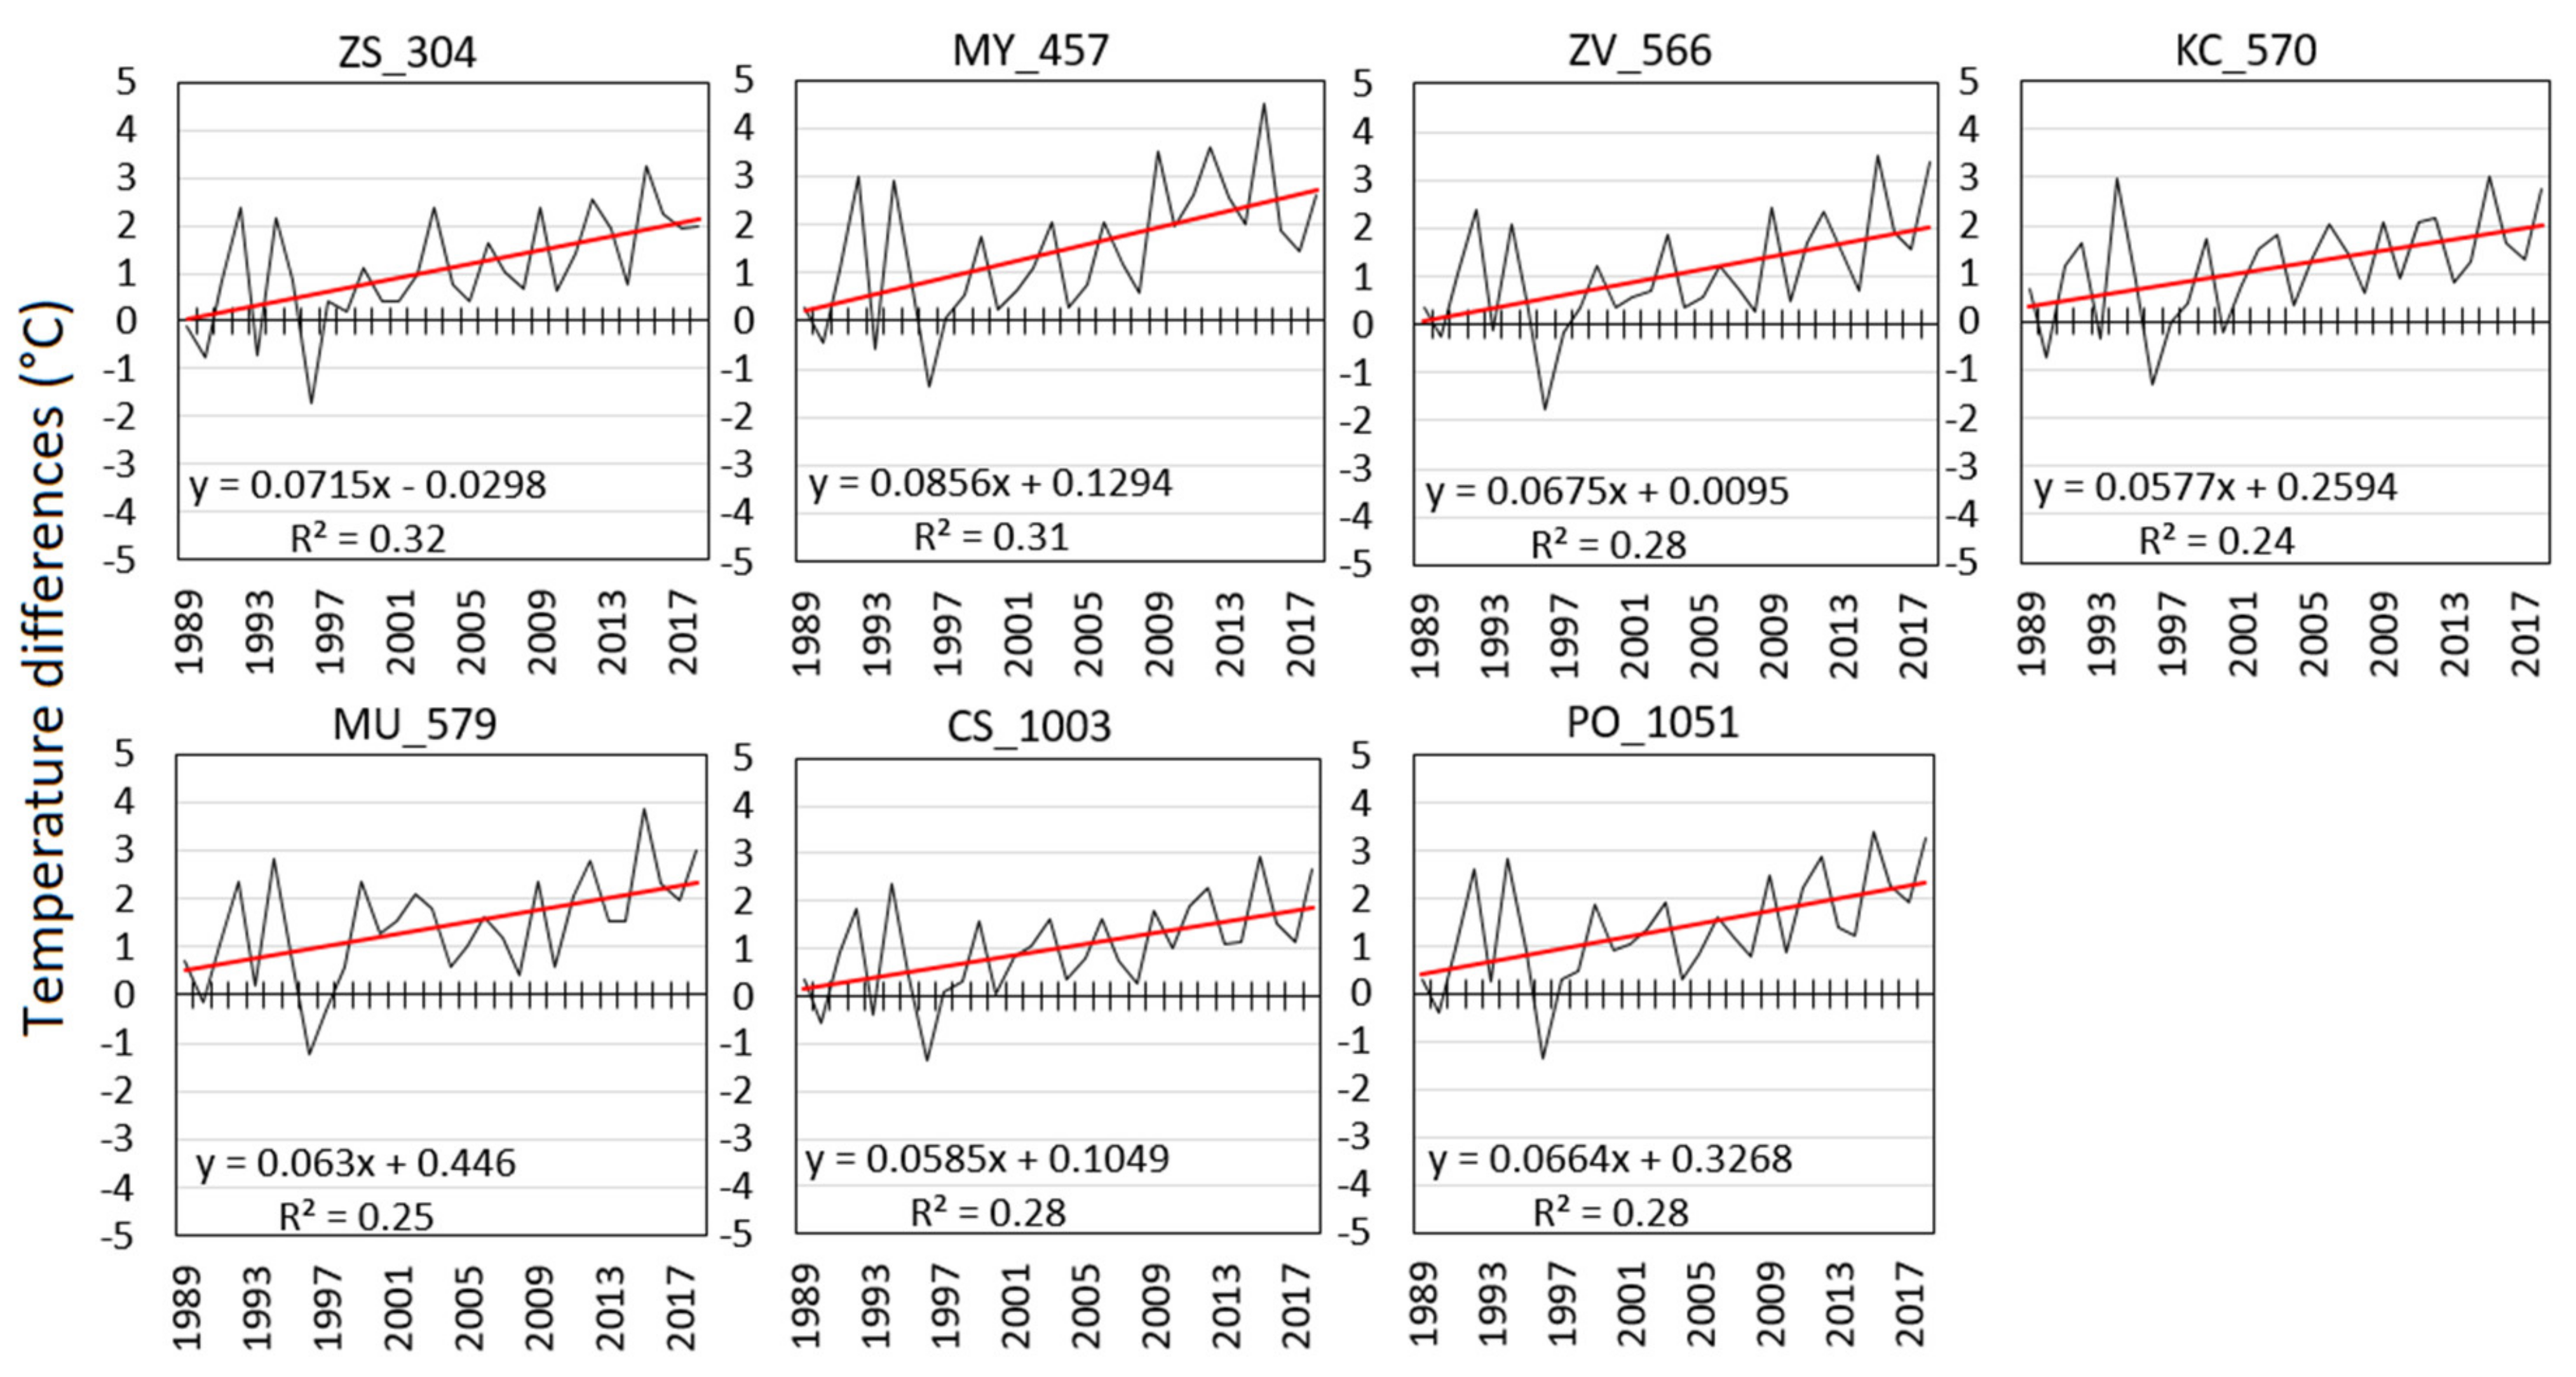
Compared to the temperature normal of 1961–1990 (TNVII–IX), the average July to September temperatures (TVII–IX) of 1989–2018 exceeded normal in almost all analysed years (Figure 4). The temperatures at the beginning of the studied period suggested were balanced with two single warm years: 1992 and 1994. However, the amplified warming over next two decades culminated at the end of this period. In some years, we noticed the incidence of temperatures higher by more than 3 °C compared to the TNVII–IX of 1961–1990 (Figure 4). The paired sample t-test of the differences of TVII–IX from normal TNVII–IX (1961–1990) revealed significant differences at all altitudes (Table 7).
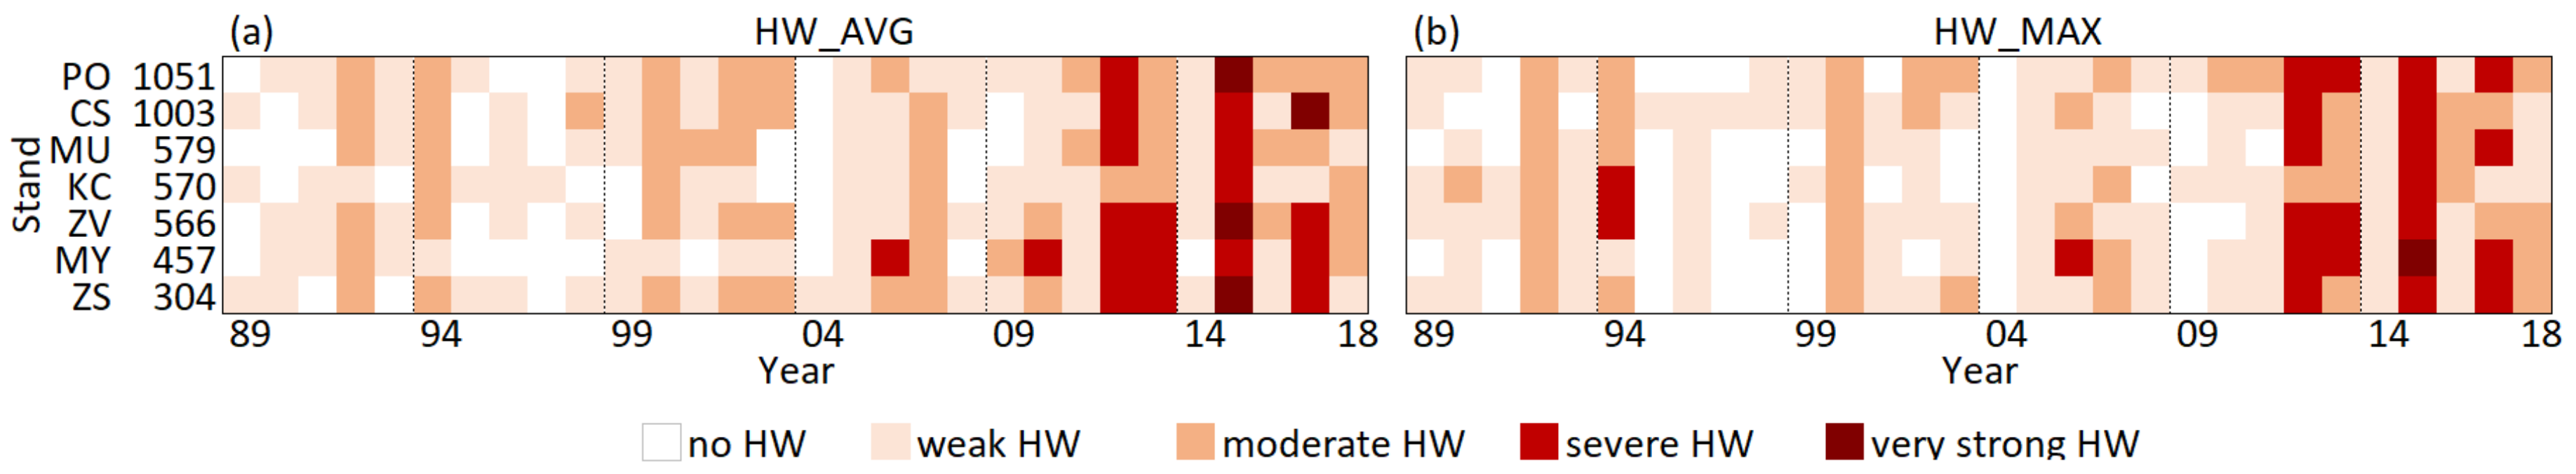
The increasing duration of heatwaves (Figure 5) accompanied the indicated warming during the studied period. Comparing the HWs based on average daily temperatures to those based on daily maxima, we have not found any significant differences between them, (t = −0.31 < t(α;f − 1)) = 1.655, and both show the increased incidence of HWs in the last decade. In the first (1989–1998) and the second (1999–2008) decades of the studied period, there were only one severe HW per decade: in 1994 at KC_570 and in 2006 at MY_457 (Figure 5). In 1994, the longest single HW of the studied period occurred, when the above-normal maximal daily temperature was 20 days in a row in the most eastern stand, KC_570. On the contrary, over the last decade, the severe to extreme HWs occurred in 2010 at MY_457 and in 2012, 2013, 2015, and 2017 in most stands. In the comparison with the previous two decades, the five-times increase of HWs in the last decade showed an evident intensification of HWs over the studied period. The effect of HWs differed spatially. While in 2015 the strongest HW presented itself in all stands, in the other years (2010, 2012, 2013, and 2017) it affected only some areas. In 2010 and 2013, HW mostly affected the western stands. In 2012 and 2017, HW took action in most western and central stands. The eastern stand KC_570, however, was not affected over these years.
The M-K trend test revealed a significant increase of most of the temperature-based variables over the summer seasons (Table 8). The trend of HWAVG rose significantly (p ≤ 0.05) at all stands, while HWMAX showed significant (p ≤ 0.05) increasing trend only at low (ZS_304 and MY_457) and high (CS_1003 and PO_1051) altitudes, and the middle altitudes between 500 and 1000 m a.s.l. did not. The trend tests of the average temperatures revealed highly significant growth of TVI–IX and TVII–IX with p ≤ 0.01 and of TVIII–IX with p ≤ 0.05. The average temperature of September (TIX) shows differences between altitudes. The significant increasing trend (p ≤ 0.05) occurred only at mid-altitudes (ZV_566, KC_570, and MU_579) while, at altitudes below 500 m a.s.l. (ZS_304 and MY_457) and around 1000 m a.s.l. (CS_1003 and PO_1051), did not. (Table 8).
3.3. Phenological Response
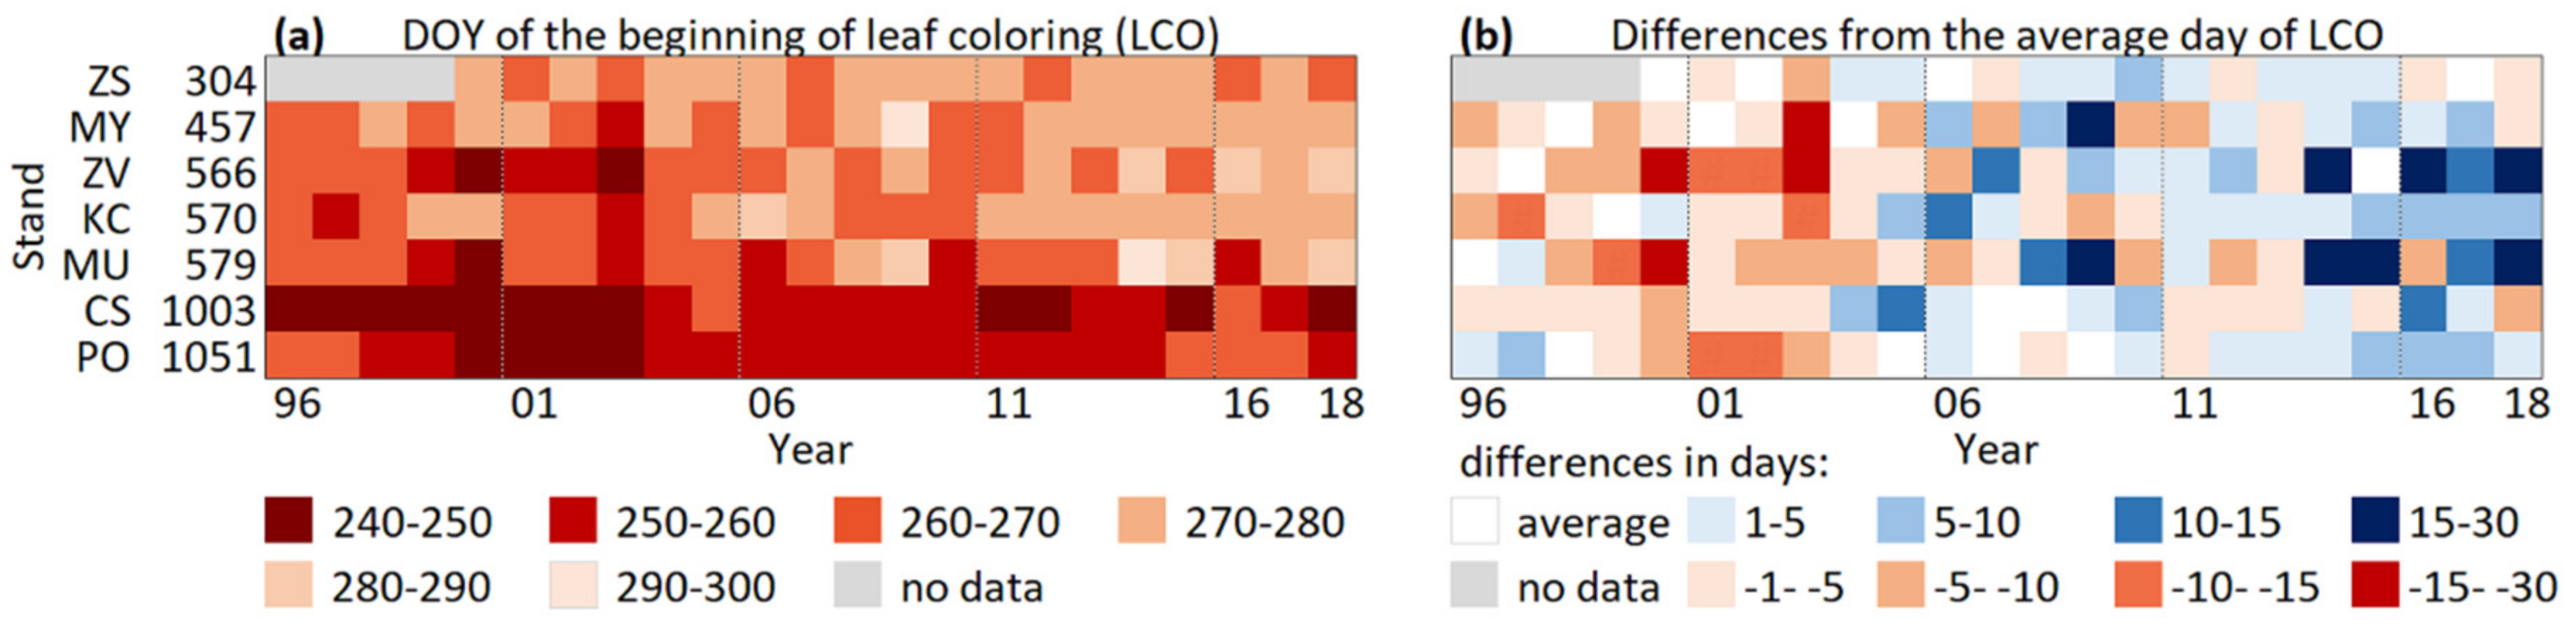
The onset of leaf colouring (LCO) differed between altitudes (Figure 6a). Beech in stands at altitudes above 1000 m a.s.l. exhibited a beginning of leaf colouring first, on average, on day of year (DOY) 251 and 255 for CS_1003 and PO_1051, respectively. Over the studied period, the LCO was delayed in two aspects: from the highest to the lowest altitudes and from the beginning to the end of studied period (Figure 6a). From Figure 6a, it is evident that, in the last decade, LCO at the middle altitudes started at comparable to low altitudes and, in the last several years, even earlier.
Differences from the average DOY (day of year) of LCO varied in the range of ±30 days. The most pronounced shift from below-average to above-average DOY of LCO was revealed at stands at middle altitudes: ZV_566 and MU_579 (Figure 6b). Here, the significant trend that delayed LCO by 1.2 and 0.8 day per year was indicated by S-slope for ZV_566 and MU_579, respectively (Table 9). Moreover, significant shifts to later LCOs were detected at stands MY_457, KC_570, and PO_1051 with S-slopes of 0.4, 0.6, and 0.5 day per year, respectively (Table 9). This indicates a positive reaction of beech at these stands to climate change. The unchanged LCO with nonsignificant trend was observed at the lowest altitudes: in stand ZS_304 (Table 9). Here, the interannual standard deviation from the average onset day over the 19-year period (2000–2018) was only 3 days.
At stand ZS_304, the significant correlation (p ≤ 0.01) between LCO and SPIIX referring to the drought conditions one month prior to colouring and the near significant correlations (p ≤ 0.10) with most of the meteorological drought indices (Table 10) indicate the advance of LCO in the environment with less water supply. Similarly, the near significant correlation (p ≤ 0.10) was revealed with the temperature of September (TIX), when warming by 1 °C resulted in the 1-day earlier onset of LCO (Table 10). Following that, we assume that beech growing at ZS_304 reaches its climatic limit for growing season termination, since the increasing temperature and incidence of meteorological drought act negatively to LCO and evoke earlier beginning. This stand is located in the warm and moderate moist climatic region at the lower limit of the beech vertical distribution range (Table 1). Furthermore, the soil with lower retention capacity and higher permeability limit the water availability here. We compared the environmental conditions in ZS_304 with the MU_579, where the precipitation-based indices correlate with LCO with p ≤ 0.05 for SPIIX and p ≤ 0.10 for SPEIIX (Table 10). Although the annual precipitation normal of 1981–2010 between these two stands differed only by 14 mm, the temperature normal was lower by the 2.2 °C in favour of the MU_579 in the moderate warm region (Table 1). Here, we suppose that the synergic effect of the lower temperatures, conditioning lower evapotranspirative demands together with the high retention and medium permeability of soil at the beech stands with the same precipitation totals, have resulted in delays of LCO compared to ZS_304. However, limitation by the significant effect of water supplement may cause a slower (0.8 day per year) trend in MU_579 compared to ZV_566 (1.2 day per year), where the precipitation normal is exceeded by 56 mm in the comparable temperature and soil conditions.
The range of temperature effects on leaf senescence was wide and depended on regional climate, since it increased from −1 day per °C in ZS_304 to up to +4 days per °C for beech stands at the middle altitudes, with no limits for disposed water (KC_570). The ongoing warming in moderate warm regions will cause additional enhanced requirements in the environment for disposed water and could result in a shift to earlier LCOs when there is a lack of disposed water at the end of summer.
Despite the amplified warming of summer months at all beech stands, significant correlations with the onset of leaf colouring was noticed at only one stand. The Pearson correlation coefficient in the stand KC_570 indicated increasing temperatures, and the strength of heatwaves indicated the later onset of LCO.
4. Discussion
Considering the plant phenology as a complex phenomenon, when plant species react specifically to a combination of factors acting at the same time [56,57], in this study, we used a number of bioclimatic variables based on temperature, precipitation, and evapotranspiration to reveal the climatic limits for mature beech stands. As expected, the warming climate caused lengthening of the growing seasons of European beech which is a tolerant tree species. However, as the results indicate, the lengthening only presents itself in optimal climate conditions.
Our results revealed a wide range of temperature effects on the onset of leaf colouring, which are in coincidence with previously published results [58,59,60]. At the lowest altitudes with water supplement and retention limitations, LCO advanced by −1 day per °C. On the contrary, at stands at the middle altitudes without precipitation limitation and high soil water retention, LCO was delayed by up to +4 days per °C of warming. The susceptibility of the LCO of European beech to increasing temperatures in environments optimally supplied with water allows beech to utilize this warming to extend the growing season. Such an extension appears at the studied stands at middle to high altitudes, where warming is accompanied by a sufficient amount of total annual precipitation (above 700 mm). These findings agree with the theory of Fu et al. [58], who, taking advantage of temperature manipulative experiments on beech seedlings, concluded that, in the absence of water and nutrient limitation, temperature is a dominant factor controlling the leaf senescence process in European beech. The temporal trends reflecting the impact of climate change revealed that stands at middle altitudes postponed the onset of leaf colouring by 0.4–1.2 day per year. At high altitudes, the trend of LCO delayed by 0.3–0.5 day per year.
Warming of the studied period precede the increasing number of heatwaves, especially in the last decade, 2009–2018 (Figure 5). This is in agreement with numerous studies reporting a number of severe heatwaves that recently occurred over various global regions [55,61,62,63]. Only several of the most severe heatwaves identified across Europe since 1950 [55,61,64,65] hit the region of Western Carpathians, where the studied beech stands are located. The HWs in 1994, 2006, 2010, 2015, and 2017 were linked to those observed in other European countries. Furthermore, most of the study stands were affected by severe to extreme HWs in 2012 and 2013, while the extreme HWs in 2003, 2007, and 2014 did not affect the studied region. Although the longest single HW occurred in 1994 at KC_570 when maximum daily above-normal temperatures was 20 days in a row, the strongest HW of all was that in 2015 with more than 30 days in HWs over the summer season (Figure 5). In 2015, the large temperature extremes of the HW induced earlier senescence in numerous tree species in Central Europe, especially Slovakia and the Czech Republic [66,67]. A potential negative effect of HW is the decrease of net photosynthesis [68] and the alteration of long-term continental carbon balances [69]. In this study, we expected that this reduction in photosynthesis and production might relate to the potential advances in onset of autumn colouring as a reaction to the heatwave-induced leaf damage. In regard to the observed onset day of leaf colouring, the regression analyses did not reveal any significant negative effect of HWs based on the average as well as maximal daily temperatures. However, the opposite reaction was revealed at KC_570, where the correlation coefficients indicate a very significant positive effect of increasing temperature as well as heatwaves on the postponed LCO. Such a positive effect of HWs on the prolonging of the growing season at this stand was supported by sufficient precipitation over the summer season (Table 1), which is comparable to the precipitation at high altitudes (CS_1003 and PO_1051). This stand is located in eastern Slovakia, where the effect of continental climate causes higher precipitation totals over summer months compared to more western stands [70]. The trend of HWAVG and HWMAX increased significantly at all stands, except for middle altitudes between 500 and 1000 m a.s.l. where HWMAX increased but was not significant.
European beech is known for tolerating neither severe droughts nor water-logged soils due to higher than average seasonal precipitation. Compared to the other dominant tree species with higher tolerance to soil water deficit, e.g., oak, the competitive capacity of beech might be reduced under the expected future climate conditions [19] if a strong increase in the frequency of moderate soil water stress occurs [60]. Despite the projected declining trend of summer precipitations [7], the summer precipitation PVII–IX at the studied stands positively deviates from the normal PNVII–IX (1961–1990) (Figure 2). This increase, however, will probably be insufficient regarding the rising evapotranspiration requirements in a warming environment, since the evapotranspiration is a leading output component of the water balance controlling the amount of water running off from the territory of beech stands [9].
The climatic water balance (CWBIX) as a difference between precipitation and evapotranspiration indicates considerable predominance of severely dry Septembers, although according to the classification scale SPIIX and SPEIIX, the severe to extreme droughts related to given stand conditions appeared in only a few years. It is worth noting that the stand ZS_304 is in the xerothermic locality at the lower limit of the natural occurrence of beech in the Western Carpathians. Here, the significant correlation of LCO with SPIIX and SPEIIX and the near significant correlation with the other precipitation- and evapotranspiration-based indices and variables as well as with the temperature variable TVIII–IX (Table 10) are clear evidence of the negative effect of low (although increasing; Figure 2) precipitation totals and increasing temperature. Not only stands at low altitudes but also those at middle altitudes with precipitation normal (1981–2010) below 700 mm suffer from drought. As has been presented in previous studies [8,15], the deterioration of climate conditions for European beech occurs usually at low altitudes with xeric climatic limits. However, regarding temperatures which are more favourable for beech at the middle altitudes, the effect of precipitation below 700 mm is less pronounced, since the evapotranspiration demands are lower there. Therefore, the effect of warming environment leads to a delaying trend of LCO at stand MU_579, despite the significant negative effect of meteorological drought (Table 10). However, the warming trend of summer months (Table 8 and Figure 4) suggests a continued increase in temperature, and it is probable that the beech stands that profit from the warming today will suffer from a deteriorating effect in the next decades. The ongoing warming in moderately warm regions will cause additional enhanced water requirements in environment and could result in a shift to earlier LCOs when there is a lack of water at the end of summer.
The dry period index (DPIVII–IX) hinted that these lowest stands (ZS_304, MY_457, and ZV_566) are mostly threatened by severe to extreme drought periods. However, over the last decade, these drought periods occurred at the other stands at the middle altitude (KC_570 and MU_579; Figure 3f). Although European beech is known to have mechanisms to control water deficit, this species does not tolerate severe drought [4,71]. Under limited water availability, beech may suffer from xylem embolism, which is more likely to hit provenances from the Northern Europe rather than those from Southern Europe [72]. Some studies indicated the physiological response of beech to drought starting after five consecutive weeks of continuous meteorological drought [73]. However, over the studied 30-year period, in the natural environmental conditions of our studied stands, such a long period without precipitation did not occur. The longest dry periods with precipitation less than 0.3 mm did not exceeded 24 days in a row. The occurrence of extremely dry periods at low to middle altitudes appears to be a common phenomenon over the last 30 years, and the length of the longest period as well as DPIVII-IX have not significantly increased over time.
In addition to the above indices, it would be beneficial to utilize the data from soil water potential (SWP) measurements in an evaluation of the phenological response to drought [74]. We compared our results with the SWP data measured during 2012–2014 [73] close to beech stand ZV_566, published by Vido et al. [73]. In 2013, the relationship between extreme dry periods (DPIVII–IX, Figure 3), early LCO (Figure 6), and low SWP (Figure 3 in [73]) could be indicated. On the contrary, in 2014, when the DPIVII-IX values were close to normal (Figure 3) and the SWP did not indicate drought (Figure 3 in [73]), the considerable delay of LCO was observed (Figure 6). The difference of LCOs between 2013 and 2014 is 22 days. Following that, we advise to use SWP measurement data in the future research by considering climate change effects at the end of growing season in beech forests.
5. Conclusions
Despite the important role of autumn senescence in fulfilling the ecosystem functions, current knowledge of the drivers of leaf senescence is still limited. There is a large spread in predictions of how the length of the growing season will vary under future climate conditions. In this study, we analysed the mechanisms by which the climate controls the onset of autumn phenology of European beech. This helps in predictions of the effects of changing climate on its future distribution in Western Carpathians to find a balance between forest production requirements and environmental demands of beech in forest management decisions. The concurrent lengthening of canopy duration (later LCO) in beech stands that we revealed in this study appears to be inclined towards the forest production requirements. Furthermore, our results suggest that climate change alter the period with carbon assimilation. Particularly at middle altitudes, we documented the differences in the onset of leaf colouration between the start and end of the studied period 1989–2018 up to 30 days.
We found a significant increasing trend of summer temperatures up to 4 °C throughout the period 1989–2010 and, simultaneously, significant positive differences of summer precipitation from the normal period of 1961–1990. However, it is probable that these significantly higher summer precipitations will be insufficient for beech in the upcoming decades. We assume that the ongoing warming of summer months will enhance evapotranspiration demands and will dry the environment. We expect that the negative effect of meteorological drought on the beech autumn phenological phases, which was found to already occur at low altitudes and has started at the middle altitudes, will further advance. This will cause an earlier onset of leaf senescence and shortening of the growing season. Foresters should be prepared for the production loses that the deteriorating effects of climate change could bring over next decades. Since the trees long-living organisms, it is appropriate to consider a gradual change of tree species compositions in the areas threatened by meteorological drought towards more drought-tolerant tree species such as oak.
Following the results, we conclude that European beech autumn phenology at mid- to high altitudes currently profit from the climate warming, but it is susceptible to drought at the low- to mid-altitudes. The results of this species-specific study will contribute to the adjustment of adaptation and mitigation policies in forestry and nature conservation and to validation of evolutionary and ecological hypotheses related to climate change effects.
Author Contributions
Conceptualization, V.L. and J.Š. (Jaroslav Škvarenina); methodology, V.L. and J.Š. (Jana Škvareninová); software, J.V.; formal analysis, S.B.; investigation, V.L., J.V., and S.B.; resources, J.Š. (Jaroslav Škvarenina), J.Š. (Jana Škvareninová); data curation, H.H. and P.B.; writing—original draft preparation, V.L.; writing—review and editing, J.V., S.B., J.Š. (Jaroslav Škvarenina), and J.Š. (Jana Škvareninová); visualization, V.L.; supervision, J.Š. (Jaroslav Škvarenina) project administration, V.L.; funding acquisition, J.Š. (Jaroslav Škvarenina), J.Š. (Jana Škvareninová), and S.B. All authors have read and agreed to the published version of the manuscript.
Funding
This research was funded by research grants of The Ministry of Education, Science, Research, and Sport of the Slovak Republic: VEGA 1/0370/18, VEGA 1/0111/18, VEGA 1/0500/19, and VEGA 2/0015/18 and by grants from the Slovak Research and Development Agency no. APVV-18-0347 and APVV-15-0425.
Acknowledgments
We thank Peter Zelina for comments on early versions of the manuscript and English editing. Additional support was provided from the Stefan Schwarz fund for postdoctoral researchers awarded by the Slovak Academy of Sciences to Veronika Lukasová and from the contract HZ GIEFS provided by Svetlana Bičarová.
Conflicts of Interest
The authors declare no conflict of interest.
Abbreviations
| DOY | Day of Year |
| CWB | Climatic Water Balance |
| SPI | Standardized Precipitation Index |
| SPEI | Standardized Precipitation-Evapotranspiration Index |
| DPI | Dry Periods Index |
| P | Precipitation |
| PN | Precipitation Normal |
| HW | Heatwave |
| T | Temperature |
| TN | Temperature Normal |
| LCO | Onset of Leaf Colouring |
| M-K | Mann–Kendal |
| S-slope | Sen’s slope |
| SWP | Soil Water Potential |
Appendix A
Table A1.
Temporal trend of the meteorological drought indices and precipitation.
| ZS_304 | MY_457 | ZV_566 | KC_570 | MU_579 | CS_1003 | PO_1051 | ||||||||
|---|---|---|---|---|---|---|---|---|---|---|---|---|---|---|
| Ktau | p | Ktau | p | Ktau | p | Ktau | p | Ktau | p | Ktau | p | Ktau | p | |
| SPIIX | 0.09 | 0.47 | 0.04 | 0.75 | 0.10 | 0.46 | −0.07 | 0.60 | 0.14 | 0.28 | 0.03 | 0.86 | 0.00 | 1.00 |
| SPIVII–IX | 0.06 | 0.67 | 0.22 | 0.09 | 0.16 | 0.21 | 0.10 | 0.43 | 0.15 | 0.26 | 0.21 | 0.11 | 0.12 | 0.36 |
| SPEIIX | −0.06 | 0.65 | −0.01 | 0.97 | 0.01 | 0.97 | −0.11 | 0.39 | 0.08 | 0.52 | −0.02 | 0.87 | −0.04 | 0.78 |
| SPEIVII–IX | −0.09 | 0.49 | 0.08 | 0.55 | 0.05 | 0.71 | −0.04 | 0.76 | −0.04 | 0.78 | 0.15 | 0.25 | 0.00 | 1.00 |
| CWBIX | −0.01 | 0.94 | 0.02 | 0.92 | 0.06 | 0.65 | −0.13 | 0.34 | 0.11 | 0.42 | 0.03 | 0.86 | −0.02 | 0.89 |
| CWBVII–IX | −0.05 | 0.72 | 0.09 | 0.48 | −0.01 | 0.94 | −0.03 | 0.86 | 0.03 | 0.86 | 0.17 | 0.20 | 0.03 | 0.83 |
| DPIVII–IX | −0.01 | 0.94 | −0.12 | 0.36 | −0.15 | 0.27 | 0.02 | 0.89 | 0.07 | 0.60 | 0.21 | 0.10 | 0.08 | 0.57 |
| PVII–IX | 0.02 | 0.92 | 0.22 | 0.09 | 0.16 | 0.21 | 0.10 | 0.44 | 0.13 | 0.32 | 0.21 | 0.11 | 0.12 | 0.36 |
References
- IPCC. Climate Change 2013: The Physical Science Basis. Contribution of Working Group I to the Fifth Assessment Report of the Intergovernmental Panel on Climate Change; Stocker, T.F., Qin, D., Plattner, G.-K., Tignor, M., Allen, S.K., Boschung, J., Nauels, A., Xia, Y., Bex, V., Midgley, P.M., Eds.; Cambridge University Press: Cambridge, UK; New York, NY, USA, 2013; p. 1535. [Google Scholar]
- Saxe, H.; Cannell, M.G.R.; Johnsen, Ø.; Ryan, M.G.; Vourlitis, G. Tree and forest functioning in response to global warming. N. Phytol. 2001, 149, 369–400. [Google Scholar] [CrossRef]
- Salinger, S. Increasing climate variability and change: Reducing the vulnerability. Clim. Change 2005, 70, 1–3. [Google Scholar] [CrossRef]
- Bréda, N.; Huc, R.; Granier, A.; Drenier, E. Temperate forest trees and stands under severe drought: A review of ecophysiological responses, adaptation processes and long-term consequences. Ann. For. Sci. 2006, 63, 625–644. [Google Scholar] [CrossRef] [Green Version]
- Teskey, R.; Wertin, T.; Bauweraerts, I.; Ameye, M.; McGuire, M.A.; Steppe, K. Responses of tree species to heat waves and extreme heat events. Plant Cell Environ. 2015, 38, 1699–1712. [Google Scholar] [CrossRef] [PubMed]
- Škvarenina, J.; Tomlain, J.; Hrvoľ, J.; Škvareninová, J. Occurence of dry and wet periods in altitudinal vegetation stages of West Carpathians in Slovakia: Time-Series Analysis 1951–2005. In Bioclimatology and Natural Hazards; Strelcová, K., Matyas, C., Kleidon, A., Lapin, M., Matejka, F., Blazenec, M., Škvarenina, J., Holecy, J., Eds.; Springer: Amsterdam, The Netherlands, 2009; pp. 97–106. [Google Scholar]
- Lindne, M.; Maroschek, M.; Netherer, S.; Kremer, A.; Barbati, A.; Garcia-Gonzalo, J.; Seidl, R.; Delzon, S.; Corona, P.; Kolstro, M.; et al. Climate change impacts, adaptive capacity, and vulnerability of European forest ecosystems. For. Ecol. Manag. 2010, 259, 698–709. [Google Scholar] [CrossRef]
- Hlásny, T.; Mátyás, C.; Seidl, R.; Kulla, L.; Merganičová, K.; Trombik, J.; Dobor, L.; Barcza, Z.; Konôpka, B. Climate change increases the drought risk in Central European forests: What are the options for adaptation? For. J. 2014, 60, 5–18. [Google Scholar] [CrossRef] [Green Version]
- Střelcová, K.; Minďáš, J.; Škvarenina, J. Influence of tree transpiration on mass water balance of mixed mountain forests of the West Carpathians. Biologia 2006, 19, S305–S310. [Google Scholar] [CrossRef]
- Streda, T.; Stredova, H.; Chuchma, F.; Kucera, J.; Roznovsky, J. Smart method of agricultural drought regionalization: A winter wheat case study. Contrib. Geophys. Geod. 2019, 49, 25–36. [Google Scholar] [CrossRef] [Green Version]
- Perkins, S.E. A review on the scientific understanding of heatwaves—Their measurement, driving mechanisms, and changes at the global scale. Atmos. Res. 2015, 164–165, 242–267. [Google Scholar] [CrossRef]
- Gomory, D.; Kukla, J.; Schieber, B. Taxanómia, fylogenéza a rozšírenie buka v Európa a na Slovensku (Taxonomy, phylogeny and distribution of beech in Europe and in Slovakia). In Buk a Bukové Ekosystémy Slovenska (Beech and Beech Ecosystems of Slovakia); Barna, M., Kuflan, J., Bublinec, E., Eds.; Veda: Bratislava, Slovakia, 2011; pp. 37–62. [Google Scholar]
- Kramer, K. Phenotypic plasticity of the phenology of seven European tree species in relation to climatic warming. Plant Cell Environ. 1995, 18, 93–104. [Google Scholar] [CrossRef]
- Robson, T.M.; Garzón, M.B.; BeechCOSTe52 Database Consortium. Phenotypic trait variation measured on European genetic trials of Fagus sylvatica L. Sci. Data 2018, 5, 180149. [Google Scholar] [CrossRef] [PubMed]
- Mátyás, C.; Berki, I.; Czúcz, B.; Gálos, B.; Móricz, N.; Rastovits, E. Future of Beech in Southeast Europe from the Perspective of Evolutionary Ecology. Acta Silv. Lignaria Hung. 2010, 6, 91–110. [Google Scholar]
- Škvarenina, J.; Križová, E.; Tomlain, J. Impact of the climate change on the water balance of altitudinal vegetation stages in Slovakia. Ekologia 2004, 23, 13–29. [Google Scholar]
- Lukasová, V.; Vasiľová, I.; Bucha, T.; Snopková, Z.; Škvarenina, J. Effect of biometeorological variables on the onset of phenophases derived from MODIS data and visual observations. Cent. Eur. For. J. 2014, 60, 39–51. [Google Scholar] [CrossRef]
- Lakatos, F.; Molnár, M. Mass mortality of beech in South–West Hungary. Acta Silv. Lignaria Hung. 2009, 5, 75–82. [Google Scholar]
- Geßler, A.; Keitel, C.; Kreuzwieser, J.; Matyssek, R.; Seiler, W.; Rennenberg, H. Potential risks for European beech (Fagus sylvatica L.) in a changing climate. Trees 2007, 21, 1–11. [Google Scholar] [CrossRef]
- Chmielewski, F.M.; Rotzer, T. Response of tree phenology to climate change across Europe. Agric. For. Meteorol. 2001, 108, 101–112. [Google Scholar] [CrossRef]
- Ahas, R.; Aasa, A.; Menzel, A.; Fedotova, V.G.; Scheifinger, H. Changes in European spring phenology. Int. J. Climatol. 2002, 22, 1727–1738. [Google Scholar] [CrossRef]
- Menzel, A. Phenology: Its importance to the global change community. Clim. Chang. 2002, 54, 379–385. [Google Scholar] [CrossRef]
- Schwartz, M.D.; Ahas, R.; Aasa, A. Onset of spring starting earlier across the northern hemisphere. Glob. Chang. Biol. 2006, 12, 343–351. [Google Scholar] [CrossRef]
- Babálová, D.; Škvareninová, J.; Fazekaš, J.; Vyskot, I. The dynamics of the phenological development of four woody species in south-west and central Slovakia. Sustainability 2018, 10, 1497. [Google Scholar] [CrossRef] [Green Version]
- Lukasová, V.; Bucha, T.; Škvareninová, J.; Škvarenina, J. Validation and Application of European Beech Phenological Metrics Derived from MODIS Data along an Altitudinal Gradient. Forests 2019, 10, 60. [Google Scholar] [CrossRef] [Green Version]
- Myneni, R.B.; Keeling, C.; Tucker, C.J.; Asrar, G.; Nemani, R.R. Increased plant growth in the northern high latitudes from 1981 to 1991. Nature 1997, 386, 698. [Google Scholar] [CrossRef]
- Richardson, A.D.; Black, T.A.; Ciais, P.; Delbart, N.; Friedl, M.A.; Gobron, N.; Varlagin, A. Influence of spring and autumn phenological transitions on forest ecosystem productivity. Philos. Trans. R. Soc. Lond. Ser. B Biol. Sci. 2010, 365, 3227–3246. [Google Scholar] [CrossRef] [Green Version]
- Menzel, A. Trends in phenological phasesin Europe between 1951 and 1996. Int. J. Biometeorol. 2000, 46, 76–81. [Google Scholar] [CrossRef]
- Chmielewski, F.M.; Rötzer, T. Phenological trends in Europe in relation to climatic changes. Agrometeorol. Schr. 2000, 7, 1–15. [Google Scholar]
- Čufar, K.; de Luis, M.; Saz, M.A.; Črepinšek, Z.; Kajfež-Bogataj, L. Temporal shifts in leaf phenology of beech (Fagus sylvatica) depend on elevation. Trees 2012, 26, 1091–1100. [Google Scholar] [CrossRef]
- Schieber, B.; Kubov, M.; Janík, R. Effects of climate warming on vegetative phenology of the common beech Fagus sylvatica in a submontane forest of the Western Carpathians: Two-decade analysis. Pol. J. Ecol. 2017, 65, 339–351. [Google Scholar] [CrossRef]
- Vitasse, Y.; Basler, D. What role for photoperiod in the bud burst phenology of European beech. Eur. J. For. Res. 2013, 132, 1–8. [Google Scholar] [CrossRef]
- Peñuelas, J.; Filella, I.; Zhang, X.; Llorens, L.; Ogaya, R.; Lloret, F.; Comas, P.; Estiarte, M.; Terradas, J. Compex spatiotemporal phenological shifts as a response to rainfall changes. N. Phytol. 2004, 161, 837–846. [Google Scholar] [CrossRef]
- Slovak Hydrometeorological Institute. Available online: http://www.shmu.sk/en/?page=1793 (accessed on 10 July 2020).
- Enviroportál. Available online: https://geo.enviroportal.sk/atlassr/ (accessed on 9 September 2020).
- Pôdny Portál. Available online: http://www.podnemapy.sk/portal/prave_menu/podna_mapa/podna_mapa.aspx (accessed on 6 September 2020).
- Kolektív. Návod na Fenologické Pozorovanie Lesných Rastlín (Instructions for Phenological Observation of Forest Plants); SHMU: Bratislava, Slovakia, 1984; p. 23. [Google Scholar]
- Meier, U. Growth Stages of Mono- and Dicotyledonous Plants, BBCH Monograph; Blackwell Wissenschafts-Verlag: Berlin, Germany; Wien, Austria, 1997; p. 662. [Google Scholar]
- LGIS. Available online: http://gis.nlcsk.org/lgis/ (accessed on 3 September 2020).
- McKee, T.B.; Doesken, N.J.; Kleist, J. Drought monitoring with multiple time scales. In Proceedings of the 9th Conference on Applied Climatology, Dallas, TX, USA, 15–20 January 1995; pp. 233–236. [Google Scholar]
- Guttman, N.B. Comparing the Palmer drought index and the Standardized precipitation index. J. Am. Water Resour. Assoc. 1998, 34, 113–121. [Google Scholar] [CrossRef]
- Abramowitz, M.; Stegun, I.A. Handbook of Mathematical Functions with Formulas, Graphs and Mathematical Tables; Doves Publications Inc.: New York, NY, USA, 1965; p. 1046. [Google Scholar]
- Lloyd-Hughes, B.; Saunders, M.A. A drought climatology for Europe. Int. J. Climatol. 2002, 22, 1571–1592. [Google Scholar] [CrossRef]
- Rebetez, M.; Mayer, H.; Dupont, O.; Schindler, D.; Gartner, K.; Kropp, J.P.; Menzel, A. Heat and drought 2003 in Europe: A climate synthesis. Ann. For. Sci. 2006, 63, 569–577. [Google Scholar] [CrossRef] [Green Version]
- Dubrovsky, M.; Svoboda, M.D.; Trnka, M.; Hayes, M.J.; Wilhite, D.A.; Žalud, Z.; Hlavinka, P. Application of relative drought indices in assessing climate-change impacts on drought conditions in Czechia. Theor. Appl. Climatol. 2008, 96, 155–171. [Google Scholar] [CrossRef] [Green Version]
- Vicente-Serrano, S.M.; Beguería, S.; López-Moreno, J.I. A Multiscalar Drought Index Sensitive to Global Warming: The Standardized Precipitation Evapotranspiration Index. J. Clim. 2010, 23, 1696–1718. [Google Scholar] [CrossRef] [Green Version]
- Thornthwaite, C.W. An approach towards a rational classification of climate. Geogr. Rev. 1948, 38, 55–94. [Google Scholar] [CrossRef]
- Thornthwaite, C.W.; Mather, J.R. Instructions and tables for computing potential evapotranspiration and the water balance. Publ. Climatol. 1957, 10, 132. [Google Scholar]
- Penman, H.L. Natural evaporation from open water, bare soil and grass. Proc. R. Soc. Lond. Ser. A Math. Phys. Sci. 1948, 193, 120–145. [Google Scholar]
- Novák, V. Vyparovanie Vody v Prírode a Metódy Jeho Určovania (Water Evaporation in Nature and Methods of its Determination); Veda: Bratislava, Slovakia, 1995; p. 260. [Google Scholar]
- Voss, R.; May, W.; Roeckner, E. Enhanced resolution modeling study on antropogenic climate change: Changes in extremes of the hydrological cycle. Int. J. Climatol. 2002, 22, 755–777. [Google Scholar] [CrossRef]
- Brezianska, K.; Vitková, L. Analýza bezzrážkových období a ich vplyv na zásobu vody v pôde na Záhorskej nížine (Analyse of periods without precipitation and their influence on soil water storage at Záhorská lowland). Acta Hydrol. Slovaca 2015, 16, 260–266. [Google Scholar]
- Šútor, J.; Šurda, P.; Štekauerová, V. Vplyv bezzrážkových období na dynamiku zásob vody v zóne aerácie pôdy (Influence of precipitation-free periods on the dynamics of water reserves in the soil aeration zone). Acta Hydrol. Slovaca 2011, 12, 22–28. [Google Scholar]
- Rennenberg, H.; Loreto, F.; Poole, A.; Brilli, F.; Fares, S.; Beniwal, S.R.; Gessler, A. Physiological responses of forest trees to heat and drought. Plant Biol. 2006, 8, 556–571. [Google Scholar] [CrossRef] [PubMed]
- Russo, S.; Sillmann, J.; Fisher, E.M. Top ten European heatwaves since 1950 and their occurrence in the coming decades. Environ. Res. Lett. 2015, 10, 124003. [Google Scholar] [CrossRef]
- Valencia-Barrera, R.M.; Comtois, P.; Fernández-González, D. Bioclimatic indices as a tool in pollen forecasting. Int. J. Biometeorol. 2002, 46, 171–175. [Google Scholar] [CrossRef]
- Puchałka, R.; Koprowski, M.; Gričar, J.; Przybylak, R. Does tree-ring formation follow leaf phenology in Pedunculate oak (Quercus robur L.)? Eur. J. For. Res. 2017, 136, 259–268. [Google Scholar] [CrossRef] [Green Version]
- Fu, Y.H.; Piao, S.; Delpierre, N.; Hao, F.; Hanninen, H.; Liu, Y.; Sun, W.; Janssens, I.A. Larger temperature response of autumn leaf senescence than spring leaf-out phenology. Glob. Chang. Biol. 2017, 24, 2159–2168. [Google Scholar] [CrossRef]
- Vitasse, Y.; Porté, A.J.; Kremer, A.; Michalet, R.; Delzon, S. Responses of canopy duration to temperature changes in four temperate tree species: Relative contributions of spring and autumn leaf phenology. Oecologia 2009, 161, 187–198. [Google Scholar] [CrossRef]
- Dolschak, K.; Gartner, K.; Berger, T.W. The impact of rising temperatures on water balance and phenology of European beech (Fagus sylvatica L.) stands. Model. Earth Syst. Environ. 2019, 5, 1347–1363. [Google Scholar] [CrossRef] [Green Version]
- Barriopedro, D.; Fischer, E.M.; Luterbacher, J.; Trigo, R.M.; García-Herrera, R. The hot summer of 2010: Redrawing the temperature record map of Europe. Science 2011, 332, 220–224. [Google Scholar] [CrossRef] [Green Version]
- Miralles, D.; Teuling, A.; van Heerwaarden, C.; de Arellano, J.V.-G. Mega-heatwave temperatures due to combined soil desiccation and atmospheric heat accumulation. Nat. Geosci. 2014, 7, 345–349. [Google Scholar] [CrossRef]
- Roznovsky, J.; Litschmann, T.; Stredova, H.; Streda, T.; Salas, P.; Horka, M. Microclimate Evaluation of the Hradec Kralove City using HUMIDEX. Contrib. Geophys. Geod. 2017, 47, 231–246. [Google Scholar] [CrossRef] [Green Version]
- Fisher, E.M. Contribution of land-atmosphere coupling to recent European summer heat waves. Geophys. Res. Lett. 2007, 34, L06707. [Google Scholar] [CrossRef] [Green Version]
- Sánchez-Benítez, A.; García-Herrera, R.; Barriopedro, D.; Sousa, P.; Trigo, R. June 2017: The Earliest European Summer Mega-heatwave of Reanalysis Period. Geophys. Res. Lett. 2018, 45, 1955–1962. [Google Scholar] [CrossRef]
- Škvareninová, J.; Babálová, D.; Valach, J.; Snopková, Z. Impact of temperature and wetness of summer months on autumn vegetative phenological phases of selected species in Fageto-Quercetum in the years 2011–2015. Acta Univ. Agric. Silvic. Mendel. Brun. 2017, 65, 939–946. [Google Scholar] [CrossRef] [Green Version]
- Škvareninová, J.; Hlavatá, H.; Jančo, M.; Škvarenina, J. Impact of climatological drought on the leaves yellowing phenophase selected tree species. Acta Hydrol. Slovaca 2018, 19, 220–226. [Google Scholar]
- Pšidová, E.; Živčák, M.; Stojnić, S.; Orlović, S.; Gomory, D.; Kučerová, J.; Ditmarová, Ľ.; Střelcová, K.; Brestič, M.; Kalaji, H.M. Altitude of origin influences the responses of PSII photochemistry to heat waves in European beech (Fagus sylvatica L.). Environ. Exp. Bot. 2018, 152, 97–106. [Google Scholar] [CrossRef]
- Ciais, P.; Reichstein, M.; Viovy, N.; Granier, A.; Ogée, J.; Allard, V.; Aubinet, M.; Buchmann, N.; Bernhofer, C.; Carrara, A.; et al. Europe-wide reduction in primary productivity caused by the heat and drought in 2003. Nature 2005, 437, 529–533. [Google Scholar] [CrossRef]
- ForestPortal. Available online: http://www.forestportal.sk/lesne-hospodarstvo/informacie-o-lesoch/zakladne-informacie-o-lesoch/Pages/klima.aspx. (accessed on 4 September 2020).
- Fotelli, M.N.; Rennenberg, H.; Holst, T.; Mayer, H.; Gessler, A. Carbon isotope composition of various tissues of beech (Fagus sylvatica) regeneration is indicative of recent environmental conditions within the forest understorey. N. Phytol. 2003, 159, 229–244. [Google Scholar] [CrossRef]
- Stojnić, S.; Suchocka, M.; Benito-Garzón, M.; Torres-Ruiz, J.M.; Cochard, H.; Bolte, A.; Cocozza, C.; Cvjetković, B.; de Luis, M.; Martinez-Vilalta, J.; et al. Variation in xylem vulnerability to embolism in European beech from geographically marginal populations. Tree Physiol. 2018, 38, 173–185. [Google Scholar] [CrossRef]
- Vido, J.; Střelcová, K.; Nalevanková, P.; Leštianska, A.; Kandrík, R.; Pástorová, A.; Škvarenina, J.; Tadesse, T. Identifying the relationships of climate and physiological responses of a beech forest using the Standardised Precipitation Index: A case study for Slovakia. J. Hydrol. Hydromech. 2016, 64, 246–251. [Google Scholar] [CrossRef] [Green Version]
- Vilhar, U. Comparison of drought stress indices in beech forests: A modelling study. iForests 2016, 9, 635–642. [Google Scholar] [CrossRef]
Figure 1.
Seven phenological stations of Slovak Hydrometeorological Institute (SHMI) with beech forests: numerical values in each of the seven locations mark the altitude. Black colour on the map marks forests where European beech dominates (>60%) in the forest tree species composition.
Figure 1.
Seven phenological stations of Slovak Hydrometeorological Institute (SHMI) with beech forests: numerical values in each of the seven locations mark the altitude. Black colour on the map marks forests where European beech dominates (>60%) in the forest tree species composition.

Figure 2.
Difference of precipitation during summer seasons in 1989–2018 (PVII–IX) compared to the normal of 1961–1990 (PNVII–IX): the black bars show the precipitation difference in mm. The red line trends indicate the linear relations including their numerical representation.
Figure 2.
Difference of precipitation during summer seasons in 1989–2018 (PVII–IX) compared to the normal of 1961–1990 (PNVII–IX): the black bars show the precipitation difference in mm. The red line trends indicate the linear relations including their numerical representation.

Figure 3.
Meteorological drought of one month (September) and three months (July to September) prior to onset of leaf colouring indicated using the indices: standardized precipitation index (SPIIX) (a), standardized precipitation evapotranspiration index (SPEIIX) (b), climatic water balance (CWBIX) (c), SPIVII–IX (d), SPEIVII–IX, (e) and dry periods index DPIVII–IX (f) for each stand over period between 1989–2018. In each mosaic, the stands are ordered with increasing altitude from the bottom to the top.

Figure 4.
Differences of temperature during summer seasons in 1989–2018 (TVII–IX) compared to the normal of 1961–1990 (TNVII–IX): the black line shows the temperature difference in °C. The red line trends indicate the linear relations including their numerical representation.
Figure 4.
Differences of temperature during summer seasons in 1989–2018 (TVII–IX) compared to the normal of 1961–1990 (TNVII–IX): the black line shows the temperature difference in °C. The red line trends indicate the linear relations including their numerical representation.

Figure 5.
Heatwaves (HW) from June to August over the studied period 1989–2018. On the figure (a) are shown temporal changes of HWAVG when HW was calculated from the average daily temperatures and on the figure (b) are shown temporal changes of HWMAX when HW was calculated from the maximum daily temperatures.

Figure 6.
The onset of leaf colouring (LCO) at beech stands during the period 1996–2018 (a) and the differences from the average DOY (Day of Year) of LCO (b): the prevailing blue colour after 2006 in (b) highlights later LCO at beech stands, especially at middle altitudes.
Figure 6.
The onset of leaf colouring (LCO) at beech stands during the period 1996–2018 (a) and the differences from the average DOY (Day of Year) of LCO (b): the prevailing blue colour after 2006 in (b) highlights later LCO at beech stands, especially at middle altitudes.

Table 2.
Classification of meteorological drought expressed by standardized precipitation index (SPI) and standardized precipitation-evapotranspiration index (SPEI) [43].
Table 2.
Classification of meteorological drought expressed by standardized precipitation index (SPI) and standardized precipitation-evapotranspiration index (SPEI) [43].
| SPI/SPEI | Drought Category |
|---|---|
| ≥2 | Extremely wet |
| 1.5 to 1.99 | Severely wet |
| 1.0 to 1.49 | Moderately wet |
| −0.99 to 0.99 | Near normal |
| −1.49 to −1.0 | Moderately dry |
| −1.99 to −1.5 | Severely dry |
| ≤−2 | Extremely dry |
Table 3.
Classification of meteorological drought designed for climatic water balance (CWB) of a single month.
Table 3.
Classification of meteorological drought designed for climatic water balance (CWB) of a single month.
| CWB (mm) | Category |
|---|---|
| ≥90 | Extremely wet |
| 60 to <90 | Severely wet |
| 30 to <60 | Moderately wet |
| >−30 to <30 | Near normal |
| >−60 to −30 | Moderately dry |
| >−90 to −60 | Severely dry |
| ≤−90 | Extremely dry |
Table 4.
Classification of meteorological drought expressed by dry period index (DPI).
| DPI | Drought Category |
|---|---|
| ≤10 | Near normal |
| >10 to 20 | Moderately dry |
| >20 to 30 | Severely dry |
| >30 | Extremely dry |
Table 5.
Classification of heatwaves (HW) according to the total number (n) of HW days in the season.
Table 5.
Classification of heatwaves (HW) according to the total number (n) of HW days in the season.
| n (HW Days) | Categories of Heatwaves |
|---|---|
| 0 to 2 | No HW |
| 3 to 10 | Weak HW |
| 11 to 20 | Moderate HW |
| 21 to 30 | Severe HW |
| >30 | Extreme HW |
Table 6.
Differences of the summer precipitation total (PVII–IX) from the precipitation normal of summer months (PNVII–IX of 1961–1990): significant differences with p ≤ 0.1 (**) and p ≤ 0.5 (*) are highlighted with bold, t(α;f − 1) is the critical value, and t is the test statistics.
Table 6.
Differences of the summer precipitation total (PVII–IX) from the precipitation normal of summer months (PNVII–IX of 1961–1990): significant differences with p ≤ 0.1 (**) and p ≤ 0.5 (*) are highlighted with bold, t(α;f − 1) is the critical value, and t is the test statistics.
| Stand | t(α;f − 1) | t | p |
|---|---|---|---|
| ZS_304 | 2.04 | 3.38 | 0.00 ** |
| MY_457 | 2.04 | 2.25 | 0.04 * |
| ZV_566 | 2.04 | 1.14 | 0.28 |
| KC_570 | 2.04 | 2.08 | 0.05 * |
| MU_579 | 2.04 | 5.11 | 0.00 ** |
| CS_1003 | 2.04 | 2.62 | 0.02 * |
| PO_1051 | 2.04 | 1.14 | 0.28 |
Table 7.
Differences of the average summer temperature (TVII–IX) from the temperature normal of summer months (TNVII–IX of 1961–1990): significant differences with p ≤ 0.1 (**) are highlighted with bold, t(α;f − 1) is the critical value, and t is the test statistics.
Table 7.
Differences of the average summer temperature (TVII–IX) from the temperature normal of summer months (TNVII–IX of 1961–1990): significant differences with p ≤ 0.1 (**) are highlighted with bold, t(α;f − 1) is the critical value, and t is the test statistics.
| Stand | t(α;f − 1) | t | p |
|---|---|---|---|
| ZS_304 | 2.04 | 5.37 | 0.00 ** |
| MY_457 | 2.04 | 5.97 | 0.00 ** |
| ZV_566 | 2.04 | 5.31 | 0.00 ** |
| KC_570 | 2.04 | 6.27 | 0.00 ** |
| MU_579 | 2.04 | 7.30 | 0.00 ** |
| CS_1003 | 2.04 | 5.89 | 0.00 ** |
| PO_1051 | 2.04 | 7.00 | 0.00 ** |
Table 8.
Mann–Kendal (M-K) trend test of the heatwaves (HWAVG and HWMAX) and average temperatures (TVI–IX, TVII–IX, TVIII–IX, and TIX) prior to onset of leaf colouring during 1989–2018. Significant trends with p ≤ 0.1 (**) and p ≤ 0.5 (*) are highlighted with bold.
Table 8.
Mann–Kendal (M-K) trend test of the heatwaves (HWAVG and HWMAX) and average temperatures (TVI–IX, TVII–IX, TVIII–IX, and TIX) prior to onset of leaf colouring during 1989–2018. Significant trends with p ≤ 0.1 (**) and p ≤ 0.5 (*) are highlighted with bold.
| ZS_304 | MY_457 | ZV_566 | KC_570 | MU_579 | CS_1003 | PO_1051 | ||||||||
|---|---|---|---|---|---|---|---|---|---|---|---|---|---|---|
| K tau | p | K tau | p | K tau | p | K tau | p | K tau | p | K tau | p | K tau | p | |
| HWAVG | 0.33 | 0.01 ** | 0.40 | 0.00 ** | 0.41 | 0.00 ** | 0.32 | 0.02 * | 0.29 | 0.03 * | 0.32 | 0.02 * | 0.39 | 0.00 ** |
| HWMAX | 0.30 | 0.03 * | 0.38 | 0.00 ** | 0.23 | 0.09 | 0.13 | 0.35 | 0.26 | 0.06 | 0.26 | 0.05 * | 0.39 | 0.00 ** |
| TVI–IX | 0.48 | 0.00 ** | 0.48 | 0.00 ** | 0.48 | 0.00 ** | 0.41 | 0.00 ** | 0.41 | 0.00 ** | 0.46 | 0.00 ** | 0.44 | 0.00 ** |
| TVII–IX | 0.39 | 0.00 ** | 0.41 | 0.00 ** | 0.39 | 0.00 ** | 0.36 | 0.01 ** | 0.32 | 0.01 ** | 0.40 | 0.00 ** | 0.41 | 0.00 ** |
| TVIII–IX | 0.27 | 0.04 * | 0.29 | 0.02 * | 0.25 | 0.05 * | 0.36 | 0.01 ** | 0.28 | 0.03 * | 0.31 | 0.02 * | 0.31 | 0.02 * |
| TIX | 0.14 | 0.28 | 0.19 | 0.14 | 0.27 | 0.04 * | 0.25 | 0.05 * | 0.25 | 0.05 * | 0.21 | 0.11 | 0.22 | 0.09 |
Table 9.
M-K trend test of the onset of leaf colouring (LCO): significant trends with p ≤ 0.1 (**) and p ≤ 0.5 (*) are highlighted in bold.
Table 9.
M-K trend test of the onset of leaf colouring (LCO): significant trends with p ≤ 0.1 (**) and p ≤ 0.5 (*) are highlighted in bold.
| Stand | K-tau | p | S-Slope |
|---|---|---|---|
| ZS_304 | 0.12 | 0.51 | 0.1 |
| MY_457 | 0.34 | 0.03 * | 0.4 |
| ZV_566 | 0.52 | 0.00 ** | 1.2 |
| KC_570 | 0.49 | 0.00 ** | 0.6 |
| MU_579 | 0.31 | 0.04 * | 0.8 |
| CS_1003 | 0.21 | 0.18 | 0.3 |
| PO_1051 | 0.39 | 0.01 ** | 0.5 |
Table 10.
Pearson correlation between onset of leaf colouring (LCO) and the bioclimatic indicators (BioClim) of meteorological drought: standardized precipitation indices (SPI), climate water balances (CWB), dry period index (DPI), precipitation totals (P) and heatwaves (HW), and average temperatures (T) over summer season. Significant correlations with p ≤ 0.1 (**) and p ≤ 0.5 (*) are highlighted with bold.
| Stand/BioClim | ZS_304 | MY_457 | ZV_566 | KC_570 | MU_579 | CS_1003 | PO_1051 |
|---|---|---|---|---|---|---|---|
| SPIIX | 0.60 ** | −0.12 | 0.15 | −0.21 | 0.42 * | 0.02 | 0.21 |
| SPIVII–IX | 0.31 | −0.04 | 0.16 | −0.18 | −0.01 | 0.23 | −0.07 |
| SPEIIX | 0.25 | −0.15 | 0.08 | −0.30 | 0.36 | −0.02 | 0.12 |
| SPEIVII–IX | 0.37 | −0.18 | 0.05 | −0.25 | −0.09 | 0.22 | −0.06 |
| CWBIX | 0.18 | −0.11 | 0.08 | −0.20 | 0.25 | 0.03 | 0.16 |
| CWBVII–IX | 0.41 | −0.13 | −0.07 | −0.23 | −0.05 | 0.22 | −0.10 |
| DPIVII–IX | −0.43 | 0.10 | 0.10 | 0.35 | −0.04 | −0.21 | 0.02 |
| PVII–IX | 0.41 | −0.06 | 0.18 | −0.15 | −0.01 | 0.23 | −0.09 |
| HW AVG | 0.01 | 0.25 | 0.22 | 0.59 ** | −0.02 | −0.18 | 0.16 |
| HW MAX | −0.09 | 0.20 | −0.01 | 0.56 ** | 0.08 | −0.24 | 0.18 |
| TVI–IX | −0.23 | 0.30 | 0.30 | 0.51 * | 0.15 | −0.05 | 0.11 |
| TVII–IX | −0.23 | 0.37 | 0.30 | 0.53 * | 0.23 | −0.02 | 0.08 |
| TVIII–IX | −0.40 | 0.30 | 0.23 | 0.48 * | 0.21 | −0.16 | 0.08 |
| TIX | −0.16 | 0.30 | 0.31 | 0.50 * | 0.13 | 0.14 | 0.19 |
© 2020 by the authors. Licensee MDPI, Basel, Switzerland. This article is an open access article distributed under the terms and conditions of the Creative Commons Attribution (CC BY) license (http://creativecommons.org/licenses/by/4.0/).
Share and Cite
MDPI and ACS Style
Lukasová, V.; Vido, J.; Škvareninová, J.; Bičárová, S.; Hlavatá, H.; Borsányi, P.; Škvarenina, J. Autumn Phenological Response of European Beech to Summer Drought and Heat. Water 2020, 12, 2610. https://doi.org/10.3390/w12092610
AMA Style
Lukasová V, Vido J, Škvareninová J, Bičárová S, Hlavatá H, Borsányi P, Škvarenina J. Autumn Phenological Response of European Beech to Summer Drought and Heat. Water. 2020; 12(9):2610. https://doi.org/10.3390/w12092610
Chicago/Turabian StyleLukasová, Veronika, Jaroslav Vido, Jana Škvareninová, Svetlana Bičárová, Helena Hlavatá, Peter Borsányi, and Jaroslav Škvarenina. 2020. "Autumn Phenological Response of European Beech to Summer Drought and Heat" Water 12, no. 9: 2610. https://doi.org/10.3390/w12092610
Note that from the first issue of 2016, this journal uses article numbers instead of page numbers. See further details here.