Methane Levels of a River Network in Wuxi City, China and Response to Water Governance

1
College of Geography Science, Nanjing Normal University, Nanjing 210008, China
2
State Key Laboratory of Lake Science and Environment, Nanjing Institute of Geography and Limnology, Chinese Academy of Sciences, Nanjing 210045, China
*
Author to whom correspondence should be addressed.
Water 2020, 12(9), 2617; https://doi.org/10.3390/w12092617
Submission received: 1 August 2020
/
Revised: 11 September 2020
/
Accepted: 14 September 2020
/
Published: 18 September 2020
(This article belongs to the Section Water Resources Management, Policy and Governance)
Abstract
:The majority of rivers are a CH4 source that accounts for an important proportion of annual global emissions. However, CH4 evasion from urban river networks has received disproportionately less attention than their contribution. The effect of water governance on water quality and CH4 emission in urban areas remains unclear. Water quality, CH4 concentrations, and fluxes from a river network in Binhu District, Wuxi City, and their response to water governance were analyzed in this study. CH4 concentrations in the investigated rivers ranged from 0.05 μmol L−1 to 16.37 μmol L−1 (2.47 ± 4.5 μmol L−1, medium 0.23 μmol L−1), and CH4 diffusive fluxes were 75.55 ± 171.78 μmol m−2 h−1 with a medium of 6.50 μmol m−2 h−1. CH4 concentration showed a significant correlation with water quality parameters, especially for NH3–N (r = 0.84, p < 0.001). Significant differences in water quality and CH4 levels were found between sites that had conducted water management and those that continued to exhibit poor water quality. Our analysis showed that rivers under water governance have a positive tendency toward water ecological restoration, and a significant decrease in CH4 efflux to the air can be achieved after extensive and intensified water governance.
1. Introduction
CH4 is a potent greenhouse gas, and the global warming potential per CH4 molecule is approximately 30 times greater than that of CO2 at a 100-year time scale. The increase in atmospheric CH4 concentrations has contributed ~23% to the additional radiative forcing accumulated in the lower atmosphere since 1750 [1,2]. The recent global estimate of CH4 from freshwaters was 103 Tg CH4 year−1, which can substantially affect the estimate of global land greenhouse gas sink [3]. However, CH4 dynamic in streams and rivers has received remarkably less attention than those in lakes, reservoirs, and wetlands [4,5]. The global-scale estimate revealed an annual emission from streams and rivers of 26.8 Tg CH4, which is equivalent to ~15–40% of wetland and lake effluxes, respectively [6]. Among the river CH4 sources, CH4 evasion from urban river networks has received disproportionately less attention compared with their contribution. Carbon evasion from the Shanghai river network can offset up to 40% of regional terrestrial net ecosystem production and 10% of net carbon uptake in the river-dominated East China Sea [7]. Both studies of rivers in Shanghai and Chongqing found that urban and suburban areas contribute higher river CH4 concentration and flux than rural locations due to the worse water quality of the former [7,8]. Therefore, CH4 evasion from urban river networks requires additional attention as the urbanization process and proportion of urban land use increase globally.
However, despite the inevitable increase of sewage during urbanization, urban water governance has concurrently taken effect not only in Western countries but also in the developing world. For example, China has recently established and implemented the “He–Zhang” system, which is a network of river chiefs and keepers across the country at various administrative levels, to improve management efficiency [9]. Water treatment measures, such as dredging, planting of artificial waterweed, and aeration, were applied. Riverbank management measures, such as cleaning up of accumulated garbage, riparian dyke strengthening, and afforestation, were also used. These measures can change the water and sediment environment and may also significantly influence CH4 dynamics. Under this water governance, improvement of water quality in the urban river network and change in CH4 dynamics must be determined. In this study, we investigated the water quality and CH4 levels in the river network of Wuxi City and analyzed the effect of water governance on water quality and CH4 emission.
2. Materials and Methods
2.1. Study Area
Wuxi City (31°7′–32°2′ N and 119°33′–120°38′ E) is located in the Yangtze River delta plain in southeastern China, with the Yangtze River and Taihu Lake situated in the north and south, respectively. Given its subtropical monsoon climate, with approximately 64.38% of the annual precipitation occurring during the wet season (May to September), and low-lying topography, Wuxi has a highly complicated river network with a density of 3–4 km km−2 [10]. As an economically developed city in China, Wuxi is characterized by high population density and mature industries. Hence, the river network in Wuxi is susceptible to water pollution from domestic and industrial sewage, while its river network has limited draining and self-purification capacity. A regional water supply crisis triggered by algae bloom in Lake Taihu occurred in Wuxi in June 2007 [11]. Since then, water governance of Taihu Basin has received considerable attention and river management has become an important policy.
The investigated rivers are located in the Binhu District of southwest Wuxi City. Binhu District, including the water areas of Lake Lihu, Meiliang Bay, and Gonghu Bay, has more than 250 river channels. The study area is divided into two parts. The first part is located in the northeast of Lake Lihu and between the lake and Beijing–Hangzhou Grand Canal, and the second part is in the southeast of Lake Lihu and north of Gonghu Bay (Figure 1). Selected rivers in the north of Lake Lihu are primarily located in the urban center and characterized by intensive residential and business areas, while the south of Lake Lihu is a suburban area.
Many pump stations and sluice gates were constructed to control the river flow direction and water amount, especially for main rivers. For example, Liangxi River is a large water body that directly connects Lake Lihu and Beijing–Hangzhou Grand Canal. The river now flows slowly from west to east under the regulation of more than six pump stations to decrease the influx of pollution to Lake Lihu. Rivers typically demonstrate a sluggish flow, and some are even static. Blocking in the upper and lower reaches of some rivers due to plugging or artificially controlled sluice gates leads to varying water quality in sampling sites on the same river channel. Hence, each site was treated as an independent individual, and all sites were analyzed on the same level in this study.
2.2. Sampling and Measurements
Eighteen rivers located in the Binhu District of Wuxi City were investigated in this study (Table 1). According to river length, 2 to 4 sampling sites per river were chosen to reach 45 sampling sites. CH4 concentrations in the surface water were investigated in 21 sampling sites. The water quality of all the 45 sampling sites was measured.
Sampling was conducted in September 2019. To measure CH4 concentration in the surface water, triplicate river waters at the surface depth of 0–10 cm were collected in glass vials pre-added with 2 g of sodium chloride, and the vials were immediately sealed with butyl stoppers. Sediment samples were collected using a sediment sampler (Ekman–Birge type). To measure CH4 concentration in the sediment, after retrieval, triplicate surface sediments (5 mL) were collected using a 10 mL cutoff plastic syringe and extruded into 50 mL glass vials containing 5 mL of 4% NaOH [12]. The remaining sediment samples were transferred immediately into a plastic bag and refrigerated for further analysis. Vials with water and sediment were refrigerated at 4 °C, and CH4 concentration was measured within 24 h. Water temperature, dissolved oxygen (DO) concentration, pH, and oxidation–reduction potential (ORP) were measured using a multiparameter water quality probe (YSI, Yellow Springs, OH, USA), and the transparency (Secchi depth, SD) was obtained via in situ measurements with a Secchi disk. Surface water (1 L) was collected, stored in the dark, and frozen at −20 °C for further analysis.
CH4 concentrations in the headspace were determined using gas chromatography (7890B with a Porapak Q column and a flame ionization detector, Agilent Technologies, Lexington, MA, USA) via manual injection of 5 mL headspace gas sucking from the vials with a 5 mL syringe. CH4 concentrations in the river water and sediments were calculated using the headspace equilibration method according to Fick’s law [13]. Please refer to paper [14] for the detailed steps.
Collected water samples were measured for water quality parameters, including total nitrogen (TN), total phosphorus (TP), chemical oxygen demand (CODMn), nitrate (NO3–N), ammonia nitrogen (NH3–N), phosphate (PO4–P), and chlorophyll a (Chla). TN and TP were photometrically determined using a UV–VIS spectrophotometer (UV3600, Shimadzu, Japan) [15]. Water was filtered through 0.7 μm membranes (GF/F, Whatman, Maidstone, UK), and Chla was extracted from the membrane with 90% acetone and measured via spectrophotometric analysis [16]. Concentrations of NO3–N, NH3–N, and PO4–P in filtered water were measured with a continuous flow analyzer (San Plus, SKALAR, Breda, Netherlands). The dissolved organic carbon (DOC) and dissolved inorganic carbon (DIC) contents were measured with a total organic carbon analyzer (TOC-V CPN, Shimadzu, Kyoto, Japan). CODMn was determined via UV–VIS spectrometry [17]. Sediment water content was measured by drying the wet sediment to a constant weight at 105 °C. Loss on ignition (LOI) was obtained by igniting the dried sediment at 550 °C for 4 h [18].
2.3. Air–Water CH4 Diffusive Flux
The diffusive flux of CH4 in the air–water interface is expressed as follows:
where F is the diffusive flux, kCH4 is the piston velocity (m d−1), Cw is the CH4 concentration measured in the water (μmol L−1), and Ceq is the CH4 concentration in the water at equilibrium with the atmosphere. The following gas transfer velocity of CH4 (kCH4) was estimated using normalized k that corresponds to kCH4 at 20 °C (k600), in situ water temperature, and Schmidt number (Sc):
where n is the proportionality coefficient determined by the wind velocity. Here, n was set to 0.5 to represent a moderately turbulent surface in this study [7,19]. Sc and k600 were determined using the measured in situ water temperature and mean wind speed of the study month (September 2019) collected from the website of the Chinese Meteorological Bureau [20,21].
F = kCH4 × (Cw − Ceq)
2.4. Trophic Level Index (TLI)
As recommended by the China National Environmental Monitoring Center, a trophic level index (TLI) was used to assess the water quality in this study. TLI is a summation of the TLI (Chla) and the weighted TLI of the other parameters, which are based on correlations with Chla [22]. The TLI can be expressed as follows:
where TLI (∑) is the comprehensive TLI, TLI (j) is the TLI of parameter j, m is the number of parameters used, and Wj is the weight of the parameter TLI (j), which is determined using the correlation of parameter j with Chla. Wj is calculated as follows:
where r1j represents the correlation of parameter j with Chla. In this study, TN, TP, SD, and CODMn, along with Chla, were used to assess the water quality, and their correlation coefficients with Chla were set to 0.82, 0.84, −0.83, and 0.83, respectively, in accordance with an investigation on 26 Chinese lakes [23]. The TLI of each parameter can be calculated as follows:
where the unit of Chla is μg L−1; the units of TN, TP, and CODMn are mg L−1; and SD represents the Secchi depth (unit: m).
TLI (Chla) = 10 × (2.5 + 1.086 lnChla),
TLI (TP) = 10 × (9.436 + 1.624 lnTP),
TLI (TN) = 10 × (5.453 + 1.694 lnTN),
TLI (SD) = 10 × (5.118 − 1.94 lnSD),
TLI (CODMn) = 10 × (0.109 + 2.661 lnCODMn),
2.5. Statistical Analysis
Water quality variables and CH4 concentrations of the surface water were tested for normality distribution using the Shapiro–Wilk test. The majority of the variables with non-normal distributions were log-transformed, except CODMn, which conducted reciprocal transformation, to approach normality. Stepwise multiple regressions were applied to identify which variables explained the variance of CH4 concentration, and p < 0.05 determined the significance probability of each control variable. R2 and F-tests were applied to evaluate the regression equation. The above analyses were performed using IBM SPSS 20.
CH4 concentrations of the surface water in the sampling sites were calculated according to the regression function. In terms of exposure to management activities, 45 sampling sites were separated into “human” (H) and “natural” groups. Based on the TLI and the vegetation status during sampling, the sites of the natural group were further divided into “natural good” (NG) and “natural bad” (NB) groups (Table 1). CH4 and water quality variables were analyzed via principal component analysis (PCA) using R packages FactoMineR [24] and factoextra [25,26]. One-way analysis of variance (ANOVA) and a post hoc “Bonferroni” method were adopted to test the significant differences of CH4 and water quality variables among the three groups (p < 0.05) with IBM SPSS 20.
3. Results
3.1. CH4 Concentrations and Diffusive Fluxes
CH4 concentrations in the investigated rivers ranged from 0.05 μmol L−1 to 16.37 μmol L−1 (2.47 ± 4.5 μmol L−1, medium 0.23 μmol L−1) based on 21 measured data, and according to the measured in situ water temperature and mean wind speed from the meteorological website (~2.5 m s−1), the calculated CH4 diffusive fluxes were 75.55 ± 171.78 μmol m−2 h−1 with a medium of 6.50 μmol m−2 h−1 (Table 2). Great values of CH4 concentrations were observed at sites 9 and 27, which were the only two sites with CH4 concentrations higher than 10 μmol L−1. Four sites, namely, 18, 21, 24, and 26, demonstrated CH4 concentrations higher than 1 μmol L−1. These results indicated high CH4 concentration in Xianjingbang and Lucunhe Rivers and in the downstream of Chendahe. The surface water DOC content of the 21 sampling sites ranged from 1.54 mg L−1 at site 18 to 30.09 mg L−1 at site 25, and no significant difference was found between the sites with water treatment and those under natural status (p > 0.05). The CH4 content in the surface sediment ranged from 173.37 μmol L−1 to 1028.89 μmol L−1 (430.73 ± 234.12 μmol L−1, medium 423.49 μmol L−1) and had no significant relationship with CH4 in the water and water quality variables (p > 0.05). Compared with the surface water CH4, the sediment CH4 was significantly higher at site 18 (1028.89 μmol L−1) but lower at site 21 (173.37 μmol L−1) (Table 2). The sediment water content and LOI could not adequately explain the CH4 level in the sediment (p > 0.05). For example, site 8 had a high level of water content and LOI, but its sediment CH4 was only in the middle level (448.86 μmol L−1). However, site 17 showed an extremely low sediment CH4 (18.01 μmol L−1) compared with the other sites, and this result is consistent with its low sediment water content and LOI.
3.2. Water Quality
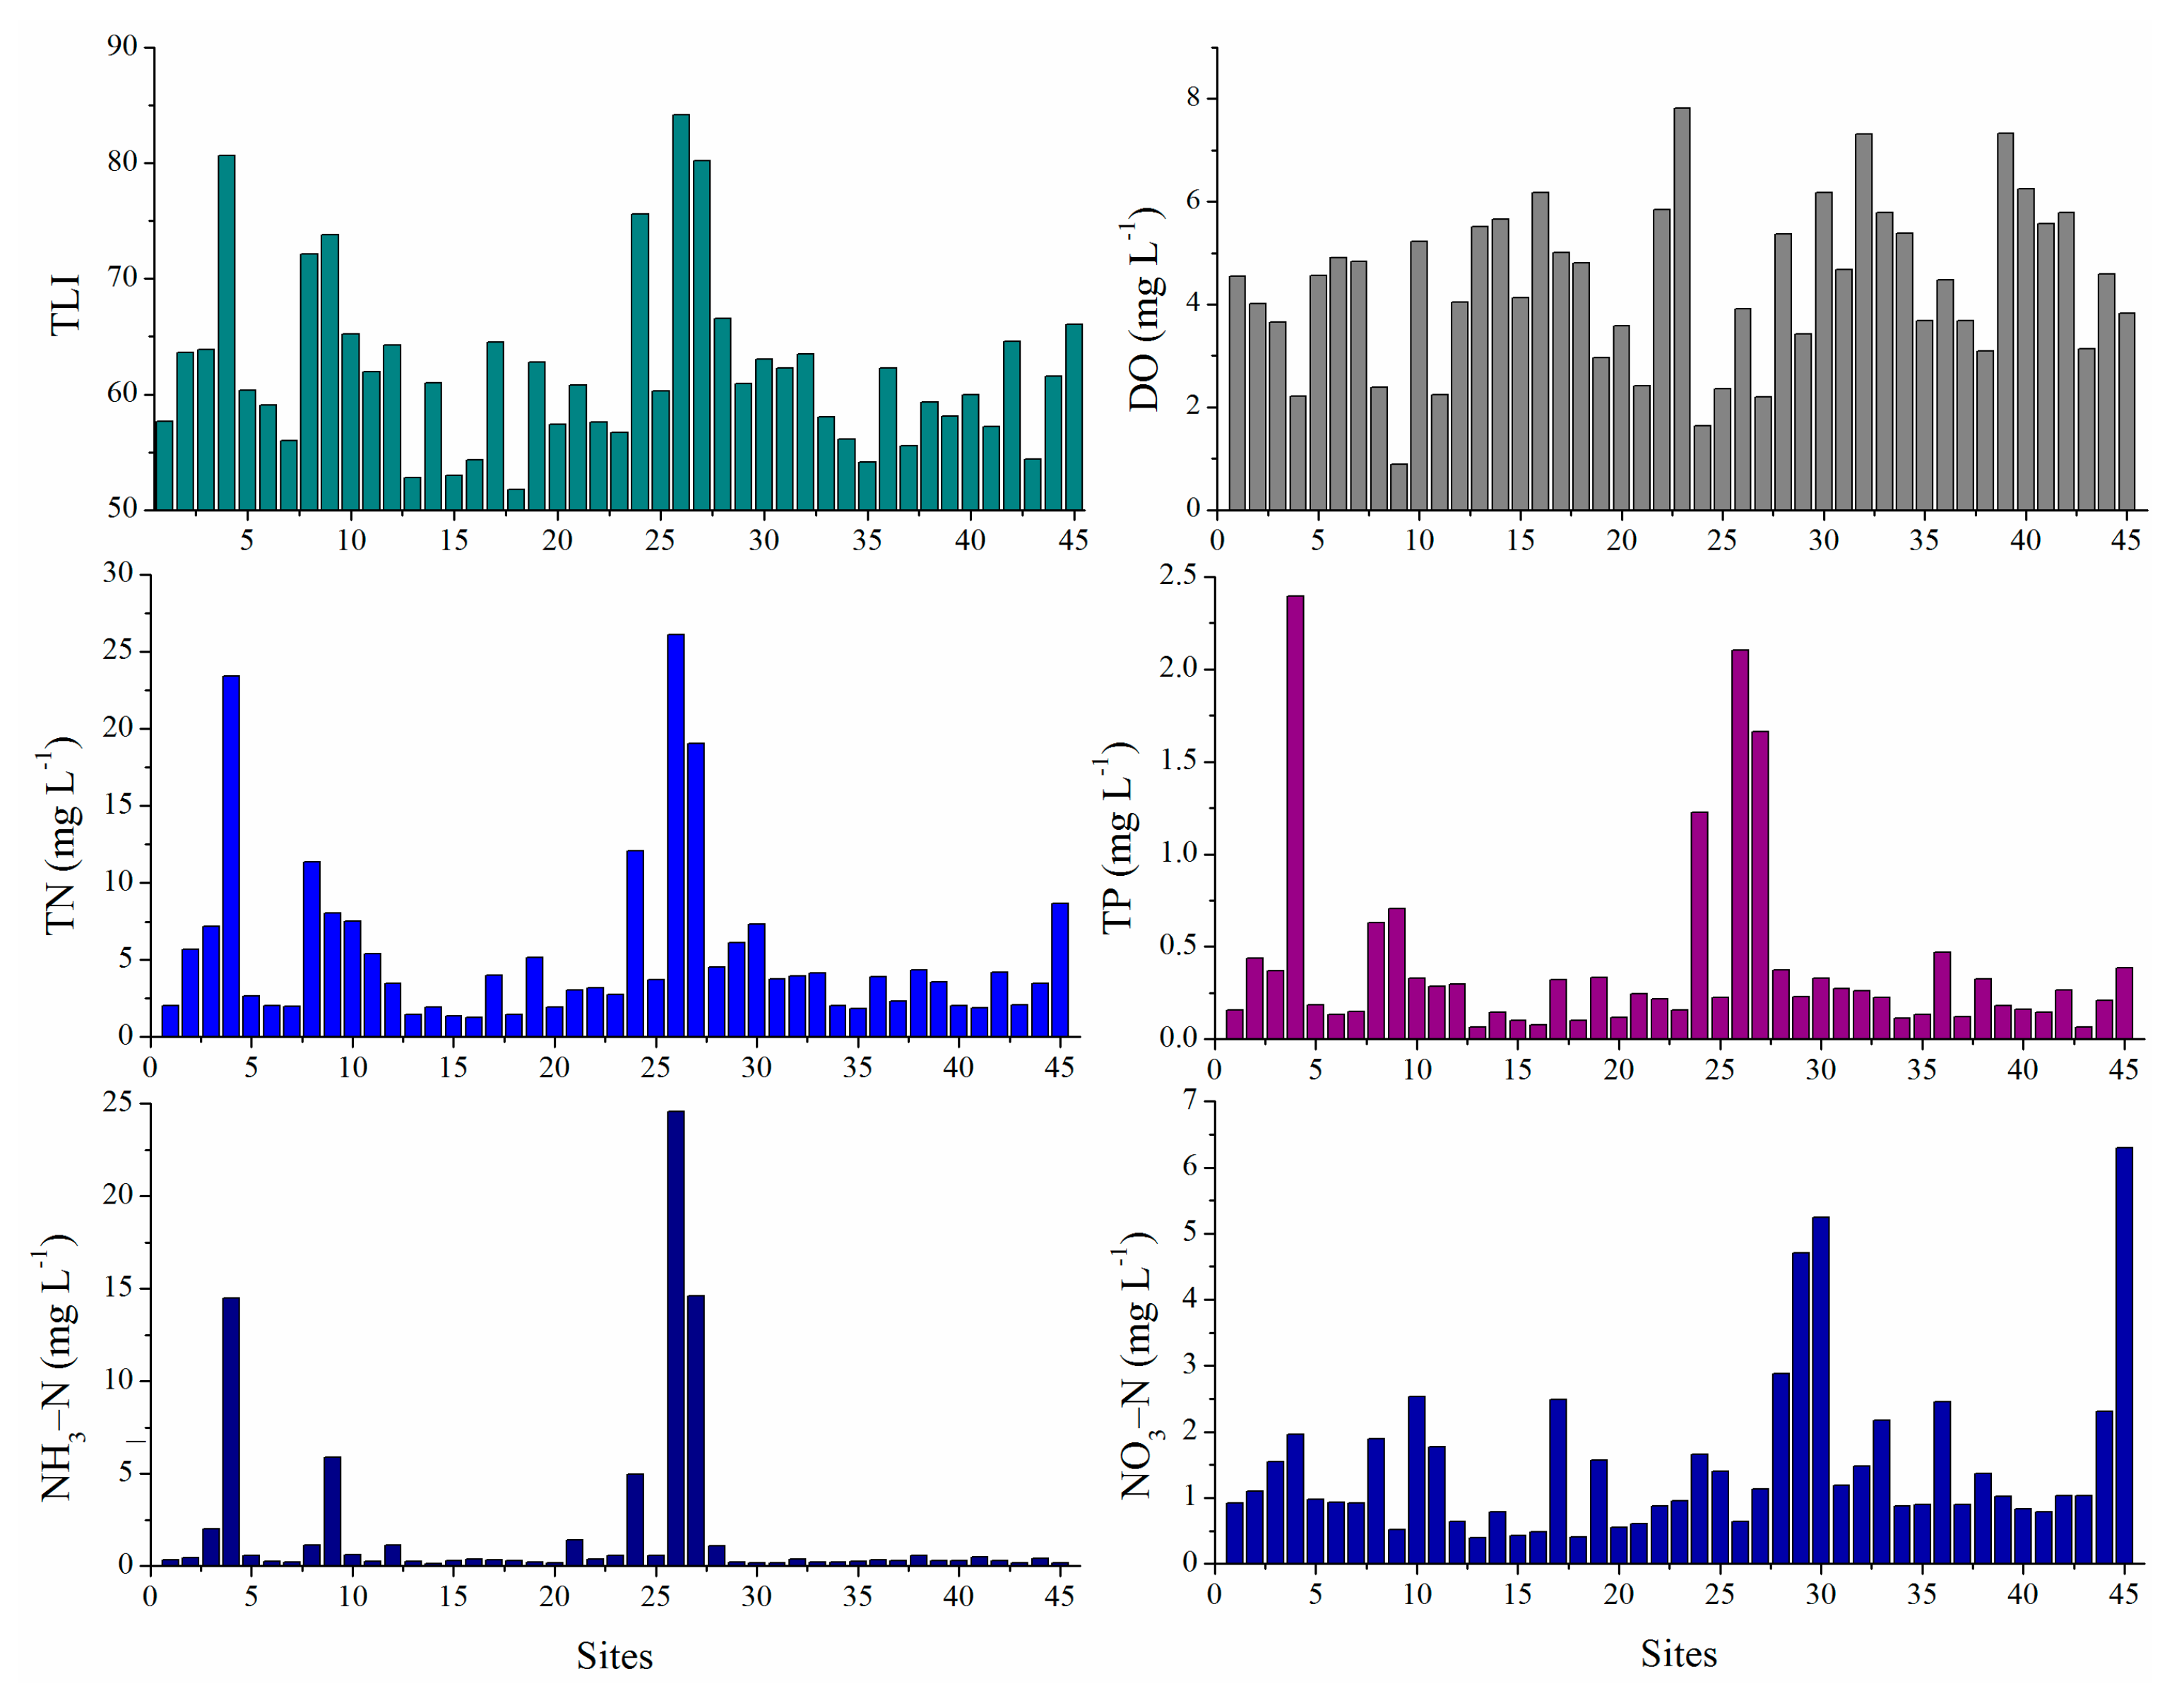
The TLI ranged from 52 to 84, with high values representing high eutrophication levels (Figure 1). The study sites were divided into the following groups: Groups A, B, and C included sites with TLI < 60, 60 < TLI < 70, and TLI > 70, respectively (Table 1, Group 1). Groups A, B, and C had 19, 20, and 6 sampling sites, respectively. Several sites in group A were macrophyte-dominated, and macrophytes were planted artificially in sites 13 and 18 or grew naturally in site 43 (Figure 1). The sites in group A obtained TN and TP ranges of 1.2–4.33 and 0.066–0.32 mg L−1, respectively. Floating algae were observed on the water surface during sampling in the majority of the sites in group B and in all the sites in group C (Figure 1). TN and TP ranges in the group B sites were 1.91–7.54 and 0.15–0.44 mg L−1, respectively. Six sites (4, 8, 9, 24, 26, and 27) in group C showed a significantly high nutrition level, with TN and TP reaching 26 mg L−1 at site 26 and 2.4 mg L−1 at site 4, respectively. These findings indicate extremely poor water quality in Dongxinhe, Xianjingbang, and Lucunhe Rivers. Moreover, these six sites had significantly higher NH3–N and NO3–N contents and lower DO than the other sites (Figure 2) but with no water quality control, except site 8. By contrast, rivers located in the south of Lake Lihu were relatively clear, although under natural state, especially for Miaoqiaobang, Renzigang, and Shanxihe Rivers (Figure 1). Several sites with good water quality were located in the lakeshore and received water from Lake Lihu, such as 39, 40, 41, 13, and 20. This result indirectly reflects the good water quality in Lake Lihu.
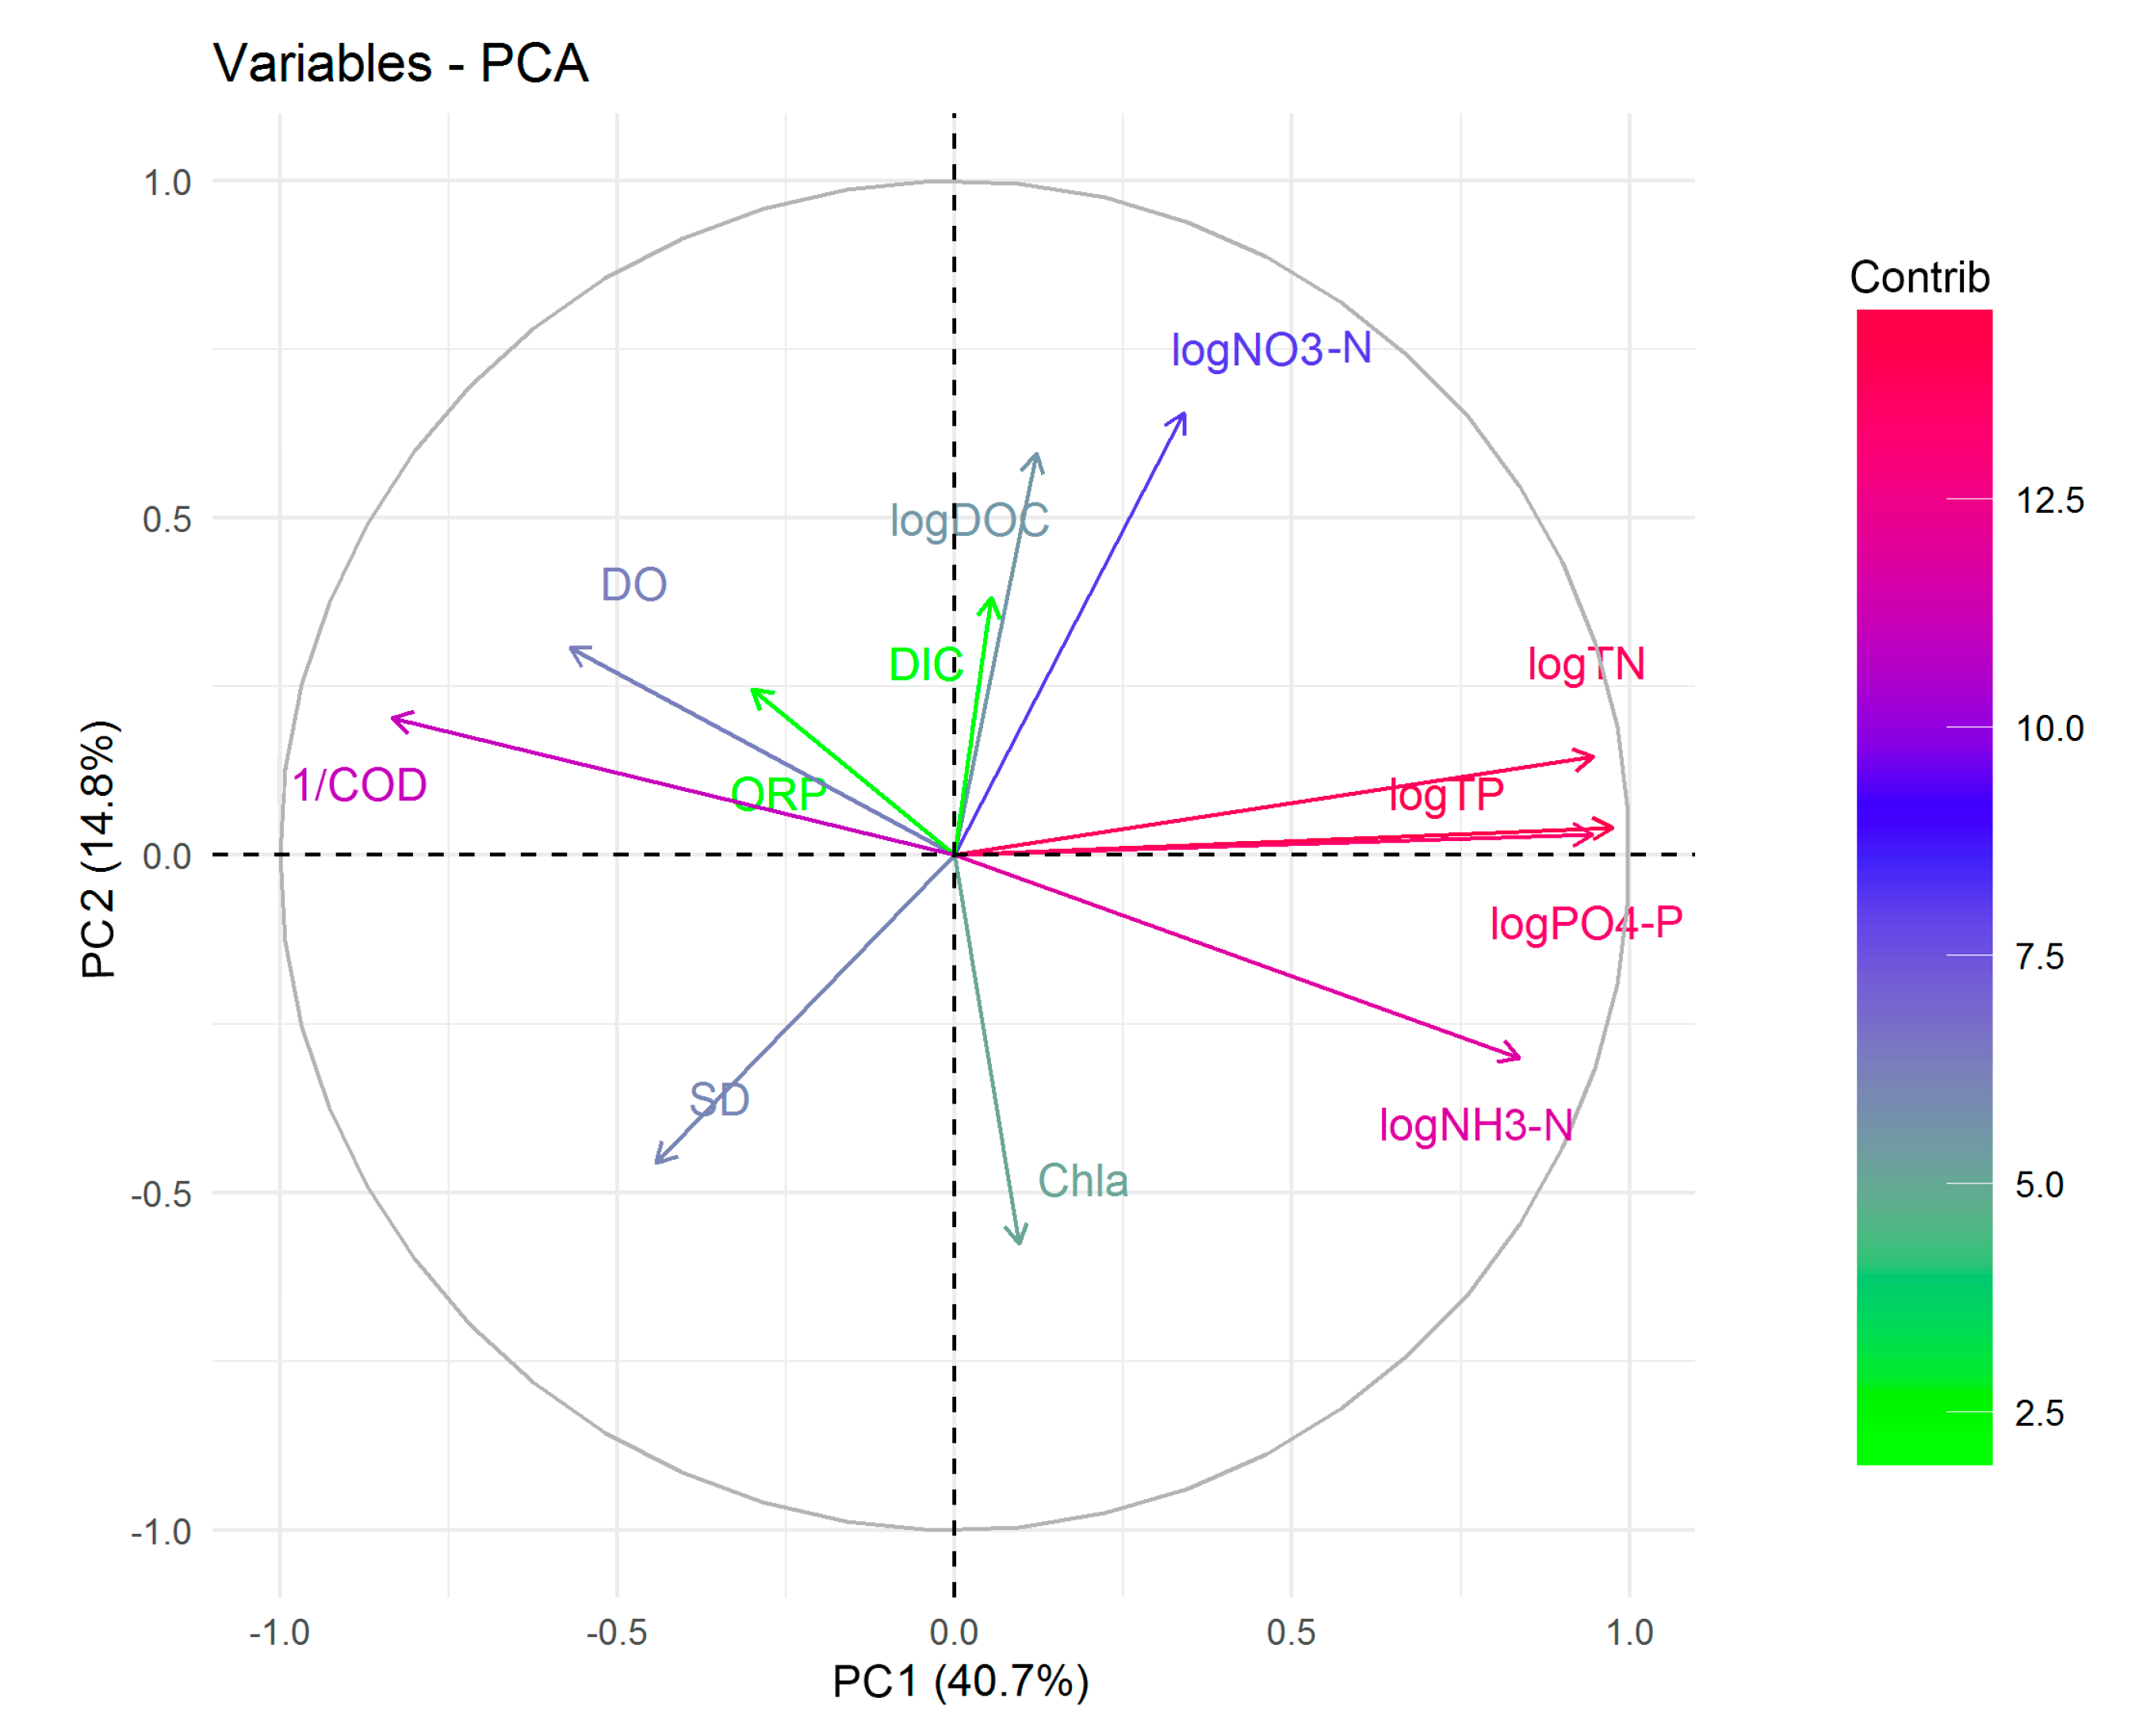
The first principal component (PC1) shows a high variance explanation for water quality variables (40.7%), while the second principal component (PC2) only explains 14.8%. High contribution of TN, NH3–N, TP, PO4–P, and CODMn to PC1 indicates that PC1 represents the river nutrition level. Chla and NO3–N exhibit the highest correlation with PC2 but with low contribution (Figure 3). The negative correlations of DO and ORP with NH3–N and CODMn indicate that hyper-eutrophicated sites are characterized by decreasing DO. DOC was negatively correlated with Chla and had no relationship with N and P.
3.3. Water Governance, CH4, and Water Quality
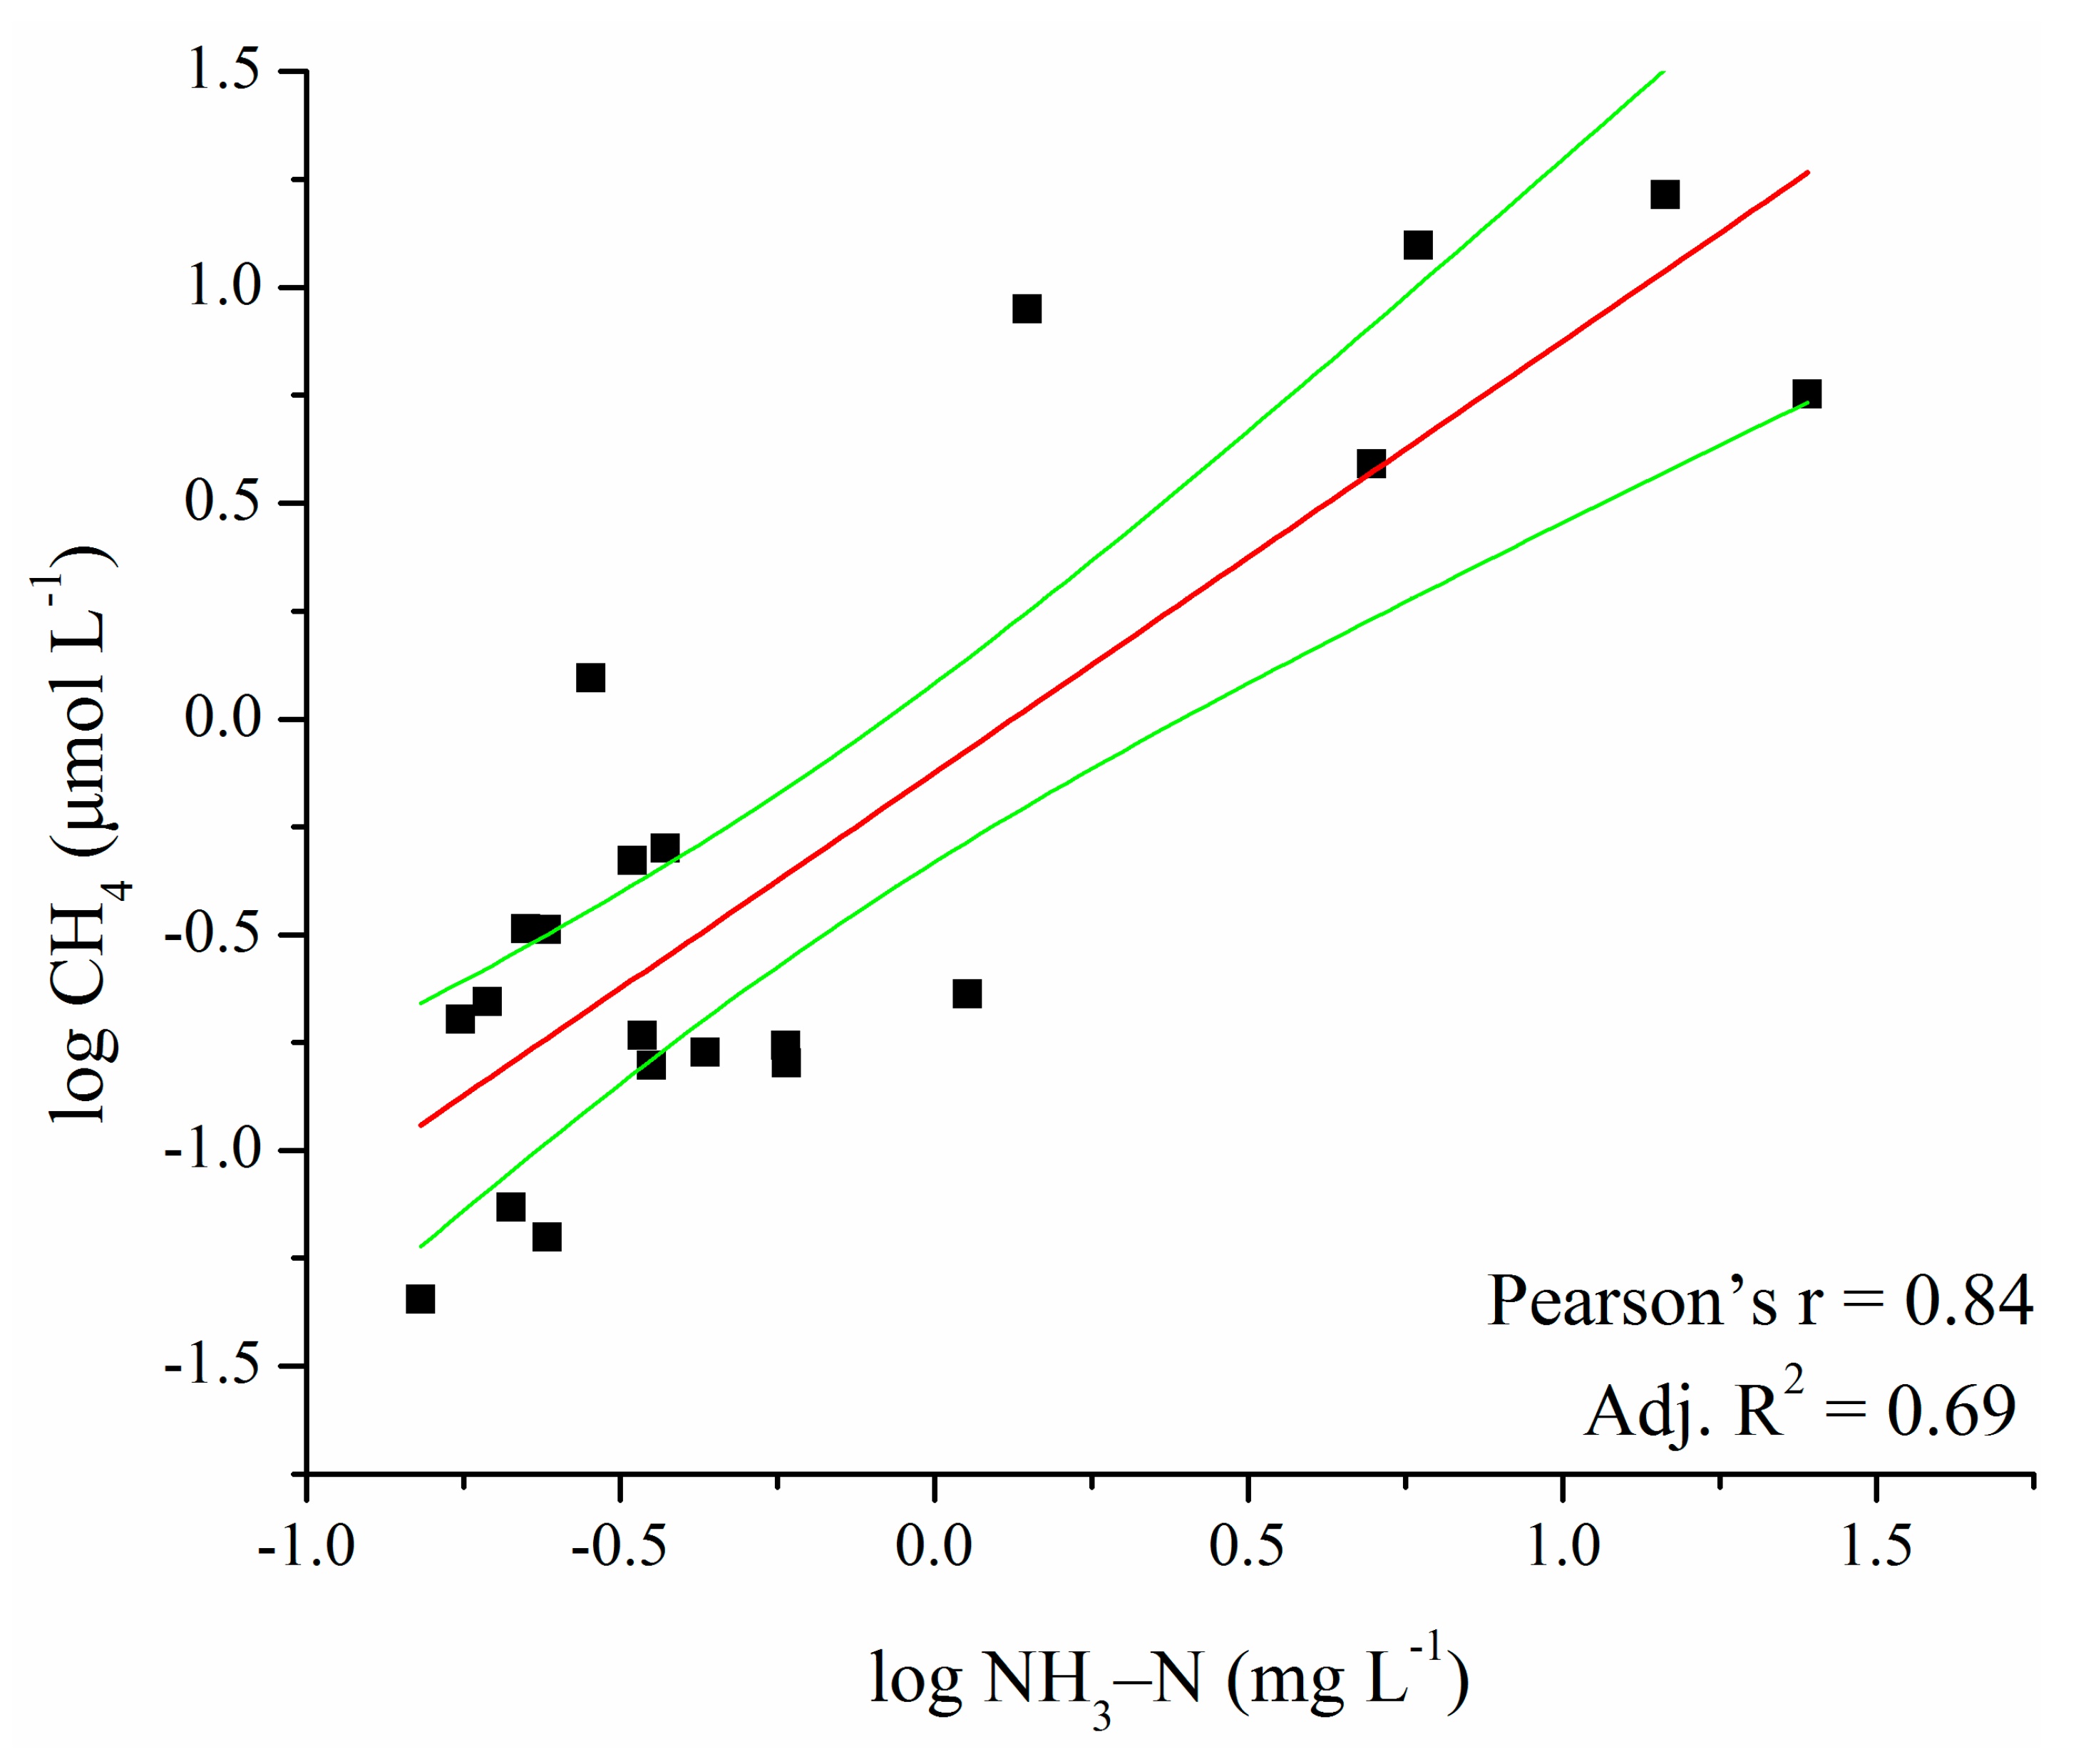
CH4 concentration in the surface water of the 21 sampling sites had a significant correlation with DO, ORP, N and P contents, and CODMn (p < 0.05), with the most significant correlation with NH3–N among other variables (Figure 4). The significant correlation of CH4 concentration with the TLI (r = 0.63, p < 0.005) was not as strong as that of CH4 with NH3–N (r = 0.84, p < 0.001). Apart from water quality, CH4 concentration was also correlated with water depth (r = −0.49, p < 0.05). However, according to the sampling record, extremely low water depths at sites 26 and 27 were caused by pumping; if these two sites were excluded, then CH4 concentration was not correlated with water depth (p = 0.30). The stepwise regression analysis determined the most robust result of CH4 using the variables NH3–N and ORP (Function 4). CH4 concentration in the surface water of the sampling sites was reconstructed using Function 10 as follows:
Log CH4 = 0.97 × log NH3–N − 0.005 × ORP + 0.445 (adj R2 = 0.67, p < 0.001)
Among the 21 sites for CH4 sampling, 9 sites conducted water governance (shaded sites in Table 2). The management practices were mainly for contamination control, such as the development of a sewage water treatment system and the separation of rainwater and sewage systems, and aquatic ecological rehabilitation, such as dredging, aeration, and ecological floating bed. We confirmed via observation and investigation that sites 5, 14, 17, and 21 had conducted dredging; sites 17 and 18 were performing aeration when sampling; and sites 19 and 21 were equipped with aeration devices but were not functioning. Finally, 20 sampling sites that conducted water governance were selected and separated into group H (Table 1). In this study, the sampling sites with water governance, regardless of how many measures were used, were all placed in group H. The 25 remaining sites were separated into groups NG and NB according to the TLI (Table 1). The sites in the NG group obtained a maximum TLI of 60 and were typically macrophyte-dominated, and the TLI of the NB group was higher than 60, with floating algae present in most sites.
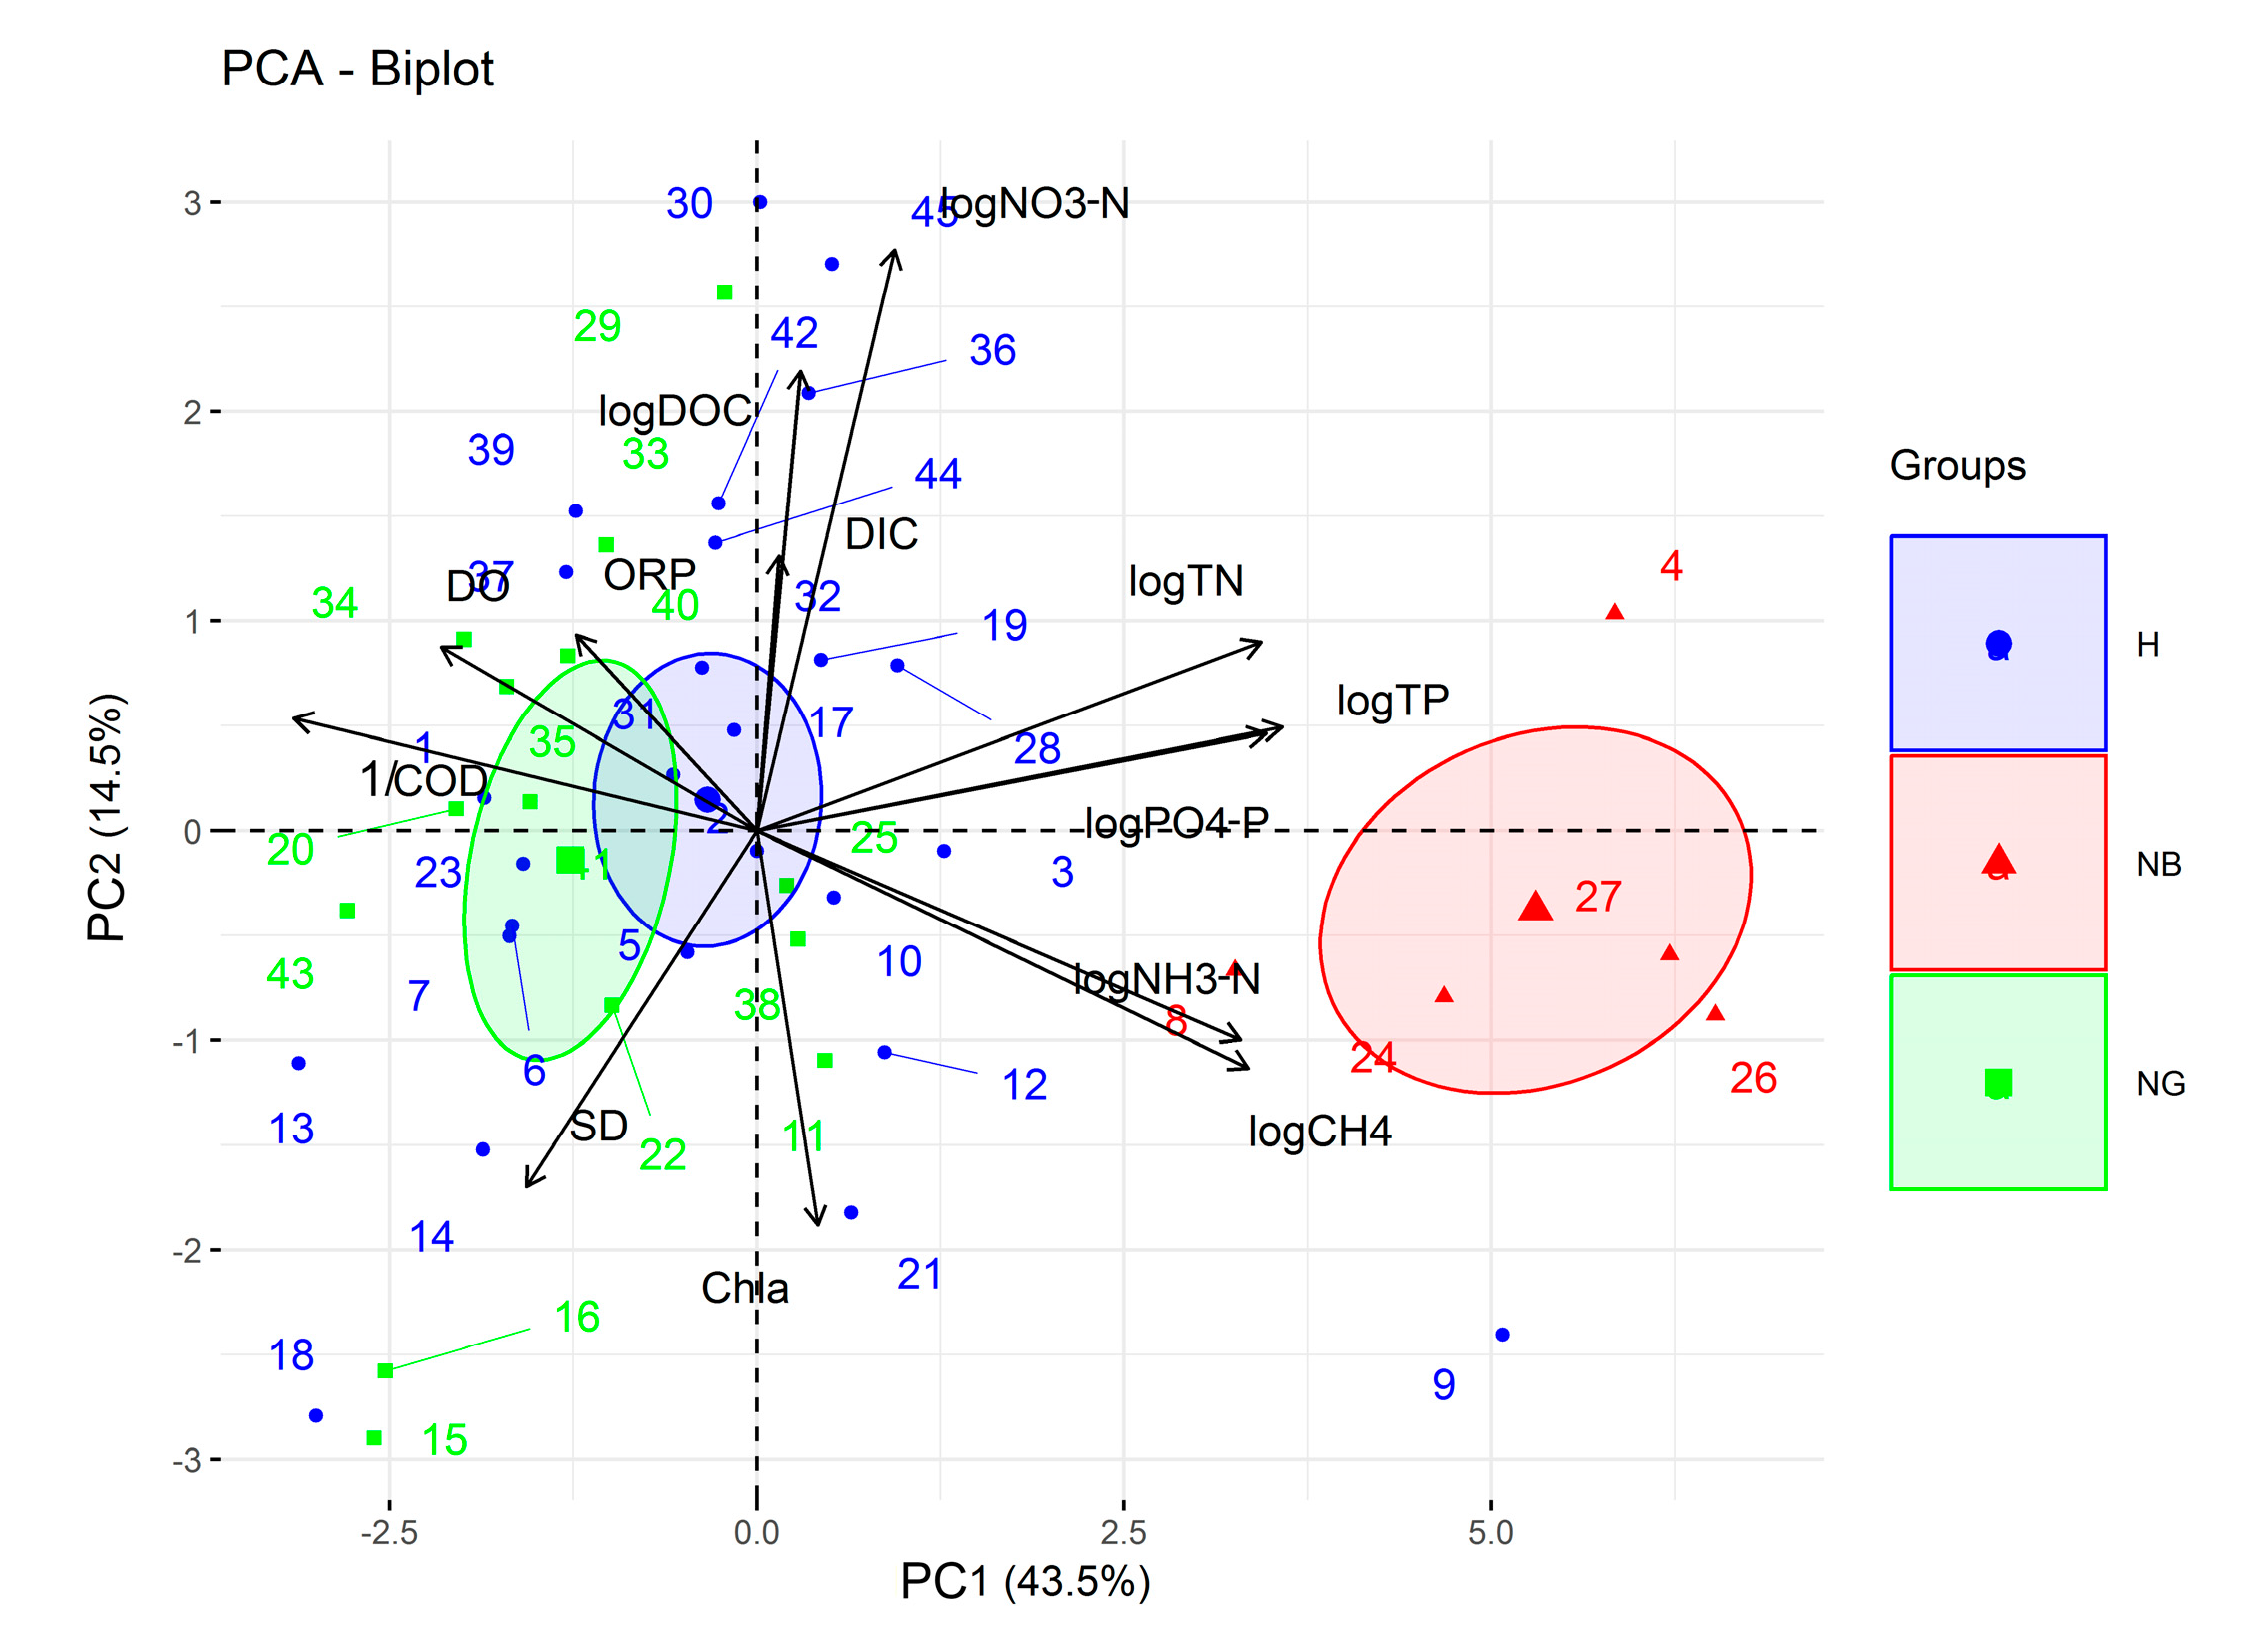
According to the reconstructed CH4 data, the mean values of CH4 concentrations and diffusive fluxes from groups H, NB, and NG were 0.72 μmol L−1 (23.33 mmol m−2 d−1), 8.91 μmol L−1 (277.92 mmol m−2 d−1), and 0.24 μmol L−1 (7.50 mmol m−2 d−1), respectively. ANOVA revealed a significant difference in CH4 concentration of the surface water among groups H, NB, and NG. Group H showed significantly different CH4 from group NB (p < 0.001) but no significant difference with group NG according to the post hoc test (Table 3). DO, TN, TP, COD, NH3–N, and PO4–P were significantly different between groups H and NB (p < 0.01 for DO and p < 0.001 for others), while CH4 and water quality variables had no significant difference between groups H and NG, except CODMn, which demonstrated significance at p < 0.05 (Table 3). The PCA results also showed the long distance between groups H and NB on the PC1 axis, while groups H and NG partially coincided on the PC1 axis (Figure 5).
According to the individual PCA shown in Figure 5, the dispersed site distribution in group H indicated the different effects of water governance. For example, sites 18 and 13 demonstrated high water quality after water governance; however, although various measures were applied, the water at site 9 continued to have extremely poor quality. Among the 20 sites in group H, only 8 sites (1, 6, 7, 13, 18, 23, 37, and 39) had TLI less than 60. Further analysis determined that although NH3–N decreased significantly after water governance (Table 3), NO3–N still exhibited a high level in a few sites, including sites 30, 45, 42, and 36 (Figure 5).
4. Discussion
Significantly high CH4 concentrations in the surface water and CH4 diffusive fluxes occurred in hyper-eutrophicated river sites (TLI > 70). This result is consistent with the findings of previous studies that found a positive correlation between CH4 emission and water quality [27,28]. Oxygen depletion and increased carbon loading are considered the primary drivers of high CH4 production and emissions in eutrophic lakes [29,30]. In this study, DOC showed no correlation with TN and TP, and was even negatively correlated with Chla, which was probably because DOC in rivers is primarily allochthonous rather than autochthonous. The DOC content exhibited no relationship with CH4, and the LOI was also inconsistent with the CH4 content in sediments (Table 2, Figure 3). These results indicate that CH4 production and emission in the investigated rivers were not limited by the carbon content.
Net CH4 flux is determined by the balance in its production, oxidation, and transport. In this study, surface water CH4 concentration was not correlated with sediment CH4 content but was significantly correlated with water DO and ORP. These results suggest the importance of CH4 oxidation in the water column in the regulation of CH4 flux. Carbon and nitrogen circulations are interactive processes in the river ecosystem, and nitrogen can be a key contributing factor to long-term carbon balance [31]. We found a significantly high correlation between CH4 in the water and NH3–N content (Figure 4). NH3–N was much higher than NO3–N in the hyper-eutrophicated sites in group C (Figure 2) and may serve as the main N source for photosynthesis of vegetation, which applied abundant substrate for CH4 production. Moreover, NH3–N is a factor that influences CH4 oxidation in aquatic sediments based on the competitive and noncompetitive inhibition mechanisms [32,33]. In summary, eutrophication due to the increase in N loading and decrease in DO in the investigated rivers likely benefits CH4 production and inhibits CH4 oxidation and evasion in air.
The CH4 concentration data were comparable with the global-scale estimate of fluvial CH4 concentration (1.35 ± 5.16 μmol L−1, medium 0.25 μmol L−1), but the CH4 diffusive flux was much lower than the global estimated level (342.50 ± 1062.50 μmol m−2 h−1, medium 35.83 μmol m−2 h−1) [6]. This finding may be caused by the low wind speed and weak turbulence of water in urban rivers based on the stagnant flow velocity, which had a direct influence on the diffusion of CH4 from the water to the air [6]. The CH4 data from urban river networks or typical rivers in cities were collected for comparison with the CH4 results in this study (Table 4). An average estimate of the CH4 concentration in these urban rivers was equal to 10.8 μmol L−1, with high variability and a medium of 2.0 μmol L−1. CH4 concentration is generally high in urban rivers, and extremely high CH4 levels are demonstrated in rivers that have been highly polluted by sewage. Moreover, rivers in rural areas with water influx from fertilized cropland or industrial areas can also be significant CH4 sources. A comparison of CH4 levels from different cities, such as Shanghai, Chongqing, Chennai, and Glasgow, showed that metropolises contributed significant CH4 emissions, and rivers in Wuxi City showed the same level of CH4 content as those in Tianjin and Hefei (Table 4). Similar to this study, the water quality had a significant influence on CH4 production and emission in other urban river systems, especially for DO and NH3–N (Table 4). Rivers are an important component of urban ecosystems and are highly threatened by humans because of reduced connectivity by dams, river channelization, and disposal of urban and industrial sewage water. Such human activities have induced to the degradation of river ecosystems [34,35] and additional CH4 emission. Given the rapid urbanization in global areas, previous studies have emphasized the notification of carbon evasion from urban rivers [7,8].
However, previous studies ignored the effect of water governance on water quality and CH4 emission. Water treatment practices, such as dredging and aeration, should contribute to the removal of nutrient elements and influence the biogeochemical process [41]. For example, a study in Lake Taihu found that oxygen penetration depth increased with a thickening oxidation layer in newborn sediments after dredging [42]. In this study, the increase of oxygen and the reducing organic matter content due to water governance could benefit CH4 oxidation but could result in less CH4 production, for example, the low sediment CH4 concentration and LOI at site 17 after dredging. However, more studies are needed for in-depth exploration of the influential mechanisms of various water quality management measures on CH4 dynamics.
According to our statistics, 58% of the sampling sites in the study area conducted water treatment, and this proportion increased to 84% if sites with naturally good water quality were excluded. Notably, under these control measures, the treated sites (group H) showed significantly better water quality than the sites in the NB group and had no significant difference with that in the NG group (Table 3, Figure 5), thereby indicating a positive tendency toward water ecological restoration. The CH4 diffusive flux of the sites in group H (23.33 μmol m−2 h−1) was 12 times lower than that of the sites in group NB (277.92 μmol m−2 h−1) and 3 times higher than that of those in group NG (7.50 μmol m−2 h−1). These findings suggest that CH4 evasion to the air decreases significantly after extensive and intensified water governance. Water management on a worldwide scale started at the end of the twentieth century, and old rivers, canals, and lakes were first restored in Western cities. The high environmental demand and standard in developing countries or recently developed countries contributes to a gradual increase of water quality control [43]. Hence, along with the improvement of the water environment, CH4 emission in urban rivers would also significantly decrease.
Our study has the following limitations: (1) The sampling in this study was conducted at the end of the wet and hot season when high CH4 production and emission occurred according to our seasonal study of CH4 dynamics in Lake Taihu [44]. Hence, our results only represent the water quality and CH4 emission characteristics in the wet and hot season. Multiple samplings at different times are necessary to obtain comprehensive and year-round conclusions on the effect of water governance. (2) Ebullition may be an important way of CH4 emission considering the oversaturation of CH4 concentration in sediments, but it was excluded in our study (Table 2). Moreover, CH4 ebullition is considered to be regulated by sediment structure, such as grain size [45]. Hence, water treatment activities, especially for dredging, should have a strong effect on CH4 bubble formation and emission. In this respect, the reduced effect of CH4 emission due to water governance may have been underestimated in our study.
Author Contributions
Conceptualization, L.L. and R.Y.; methodology, L.L.; software, L.L.; validation, L.L., R.Y. and B.X.; formal analysis, L.L.; investigation, L.L. and R.Y.; resources, R.Y.; data curation, L.L.; writing—original draft preparation, L.L.; writing—review and editing, L.L.; visualization, R.Y.; supervision, B.X.; project administration, B.X.; funding acquisition, R.Y. and B.X. All authors have read and agreed to the published version of the manuscript.
Funding
Our work was funded by the National Key Research and Development Program of China (Grant no. 2019YFA0607100), National Natural Science Foundation of China (Grant nos. 41842049, 41573129, and 41701031), Major Science and Technology Program for Water Pollution Control and Treatment (2017ZX07203002-02) and Postdoctoral Research Funding Program of Jiangsu Province (Grant no. 211110B62003).
Conflicts of Interest
The authors declare no conflict of interest.
References
- Myhre, G.; Shindell, D.; Pongratz, J. Climate Change 2013: The Physical Science Basis; Working Group I Contribution to the Fifth Assessment Report of the Intergovernmental Panel on Climate Change; Stocker, T., Ed.; Cambridge University Press: Cambridge, UK, 2013; pp. 659–740. [Google Scholar]
- Etminan, M.; Myhre, G.; Highwood, E.J.; Shine, K.P. Radiative forcing of carbon dioxide, methane, and nitrous oxide: A significant revision of the methane radiative forcing. Geophys. Res. Lett. 2016, 43, 12614–12623. [Google Scholar] [CrossRef]
- Bastviken, D.; Tranvik, L.J.; Downing, J.A.; Crill, P.M.; Enrich-Prast, A. Freshwater Methane Emissions Offset the Continental Carbon Sink. Science 2011, 331, 50. [Google Scholar] [CrossRef] [PubMed] [Green Version]
- Laanbroek, H.J. Methane emission from natural wetlands: Interplay between emergent macrophytes and soil microbial processes. A mini-review. Ann. Bot. 2010, 105, 141–153. [Google Scholar] [CrossRef] [PubMed]
- Tranvik, L.J.; Downing, J.A.; Cotner, J.B.; Loiselle, S.A.; Striegl, R.G.; Ballatore, T.J.; Dillon, P.; Finlay, K.; Fortino, K.; Knoll, L.B. Lakes and reservoirs as regulators of carbon cycling and climate. Limnol. Oceanogr. 2009, 54, 2298–2314. [Google Scholar] [CrossRef] [Green Version]
- Stanley, E.H.; Casson, N.J.; Christel, S.T.; Crawford, J.T.; Loken, L.C.; Oliver, S.K. The ecology of methane in streams and rivers: Patterns, controls, and global significance. Ecol. Monogr. 2016, 86, 146–171. [Google Scholar] [CrossRef]
- Yu, Z.; Wang, D.; Li, Y.; Deng, H.; Hu, B.; Ye, M.; Zhou, X.; Da, L.; Chen, Z.; Xu, S. Carbon dioxide and methane dynamics in a human-dominated lowland coastal river network (Shanghai, China). J. Geophys. Res. Biogeosci. 2017, 122, 1738–1758. [Google Scholar] [CrossRef] [Green Version]
- Wang, X.; He, Y.; Chen, H.; Yuan, X.; Peng, C.; Yue, J.; Zhang, Q.; Zhou, L. CH4 concentrations and fluxes in a subtropical metropolitan river network: Watershed urbanization impacts and environmental controls. Sci. Total Environ. 2018, 622, 1079–1089. [Google Scholar] [CrossRef]
- Liu, D.W.; Keith, R. The He-Zhang (River Chief/Keeper) System: An Innovation in China’s Water Governance and Management. Int. J. River Basin Manag. 2018, 17, 263–270. [Google Scholar] [CrossRef]
- Feng, L.; Sun, X.; Zhu, X.D. Impact of floodgates operation on water environment using one-dimensional modelling system in river network of Wuxi city, China. Ecol. Eng. 2016, 91, 173–182. [Google Scholar] [CrossRef]
- Yang, M.; Yu, J.; Li, Z.; Guo, Z.; Burch, M.; Lin, T.F. Taihu Lake not to blame for Wuxi’s woes. Science 2008, 319, 158. [Google Scholar] [CrossRef]
- Casper, P.; Furtado, A.L.D.S.; Adams, D.D. Biochemistry and diffuse fluxes of greenhouse gases and dinitrogen from the sediments of oligotrophic Lake Stechlin, northern Germany. Arch. Hydrobiol. 2003, 58, 53–71. [Google Scholar]
- Bastviken, D.; Santoro, A.L.; Marotta, H.; Pinho, L.Q.; Calheiros, D.F.; Crill, P.; Enrichprast, A. Methane Emissions from Pantanal, South America, during the Low Water Season: Toward More Comprehensive Sampling. Environ. Sci. Technol. 2010, 44, 5450–5455. [Google Scholar] [CrossRef] [PubMed]
- Li, L.L.; Yao, S.C.; Xue, B.; Cheng, L.J.; Yan, R.H. Methane levels in five shallow lakes in China: Effect of lake paludification. Quat. Int. 2019, 503, 128–135. [Google Scholar] [CrossRef]
- Ebina, J.; Tsutsui, T.; Shirai, T. Simultaneous determination of total nitrogen and total phosphorus in water using peroxodisulfate oxidation. Water Res. 1983, 17, 1721–1726. [Google Scholar] [CrossRef]
- Ritchie, R.J. Consistent sets of spectrophotometric chlorophyll equations for acetone, methanol and ethanol solvents. Photosynth. Res. 2006, 89, 27–41. [Google Scholar] [CrossRef]
- Hu, Y.; Wen, Y.; Wang, X. Novel method of turbidity compensation for chemical oxygen demand measurements by using UV–VIS spectrometry. Sens. Actuators B Chem. 2016, 227, 393–398. [Google Scholar] [CrossRef]
- Heiri, O.; Lotter, A.F.; Lemcke, G. Loss on ignition as a method for estimating organic and carbonate content in sediments: Reproducibility and comparability of results. J. Paleolimnol. 2001, 25, 101–110. [Google Scholar] [CrossRef]
- Alin, S.R.; Rasera, M.F.F.L.; Salimon, C.I.; Richey, J.E.; Holtgrieve, G.W.; Krusche, A.V.; Snidvongs, A. Physical controls on carbon dioxide transfer velocity and flux in low-gradient river systems and implications for regional carbon budgets. J. Geophys. Res. Biogeosci. 2011, 116, 116. [Google Scholar] [CrossRef]
- Wanninkhof, R. Relationship between wind speed and gas exchange over the ocean. J. Geophys. Res. Ocean. 1992, 97, 7373–7382. [Google Scholar] [CrossRef]
- Wanninkhof, R. Relationship between wind speed and gas exchange over the ocean revisited. Limnol. Oceanogr. Methods 2014, 12, 351–362. [Google Scholar] [CrossRef]
- Jin, X.C.; Xu, Q.J.; Huang, C.Z. Current status and future tendency of lake eutrophication in China. Sci. China Ser. C Life Sci. 2005, 48, 948–954. [Google Scholar]
- Jin, X.C.; Liu, S.K.; Zhang, Z.S.; Tu, Q.Y.; Xu, N.N. Lake Environment in China; Ocean Press: Beijing, China, 1995. (In Chinese) [Google Scholar]
- Le, S.; Julie, J.; Francois, H. FactoMineR: An R Package for Multivariate Analysis. J. Stat. Softw. 2008, 25, 1–18. [Google Scholar] [CrossRef] [Green Version]
- Kassambara, A.; Mundt, F. Factoextra: Extract and visualize the results of multivariate data analyses. Available online: https://rpkgs.datanovia.com/factoextra/ (accessed on 1 August 2020).
- R Core Team. R: A Language and Environment for Statistical Computing; R Foundation for Statistical Computing: Vienna, Austria, 2019. [Google Scholar]
- Furlanetto, L.M.; Marinho, C.C.; Palma-Silva, C.; Albertoni, E.F.; Figueiredo-Barros, M.P.; Esteves, F.A. Methane levels in shallow subtropical lake sediments: Dependence on the trophic status of the lake and allochthonous input. Limnologica 2012, 42, 151–155. [Google Scholar] [CrossRef]
- Martinez-Cruz, K.; Gonzalez-Valencia, R.; Sepulveda-Jauregui, A.; Plascencia-Hernandez, F.; Belmonte-Izquierdo, Y.; Thalasso, F. Methane emission from aquatic ecosystems of Mexico City. Aquat. Sci. 2017, 79, 159–169. [Google Scholar] [CrossRef]
- Casper, P. Methane production in lakes of different trophic state. Arch. Hydrobiol. Beih. Ergebn. Limnol. 1992, 37, 149–154. [Google Scholar]
- Tremblay, A.; Varfalvy, L.; Roehm, C. Greenhouse Gas Emissions—Fluxes and Processes. Apress 2005, 7, 111–127. [Google Scholar]
- Kortelainen, P.; Rantakari, M.; Pajunen, H.; Huttunen, J.T.; Mattsson, T.; Juutinen, S.; Larmola, T.; Alm, J.; Silvola, J.; Martikainen, P.J. Carbon evasion/accumulation ratio in boreal lakes is linked to nitrogen. Glob. Biogeochem. Cycles 2013, 27, 363–374. [Google Scholar] [CrossRef]
- Bosse, U.; Frenzel, P.; Conrad, R. Inhibition of methane oxidation by ammonium in the surface layer of a littoral sediment. FEMS Microbiol. Ecol. 1993, 13, 123–134. [Google Scholar] [CrossRef]
- Roy, R.; Knowles, R. Differential inhibition by allylsulfide of nitrification and methane oxidation in freshwater sediment. Appl. Environ. Microbiol. 1995, 61, 4278–4283. [Google Scholar] [CrossRef] [Green Version]
- Vörösmarty, C.J.; Mcintyre, P.; Gessner, M.; Dudgeon, D.; Prusevich, A.; Green, P.; Glidden, S.; Bunn, S.E.; Sullivan, C.A.; Liermann, C.R.; et al. Global threats to human water security and river biodiversity. Nature 2010, 467, 555–561. [Google Scholar] [CrossRef] [PubMed]
- Carpenter, S.R.; Stanley, E.H.; Vander Zanden, M.J. State of the World’s Freshwater Ecosystems: Physical, Chemical, and Biological Changes. Annu. Rev. Environ. Resour. 2011, 36, 75–99. [Google Scholar] [CrossRef] [Green Version]
- Hu, B.B.; Tan, Y.J.; Wang, D.Q.; Deng, H.G.; Li, Y.J.; Yu, Z.J.; Chen, Z.L. Methane and nitrous oxide dissolved concentration and emission flux of plain river network in winter. Sci. Sin. Chim. 2013, 43, 919–929. (In Chinese) [Google Scholar]
- Yang, L.B.; Li, X.Y.; Yan, W.J.; Ma, P.; Wang, J.N. CH4 Concentrations and Emissions from Three Rivers in the Chaohu Lake Watershed in Southeast China. J. Integr. Agric. 2012, 11, 665–673. [Google Scholar] [CrossRef]
- Hou, C.C.; Zhang, F.; Li, Y.C.; Wang, Q.B.; Liu, S. Characteristics of Dissolved CH4 and N2O Concentrations of Weihe River in Xinxiang Section in Spring. Environ. Sci. 2016, 37, 1892–1899. (In Chinese) [Google Scholar]
- Rajkumar, A.N.; Barnes, J.; Ramesh, R.; Purvaja, R.; Upstill-Goddard, R.C. Methane and nitrous oxide fluxes in the polluted Adyar River and estuary, SE India. Mar. Pollut. Bull. 2008, 56, 2043–2051. [Google Scholar] [CrossRef] [PubMed]
- Gu, C.; Bass, A.; Waldron, S. Carbon dioxide and methane temporal dynamics in an urban river. Geophys. Res. Abstr. 2019, 21, 1. [Google Scholar]
- Zhong, J.C.; Liu, G.F.; Fan, C.X.; Li, B.; Zhang, L.; Ding, S.M. Environmental effect of sediment dredging in lake:II;. The role of sediment dredging in reducing internal nitrogen release. J. Lake Sci. 2009, 21, 335–344. (In Chinese) [Google Scholar]
- Gu, X.Z.; Jiang, W.H. Dissolved oxygen dynamic across the new-born interface of bottom water and sediment after dredging contaminated sediment. J. Lake Sci. 2018, 30, 1518–1524. (In Chinese) [Google Scholar]
- Meissner, R. Water Governance and Management and Climate Change; Springer International Publishing: Cham, Switzerland, 2017. [Google Scholar]
- Li, L.L.; Xue, B.; Yao, S.C.; Tao, Y.Q.; Yan, R.H. Spatial–temporal patterns of methane dynamics in Lake Taihu. Hydrobiologia 2018, 822, 143–156. [Google Scholar] [CrossRef]
- Liu, L.; Wilkinson, J.; Koca, K.; Buchmann, C.; Lorke, A. The role of sediment structure in gas bubble storage and release. J. Geophys. Res. Biogeosci. 2016, 121, 1992–2005. [Google Scholar] [CrossRef]
Figure 1.
Location and sampling sites in the study area. The trophic level index (TLI) for each site is indicated by red circles with varying sizes. Section 2.4 presents the calculation process of the TLI. The upper two pictures on the left side show artificially planted macrophytes, and the bottom picture depicts natural vegetation.

Figure 2.
Surface water quality parameters in 45 sampling sites.

Figure 3.
Principal component analysis (PCA) of water quality variables. Colored arrows denote contributions of parameters to principal components.
Figure 3.
Principal component analysis (PCA) of water quality variables. Colored arrows denote contributions of parameters to principal components.

Figure 4.
Relationship between CH4 concentration of the surface water and NH3–N. Both variables were log-transformed.
Figure 4.
Relationship between CH4 concentration of the surface water and NH3–N. Both variables were log-transformed.

Figure 5.
PCA of water quality variables and CH4. Colored arrows denote contributions of parameters to principal components. Labels for the scatter represent sampling sites, which were divided into three groups. Group H includes sites with water governance. Group NB includes sites that had naturally poor water quality. Group NG represents sites with naturally good water quality.


Table 1.
Basic information and groupings of sampling sites and rivers.
| Sites | River | Width (m) * | Depth (m) & | Group 1 $ | Group 2 # | Sites | River | Width (m) * | Depth (m) & | Group 1 $ | Group 2 # |
|---|---|---|---|---|---|---|---|---|---|---|---|
| 1 | Liangxihe | 3–5 | 3.2 | A | H | 24 | Maligang | - | 3.1 | C | NB |
| 2 | Maligang | 3–3.5 | 3.3 | B | H | 25 | Lucunhe | 1.2 | 1.7 | B | NG |
| 3 | Dongxinhe | 0.8 | 1.2 | B | H | 26 | Lucunhe | - | 0.2 | C | NB |
| 4 | Dongxinhe | - | 0.3 | C | NB | 27 | Lucunhe | - | 0.8 | C | NB |
| 5 | Liangxihe | - | 2.0 | B | H | 28 | Caowangjing | 2–3 | 3.0 | B | H |
| 6 | Xianjingbang | 0.7 | 1.8 | A | H | 29 | Caowangjing | - | 3.5 | B | NG |
| 7 | Liangxihe | - | 3.5 | A | H | 30 | Caowangjing | - | 2.0 | B | H |
| 8 | Xianjingbang | - | 2.3 | C | NB | 31 | Caowangjing | - | 2.5 | B | H |
| 9 | Xianjingbang | - | 1.8 | C | H | 32 | Lihe | 1 | 2.7 | B | H |
| 10 | Xixinhe | 0.5 | 0.9 | B | H | 33 | Miaoqiaogang | 1 | 0.8 | A | NG |
| 11 | Xixinhe | - | 0.6 | B | NG | 34 | Miaoqiaogang | - | 2.6 | A | NG |
| 12 | Unknown | 1.2 | 0.7 | B | H | 35 | Renzigang | 0.8 | 2.7 | A | NG |
| 13 | Unknown | - | 1.8 | A | H | 36 | Lihe | - | 2.8 | B | H |
| 14 | Liangxihe | - | 3.5 | B | H | 37 | Lihe | - | 3.0 | A | H |
| 15 | Dingchangqiaobang | 2 | 1.8 | A | NG | 38 | Renzigang | - | 1.9 | A | NG |
| 16 | Ludianqiaobang | 2 | 1.7 | A | NG | 39 | Daxuanhe | - | 1.8 | A | H |
| 17 | Dingchangqiaobang | - | 0.8 | B | H | 40 | Meiliang Bay Pump Gate | - | 3.2 | A | NG |
| 18 | Ludianqiaobang | - | 3.1 | A | H | 41 | Daxuanhe | - | 3.1 | A | NG |
| 19 | Ludianqiaobang | - | 1.1 | B | H | 42 | Lake Lihu | - | 1.4 | B | H |
| 20 | Lixihe | 1.1 | 1.5 | A | NG | 43 | Shanxihe | 0.6 | 1.9 | A | NG |
| 21 | Chendahe | 1 | 1.7 | B | H | 44 | Shanxihe | - | 2.4 | B | H |
| 22 | Maligang | - | 2.7 | A | NG | 45 | Miaojingbang | - | 0.5 | B | H |
| 23 | Duantoubang | - | 0.6 | A | H |
Note: *, river width; &, maximum water depth of the sampling site during sampling. $, group A includes sites with TLI (∑) < 60, group B represents 60 < TLI (∑) < 70, and group C is TLI (∑) > 70. # indicates whether water governance was conducted, and sampling sites were separated into “human” (H) and “natural” groups. On the basis of TLI (∑) and vegetation status, the “natural” group was further divided into “natural good” (NG) and “natural bad” (NB) groups.
Table 2.
Mean value ± standard deviations of CH4 concentrations in the surface water (CH4-wat) and sediment (CH4-sed); CH4 diffusive fluxes from water to the atmosphere (CH4-flux), as well as the in situ water temperature (WT), dissolved organic carbon (DOC) concentrations, and the sediment water content; and loss on ignition (LOI) of 21 sampling sites.
| Sites | CH4-Wat. (μmol L−1) | CH4-Flux (μmol m−2 h−1) | CH4-Sed (μmol L−1) | WT (°C) | DOC (mg L−1) | Water Content (%) | LOI (%) |
|---|---|---|---|---|---|---|---|
| 1 | 0.18 ± 0.017 | 3.85 | 759.95 ± 335.65 | 24.7 | 11.12 | 63.54 | 6.35 |
| 2 | 0.17 ± 0.046 | 5.45 | 469.42 ± 120.21 | 25.3 | 19.18 | 54.53 | 5.27 |
| 5 | 0.16 ± 0.038 | 12.68 | nd | 24.9 | 5.68 | nd | nd |
| 8 | 12.52 ± 4.52 | 363.74 | 448.86 ± 7.84 | 24.2 | 12.54 | 78.08 | 13.45 |
| 14 | 0.06 ± 0.016 | 3.03 | nd | 24.8 | 9.20 | nd | nd |
| 17 | 0.47 ± 0.13 | 5.79 | 18.01 ± 31.61 | 22.6 | 6.04 | 33.28 | 4.82 |
| 18 | 1.24 ± 0.095 | 5.10 | 1028.89 ± 15.22 | 24.7 | 1.54 | 57.22 | 6.57 |
| 19 | 0.22 ± 0.073 | 6.50 | 345.59 ± 462.33 | 22.4 | 25.06 | 79.06 | 12.38 |
| 21 | 8.91 ± 1.37 | 27.44 | 173.37 ± 53.52 | 24.1 | 9.49 | 57.35 | 8.18 |
| 24 | 3.89 ± 0.33 | 104.62 | 472.11 ± 8.75 | 24.9 | 7.38 | 61.18 | 8.16 |
| 26 | 5.65 ± 0.23 | 663.51 | 458.80 ± 46.43 | 23.6 | 7.84 | 24.66 | 3.27 |
| 27 | 16.37 ± 0.36 | 409.26 | 226.12 ± 125.63 | 23.0 | 15.94 | 36.54 | 4.14 |
| 29 | 0.07 ± 0.0034 | 4.61 | 423.49 ± 144.07 | 24.3 | 18.26 | 53.47 | 6.78 |
| 31 | 0.05 ± 0.010 | 3.59 | 348.70 ± 18.05 | 24.2 | 9.50 | 42.06 | 4.34 |
| 15 | 0.18 ± 0.12 | 6.79 | 345.94 ± 16.95 | 23.6 | 13.00 | nd | nd |
| 22 | 0.50 ± 0.19 | 10.67 | 200.59 ± 26.95 | 24.2 | 9.53 | 63.35 | 13.61 |
| 25 | 0.23 ± 0.0088 | 12.84 | nd | 23.8 | 30.09 | 77.58 | 11.33 |
| 32 | 0.16 ± 0.067 | 7.30 | 352.99 ± 62.51 | 23.6 | 9.23 | 32.51 | 3.97 |
| 34 | 0.33 ± 0.064 | 4.81 | nd | 24.1 | 8.26 | nd | nd |
| 35 | 0.33 ± 0.062 | 4.92 | 741.58 ± 369.79 | 23.3 | 12.35 | 50.06 | 4.40 |
| 43 | 0.20 ± 0.022 | 4.04 | 508.01 ± 117.64 | 24.0 | 19.02 | 55.31 | 6.13 |
Notes: Sites with shadow represent sites with water governance and nd denotes no data.
Table 3.
p-Values of one-way ANOVA and post hoc test to determine the significant difference between CH4 and water quality among groups H, NB, and NG. Only significant p-values were presented in post hoc tests.
Table 3.
p-Values of one-way ANOVA and post hoc test to determine the significant difference between CH4 and water quality among groups H, NB, and NG. Only significant p-values were presented in post hoc tests.
| ANOVA | Post Hoc “Bonferroni” | Post Hoc “Bonferroni” | |
|---|---|---|---|
| p-Values | p-Values between Groups H and NB | p-Values between Groups H and NG | |
| CH4 | 0.000 | 0.000 | |
| DO | 0.008 | 0.006 | |
| ORP | 0.43 | ||
| SD | 0.045 | ||
| Chla | 0.44 | ||
| TN | 0.000 | 0.000 | |
| TP | 0.000 | 0.000 | |
| CODMn | 0.000 | 0.000 | 0.045 |
| NH3–N | 0.000 | 0.000 | |
| NO3–N | 0.67 | ||
| PO4–P | 0.000 | 0.000 | |
| DOC | 0.79 | ||
| DIC | 0.39 |
Table 4.
CH4 concentrations of surface water in urban rivers.
| City/Country | Subarea | Sampling Time | CH4 Concentration (μmol L−1) | Influencing Factors | References |
|---|---|---|---|---|---|
| Shanghai | Urban | Annual | 13.31 ± 22.06 | DO, N, P | [7] |
| Suburban | 2.56 ± 1.59 | ||||
| Rural | 2.04 ± 1.29 | ||||
| Chongqing | Urban | Annual | 1.9 ± 2.63 | DOC, DIC, N, P | [8] |
| Suburban | 0.66 ± 0.71 | ||||
| Urban | September | 1.64 ± 2.2 | |||
| Suburban | 0.59 ± 0.47 | ||||
| Tianjin | Urban | March | 0.3 (0.04–1.35) | DO, NH3–N | [36] |
| Sewage River | 38.4 | ||||
| Hefei | Urban | July and August | 0.09 ± 0.01 | DO | [37] |
| Rural Cropland | 0.26 ± 0.030.38 ± 0.08 | ||||
| Wuxi | Urban | September | 2.47 ± 4.5 (0.05–16.37) Medium 0.23 | DO, NH3–N | This study |
| Xinxiang | Urban | Annual | 0.6–17.64 | NH3–N, DOC, DIC, DO, pH | [38] |
| Suburban | 0.19–16.01 | ||||
| Industrial zone | 6.98–13.11 | ||||
| Mean | 1.2–3.3 | ||||
| Chennai, India | Urban | September | 114 (4.7–202) | DO, NH3–N | [39] |
| Rural Cropland | 7.52 (0.81–14.6) | ||||
| Glasgow, UK | Urban | Annual | 4.01 ± 1.91 | - | [40] |
| Mean | 10.8 | ||||
| Medium | 2.0 | ||||
© 2020 by the authors. Licensee MDPI, Basel, Switzerland. This article is an open access article distributed under the terms and conditions of the Creative Commons Attribution (CC BY) license (http://creativecommons.org/licenses/by/4.0/).
Share and Cite
MDPI and ACS Style
Li, L.; Yan, R.; Xue, B. Methane Levels of a River Network in Wuxi City, China and Response to Water Governance. Water 2020, 12, 2617. https://doi.org/10.3390/w12092617
AMA Style
Li L, Yan R, Xue B. Methane Levels of a River Network in Wuxi City, China and Response to Water Governance. Water. 2020; 12(9):2617. https://doi.org/10.3390/w12092617
Chicago/Turabian StyleLi, Lingling, Renhua Yan, and Bin Xue. 2020. "Methane Levels of a River Network in Wuxi City, China and Response to Water Governance" Water 12, no. 9: 2617. https://doi.org/10.3390/w12092617
Note that from the first issue of 2016, this journal uses article numbers instead of page numbers. See further details here.