1. Introduction
The South-to-North Water Diversion Project (SNWDP) is a major strategic infrastructure aimed at optimizing allocation of water resources across the river basin and benefiting the greatest number of people in China, and is the inter-basin water diversion project with major international influence [
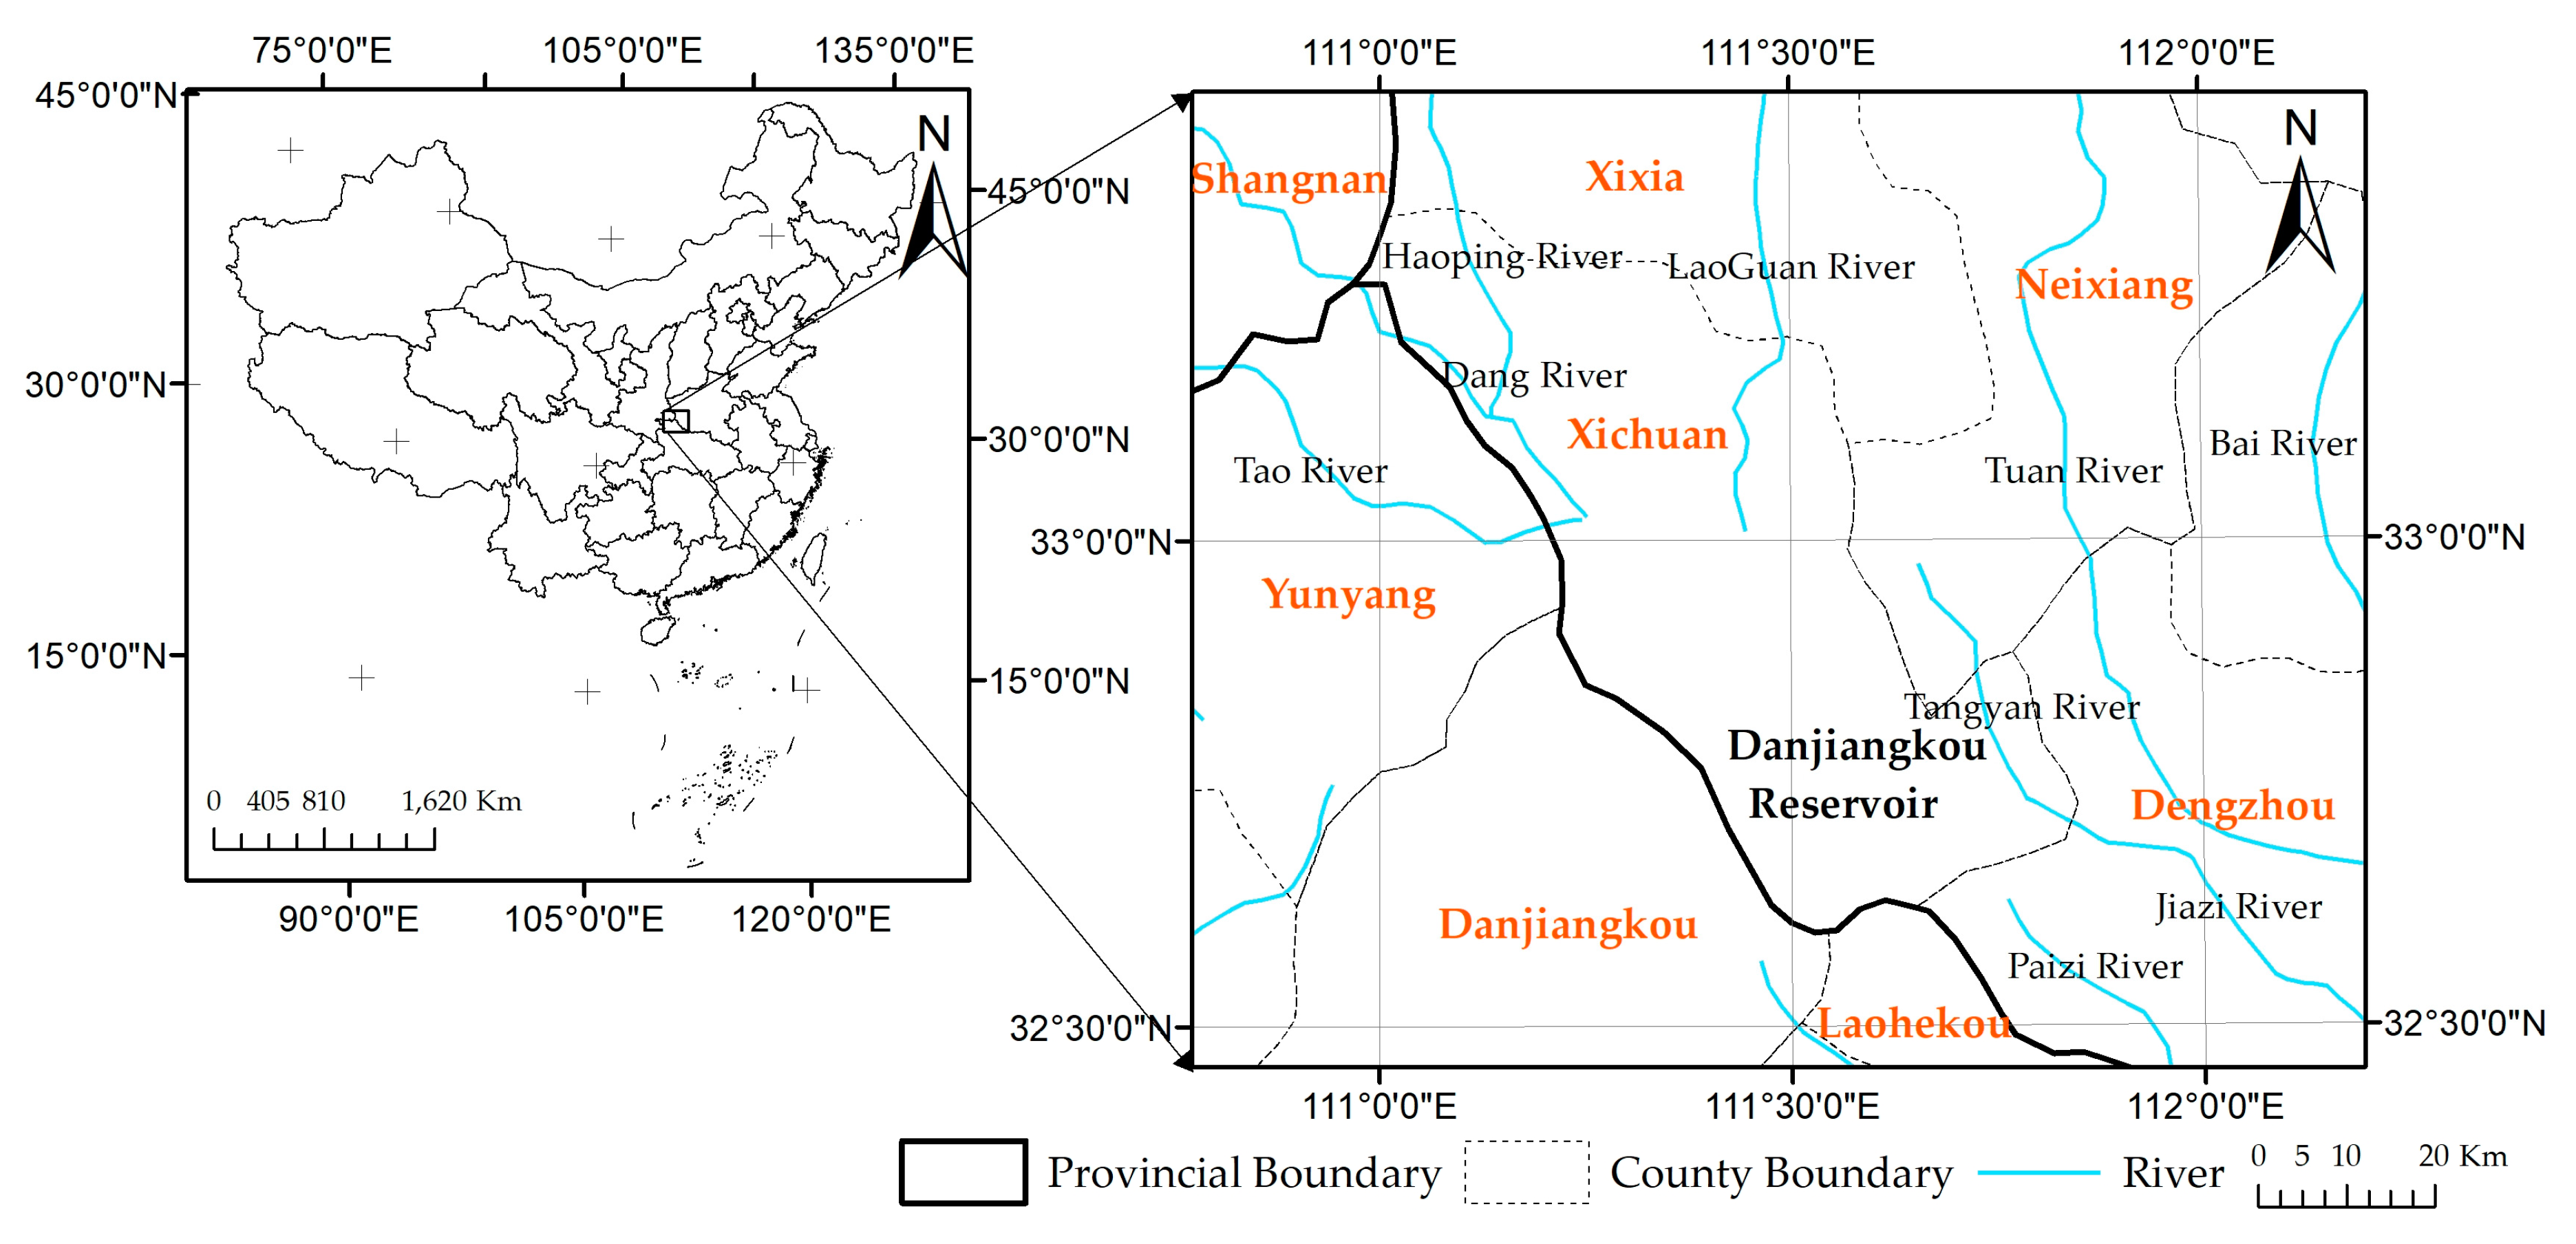
1]. The Danjiangkou Reservoir, as the water source for the SNWDP, is one of the most important protection areas in the country. Therefore, the protection of water quality in the Danjiangkou Reservoir is of extreme importance [
2]. In recent years, the reservoir area has adjusted the surrounding agricultural planting structure, reduced industrial waste, and enhanced soil and water conservation, and thus the good water quality of the reservoir has been well maintained at above Class II all year round [
3]. However, with the continuous economic development around the reservoir area, many towns have developed aquaculture, Chinese medicinal material processing industries, and forest product processing industries in the mountainous area. Since less construction land restricts the economic development, the land in some areas is over-exploited, leading to destruction of the ecological environment and serious soil erosion, which poses a certain threat to the water quality of the Danjiangkou Reservoir. The water quality of the Danjiangkou Reservoir is not only a problem of water pollution and ecological environment in the reservoir area, but also directly relates to the economic development of large- and medium-sized cities along the middle route of the SNWDP, as well as the safety of residential water use.
The traditional water quality monitoring method mainly used in situ measurements and collection of water samples is used for subsequent laboratory analyses to evaluate water quality [
4]. While such measurements are accurate for a point in time and space, they cannot give either the spatial or temporal view of water quality required for the accurate assessment. Consequently, it has certain limitations and cannot achieve real-time monitoring for water quality [
5,
6]. In recent years, with the continuous development of remote sensing technology, the remote sensing technology in monitoring water quality has served as a non-traditional monitoring technology, which has a wide range of monitoring and can quickly monitor the lake water quality distribution at temporal and spatial scales in real-time, as well as reflect the main sources of pollutants. Meanwhile, remote sensing for water quality monitoring could also predict the flow trend of pollutants, and meet the requirements of spatial and temporal monitoring of water quality in a large-scale water body [
7]. The conventional inversion methods of remote sensing water quality parameters mainly include empirical, semi-empirical, and semi-analytical methods [
8,
9,
10]. Among these methods, the utilization of hyperspectral remote-sensing technology in monitoring water quality has accelerated the advancement of the semi-empirical method. The principle of the semi-empirical method is to perform inversion of water quality parameters via the statistical analyses between the known water quality parameters and the optimal characteristic bands or band combinations, which is currently the most commonly used method for inversion of water quality [
11,
12]. For instance, Jamil Amanollahi et al. have performed inversion of the water quality variables including pH, total suspended solids (TSS), total dissolved solids (TDS), turbidity, nitrate, sulfate, phosphate, chloride, and the concentration of chlorophyll-α (Chl-α) in Zarivar International Wetland of Iran using Landsat spectral data and artificial neural network (ANN) models [
13]. Yirgalem et al. have developed the neural network model using Landsat spectral data as a proxy to quantify water quality parameters, namely chlorophyII-α, turbidity, and phosphorous in the greater Florida Everglades during the wet and dry seasons [
14]. Tian et al. have built the bio-optical model to retrieve the concentrations of tripton, Chl-α, and colored dissolve organic matter (CDOM) of summer Guanting water, and thus obtained the water quality parameters in large-scale water bodies and conducted spatial analysis of water quality [
15]. Bresciani et al. have used Landsat 8 OLI(Operational Land Imager) and Sentinel-2A to retrieve the total suspended solids (TSS) and chlorophyll-α concentration and their spatial distribution on lake water quality parameters for the five largest Italian subalpine lakes [
16]. Mohamed Elhag et al. have extracted chlorophyll-α concentration, nitrate concentration, and water turbidity in the dam lake of Wadi Baysh, Saudi Arabia using remote sensing data collected from Sentinel-2.
Since some of water quality parameters are not optically active or lack hyperspectral data at fine spatial resolutions, not all parameters can be directly measured by current satellites, including total nitrogen and phosphorus and dissolved oxygen levels. The two key nutrients that drive both green algae and blue–green algae blooms are nitrogen (N) and phosphorus (P). These two nutrients do not impact the visible spectrum of the water body directly but do affect the color due to their promotion of algae growth. While the association between these nutrients and algae growth (i.e., as represented by Chl-a measurements) may be strong, less is known about the correlations at temporally and spatially smaller samplings [
17]. Furthermore, the correlation between N or P and algae growth is based on the fact that one of these nutrients is often considered as the growth limiting factor for an algae bloom. Thus, for one water body the correlation with Chl-a might be with N while for another water body the correlation might be with P, depending on which is the growth limiting factor in that particular water body. Dissolved oxygen (DO) is another important water quality parameter that cannot be directly measured using spectral methods. The main sources of DO in water are atmospheric oxygen transferred into the water column, and oxygen generated in situ due to photosynthesis from algae and other organisms. For remote sensing, indirect methods can be used for detecting dissolved oxygen. Specifically, dissolved oxygen could be impacted by Chl-a and algae in complex ways, such as generation during photosynthesis, consumption during respiration, and by the environmental temperature through solubility, which thus provide indirect diurnal spectral linkages between these parameters.
The total amount of nitrogen (N) on the earth ranks fourth among many elements, which plays a vital role in biological life activities [
18]. There are three forms of nitrogen in the ecosystem, namely organic nitrogen, inorganic nitrogen, and molecular nitrogen [
19]. The biogeochemical cycle of nitrogen is formed by the mutual transformation of these three forms in the atmosphere, water, and soil. Inorganic nitrogen accounts for a small proportion of soil nitrogen, but it is the main form of nitrogen absorbed by plants, especially nitrate nitrogen and ammonium nitrogen. Currently, irrational fertilizer and the indiscriminate discharge of industrial and municipal wastewater have given rise to the continuous increase of inorganic nitrogen (ammonium nitrogen, nitrate nitrogen, and nitrite nitrogen) in water and soil, which can harm the health of the ecosystem [
20]. In order to effectively control the spread of nitrogen pollution and the deterioration of the corresponding pollution, it is crucial to determine the regional pollution sources. Therefore, understanding the transformation mechanism of nitrogen in each environment is of great significance for identification of pollution sources and analysis of pollution process. Under natural conditions, inorganic nitrogen compounds can be transformed into each other in the metabolism of plankton and bacteria. In addition, at a certain temperature, when the NH
3-N concentration changes within a certain range, the average rate of nitrification will also increase with increasing NH
3-N concentration. Nitrogen is also an important factor that causes eutrophication of water bodies and affects algal boom, and thus has a significant impact on water quality [
21]. Monitoring the N concentration in the water body is critical to prevent nitrogen pollution and strengthen the ecological environment management of lake water [
22]. Total nitrogen (TN) and ammonia nitrogen (NH
3-N) reflect two important indicators of the nitrogen concentration for water quality. Large-scale reservoirs have a complex composition of water body and exhibit great differences in spatial scales. Even in the same lake or reservoir, the concentrations of TN and NH
3-N are different in different periods [
23]. With the assistance of remote sensing technology to quantitatively retrieve TN and NH
3-N, concentrations in reservoirs can clarify the temporal and spatial distribution characteristic, migration, and conversion of TN and NH
3-N in the reservoir area and realize tracing back to the pollution source. For example, Dewidar et al. have developed correlation and regression models between each of the water quality parameters of TN and total phosphorous (TP) at Manzala lagoon, namely the largest brackish water body in the Mediterranean delta coast of Egypt and Thematic Mapper (TM) radiance data. The result indicated that some water quality parameters of TN and TP were significantly correlated with TM radiance data [
24]. Kazuo Oki et al. have produced two advanced maps of the potential annual total nitrogen load (PTNL) index and the potential annual total nitrogen load for each river basin area (PTNL/area) index by considering the relationship between the land cover types and the annual total nitrogen load discharged from river basins in the typical urban areas of Japan [
25]. Yan et al. have adopted a single factor pollution index and comprehensive pollution index to explore main water pollutants and evaluate water quality pollution level based on the TN inversion results of the Honghe River watershed of China, and have acquired the visualization of the spatial pollution characteristics and identification of potential polluted risky regions. Banglong Pan et al. have established a quantitative inversion models of total nitrogen (TN) through analyzing a correlation between TN in the Chaohu lake and different bands using HSI (Hyper-Spectrum Image) remote sensing data of HJ-1A satellite [
26]. Aiping Feng et al. have been driven by the MODIS (Moderate-resolution Imaging Spectroradiometer)data and used diffuse pollution estimation with remote sensing (DPeRS) to analyze the spatial characteristic of nitrogen diffuse pollution in the Haihe River basin on a pixel scale in 2016 [
27]. Liu et al. have established the particle swarm optimization support vector machine (PSO-SVM) model based on the sensitive bands to quantitatively estimate the total nitrogen concentration in surface water of the selected main three rivers in the Ebinur Lake watershed, located in Xinjiang, China to subsequently verify the inversion accuracy of the PSO-SVM model.
The temporal and spatial resolution of different remote sensing sensors and revisit time affect the accuracy of remote sensing inversion of water quality in a certain degree. Sentinel-2 is superior to Landsat 8 OLI in extracting suspended solids in black lakes [
28]. The earlier research on water quality remote sensing inversion commonly used remote sensing data include MODIS, HJ-1, Landsat TM/OLI, MERIS(Medium Resolution Imaging Spectrometer), and GF-1 WFV(Wide Field of View). However, the spatial resolution of some satellite data that was relatively low was only suitable for small-scale typical areas, and thus there were limitations in remote sensing inversion of TN and NH
3-N concentrations in large lakes. Sentinel-2 image is a new generation of multispectral image, equipped with MSI(Multispectral Image) sensor that includes 13 bands, and the relevant revisit time is five days. The Sentinel-2 spatial resolution of the visible light to near-infrared band is 10 m, and the spatial resolution of four red-side bands and two short-wave infrared bands is 20 m. Sentinel-2 integrates the advantages of other satellite remote sensing data, which has the characteristics of short revisit time, high resolution, and strong spectral recognition ability, is suitable for monitoring water of large lakes and ensures more accurate results [
29].
The current research mainly focuses on remote sensing inversion of water quality parameters such as chlorophyll-α, water turbidity, total suspended solids (TSS), chemical oxygen demand (COD) in lakes or large reservoirs, while TN and NH
3-N cannot be directly measured by spectroscopy due to their weak optical characteristics and low signal-to-noise ratio [
30]. Therefore, there is little research on remote sensing inversion of TN and NH
3-N and their spatial distribution and temporal variation. In this study, based on the real-time monitoring data and remote sensing analyses on Sentinel-2 images of the Danjiangkou Reservoir, the sensitive bands of TN and NH
3-N concentrations were analyzed and a remote sensing inversion model was constructed to retrieve the concentrations of TN and NH
3-N of the Danjiangkou Reservoir in 2016, 2018, and 2020. Moreover, the temporal and spatial characteristics of TN and NH
3-N were analyzed, the pollution load of the river basin was revealed, and the sources of pollutants were analyzed, which could provide a scientific reference for water quality monitoring and diffuse pollution control of the Danjiangkou Reservoir.
4. The Inversion Model of TN and NH3-N Concentrations
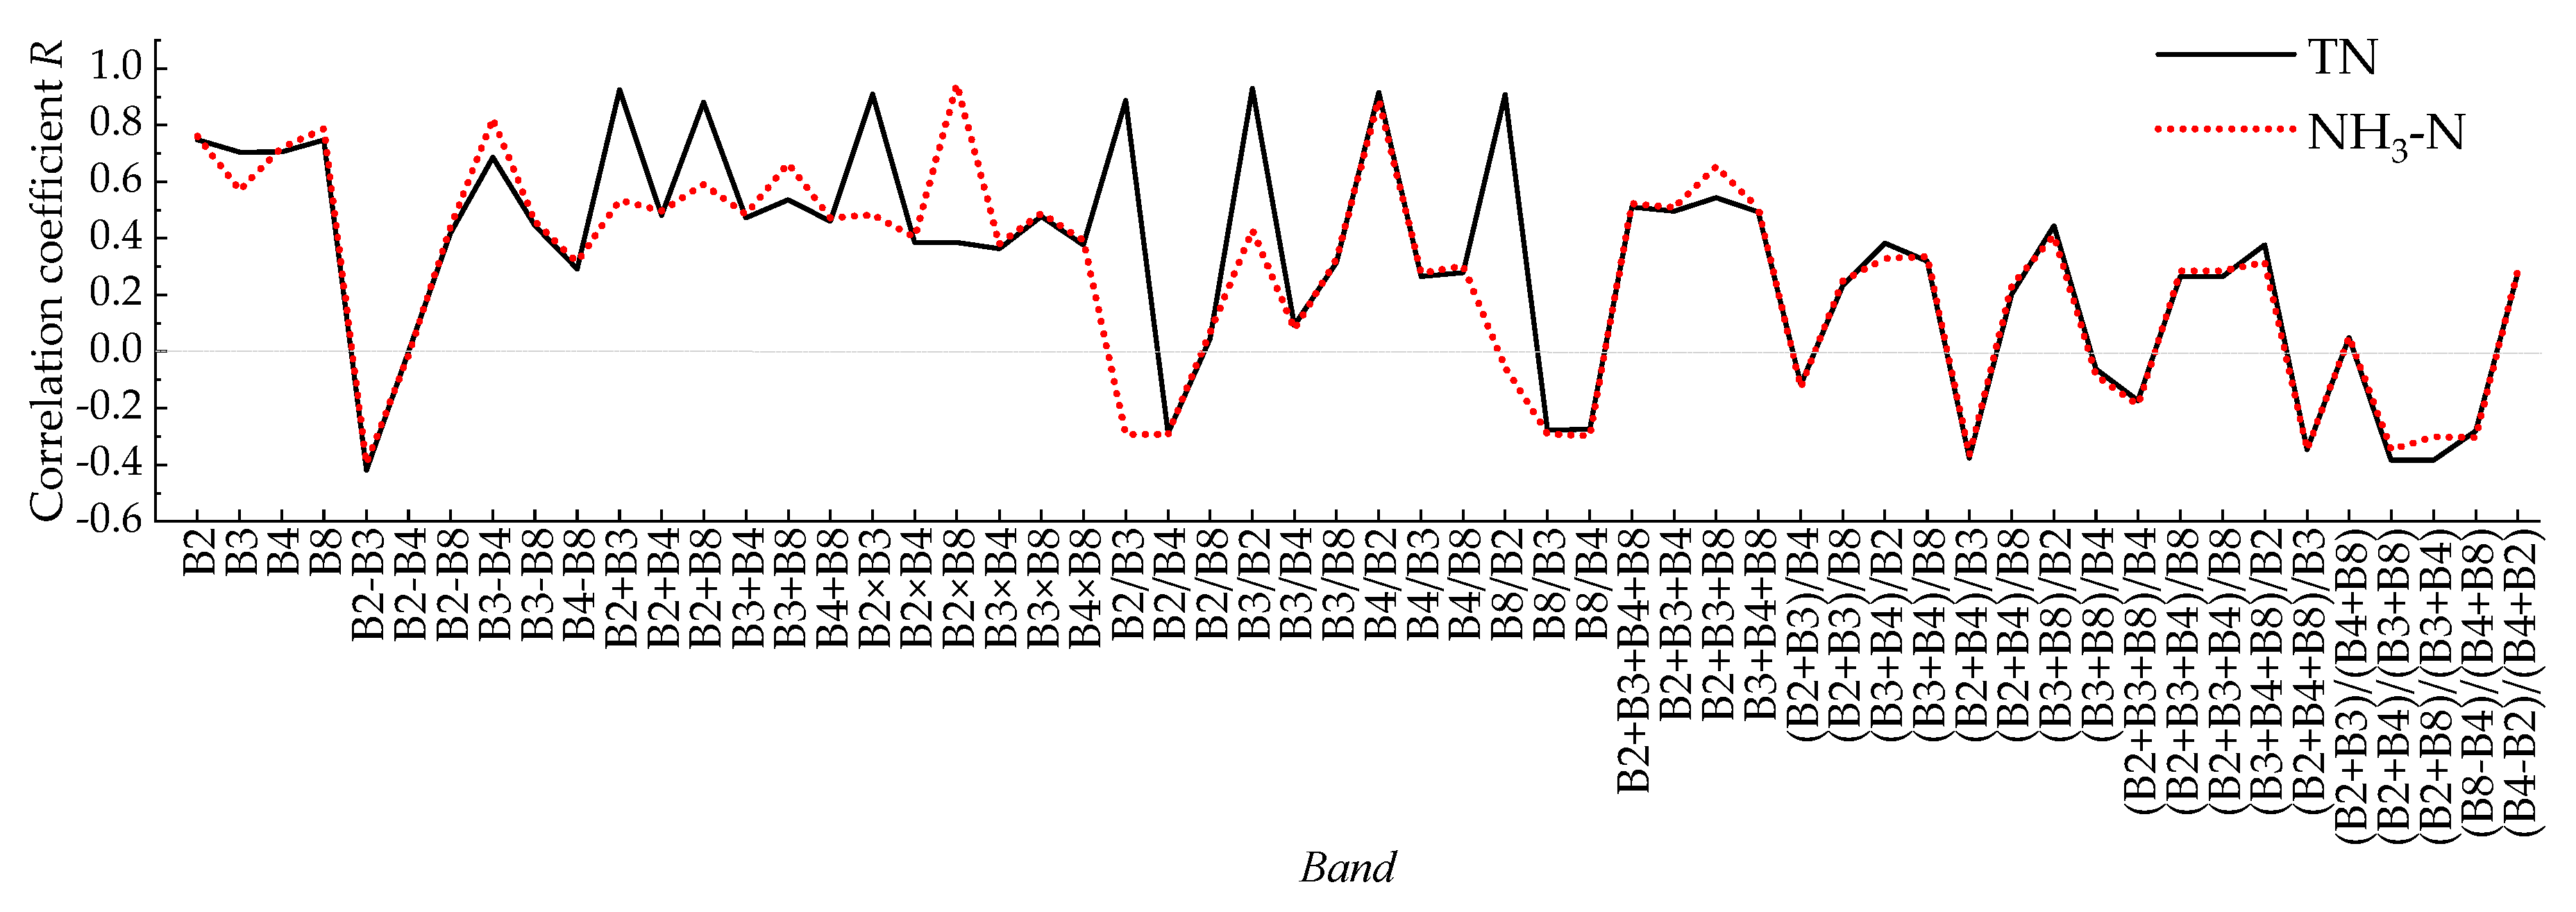
Taking the two band combination indexes of B2 × B8 and B3/B2 as independent variables, and the measured TN and NH
3-N concentrations as dependent variables, the corresponding functional relationships were established through statistical methods to construct remote sensing inversion models for TN and NH
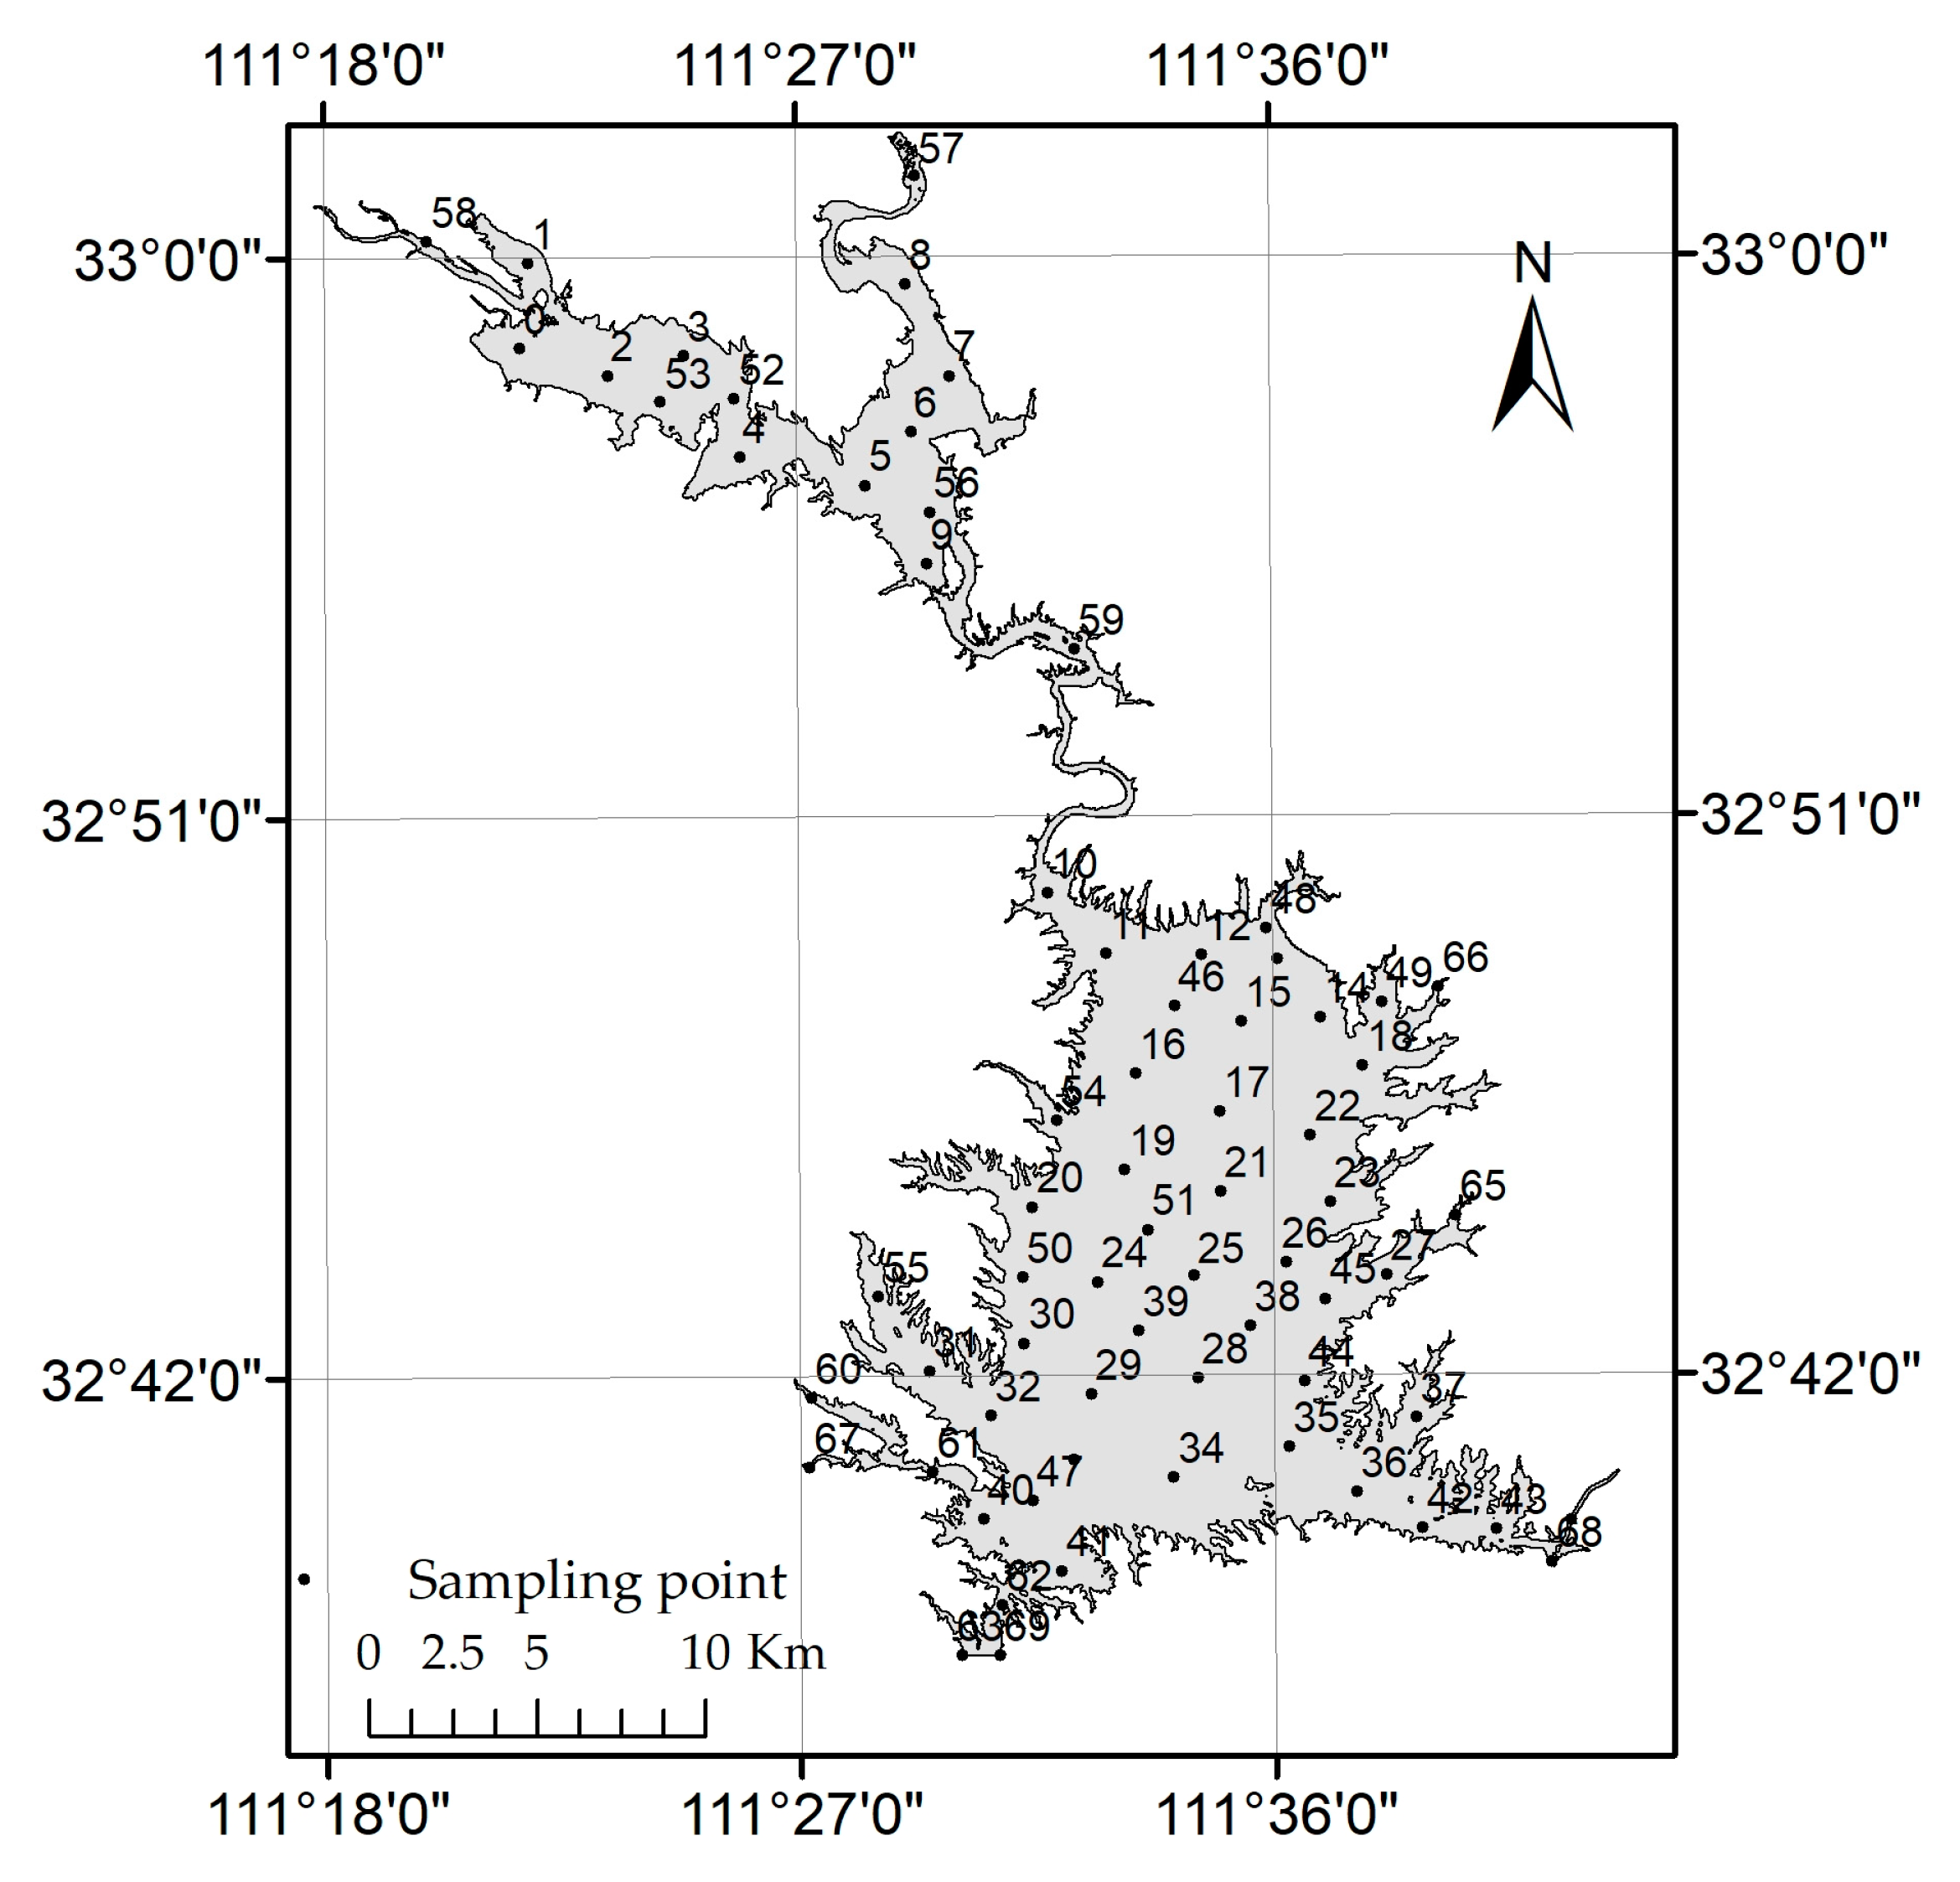
3-N concentrations. Based on the data of 70 sampling sites measured in 2016, four types of trend prediction and regression analysis including linear, quadratic polynomial, logarithmic, and power function were used to establish remote sensing inversion models of TN and NH
3-N concentrations. The relationship between the band combination and the concentration of TN and NH
3-N was obtained by fitting, as shown in
Table 2. It can be seen from
Table 1 that the quadratic polynomial model had the highest fitting accuracy in the concentrations of TN and NH
3-N, and their R
2 was 0.782 and 0.851, respectively (
Table 2). The measured concentrations of TN and NH
3-N at 70 sampling sites in February 2020 were subjected to quadratic polynomial regression with the concentrations of TN and NH
3-N predicted by the model to verify the model accuracy in predicting the concentrations of TN and NH
3-N. Linear relationship between the measured and the predicted concentrations of NH
3-N and TN are respectively shown in
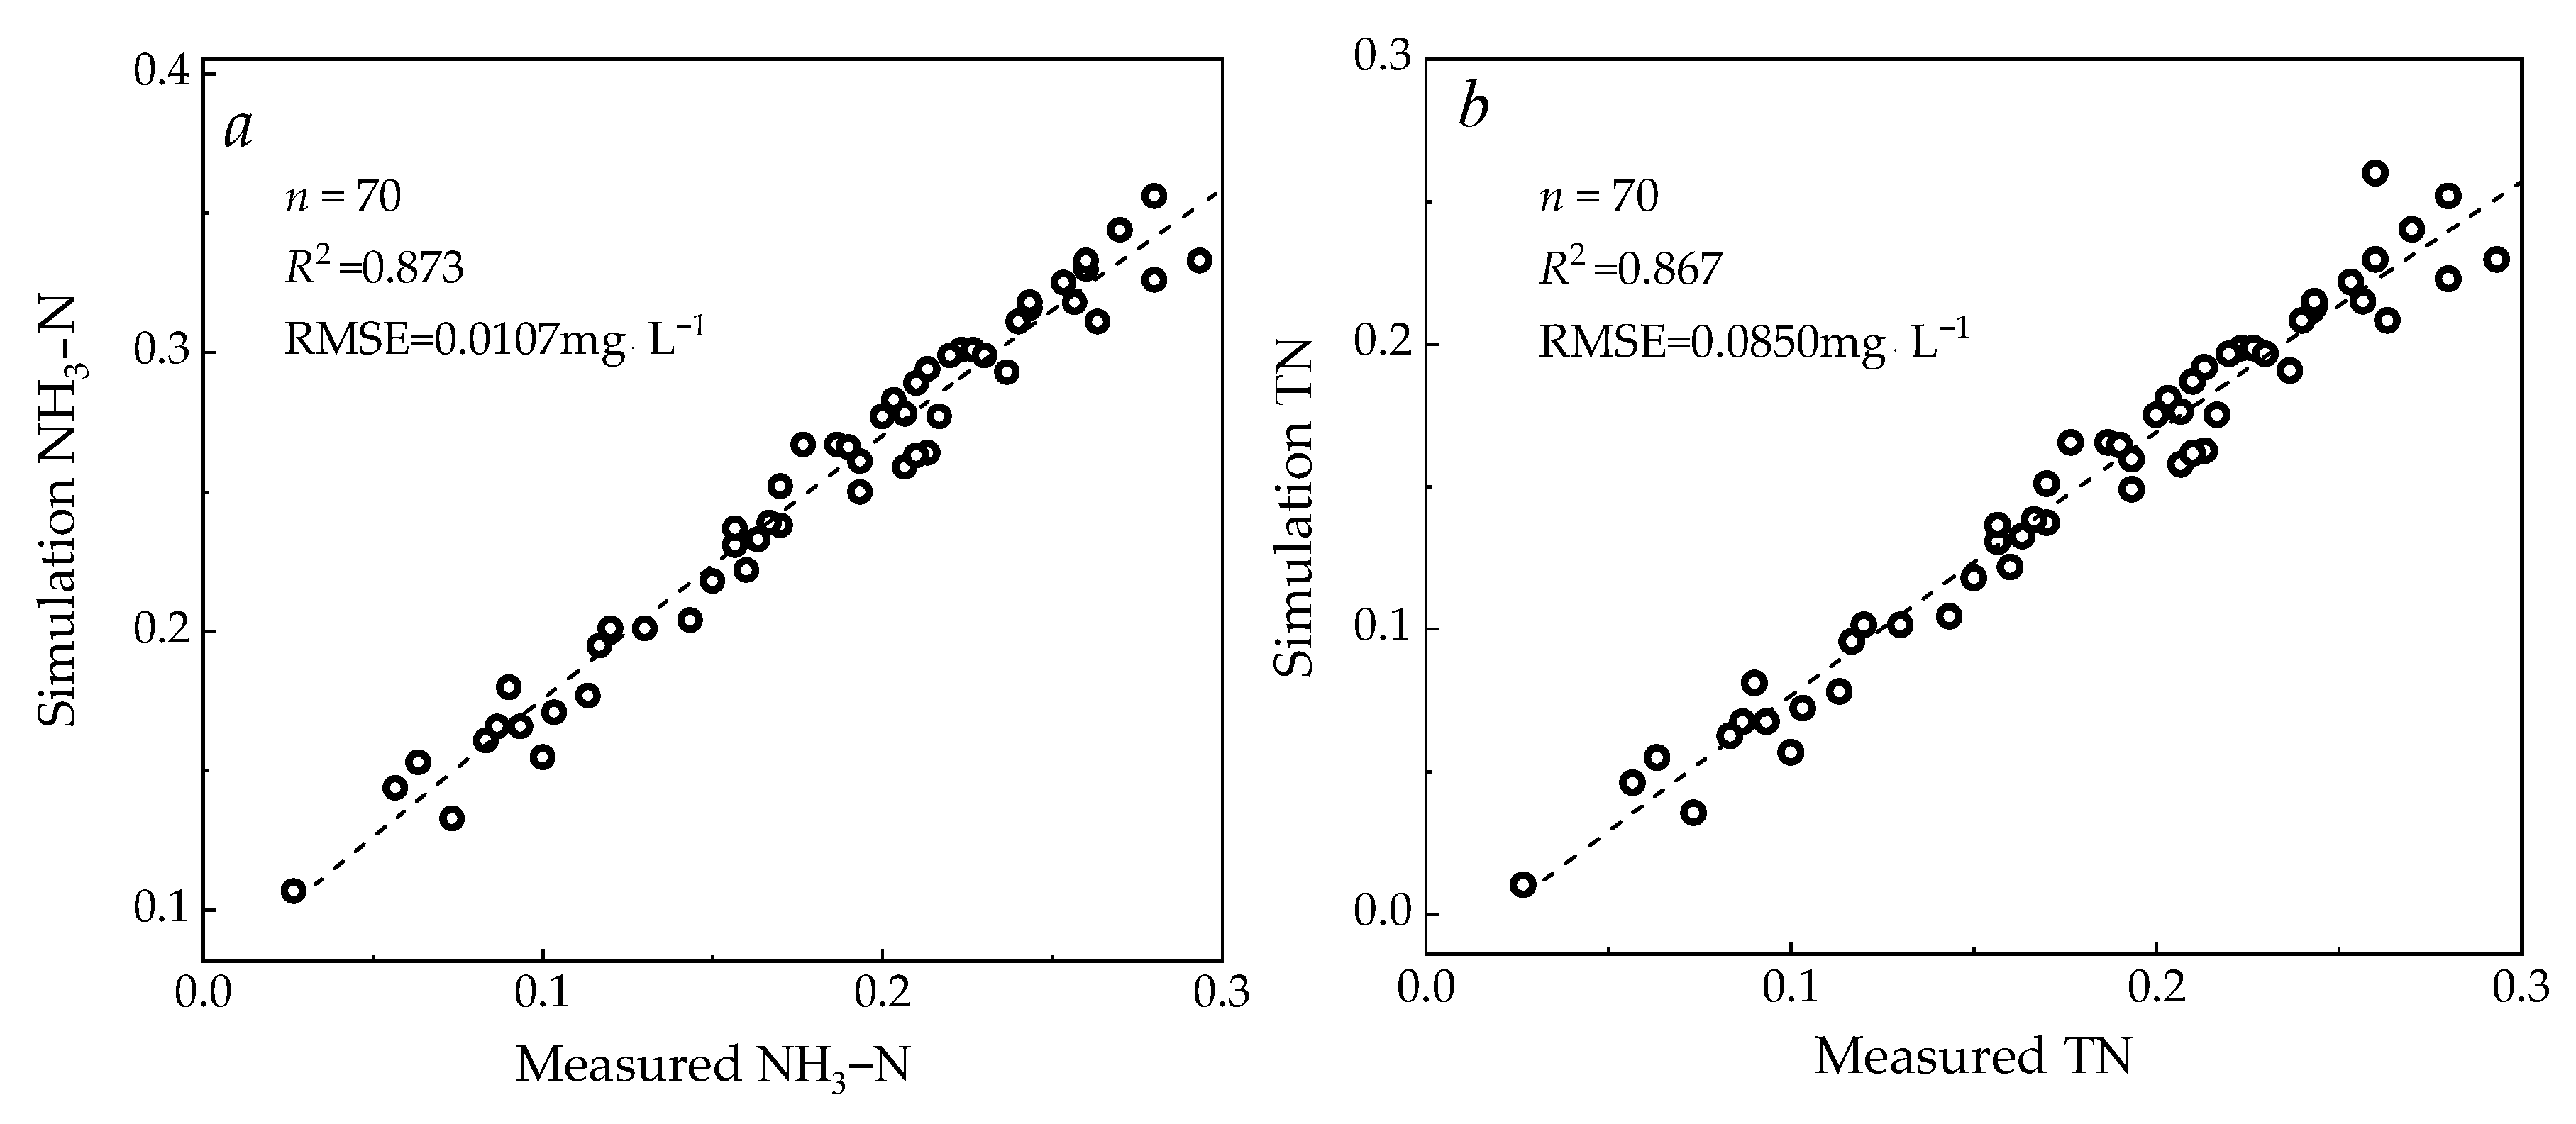
Figure 5a,b.
From
Figure 5a,b, there was a good linear relationship between the measured and the predicted concentrations of TN and NH
3-N. The
R2 was 0.873 for TN and 0.867 for NH
3-N, respectively, and the corresponding root mean square error (
RMSE) was 0.0107 mg·L
−1 and 0.0850 mg·L
−1, which indicated that the constructed inversion model had high prediction accuracy and was suitable for remote sensing inversion of TN and NH
3-N concentrations in the reservoir area of Sentinel-2 images.
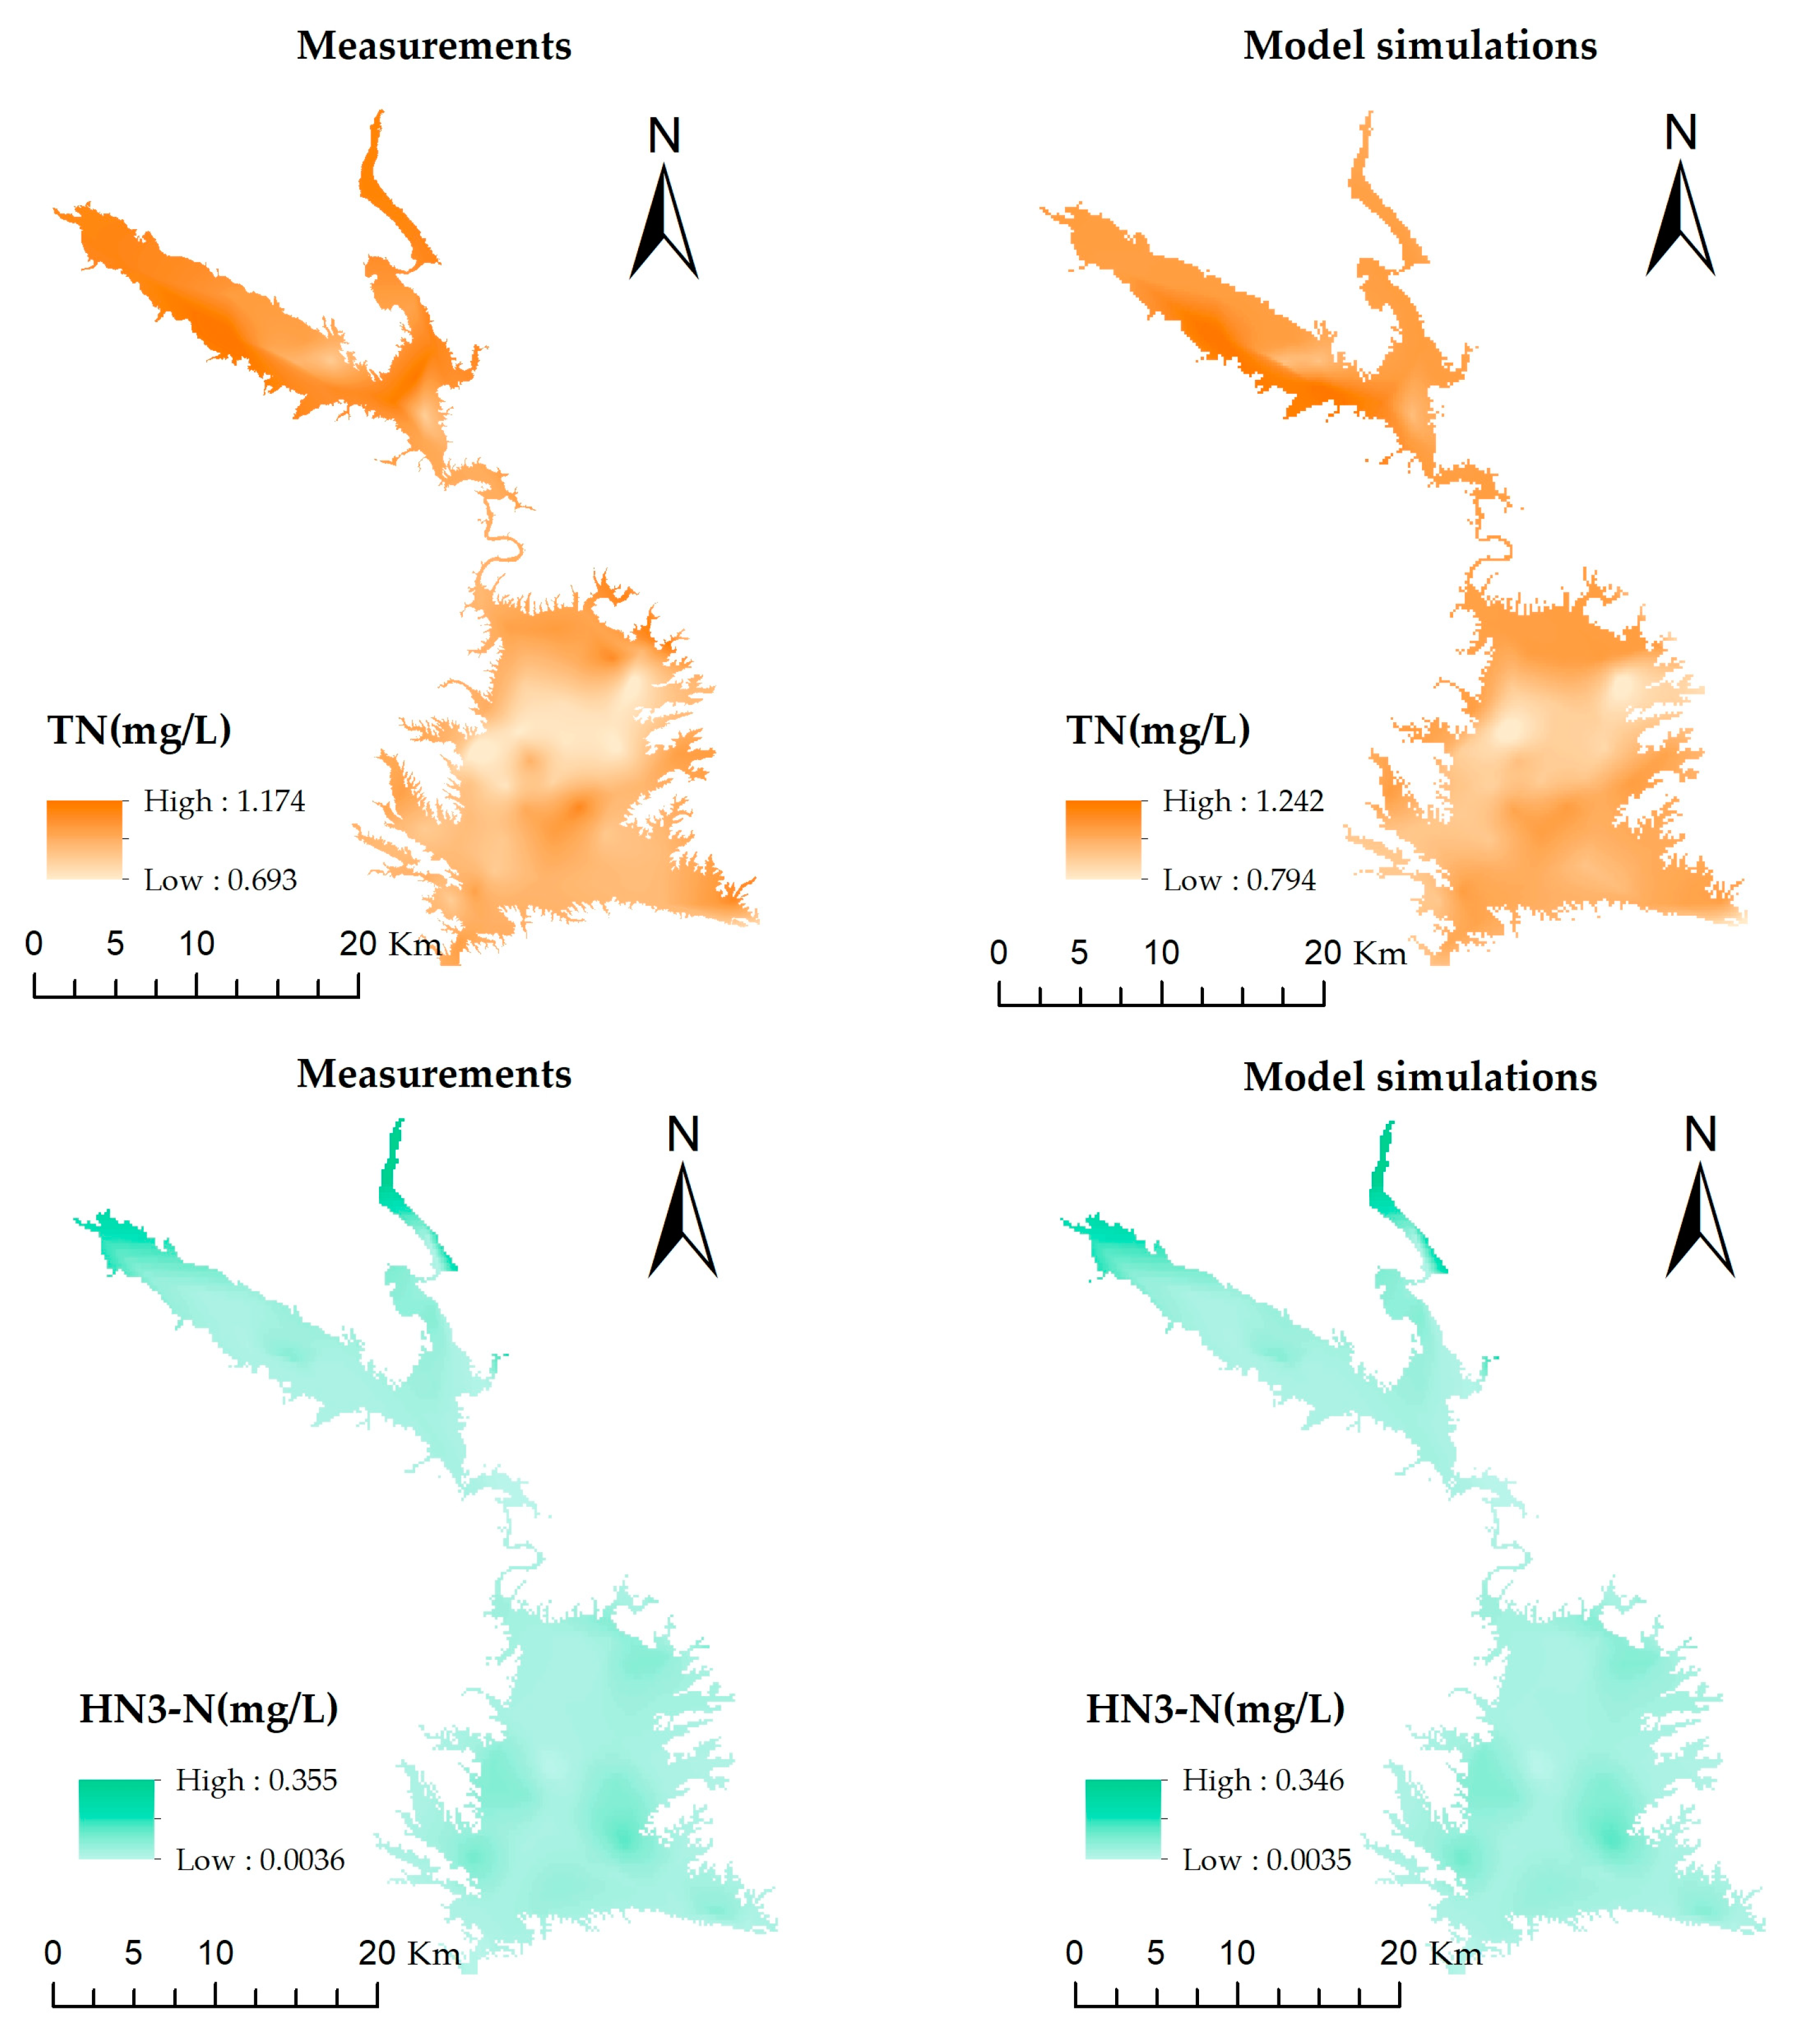
The spatial distribution of predicted and measured concentrations of TN and NH
3−N of all the 70 observation points are shown in
Figure 6. From
Figure 6, the difference between the maximum TN measured value and predicted value was 0.068 mg·L
−1, and minimum was 0.101 mg·L
−1; the difference between the maximum NH
3−N measured value and predicted value was 0.009 mg·L
−1 and the minimum was 0.0001 mg·L
−1. It can be seen that the difference between the measured value and the model predicted value was small. The measured value was in accordance with the model predicted value in spatial distribution and there was no significant difference. The analysis also indicated that the constructed inversion model had high prediction accuracy and was suitable for remote sensing inversion of TN and NH
3−N concentrations in the reservoir area of Sentinel−2 images.
6. Discussion
Nitrogen causes eutrophication of water bodies and the main sources of nitrogen include three aspects: soil nutrients, decomposition of plant residues, and external input [
34]. This study discovered that the main sources of TN and NH
3-N concentrations in the Danjiangkou Reservoir were soil nutrients and external input. During the study period, the concentrations of TN and NH
3-N of the reservoir demonstrated an overall downward trend, indicating that the water quality of the Danjiangkou Reservoir had continuous improvements. The measures to enhance agricultural non-point source pollution control and ecological construction along the water source area have made significant progress.
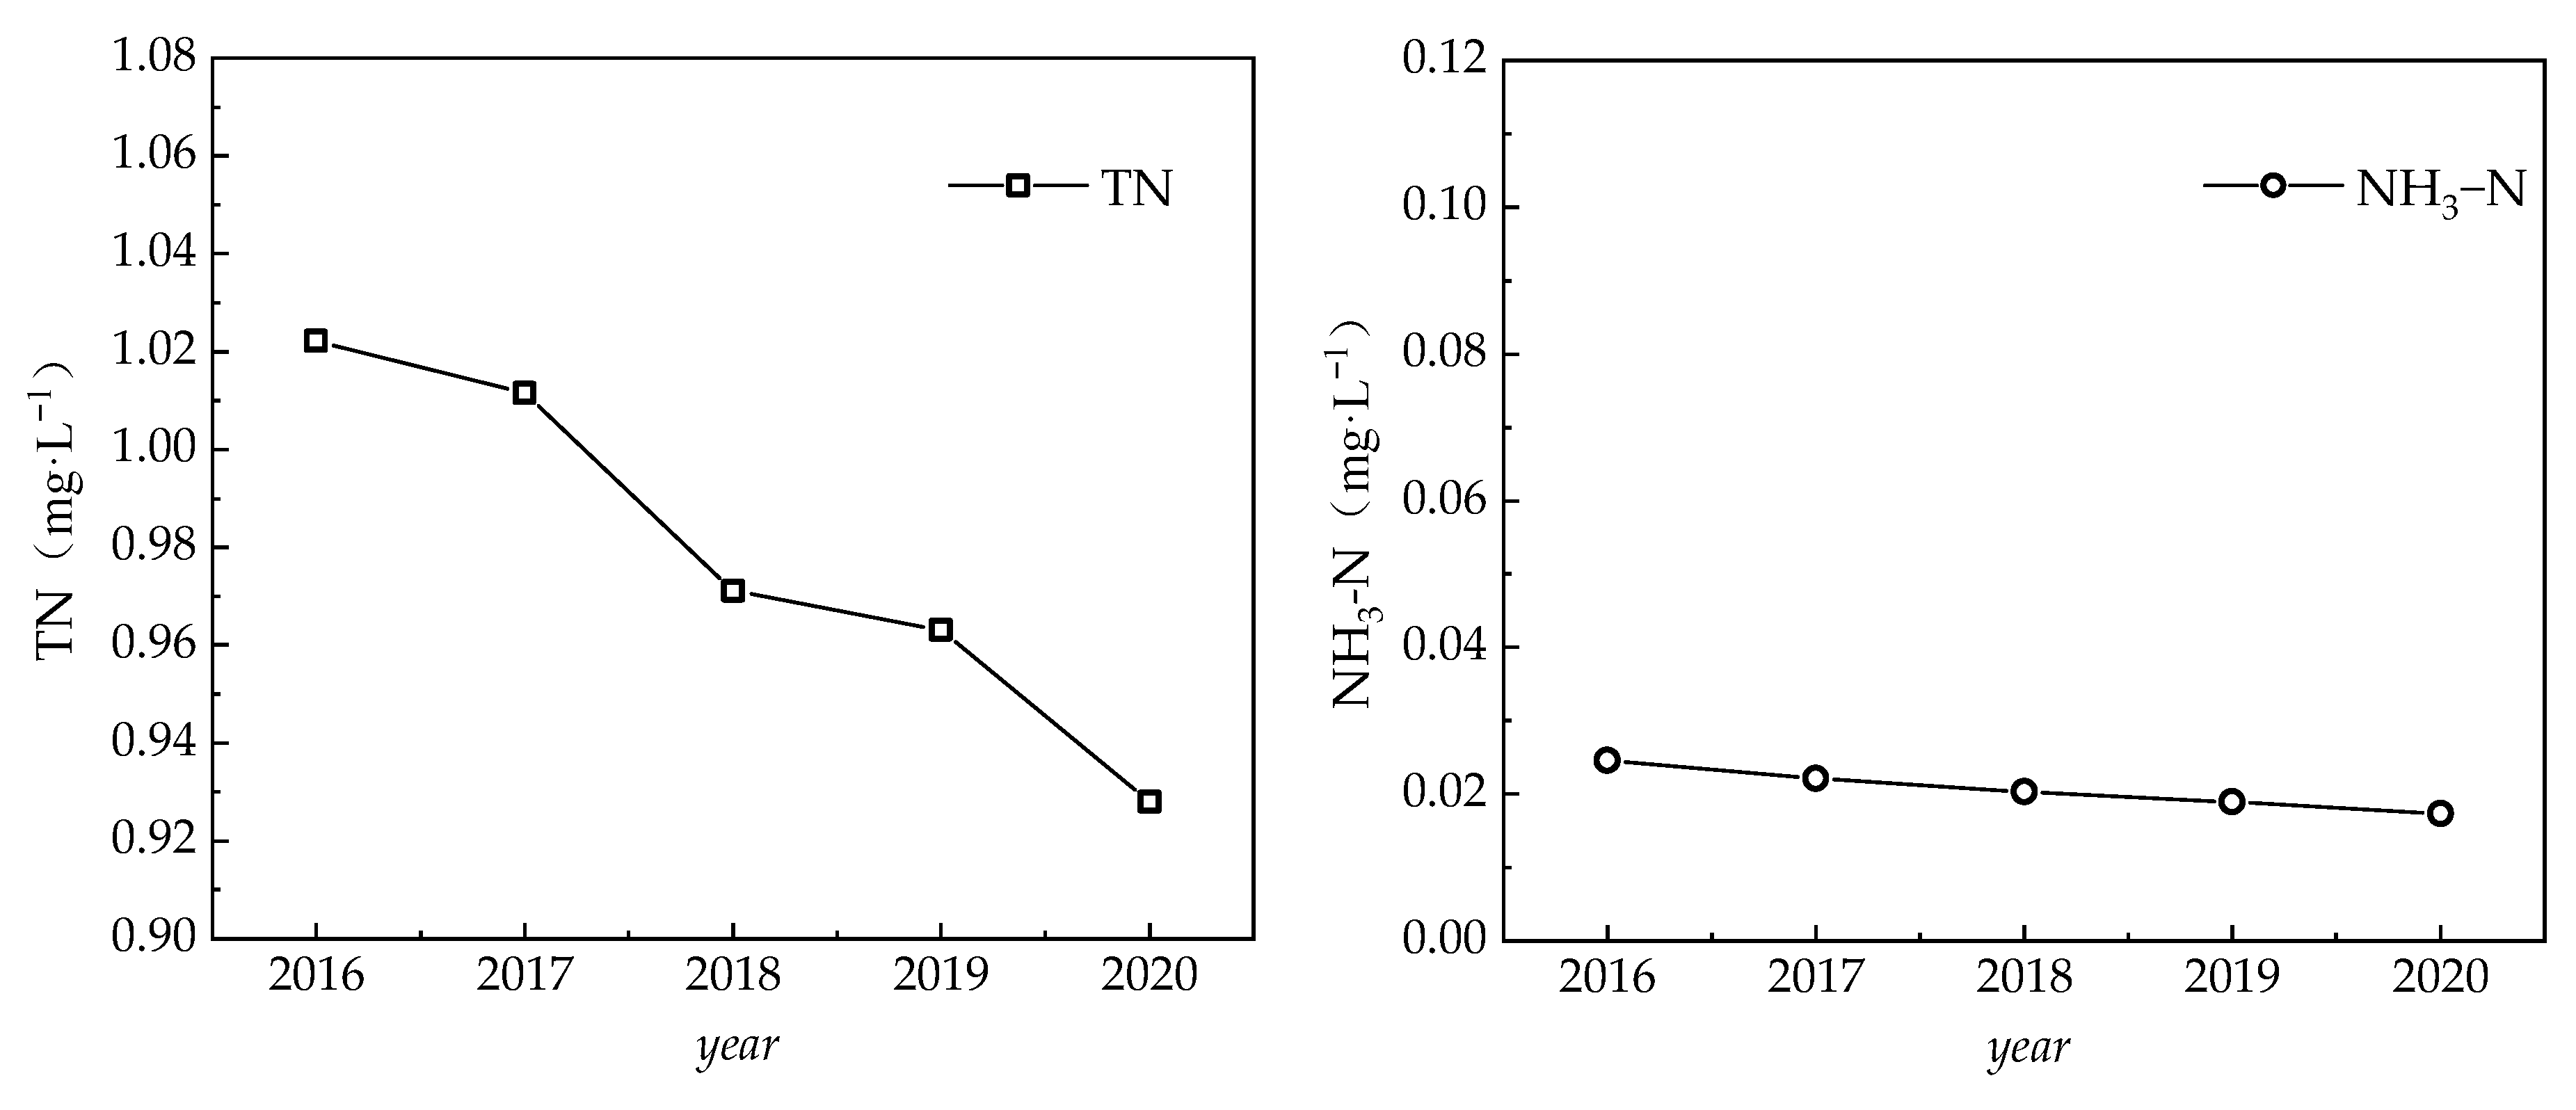
Regarding the temporal changes of TN and NH
3-N concentrations, there were no major fluctuations in the concentrations of TN and NH
3-N of the Danjiangkou Reservoir from 2016 to 2020, and both the minimum and maximum concentrations showed a downward trend. During the study period, the concentration of NH
3-N has been in line with Class I, and the concentration was relatively small in Class I, and the water quality was good, while the TN concentration was between Class III and Class IV. Generally, the Danjiangkou Reservoir had good water quality from 2016 to 2020. The inter-annual variation indicated that the water quality parameters TN and NH
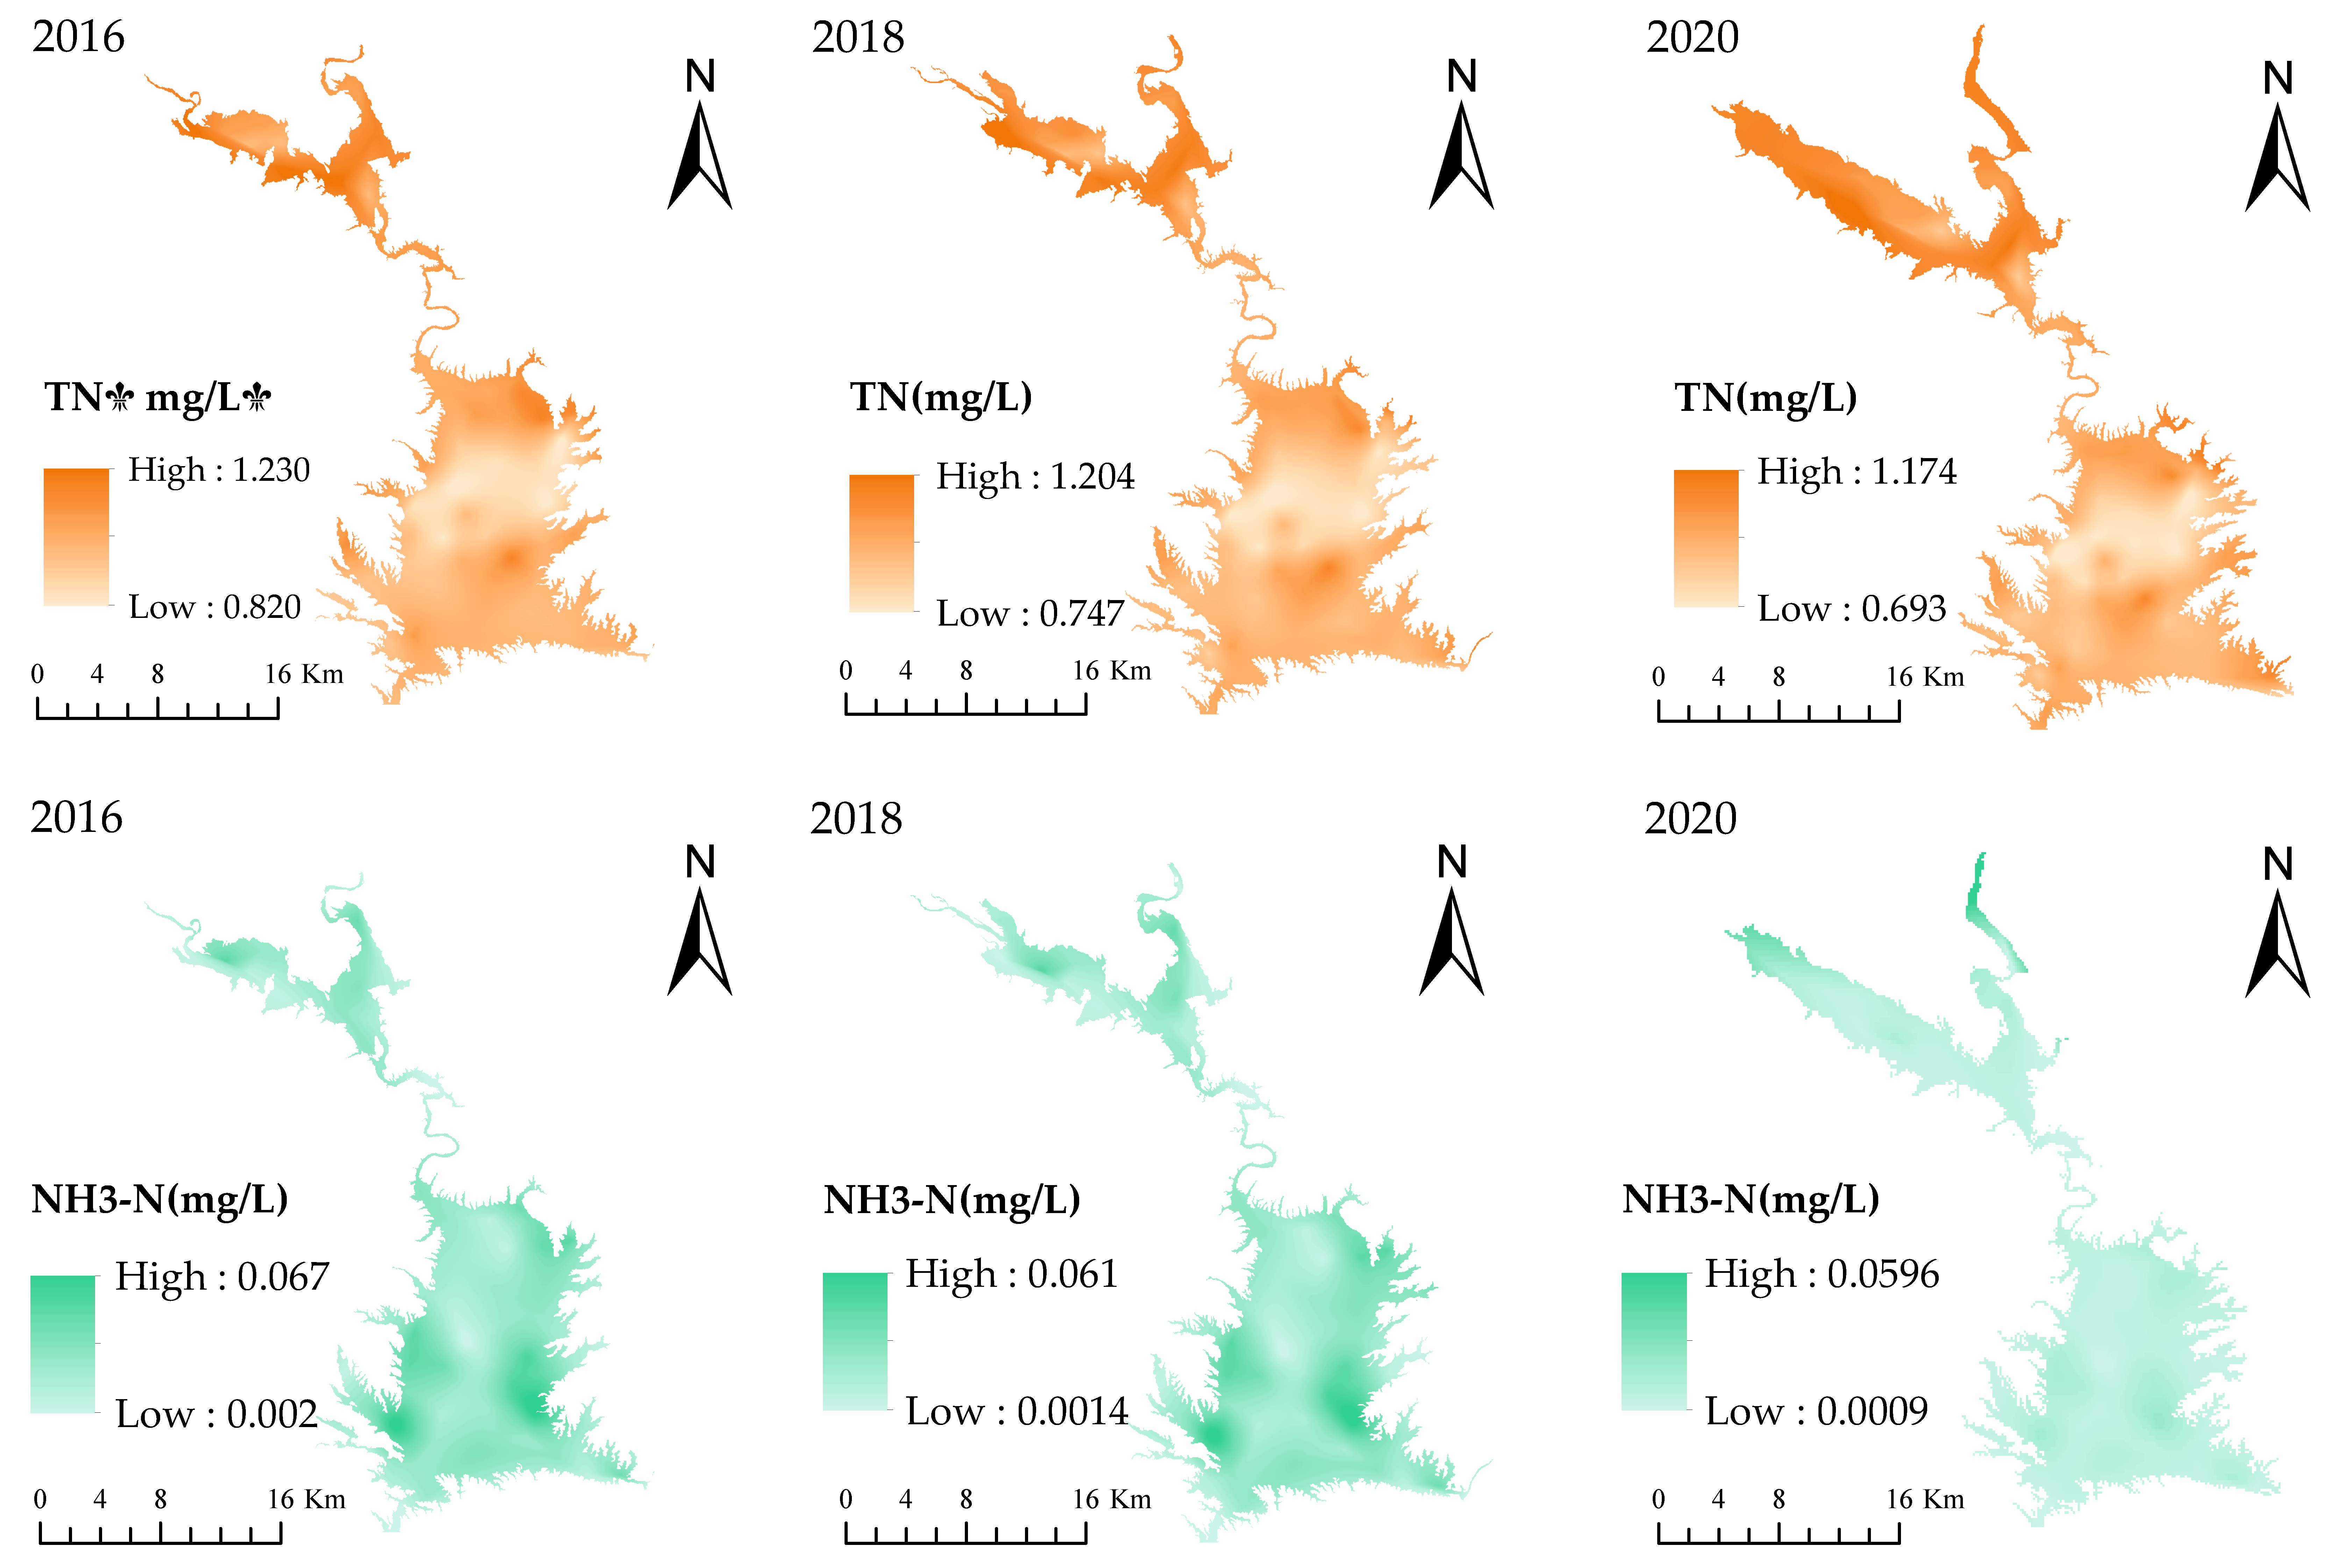
3-N of the reservoir have shown a downward trend, and the water quality has shown an overall upward trend. Pertaining to the spatial variation of TN and NH
3-N concentrations, the concentration of TN was higher in some areas in the middle of the reservoir area. This research selected the water quality data for the dry season in February. During this period, a detention water body and a small lake with a lower water level formed in the middle of the reservoir area. The bottom of the water body at the center of the lake tended to be agitated, causing sedimentary pollutants to suspend to the lake surface and release nitrogen. Therefore, the concentration of TN was significantly higher in some areas of the middle of the reservoir area. Yuanyuan Zhu et al. have pointed out that among the 10 main rivers entering the Danjiangkou Reservoir, the Han River has the largest TN input, followed by the Duhe River and Laoguan River. Zhongyuan Li et al. have found that the pollutant yield of the Guanhe River was the most, followed by the Danjiang River, Qihe River, and Taohe River. The Danjiang River, Laoguan River, and Tao River were the main tributaries that enter the northern part of the Danjiangkou Reservoir. Although the Danjiang River, Tao River, and Laoguan River entering the reservoir and the tributaries around the reservoir were relatively small, their TN load was relatively high. After entering the reservoir, the flow velocity decreased and thus the nitrogen elements tended to accumulate at the entrance, which was consistent with the areas with a high TN concentration mainly concentrated in the area at the entrance of the river in this study. This further confirmed that the temporal and spatial variation of water quality were caused by processes such as resuspension of suspended sediments and point source inflow of nutrients on a smaller spatial scale. The area with a high concentration of NH
3-N was located on the east and west edges of the southern part of the reservoir area, showing a trend of the planar concentration. This is because the surrounding terrain of the above-mentioned area was complex and the big slope and drop had a weak protection again soil erosion. Once soil erosion occurred, the chemical fertilizer carried in the lost soil and water was the cause of the high NH
3-N concentration in the water area. Generally, the larger the proportion of residential land and cultivated land in the basin, the higher the concentration of N in the water body [
35]. The on-site investigation on the east and west sides of the southern part of the reservoir area showed that the proportion of cultivated land in this area was relatively high. Agriculture was the main production activity in this area. The local residents improperly used pesticides and fertilizers to increase production. The surface runoff carried a large amount of nitrogen into the water body, resulting in a high background value of the nitrogen concentration parameter of the rivers entering the reservoir. Therefore, the concentration of NH
3-N in this region was relatively high.
The contribution rate of NH
3-N played an important role in TN and directly affected the TN concentration. After the state implemented the environmental protection policy of prohibiting phosphorous, nitrogen has been recognized the main control object [
36]. Compared with TN, NH
3-N could have a direct impact on the water quality, which is more relevant. The concentration of TN and NH
3-N in the study area did not show consistency in the spatial distribution. By calculating the average concentration of NH
3-N and TN in all sampling sites in 2016, 2018, and 2020, the percentages of NH
3-N in TN in the three periods were 1.43%, 1.22%, and 1.13%, respectively, indicating that nitrogen of other forms in the reservoir area accounted for a large proportion of TN. When the concentration of NH
3-N in the water body was higher than 2.5 mg·L
−1, the concentration of TN and the concentration of NH
3-N shows a certain linear correlation [
36]. In this study, it was found that the two concentrations did not have a good linear relationship after linear analysis of TN and NH
3-N in 2016, 2018, and 2020, indicating that the concentration of NH
3-N in the reservoir area was relatively low. This could also verify a certain accuracy of the inversion results to a certain degree.
The quadratic polynomial model used in this study has achieved a certain accuracy in the inversion of TN and NH3-N in the Danjiangkou Reservoir, but there were still some limitations. The application in the area is needed to adjust the model coefficients in order to obtain more accurate results. The band range of Sentinel-2 data in this study could be used for the inversion of TN and NH3-N in lakes and reservoirs. However, due to the limited availability of Sentinel-2 data, the most remote sensing images in summer were blocked by clouds and could not be processed. The concentrations of TN and NH3-N in the wet and dry periods of the reservoir area have not been compared, the effect of plant growth and microorganisms on nitrogen purification could not be characterized, and the relationship between the concentration of TN and NH3-N in winter and summer could not be well elucidated.
Currently, the remote sensing monitoring of water quality of large lakes still remains in some limited water quality parameters, such as Chl-a, TSS, Transparency, DO, and so on. The measured Chl-a concentration, water quality optical characteristics, and spectral data could establish a high-precision remote sensing inversion model. However, due to the differences in the natural geographic environment and the water environment, the prediction accuracy of these established inversion models for remote sensing monitoring of water quality parameters is not very high. The monitor results still require considerable field verification work. These inversion models are only suitable for macroscopic water quality evaluation, classification, and management (e.g., remote sensing mapping), but cannot replace accurate on-site water quality monitoring procedures. Therefore, the key to promote the practical application of remote sensing inversion of water quality parameters in large lakes is to discover the characteristics of spectral response curves of different water quality parameters. It is also necessary to establish a complete quantitative model library based on different water quality parameters, and thus dynamic monitoring of water quality can be realized by selecting the optimal model in a specific area.
The establishment of the model library can reduce the cost of water quality monitoring, improve work efficiency, and reduce monitoring errors. Moreover, the composition of large lakes is complex, and the spectral information overlaps each other. Therefore, it is reasonable to strengthen the study of the spectral characteristics of each water quality parameter, which helps to reduce the influence of the mixed pixel problem during the monitoring process and improve the inversion accuracy. Ultimately, the true remote sensing data used in water quality monitoring could be acquired.
7. Conclusions
Based on Sentinel-2 remote sensing data and ground monitoring water quality data, this study has attained the inversion of two water quality parameters TN and NH3-N concentrations in the Danjiangkou Reservoir in 2016, 2018, and 2020 by establishing a quadratic polynomial model and the spatio-temporal variation of water quality parameters has been analyzed. The following conclusions have been reached:
The quadratic polynomial inversion models of the band B2 × B8 for TN and B3/B2 for NH3-N were established using remote sensing reflectance of Sentinel-2 images. Meanwhile, the measured data of TN and NH3-N were used to verify the accuracy of the inversion values obtained by the model. The results showed that the model could be suitable for remote sensing inversion of TN and NH3-N concentrations in Sentinel-2 images.
The NH3-N concentration in the Danjiangkou Reservoir has been in line with Class I from 2016 to 2020, the concentration was relatively smaller in Class I, and the corresponding water quality was pretty good, while the TN concentration was between Class III and Class IV. The inter-annual variation indicated that both TN and NH3-N concentrations in the reservoirs have shown a downward trend, and the overall water quality had exhibited an upward trend.
During the dry season, a detention area of water body formed in the middle of the reservoir area, and thus a small lake with a low independent water level formed. The bottom of water body at the lake center was easily disturbed, causing sedimentary pollutants to suspend to the lake surface and release nitrogen, resulting in a higher TN concentration. In the northern part of the Danjiangkou Reservoir, the main inflow of the reservoir and the tributaries around the reservoir were relatively small, but the inflow load of TN was relatively large, which made the areas with a high TN concentration at the river entrance. The mountainous areas on the east and west sides of the southern of the Danjiangkou Reservoir had large slopes, which were inclined to soil erosion. The lost soil and carried a large amount of pesticides and fertilizers, and the area had a high proportion of the cultivated land. Moreover, the pesticides and fertilizers were improperly used by the local residents to increase production. Therefore, the ground runoff carries a large amount of nitrogen into the water body, resulting in a higher background value of the nitrogen concentration indicators of the rivers ultimately entering the reservoir, and increasing the NH3-N concentration of water bodies on the east and west sides of the reservoir area.


