Enhanced Removal of Contaminants of Emerging Concern through Hydraulic Adjustments in Soil Aquifer Treatment


1
Institute for Groundwater Management, Technische Universität Dresden, 01069 Dresden, Germany
2
Biosphärenreservat Mittelelbe, 06813 Dessau-Roßlau, Germany
*
Author to whom correspondence should be addressed.
Water 2020, 12(9), 2627; https://doi.org/10.3390/w12092627
Submission received: 23 July 2020
/
Revised: 8 September 2020
/
Accepted: 12 September 2020
/
Published: 20 September 2020
(This article belongs to the Special Issue Managed Aquifer Recharge—Enhancing the Use of Alternative Water Sources for Subsurface Storage and Soil Aquifer Treatment)
Abstract
:Water reclamation through the use of soil aquifer treatment (SAT) is a sustainable water management technique with high potential for application in many regions worldwide. However, the fate of contaminants of emerging concern (CECs) during the infiltration of treated wastewater during SAT is still a matter of research. This study investigates the removal capacity of 27 CECs during SAT by means of infiltration experiments into a 6 m soil column. Additionally, the influence of the hydraulic operation of SAT systems on the removal of CECs is investigated by changing the wetting and drying cycle lengths. Sixteen out of 27 CECs are efficiently removed during SAT under various operational modes, e.g., bezafibrate, diclofenac and valsartan. For six substances (4-methylbenzotriazole, amidotrizoic acid, benzotriazole, candesartan, hydrochlorothiazide and sulfamethoxazole), removal increased with longer drying times. Removal of amidotrizoic acid and benzotriazole increased by 85% when the drying cycle was changed from 100 to 444 min. For candesartan and hydrochlorothiazide, removal improved by 35%, and for 4-methylbenzotriazole and sulfamethoxazole, by 57% and 39%, respectively. Thus, enhanced aeration of the vadose soil zone through prolonged drying times can be a suitable technique to increase the removal of CECs during SAT.
1. Introduction
Water scarcity is a worldwide threat that affects more than 2 billion people [1]. With the increase in world population, the demand for fresh water is projected to rise between 20% and 30% until 2050 (up to 6000 km3/year) [2], increasing competition around available water resources and potentially bringing poverty to those who lose access to them [3]. In addition, both surface water and groundwater resources are threatened by climate change effects, such as temperature increase as well as altering rainfall intensity and variability [4,5].
The global demographic increase also conveys a possible answer to the problem of water scarcity: growing volumes of wastewater (WW). It was estimated that the worldwide WW production in the domestic and manufacturing sectors has augmented from 368 km3 in the year 2000 to 450 km3 in 2010 [6]. WW reuse of these increasing volumes can be a viable solution to relieve the water demand in some sectors, e.g., for irrigated agriculture. Treated WW (TWW) use for irrigation is an accepted practice in many countries, like Israel, where 150 Mm3 of WW are treated yearly at the Shafdan soil aquifer treatment (SAT) facility to be used for crop irrigation thereafter [7]. The potential of WW reuse has been projected to be as high as 6000 Mm3/a for Europe in 2025 [8] and is further reflected by the recent publication of common European guidelines for water reuse [9].
Next to conventional treatment for WW reuse, soil aquifer treatment (SAT) is a nature-based solution for the recovery of secondary or tertiary TWW. The reclaimed water is infiltrated by means of basins, passes through the vadose soil zone and is later retrieved from wells in surrounding aquifers. In the vadose zone, biochemical and physical processes occur that foster compound degradation and thereby improve the quality of the recovered water [10,11]. The compounds underlie filtration, adsorption and biodegradation, which have been demonstrated to remove pathogens, nutrients, dissolved organic matter and organic compounds such as the contaminants of emerging concern (CECs) [11,12,13].
CECs include pharmaceuticals, personal care products and industrial compounds, among others [14], which are of particular concern for several reasons. Firstly, WW treatment plants (WWTPs) with secondary and tertiary treatments are not specifically designed to remove them [15], and thus, CECs are continuously introduced to the environment. An additional treatment stage to enhance CEC removal (i.e., ozonation or activated carbon) is rarely implemented as these solutions are costly [16]. Secondly, some CECs are endocrine-disrupting compounds of high organisms and in the case of antibiotics can promote microbiological resistance, and their long-term effects on human health and ecosystems are largely unknown [17,18].
Previous studies demonstrated that SAT is effective in removing a majority of effluent-derived CECs, although a few substances persist at low trace levels (ng/L) of debatable health significance [19]. For example, Ternes et al. [20] investigated the fate of 52 substances, including pharmaceuticals and personal care products, which were irrigated on arable land with TWW for more than 45 years in Braunschweig (Germany). During the soil–aquifer passage, more than 80% of these substances were naturally attenuated by degradation and sorption processes. However, some pharmaceuticals such as the antibiotic sulfamethoxazole, the anticonvulsant drug carbamazepine and the contrast media diatrizoate and iopamidol were persistent and detected in groundwater. Therefore, concerns remain about the fate of CECs during the process of SAT as the infiltration of TWW through the unsaturated soil zone holds the risk of contaminating groundwater resources. A thicker vadose zone increases the possibilities for the attenuation of organic pollutants and, thus, reduces the groundwater vulnerability to contaminants [21,22]. However, so far, most research conducted at a laboratory scale concerning the fate of CECs considers columns that have 1–2 m length [23,24,25,26].
The removal efficiency of SAT is strongly influenced by its management, e.g., the hydraulic operation, the site characteristics or the infiltrate water quality [27,28]. The SAT hydraulic operation is conducted with hydraulic loading cycles (HLCs) representing intermittent phases of flooding an infiltration basin and subsequent basin drying. The optimal ratio of HLCs during SAT is very site-specific, though it was shown that the wet–dry ratio should be smaller than one to keep the system efficient in pollutant removal [29]. A higher HLC frequency with shorter flooding cycles is advantageous for organic compound removal during SAT [30,31]. Compared to continuous infiltration, cyclic infiltration shows better degradation rates for compounds such as diclofenac [32]. Nevertheless, SAT design is still advised with flooding cycles of 1–3 days [33], even though a higher frequency of HLCs with shorter cycle phases has shown better performance for water quality improvement due to increased topsoil aerating [30,31]. The drying phase leads to an aeration of the vadose zone. Dissolved oxygen (DO) is an important factor for SAT, as high DO levels are a precondition for the aerobic microbiological activity and compound degradation [34]. Hence, microbiological activity is the highest in the upper vadose zone [35] where most of the compound degradation occurs [36].
The objective of this research is to study the effect of wetting and drying cycles on the removal of CECs from a TWW effluent in a 6 m laboratory-scale SAT system. This study hypothesizes that enhanced aeration of the vadose soil zone can be a suitable technique to increase the removal of CECs during SAT.
2. Materials and Methods
2.1. Laboratory Setup of 6-m Column
A 6 m high stainless steel column (diameter 0.15 m) consisting of six modules, containing 2 or 3 measuring ports each, was used for the experiments (Figure 1). Each port was equipped with a tensiometer (Tensio 151, UGT GmbH, Müncheberg, Germany), a water content sensor (SM300, Delta-T Devices Ldt., Cambridge, UK), a luminescent dissolved oxygen (LDO) sensor (LDO101 Probe, Hach Lange GmbH, Düsseldorf, Germany) and a suction cup (ecoTech, Bonn, Germany). Data were recorded every two minutes in two data loggers (DL-2000, UGT GmbH, Müncheberg, Germany), except for the oxygen data, which was recorded with an HQ 40d multi (Hach Lange GmbH, Düsseldorf, Germany). The column was packed with different soil horizons (Table 1). Until a depth of 2.6 m, the column had a sand content of 94%, the middle section consisted of almost pure sand and the bottom section (below 4.6 m) showed higher clay and silt contents of 13% in total. The bottom of the column was set as a free drainage boundary condition with a filter disk and an outlet. The upper boundary was operated with intermittent ponding up to a height of 0.06 m.
The experiments were conducted with different HLCs (Table 2). The general aim of changing the ratio was to determine whether shorter drying times were sufficient for keeping a high natural removal of CECs as for some SAT facilities shorter drying phases allow for the infiltration of larger volumes but potentially reduce DO regeneration. Finding the optimal ratio is a balance between infiltrating as much effluent as possible while maintaining removal of pollutants in the vadose zone. Most scenarios were conducted with a wetting phase of 60 min and drying phases that varied between 150 and 444 min. Wetting phase in this context refers to the time that water was actively pumped on top of the soil. After the end of the wetting phase, the ponded water took 45–285 min to infiltrate depending on the length of the wetting phase. HLCs were further varied to see the effect of longer wetting phases (scenarios 2–5). The hydraulic loading rate was relatively constant throughout each scenario, being between 150 m/a and 350 m/a depending on the HLC. After each scenario was finished, the column was flushed with tap water for one day to restrict clogging and was left to dry for several days until DO levels recovered above 6 mg/L.
2.2. TWW Characterization and Sample Analysis
The experiments were undertaken with TWW from a municipal WWTP (787,000 PE) with a combined sewage and rainwater treatment system. The WWTP effluent which was used in the experiments is further characterized in Table 3.
During the experiments, the TWW was kept in an open container. It was pumped on top of the column during the wet phase with excess water that exceeded the maximum ponding height flowing back to the container through an overflow hose. Water samples were taken at the end of each scenario (last cycle) from the container and column outlet for all scenarios and only for chosen scenarios at all ports. The samples were analyzed regarding ammonium concentrations (Nova 30 Spectroquant, Indophenol blue method), nitrate and nitrite concentrations (Ion chromatograph), and dissolved organic carbon (DOC) (standard method, ISO 8245:1999). CECs were analyzed in a partner laboratory (DVGW-Technologiezentrum Wasser) according to the LC/MS–MS method after direct injection (according to [37]). For CEC analysis in the soil samples, the sediment was extracted with methanol, diluted with water and then injected into the HPLC/MS–MS system.
2.3. Evaluation of the Removal Efficiency and Sorption Capacity of the Target CECs
The removal is calculated as the ratio between inflow concentration (cin) and outflow concentration (cout) of the CECs (Equation (1)). Cin is measured from samples in the storage TWW storage tank, and cout is measured at the column outflow during one infiltration cycle.
Removal efficiency = 100 − (cout × 100/cin)
The removal efficiencies of CECs are divided into three categories: efficient (>80%), moderate (30–80%) and poor (<30%) according to He et al. [39].
The distribution coefficient (Kd) is used to evaluate the adsorption potential of dissolved contaminants in contact with soil [40].
where Koc is the soil organic carbon-water partition coefficient and foc is the fraction of organic carbon. foc for the medium and coarse-sized materials of the laboratory column was based on the TOC ranges from 0.01 to 0.25% (Table 1)
Kd = Koc × foc
Overall, Kd values of lipophilic compounds correlate with foc and the octanol–water partition coefficient (Kow). Nevertheless, some of the selected CECs have anionic, cationic and zwitterion forms due to the presence of ionizable groups (i.e., amino, carboxyl groups, etc.) in their structures. Consequently, the pH-dependent octanol–water distribution ratio (log Dow) is more suitable than the log Kow to predict the sorption capacity of these CECs [41] (Table 4). For neutral compounds, the log Dow is equal to the log Kow (Table 4).
The Koc value (expressed as log Koc) was evaluated based on equation [42]:
where A and B are empirical parameters for lipophilic and non-lipophilic CECs. The values A = 0.81 and B = 0.10 were used for hydrophobic CECs (with log Kow > 3 for neutral CECs and log Dow > 2 for ionic CECs), and the values A = 0.52 and B = 1.02 were used for non-hydrophobic CECs [43].
Log Koc =A × log Dow + B
2.4. Selection of Target CECs and Their Physico-Chemical Properties
Table 4 depicts the list of CECs selected for this study and their physico-chemical properties. CECs were selected based on (i) the type of substance (i.e., pharmaceuticals, personal care products and lifestyle substances) and pharmaceutical class (i.e., antibiotics, anticonvulsants, angiotensin agents, contrast media agents, among others), (ii) the physico-chemical properties (hydrophilic vs. hydrophobic) and (iii) their fate in the environment (persistent vs. potential attenuation).
3. Results and Discussion
3.1. DO Levels and Removal of DOC and N Species under Different HLCs
DO levels of the influent water in the open tank ranged between 7 and 8 mg/L depending on how long it was stored (usually 2–3 days) and the room temperature. Initial DO levels in the column were between 7 and 8 mg/L at the beginning of each scenario, except for the scenarios 1.6, 4 and 5. These scenarios had been conducted without this precondition and showed lower initial DO values; e.g., scenario 1.6 had values around 5 mg/L (Figure 2).
The differing DO levels, specifically in the upper meter of the soil column, during the exemplary scenarios are shown in Figure 2 (additional scenarios are depicted in Supplementary Figure S1). The most apparent difference was the vast change between DO levels during and after infiltration for scenario 5 (2:5 d). During infiltration, DO levels were reduced to 2.7 mg/L on average, while the long drying phase of five days enabled DO recovery up to 9.6 mg/L. The intense DO depletion during scenario 5 might be partially attributed to the high DOC input concentration of 11.4 mg/L, which differs notably from all other scenarios which had input concentrations between 5 and 8 mg/L: scenario 1.6 (60:444 min) shows that DO recovery after infiltration is possible during SAT with shorter cycles as well. While scenario 1.1 (60:100 min) was at a similar DO level as scenario 1.6, recovery of DO levels was restricted due to the short drying phase. This implies that over time, DO levels will decrease and biodegradation will be reduced.
This is also reflected in the much bigger ranges of DO values for scenarios 1.1 and 5, which, specifically to a depth of 2 m, show a large variability over the course of 10 infiltration cycles. The longer the drying phase, the more constant DO values can be achieved. For a depth of 0.75 m, the range of DO variability decreased from 3.6 mg/L (100 min drying) to 1.5 mg/L (150 min drying), 0.9 mg/L (240 min drying) and finally 0.5 mg/L (444 min drying). Scenario 1.6’s and 1.4’s values stayed relatively constant, whereas DO values for scenarios 1.1 and 1.2 decreased with time. In general, DO variability is much larger in the upper section of the column (until 3 m depth). Even for scenarios with overall decreasing levels, DO variability between the individual infiltration was is small and DO reduction occurred gradually in the lower column section. Microbial respiration causes a more intense DO reduction until 2–3 m depth. In the lower soil section, biodegradation was reduced. Additionally, the hydraulic effect of infiltration cycles was damped with increasing depth.
The development of DO levels over the course of several infiltration cycles is depicted in Supplementary Figure S2. For scenario 1.1, a downward trend of DO levels in the upper section of the column shows that 100 min of drying time is not sufficient to recover DO levels in the long term. Additionally, for this particular scenario, the HLC was changed to 60:240 min if DO fell below a set threshold, which resulted in DO levels starting to recover after day 7. Had the shift not been implemented, an even stronger DO decrease could have been observed. After changing back to the original HLC (day 11), DO levels decreased immediately. Scenario 1.6, with a longer drying time (444 min), was able to maintain constant or increasing DO levels throughout the column. For scenario 5, DO levels recovered fully during the drying phase but complete DO depletion may have been reached in the upper column section during the wetting phase, as is shown around 10 days in Figure S2.
Biodegradation was demonstrated in the SAT system as it accounts for DOC removal as well as degradation of N-species. Figure 3 shows the removal of DOC and the development of nitrate for different scenarios along the 6 m column. Half of the DOC concentration was degraded within the first meter of the column. Afterward, there was still degradation but it only accounted for roughly 10% of the overall degradation during the soil passage. The removal rates of DOC were very similar for the four scenarios, despite the different input concentrations. Higher input DOC concentration (scenarios 90:360 min) reduced the degradation efficiency only by around 5% compared to lower input concentrations. However, scenario 1.1 (60:100 min) did not sustain constant DO regeneration over time. Thus, it showed a tendency of decreasing DOC removal, namely a reduction of DOC removal from 42% to 33% in Port 3 (0.75 m) over the course of the scenario, which ran for about 14 days (Supplementary Figure S3). Scenarios 1.3 and 2.2 both sustained constant DOC removal over time. Some scenarios (i.e., 4 and 5) were run with long infiltration phases of 3 or 2 days, respectively. It can be assumed that DOC removal during those 2–3 days decreased, when DO levels reached down to 0 mg/L. However, DO levels regenerated completely in the following 5 days of drying, allowing for a constantly high DOC removal at the beginning of each infiltration phase.
Ammonium was always removed within the first meter of the soil for all scenarios, as the input TWW had very low ammonium levels. During nitrification of ammonium, nitrate was evolved, which can be seen by the increasing nitrate levels in the first meter of the column (Figure 3). Afterward, nitrate concentrations stayed relatively constant.
3.2. CEC Concentrations in Analyzed TWW
Nine TWW samples, taken throughout the course of one year, were analyzed regarding the initial CEC concentrations. Some CECs, such as 4-formylaminoantipyrin, irbesartan, primidone, sulfamethoxazole and venlafaxine, showed very constant input concentrations with little variation (Table 5). The biggest variations were detected for the triazole benzotriazole (range 13.8 µg/L), the lifestyle acesulfame (range 8 µg/L) and contrast media agent iopamidol (range 6.7 µg/L) (Table 5).
The highest average concentrations in the TWW were found for the metabolite oxypurinol, the triazoles benzotriazole and 4-methylbenzotriazole, and the antiepileptic gabapentin, being 13 µg/L, 12.7 µg/L, 9.9 µg/L and 10.4 µg/L, respectively. Somewhat lower concentrations (~2–5 µg/L) were also found for the contrast media agents amidotrizoic acid, iomeprol and iopamidol; the cardiovascular drugs metoprolol and hydrochlorothiazide; the anti-inflammatory drug diclofenac and the metabolite 4-formylaminoantipyrin; the angiotensin agents valsartan and candesartan; and acesulfame. The remaining substances were found at levels usually lower than 1 µg/L (Table 5).
These values of WW effluents are similar to those reported in a study in the WWTP of Dresden, Germany [44], and compare well to those reported in the literature [45,46,47,48]. Gurke et al. [44] took samples of the effluent of Dresden WWTP (Germany) for the analysis of pharmaceuticals in January and February 2015, reporting similar mean levels of sulfamethoxazole (0.21 µg/L), carbamazepine (1.61 µg/L) and primidone (0.67 µg/L), among other pharmaceuticals. Concerning the triazoles, owing to their incomplete removal, median values of 7–18 µg/L for benzotriazole and of 0.8–5.1 µg/L for the isomers of methylbenzotriazole were found in the effluents of four WWTPs in Berlin (Germany) [45]. Similarly, Castronvo et al. [48] reported concentrations ranging from 0.97 to 19 µg/L for acesulfame in the effluents of thirteen municipal WWTPs located in Germany and Switzerland.
A wide range of CECs were easily removable during SAT, namely 4-formylaminoantipyrin, acetylsulfamethoxazole, atenolol, bezafibrate, diclofenac, gabapentin, gabapentin-lactan, iomeprol, metropolol and valsartan (Figure 4). Table 5 depicts that the outflow concentration of these 11 substances was below the detection level. Their removal rates reach close to 1 for all applicable scenarios. 5-methylbenzotriazole, acesulfame, iohexol, iopromide and irbesartan were also removed efficiently with average removal rates of above 0.8 and show little variation throughout the different scenarios conducted (Figure 4). The low standard deviation of their outflow concentrations confirms the consistency of their removal (Table 5).
The results suggest that these substances do not react to smaller or bigger changes in the drying time and, thus, are relatively insensitive to DO changes. Previous studies demonstrated that the aforementioned CECs can be eliminated from bank filtration or SAT sites mainly by aerobic microbial processes [23,49,50] but also under suboxic, anoxic and anaerobic conditions [51]. For example, high removals of 80–90% were reported for diclofenac in aerobic and nitrate-reducing conditions and also for iopromide under aerobic (94%) and manganese-reducing conditions (99%) in bank filtration studies [50]. Similarly, Schmidt et al. [51] studied the natural attenuation of selected CECs in riverbank filtration sites with different redox conditions along the rivers Rhine (aerobic-denitrifying conditions), Elbe (denitrifying conditions) and Ruhr (strictly aerobic). These authors reported high removal efficiencies (>80%) for atenolol, bezafibrate, diclofenac, ibuprofen, iohexol, iomeprol, iopromide and metoprolol regardless of the redox conditions. As a result, these CECs are removed under a wide range of DO concentrations or even the absence of DO, and thus, their high removal rates do not seem to be dependent on the redox conditions.
The CECs showing moderate removal efficiency were 4-methylbenzotriazole, amidotrizoic acid, benzotriazole, hydrochlorothiazide, iopamidol, sulfamethoxazole and venlafaxine (Figure 4). These substances, particularly amidotrizoic acid and benzotriazole, showed a large variety of removal efficiencies from no removal to almost complete removal during soil passage. In previous studies, a wide range of removal rates was reported for benzotriazole, with removals ranging from 75–99% in bank filtration sites in Northern India [52] and Berlin (Germany) [45] to poor removals in long-term column experiments with natural sediment cores from the bank of Lake Tegel and the Saatwinkel SAT site in Berlin (Germany) [23]. Similarly, a vast array of removal efficiencies was found for amidotrizoic acid in bank filtration sites in Germany ranging from up to 25% in anaerobic and suboxic conditions to more than 80% in aerobic conditions [51].
Finally, low removal rates could be detected for oxypurinol, carbamazepine and primidone, which showed almost no removal during SAT. Carbamazepine especially showed negative removal rates in some scenarios and high removal variability. A plausible explanation for this observation might be that, although limited, the removal of carbamazepine is associated more with sorption processes than with biodegradation [53,54]. Thus, the subsequent desorption might contribute to an increase in the concentration of carbamazepine measured at the column outflow. Candesartan had a removal rate below 0.3 as well, but the range of removal varied over the different scenarios conducted. These results are consistent with the low removal rates reported in the scientific literature for other SAT systems at the laboratory scale [39,49] and field scale [19,55,56]. For example, at laboratory scale, He et al. [39] reported that primidone and carbamazepine were poorly removed in a soil batch-treatment experiment to simulate their biodegradation in SAT. Similar results were reported at a field scale by Laws et al. [56], who studied the fate and transport of selected CECs during a surface-spreading aquifer recharge operation (Los Angeles, California). The authors found that primidone and carbamazepine were poorly removed (<10%) in the upper aquifer, but attenuation increased with a travel time of 60 days, especially if the recharged water was diluted with native groundwater. Hermes et al. [55] reported low removal rates of carbamazepine and candesartan and low–medium removal (20–40%) for oxypurinol in a full-scale SAT site located in a small town (1000 inhabitants) in the Costa Brava (Spain). In fact, carbamazepine, primidone and, more recently, oxypurinol have proven to be promising WW markers in the environment [57,58,59].
3.3. Potential Removal Processes Affecting CECs
Sorption is one of the most important processes that might control the attenuation of CECs, which is characterized by the factor Kd. The estimated Kd values, expressed as log Kd for the evaluated CECs, are shown in Table 4. For the CECs, log Kd values range from −2.71 for the metabolite oxypurinol to −0.99 for the angiotensin agent irbesartan, and thus, sorption is likely to be a minor removal process of these contaminants. It is important to mention that the calculated Kd derived from Koc can lead to the underestimation of the sorption capacity of CECs, particularly for cationic substances, since other sorption processes such as surface complexation and hydrogen bonding are not considered in this evaluation [60]. However, a soil sample taken from the upper 25 cm of the column was analyzed regarding CEC sorption and bezafibrate, carbamazepine, diclofenac, metoprolol and sulfamethoxazole were found to be below the detection level of 10 µg/kg. Moreover, another soil sample of the bottom section of the column was analyzed after all scenarios had been conducted regarding CEC sorption. Atenolol, bezafibrate, carbamazepine, diclofenac, ibuprofen, metoprolol, candesartan, irbesartan, valsartan, amidotrizoic acid, venlafaxine and oxypurinol were all found to be below the detection level of 10 µg/kg. Thus, the absence of these CECs in these two soil samples corroborates the low sorption capacity of these substances in the soil column.
Biodegradation, therefore, might be the main contributor to the attenuation of CECs in the studied SAT system. The DO decrease, especially up to 2–3 m depth, is an indicator for aerobic respiration, and the oxic condition prevailed in the whole column in the different scenarios conducted (Figure 2). Thus, it might contribute to the removal of selected CECs by microbial degradation. Previous studies that aimed to evaluate the natural attenuation process affecting selected CECs during soil passage in the laboratory- [23,32,61,62] and field-scale [50,51,63,64] experiments also found microbial degradation to be a main driver of CEC removal. At the lab scale, Silver et al. [32] investigated the fate of diclofenac and carbamazepine under different infiltration conditions (e.g., continuous infiltration and wetting and drying cycles) for managed aquifer recharge by means of a mass balance. The authors concluded that close to half of the mass of diclofenac was degraded with wetting and drying cycles, likely due to oxidizing conditions present during drying periods, but no significant degradation occurred for continuous infiltration. Moreover, sorption partly contributed to diclofenac removal (32% of infiltrated mass), and sorption was the main attenuation process for carbamazepine (up to 92% of the infiltrated mass). Bertelkamp et al. [61] reported biodegradation rates (μ) between 0.68 day−1 and 2.60 day−1 for metoprolol, diclofenac and sulfamethoxazole in oxic conditions, and a 90% removal can be expected for them after 1.3–7.1 days residence time in the soil. Similarly, Bertelkamp et al. [62], who investigated the sorption and biodegradation of selected CECs during riverbank filtration through column study, reported that ibuprofen and metoprolol were found to be biodegradable with μ of 15.8 day−1 and 1.4 day−1 under oxic conditions, but carbamazepine, hydrochlorothiazide and sulfamethoxazole did not. Moreover, sorption was found to be negligible as retardation factors (R) for most substances were close to 1, except for metoprolol with R equal to 3.1. At field conditions, Nham et al. [63] investigated the processes that undergo some pharmaceuticals during SAT by means of numerical modeling. These authors observed no retardation (i.e., no sorption) for the contrast media agents iohexol, iomeprol, iopamidol and iopromide. They were degraded, however, with iomeprol and iopromide having the highest attenuation (μ equal to 0.404 day−1 and 0.44 day−1, respectively). Dimkić et al. [64] modeled the sorption and degradation processes of selected pharmaceuticals, including carbamazepine, of Belgrade groundwater source (Serbia), but sorption of carbamazepine was low and it did not undergo degradation.
3.4. Influence of HLCs on CEC Removal
Contrary to the differences shown in DO concentration for the different scenarios (Figure 2), some of the CECs shown in Figure 5 displayed no sensitivity towards these changes and were completely degraded in all cases. For bezafibrate and iopromide, these profiles confirm their good attenuation in the soil under the different HLCs and DO levels. The attenuation of bezafibrate occurred immediately, and similar behavior was detected for 4-formylaminoantipyrin, acetylsulfamethoxazole, atenolol, iomeprol and valsartan. Iopromide was attenuated within the first meter of the unsaturated zone independently of the HLC length. Other substances that were removed within the first two meters of soil passage include diclofenac, ibuprofen, iohexol, gabapentin-lactan and metoprolol.
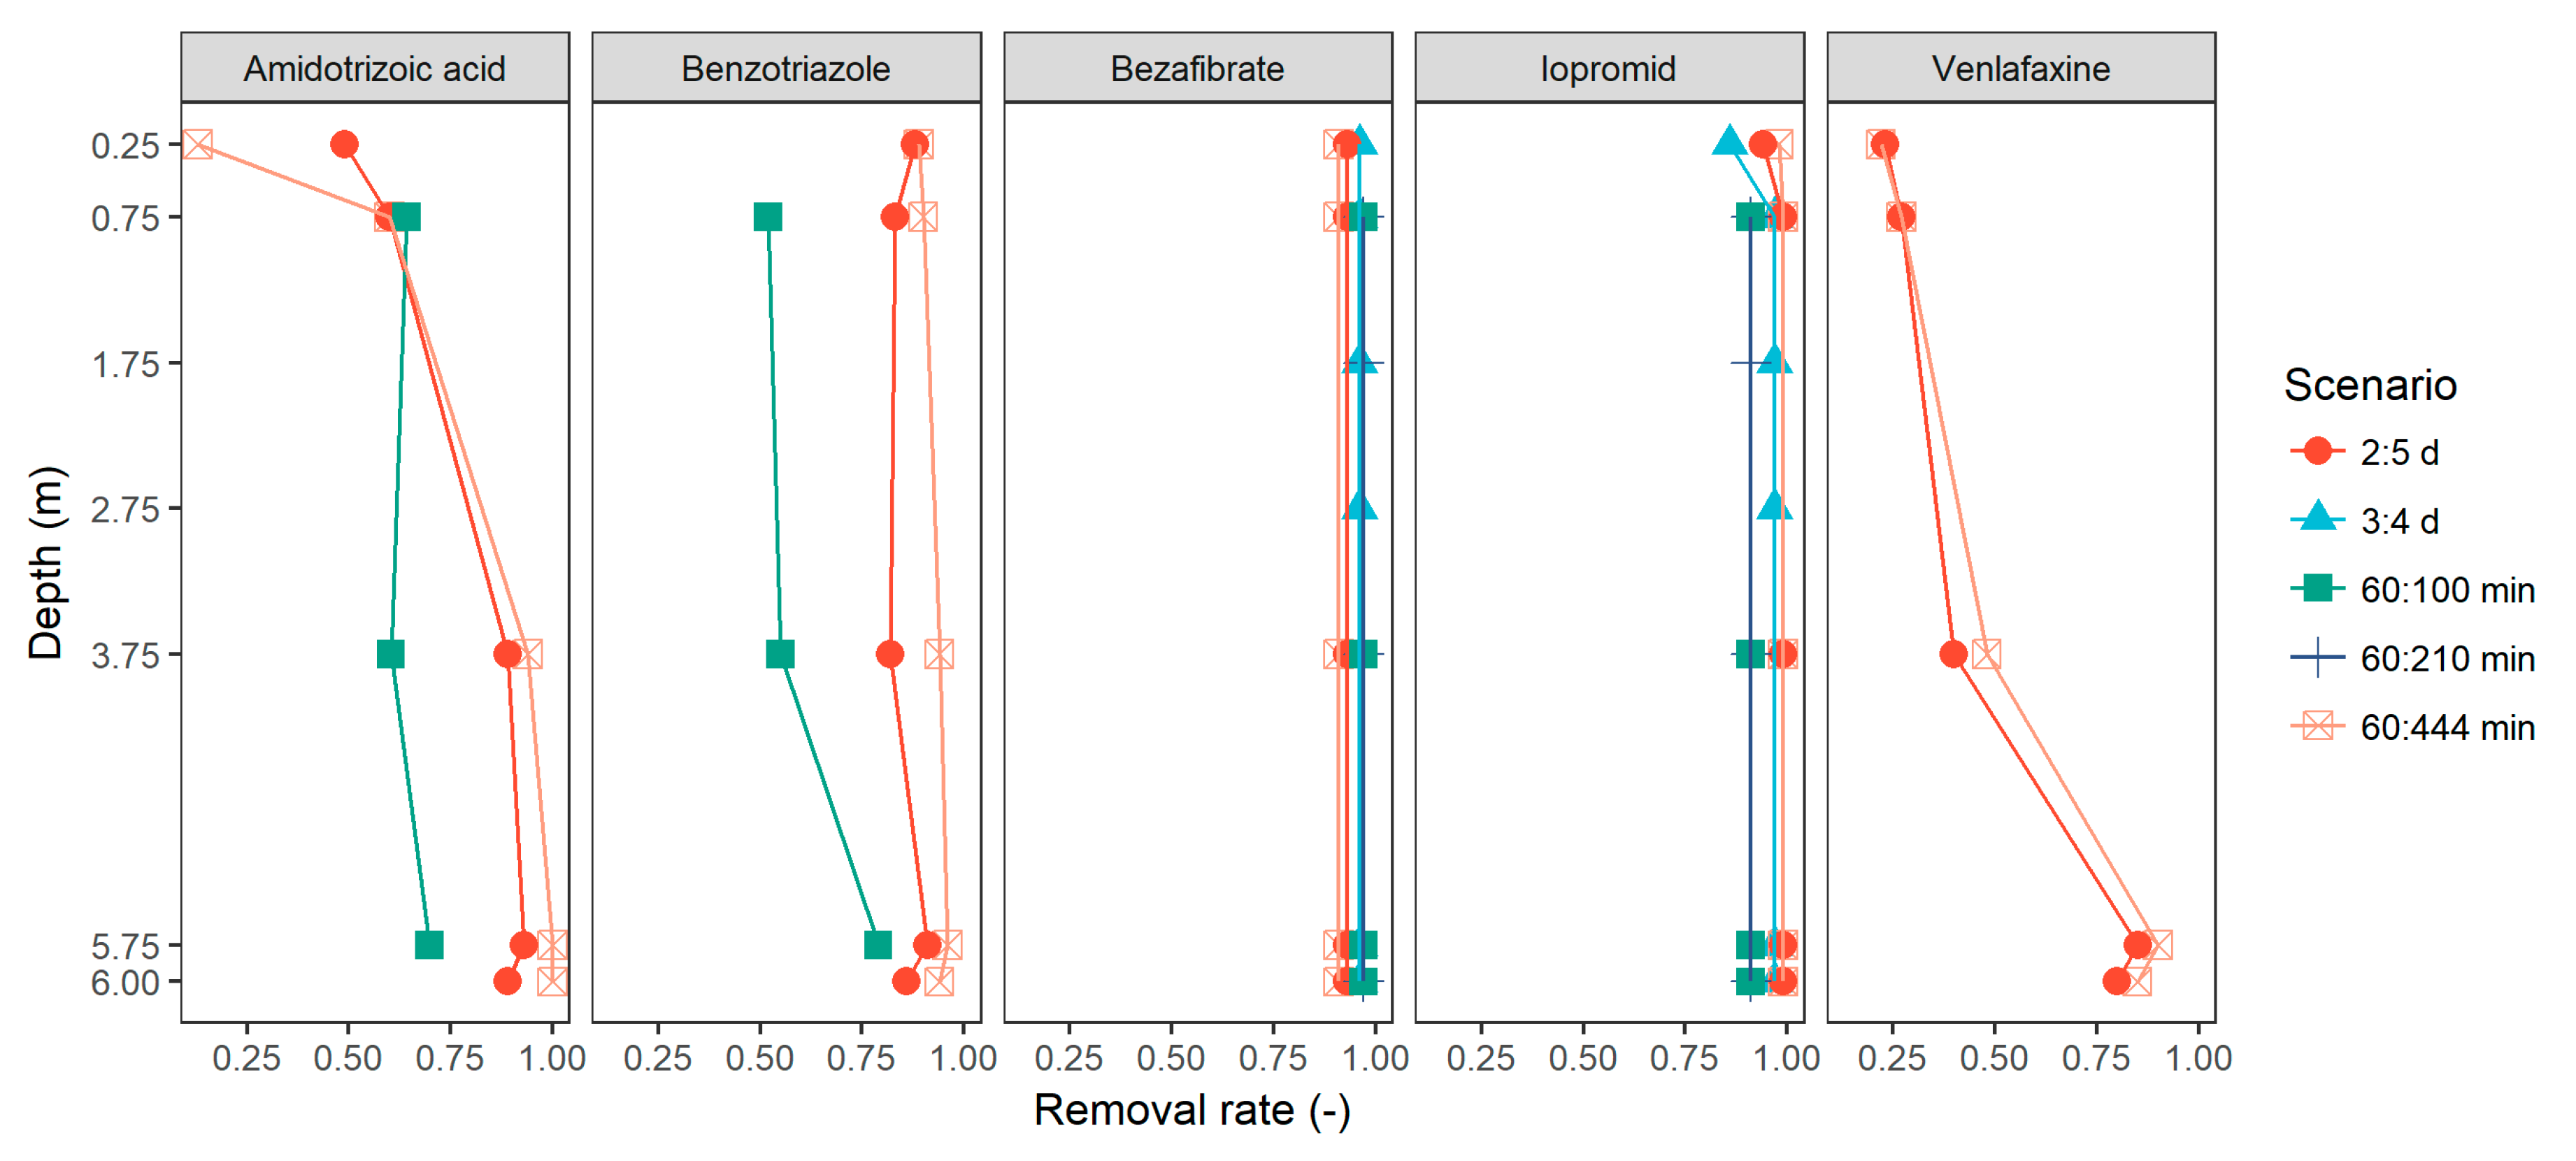
Venlafaxine removal shows that the substance was attenuated over the whole 6 m of the soil column. Since the substance was only measured for two scenarios, no sensitivity towards HLCs becomes apparent. Amidotrizoic acid and benzotriazole measurements, however, indicate a tendency for poorer removal with shorter drying times. Amidotrizoic acid was removed up to 90% within the first 4 m of the column for the scenarios with longer drying times (2:5 day and 60:444 min). For the scenario run with the 60:100 min HLC, removal decreased to 70%, showing high removal in the uppermost layer but almost no further removal in the lower soil layers. Similarly, benzotriazole was removed less efficiently in the scenario with the drying time of 100 min compared to the other two scenarios. Removal decreased from 95% to 80%.
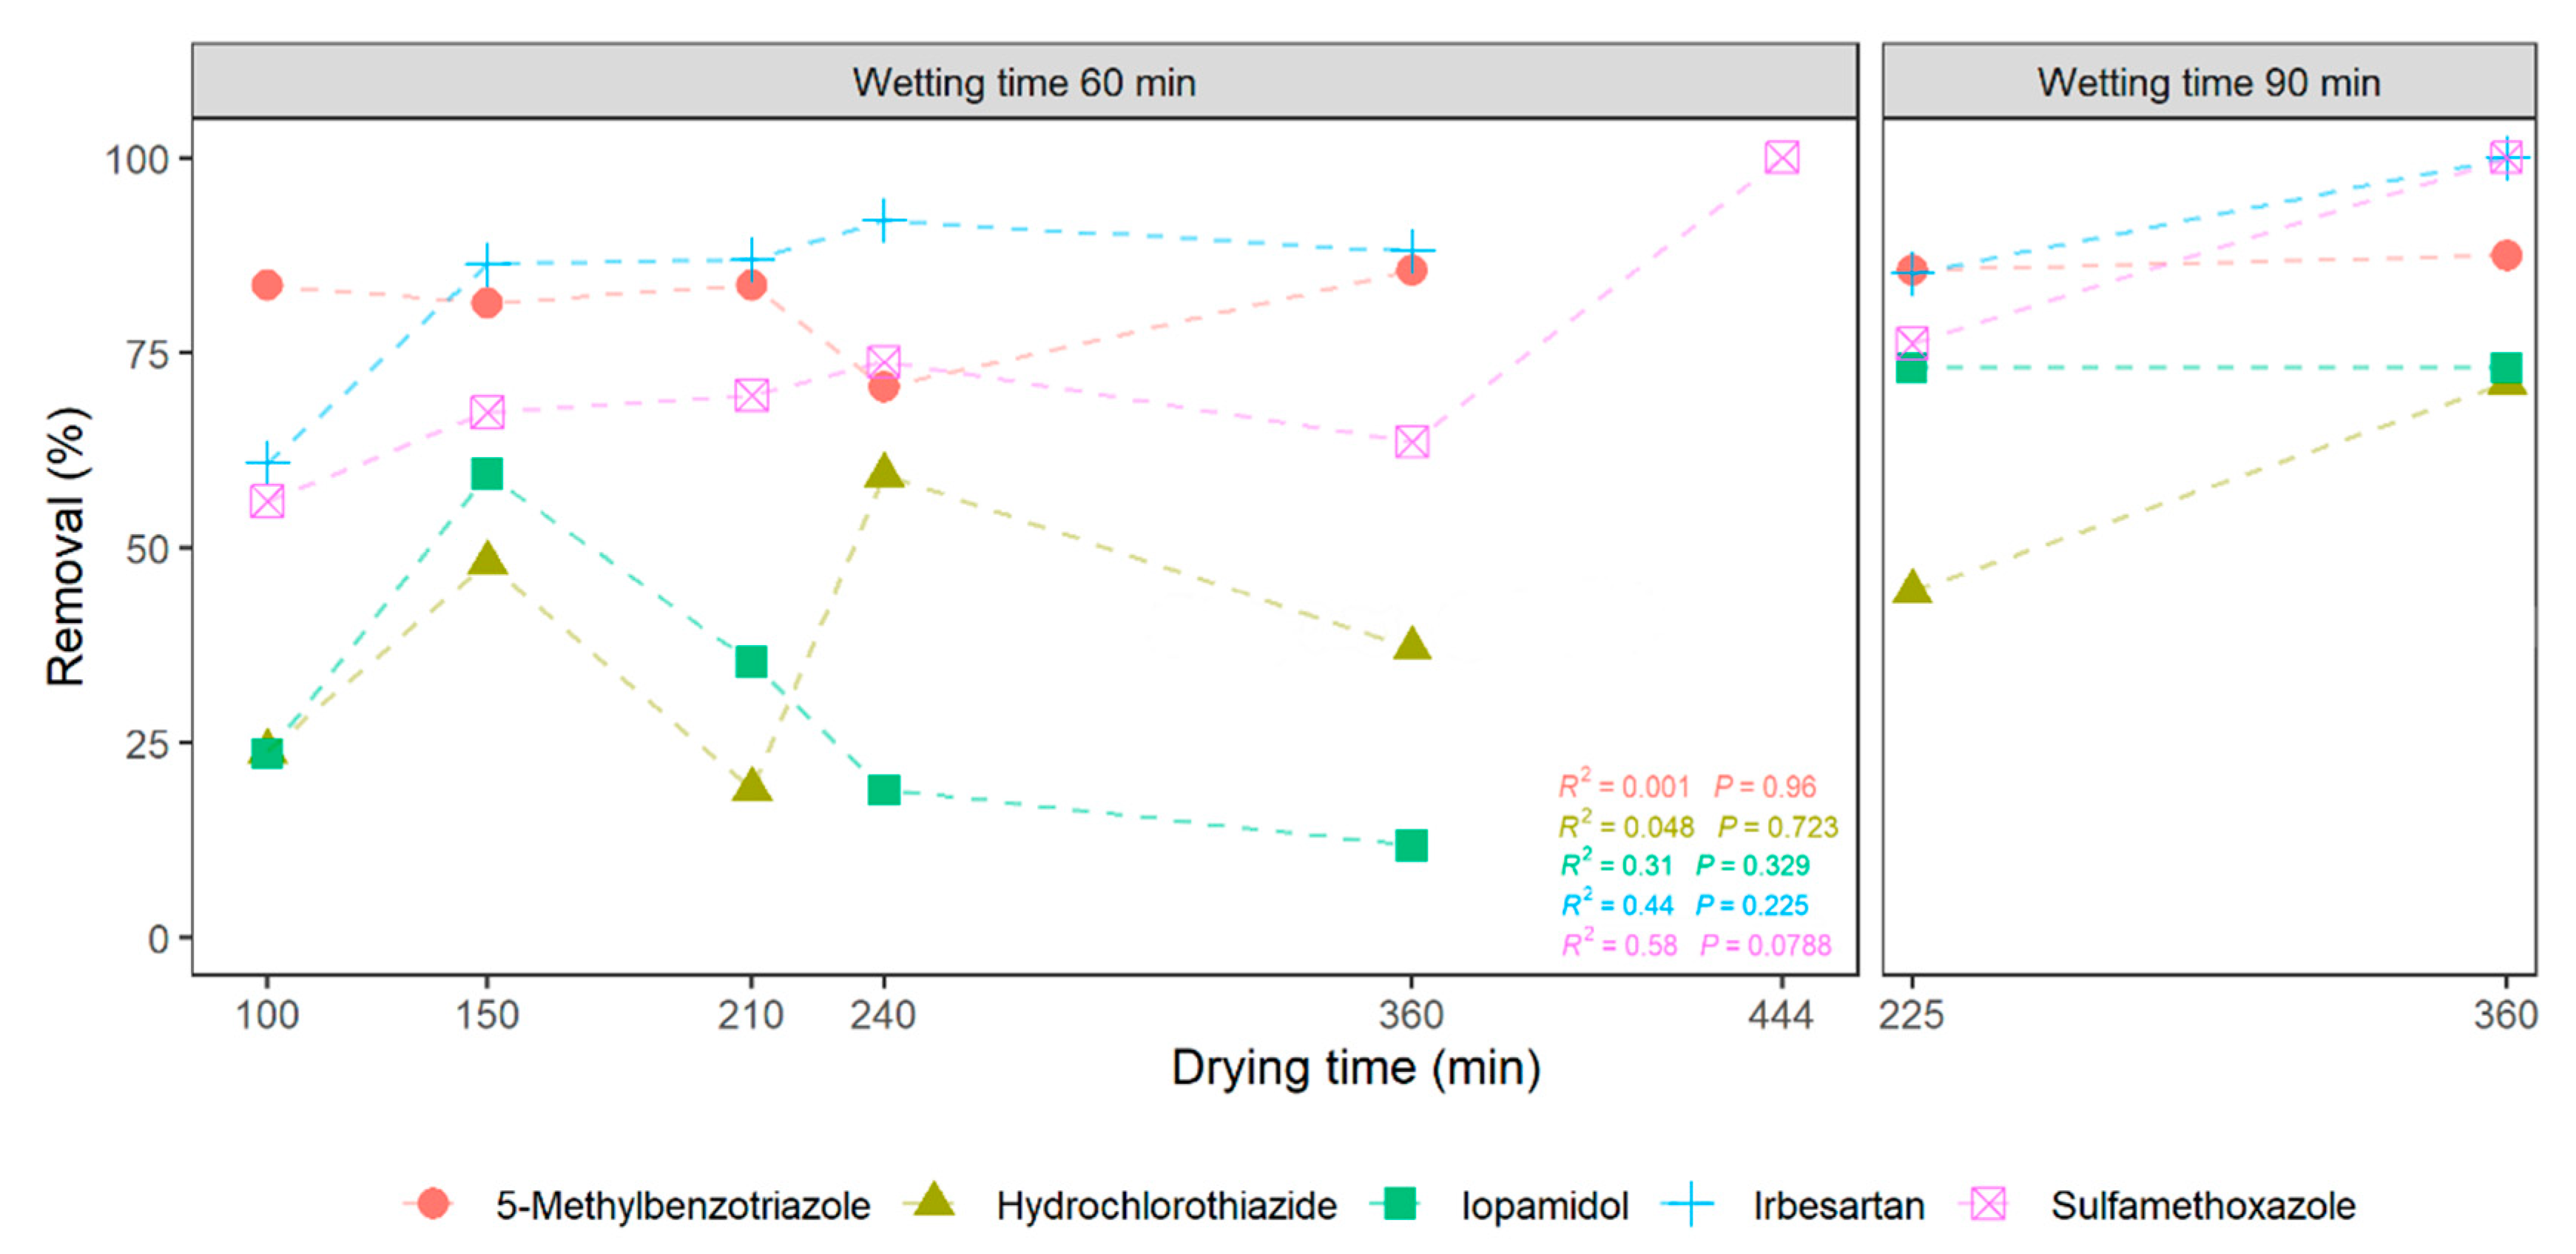
The substances 5-methylbenzotriazole, irbesartan and sulfamethoxazole showed medium to high removal rates during SAT, with relatively little variation between the different scenarios but a tendency for removal increase with longer drying times (Figure 6). None of the substances showed a statistically meaningful trend, though. For sulfamethoxazole, the removal increased from 56% for scenario 1.1 with a drying time of 100 min to 95% for scenario 1.6 with 444 min drying time. Scenario 2.1 (wetting:drying ratio 90:225 min) and 2.2 (wetting:drying ratio 90:360 min) confirm that the smaller wet–dry ratio increases the removal efficiency. Similarly, there was an increase in irbesartan removal from a drying time of 100 min (60% removal) to drying times of 150 min a larger (86−92% removal). This increase is also confirmed by comparing results from scenario 2.1 (85% removal) to scenario 2.2 (96% removal). For 5-methylbenzotriazole, the removal efficiency stayed consistently high between 80–90%, not showing a tendency to increase or decrease with varying HLCs.
Hydrochlorothiazide displayed similar behavior, with a removal increase for scenarios 1.1, 1.2 and 1.4 as well as 2.1 and 2.2, but the scenarios 1.3 and 1.5 do not support the trend with decreasing removal efficiencies. However, the actual outflow concentrations for all scenarios ranged between 1.1 and 1.7 µg/L, so the absolute variations were at a low level. Iopamidol is removed with varying rates from 0.12 to 0.73. No connection to HLCs and DO levels became apparent.
4-methylbenzotriazole, amidotrizoic acid, benzotriazole and candesartan displayed a larger variety of removal rates in comparison to the substances shown in Figure 6 but also some more distinct dependency on HLCs (Figure 7). Benzotriazole and amidotrizoic acid removal efficiencies depict statistically meaningful trends. Amidotrizoic acid removal increased strongly for HLC ratios smaller than 1:4 (scenarios 1.4 and 1.6) from 11% removal to 96%. Benzotriazole removal increased strongly for HLC ratio 1:6 (scenario 1.6) from 9% to 94%. Amidotrizoic acid and benzotriazole indicate that DO thresholds could be valid for different CECs that can only be reached with set HLC ratios. Scenarios 2.1 and 2.2 confirm the removal increase with larger drying times. Candesartan removal increased to moderate levels with longer drying times, namely from 6% to 41% for scenarios 1.1 to 1.5 and 18% to 55% for scenarios 2.1 to 2.2.
4-methylbenzotriazole showed a strong tendency of removal increase for scenarios 1.1, 1.2 and 1.4 and for the scenarios 2.1 and 2.2, but scenarios 1.3 and 1.5 do not support the trend. This could be caused by the overall high variability of this CEC in the TWW with input concentration ranging from 7 µg/L to 12 µg/L. Both scenarios 1.3 and 1.5 had outflow concentrations larger than 8 µg/L, whereas for some scenarios (e.g., 1.1 and 1.2), the inflow concentration was 7.1 µg/L lower than that. This might have caused some bigger variations in the removal efficiency.
All the trends of CEC removal are only an indication of their behavior under different HLCs. Thresholds of optimal oxygen supply might be applicable for some substances, but a closer analysis would require finer datasets, particularly for scenarios with stronger oxygen reduction. Experiments would have to be repeated varying other parameters, such as soil type or TWW composition to better understand the influence of other boundary conditions. Thus, this study gives a first overview of which substances merit further research, but to make the results applicable, further and more detailed studies are needed.
4. Conclusions
The influence of the hydraulic operation of SAT systems on the fate of 27 CECs was shown during infiltration experiments into a 6 m long soil column. For a wide range of substances (16 substances, compare Figure 4), efficient compound removal during SAT was demonstrated under various hydraulic operational modes. These substances were relatively insensitive to emerging changes in DO levels in the unsaturated zone. Thus, the removal potential for these substances during SAT can be described as very high for the shown DO levels. Contrastingly, primidone, oxypurinol, carbamazepine and candesartan showed poor removal efficiencies during SAT regardless of the hydraulic operation.
Other substances, particularly 4-methylbenzotriazole, amidotrizoic acid, benzotriazole, candesartan, hydrochlorothiazide, irbesartan and sulfamethoxazole showed indicative tendencies of increasing removal rates with prolonged drying times during SAT operation. Removal of amidotrizoic acid and benzotriazole increased by 85%, hydrochlorothiazide removal by 35%, and 4-methylbenzotriazole and sulfamethoxazole removal by 57% and 39%, respectively, when the drying cycle was changed from 100 to 444 min.
Many SAT facilities are currently run with infiltration phases of more than one day, with the consequence of temporary DO depletion in the vadose zone. Shifting the HLCs to shorter, more frequent cycles would allow for better DO recovery during SAT and more constant DO levels. This could be a promising solution for increasing the removal efficiency of SAT systems concerning CECs.
Supplementary Materials
The following are available online at https://www.mdpi.com/2073-4441/12/9/2627/s1. Figure S1: Depth profiles of DO (mg/L) for additional scenarios separated into wet phase (infiltration) and dry phase (no infiltration). Values are maximum DO during the dry phase and minimum DO during the wet phase averaged over ten infiltration cycles. Range of values is indicated by error bars. Figure S2: Development of DO concentration (mg/L) for three chosen scenarios over the course of 12 days in 0.25 m, 0.75 m and 3.75 m depth. Figure S3: Development of DOC concentration (mg/L) for three chosen scenarios over the course of 11 infiltration cycles in 0.75 m, 3.75 m and 6 m depth.
Author Contributions
Conceptualization, J.S., F.B. and J.F.; methodology, J.S., F.B. and J.F.; formal analysis, J.S. and A.J.; investigation, J.S., F.B. and J.F.; data curation, J.S. and F.B.; writing—original draft preparation, J.S. and A.J.; writing—review and editing, F.B. and J.F.; visualization, J.S. All authors have read and agreed to the published version of the manuscript.
Funding
This work is financed within the framework of the German—Israeli Water Technology Cooperation Program under project numbers 02WA1148 and WT1601/2689 by the German Federal Ministry of Education and Research (BMBF) and the Israeli Ministry of Science, Technology and Space (MOST). A.J. gratefully acknowledges the financial support from the Excellence Initiative of the German Federal and State Governments through the “Open Topic Postdoc Position” Fellow at the Technische Universität Dresden. APCs were funded by open access funding by the Publication Funds of the TU Dresden.
Acknowledgments
We acknowledge the support of the laboratories at the Institute of Waste Management and Circular Economy and the Institute of Water Chemistry at the TU Dresden as well as the laboratory at DVGW-Technologiezentrum Wasser in Karlsruhe. The authors further acknowledge the contributions of Sophie Geyer, Paula Görz and Shahram Shirdast in conducting some of the experiments of this study.
Conflicts of Interest
The authors declare no conflict of interest. The funders had no role in the design of the study; in the collection, analyses, or interpretation of data; in the writing of the manuscript, or in the decision to publish the results.
References
- UN Water. Sustainable Development Goal 6: Synthesis Report 2018 on Water and Sanitation; United Nations Publications; United Nations: New York, NY, USA, 2018; ISBN 978-92-1-101370-2. [Google Scholar]
- Boretti, A.; Rosa, L. Reassessing the projections of the World Water Development Report. NPJ Clean Water 2019, 2, 1–6. [Google Scholar] [CrossRef]
- Hussain, I.; Hanjra, M.A. Does irrigation water matter for rural poverty alleviation? Evidence from South and South-East Asia. Water Policy 2003, 5, 429–442. [Google Scholar] [CrossRef]
- Green, T.R.; Taniguchi, M.; Kooi, H.; Gurdak, J.J.; Allen, D.M.; Hiscock, K.M.; Treidel, H.; Aureli, A. Beneath the surface of global change: Impacts of climate change on groundwater. J. Hydrol. 2011, 405, 532–560. [Google Scholar] [CrossRef] [Green Version]
- Lobell, D.B.; Burke, M.B.; Tebaldi, C.; Mastrandrea, M.D.; Falcon, W.P.; Naylor, R.L. Prioritizing Climate Change Adaptation Needs for Food Security in 2030. Science 2008, 319, 607–610. [Google Scholar] [CrossRef]
- Flörke, M.; Kynast, E.; Bärlund, I.; Eisner, S.; Wimmer, F.; Alcamo, J. Domestic and industrial water uses of the past 60 years as a mirror of socio-economic development: A global simulation study. Glob. Environ. Chang. 2013, 23, 144–156. [Google Scholar] [CrossRef]
- Icekson-Tal, N.; Michail, M.; Avraham, O.; Sherer, D.; Shoham, G. Dan Region Reclamation Project: Groundwater Recharge with Municipal Effluent, Recharge Basins Soreq, Yavne 1, Yavne 2 and Yavne 3; Mekorot Water Co. Ltd.: Dan Region Unit, Ramla, Israel, 2011. [Google Scholar]
- Water Reuse Europe. Water Reuse Europe Review 2018; Water Reuse Europe: Bedford, UK, 2018. [Google Scholar]
- European Commission. Regulation (EU) 2020/741 of the European Parliament and of the Council of 25 May 2020 on minimum requirements for water reuse. Off. J. Eur. Union 2020, L 177/63, 32–55. [Google Scholar]
- Cannavo, P.; Richaume, A.; Lafolie, F. Fate of nitrogen and carbon in the vadose zone: In situ and laboratory measurements of seasonal variations in aerobic respiratory and denitrifying activities. Soil Biol. Biochem. 2004, 36, 463–478. [Google Scholar] [CrossRef]
- Sharma, S.K.; Kennedy, M.D. Soil aquifer treatment for wastewater treatment and reuse. Int. Biodeterior. Biodegrad. 2017, 119, 671–677. [Google Scholar] [CrossRef]
- Drewes, J.E.; Heberer, T.; Rauch, T.; Reddersen, K. Fate of Pharmaceuticals During Ground Water Recharge. Groundw. Monit. Remediat. 2003, 23, 64–72. [Google Scholar] [CrossRef]
- Takabe, Y.; Kameda, I.; Suzuki, R.; Nishimura, F.; Kusuda, Y.; Phattarapattamawong, S.; Itoh, S. Evaluation of Dissolved Organic Matter Removals through WWT and SAT Using Pilot-Scale and Lab-Scale Reactors. Water Air Soil Pollut. 2019, 230, 127. [Google Scholar] [CrossRef]
- Lapworth, D.J.; Baran, N.; Stuart, M.E.; Ward, R.S. Emerging organic contaminants in groundwater: A review of sources, fate and occurrence. Environ. Pollut. 2012, 163, 287–303. [Google Scholar] [CrossRef] [PubMed] [Green Version]
- Rojas, M.R.; Leung, C.; Bonk, F.; Zhu, Y.; Edwards, L.; Arnold, R.G.; Sáez, A.E.; Klečka, G. Assessment of the Effectiveness of Secondary Wastewater Treatment Technologies to Remove Trace Chemicals of Emerging Concern. Crit. Rev. Environ. Sci. Technol. 2013, 43, 1281–1314. [Google Scholar] [CrossRef]
- Taheran, M.; Naghdi, M.; Brar, S.K.; Verma, M.; Surampalli, R.Y. Emerging contaminants: Here today, there tomorrow! Environ. Nanotechnol. Monit. Manag. 2018, 10, 122–126. [Google Scholar] [CrossRef]
- Arnold, K.E.; Brown, A.R.; Ankley, G.T.; Sumpter, J.P. Medicating the environment: Assessing risks of pharmaceuticals to wildlife and ecosystems. Phil. Trans. R. Soc. B 2014, 369. [Google Scholar] [CrossRef] [Green Version]
- Fahrenfeld, N.; Ma, Y.; O’Brien, M.; Pruden, A. Reclaimed water as a reservoir of antibiotic resistance genes: Distribution system and irrigation implications. Front. Microbiol. 2013, 4. [Google Scholar] [CrossRef] [Green Version]
- Amy, G.; Drewes, J. Soil Aquifer Treatment (SAT) as a Natural and Sustainable Wastewater Reclamation/Reuse Technology: Fate of Wastewater Effluent Organic Matter (EfOM) and Trace Organic Compounds. Environ. Monit Assess 2007, 129, 19–26. [Google Scholar] [CrossRef] [PubMed]
- Ternes, T.A.; Bonerz, M.; Herrmann, N.; Teiser, B.; Andersen, H.R. Irrigation of treated wastewater in Braunschweig, Germany: An option to remove pharmaceuticals and musk fragrances. Chemosphere 2007, 66, 894–904. [Google Scholar] [CrossRef]
- Ma, L.; Liu, Y.; Zhang, J.; Yang, Q.; Li, G.; Zhang, D. Impacts of irrigation water sources and geochemical conditions on vertical distribution of pharmaceutical and personal care products (PPCPs) in the vadose zone soils. Sci. Total Environ. 2018, 626, 1148–1156. [Google Scholar] [CrossRef]
- Rozman, D.; Hrkal, Z.; Váňa, M.; Vymazal, J.; Boukalová, Z. Occurrence of Pharmaceuticals in Wastewater and Their Interaction with Shallow Aquifers: A Case Study of Horní Beřkovice, Czech Republic. Water 2017, 9, 218. [Google Scholar] [CrossRef]
- Filter, J.; Jekel, M.; Ruhl, A. Impacts of Accumulated Particulate Organic Matter on Oxygen Consumption and Organic Micro-Pollutant Elimination in Bank Filtration and Soil Aquifer Treatment. Water 2017, 9, 349. [Google Scholar] [CrossRef] [Green Version]
- Onesios, K.M.; Bouwer, E.J. Biological removal of pharmaceuticals and personal care products during laboratory soil aquifer treatment simulation with different primary substrate concentrations. Water Res. 2012, 46, 2365–2375. [Google Scholar] [CrossRef]
- Phattarapattamawong, S.; Takabe, Y.; Echigo, S.; Itoh, S. Control of disinfection byproduct (DBP) precursors by soil aquifer treatment (SAT): What length of hydraulic retention time (HRT) is necessary? Water Supply 2016, 16, 1648–1658. [Google Scholar] [CrossRef]
- Wei, L.; Qin, K.; Zhao, N.; Noguera, D.R.; Qiu, W.; Zhao, Q.; Kong, X.; Zhang, W.; Kabutey, F.T. Transformation of erythromycin during secondary effluent soil aquifer recharging: Removal contribution and degradation path. J. Environ. Sci. 2017, 51, 173–180. [Google Scholar] [CrossRef] [PubMed]
- Kopchynski, T.; Fox, P.; Alsmadi, B.; Berner, M. The effects of soil type and effluent pre-treatment on soil aquifer treatment. Water Sci. Technol. 1996, 34, 235–242. [Google Scholar] [CrossRef]
- Sopilniak, A.; Elkayam, R.; Lev, O. Nitrification in a soil-aquifer treatment system: Comparison of potential nitrification and concentration profiles in the vadose zone. Environ. Sci. Process. Impacts 2017, 19, 1571–1582. [Google Scholar] [CrossRef] [PubMed]
- Crites, R.W.; Reed, S.C.; Bastian, R. Land Treatment Systems for Municipal and Industrial Wastes; McGraw Hill Professional: New York, NY, USA, 2000. [Google Scholar]
- Elkayam, R.; Sopliniak, A.; Gasser, G.; Pankratov, I.; Lev, O. Oxidizer Demand in the Unsaturated Zone of a Surface-Spreading Soil Aquifer Treatment System. Vadose Zone J. 2015, 14. [Google Scholar] [CrossRef]
- Ben Moshe, S.; Weisbrod, N.; Barquero, F.; Sallwey, J.; Orgad, O.; Furman, A. On the role of operational dynamics in biogeochemical efficiency of a soil aquifer treatment system. Hydrol. Earth Syst. Sci. 2020, 24, 417–426. [Google Scholar] [CrossRef] [Green Version]
- Silver, M.; Selke, S.; Balsaa, P.; Wefer-Roehl, A.; Kübeck, C.; Schüth, C. Fate of five pharmaceuticals under different infiltration conditions for managed aquifer recharge. Sci. Total Environ. 2018, 642, 914–924. [Google Scholar] [CrossRef]
- US EPA. Process Design Manual: Land Treatment of Municipal Wastewater Effluents; U.S. Environmental Protection Agency: Cincinnati, OH, USA, 2006; p. 193.
- Martins, T.; Leitão, T.E.; Carvalho, M.R. Assessment of Wastewater Contaminants Retention for a Soil-aquifer Treatment System Using Soil-column Experiments. Procedia Earth Planet. Sci. 2017, 17, 332–335. [Google Scholar] [CrossRef]
- Fox, P.; Aboshanp, W.; Alsamadi, B. Analysis of soils to demonstrate sustained organic carbon removal during soil aquifer treatment. J. Environ. Qual. 2005, 34, 156–163. [Google Scholar]
- Essandoh, H.M.K.; Tizaoui, C.; Mohamed, M.H.A. Removal of dissolved organic carbon and nitrogen during simulated soil aquifer treatment. Water Res. 2013, 47, 3559–3572. [Google Scholar] [CrossRef]
- DIN Deutsches Institut für Normung e.V. DIN 38407-36:2014-09, Deutsche Einheitsverfahren zur Wasser-, Abwasser- und Schlammuntersuchung_- Gemeinsam erfassbare Stoffgruppen (Gruppe_F)_- Teil_36: Bestimmung ausgewählter Pflanzenschutzmittelwirkstoffe und Anderer Organischer Stoffe in Wasser_- Verfahren Mittels Hochleistungs-Flüssigkeitschromatographie und Massenspektrometrischer Detektion (HPLC-MS/MS bzw. -HRMS) nach Direktinjektion_(F_36); Beuth Verlag GmbH: Berlin, Germany, 2014. [Google Scholar]
- Stadtentwässerung Dresden Die Kläranlage Dresden-Kaditz 2018. Available online: https://www.stadtentwaesserung-dresden.de/fileadmin/user_upload/downloads/faltblaetter-broschueren/klaeranlage-dresden-kaditz.pdf (accessed on 19 September 2020).
- He, K.; Asada, Y.; Echigo, S.; Itoh, S. Biodegradation of pharmaceuticals and personal care products in the sequential combination of activated sludge treatment and soil aquifer treatment. Environ. Technol. 2020, 41, 378–388. [Google Scholar] [CrossRef]
- Krupka, K.; Kaplan, D.; Whelan, G.; Serne, R.; Mattigod, S. Understanding Variation in Partition Coefficient, Kd, Values. Volume 1: The Kd Model, Methods of Measurement, and Application of Chemical Reaction Codes; Environmental Protection Agency: Washington, DC, USA, 1999. [Google Scholar]
- Wells, M.J. Log DOW: Key to understanding and regulating wastewater-derived contaminants. Environ. Chem. 2007, 3, 439–449. [Google Scholar] [CrossRef]
- Schaffer, M.; Boxberger, N.; Börnick, H.; Licha, T.; Worch, E. Sorption influenced transport of ionizable pharmaceuticals onto a natural sandy aquifer sediment at different pH. Chemosphere 2012, 87, 513–520. [Google Scholar] [CrossRef] [PubMed]
- Sabljić, A.; Güsten, H.; Verhaar, H.; Hermens, J. QSAR modelling of soil sorption. Improvements and systematics of log KOC vs. log KOW correlations. Chemosphere 1995, 31, 4489–4514. [Google Scholar] [CrossRef]
- Gurke, R.; Rößler, M.; Marx, C.; Diamond, S.; Schubert, S.; Oertel, R.; Fauler, J. Occurrence and removal of frequently prescribed pharmaceuticals and corresponding metabolites in wastewater of a sewage treatment plant. Sci. Total Environ. 2015, 532, 762–770. [Google Scholar] [CrossRef] [PubMed]
- Reemtsma, T.; Miehe, U.; Duennbier, U.; Jekel, M. Polar pollutants in municipal wastewater and the water cycle: Occurrence and removal of benzotriazoles. Water Res. 2010, 44, 596–604. [Google Scholar] [CrossRef]
- Loos, R.; Carvalho, R.; António, D.C.; Comero, S.; Locoro, G.; Tavazzi, S.; Paracchini, B.; Ghiani, M.; Lettieri, T.; Blaha, L.; et al. EU-wide monitoring survey on emerging polar organic contaminants in wastewater treatment plant effluents. Water Res. 2013, 47, 6475–6487. [Google Scholar] [CrossRef]
- Molins-Delgado, D.; Silvia Díaz-Cruz, M.; Barceló, D. Removal of polar UV stabilizers in biological wastewater treatments and ecotoxicological implications. Chemosphere 2015, 119, S51–S57. [Google Scholar] [CrossRef]
- Castronovo, S.; Wick, A.; Scheurer, M.; Nödler, K.; Schulz, M.; Ternes, T.A. Biodegradation of the artificial sweetener acesulfame in biological wastewater treatment and sandfilters. Water Res. 2017, 110, 342–353. [Google Scholar] [CrossRef]
- He, K.; Echigo, S.; Itoh, S. Effect of operating conditions in soil aquifer treatment on the removals of pharmaceuticals and personal care products. Sci. Total Environ. 2016, 565, 672–681. [Google Scholar] [CrossRef] [PubMed] [Green Version]
- Wiese, B.; Massmann, G.; Jekel, M.; Heberer, T.; Dünnbier, U.; Orlikowski, D.; Grützmacher, G. Removal kinetics of organic compounds and sum parameters under field conditions for managed aquifer recharge. Water Res. 2011, 45, 4939–4950. [Google Scholar] [CrossRef] [PubMed] [Green Version]
- Schmidt, C.K.; Lange, F.T.; Brauch, H.-J. Characteristics and evaluation of natural attenuation processes for organic micropollutant removal during riverbank filtration. Water Supply 2007, 7, 1–7. [Google Scholar] [CrossRef]
- Glorian, H.; Börnick, H.; Sandhu, C.; Grischek, T. Water Quality Monitoring in Northern India for an Evaluation of the Efficiency of Bank Filtration Sites. Water 2018, 10, 1804. [Google Scholar] [CrossRef] [Green Version]
- Löffler, D.; Römbke, J.; Meller, M.; Ternes, T.A. Environmental Fate of Pharmaceuticals in Water/Sediment Systems. Environ. Sci. Technol. 2005, 39, 5209–5218. [Google Scholar] [CrossRef]
- Martínez-Hernández, V.; Meffe, R.; Herrera López, S.; de Bustamante, I. The role of sorption and biodegradation in the removal of acetaminophen, carbamazepine, caffeine, naproxen and sulfamethoxazole during soil contact: A kinetics study. Sci. Total Environ. 2016, 559, 232–241. [Google Scholar] [CrossRef]
- Hermes, N.; Jewell, K.S.; Schulz, M.; Müller, J.; Hübner, U.; Wick, A.; Drewes, J.E.; Ternes, T.A. Elucidation of removal processes in sequential biofiltration (SBF) and soil aquifer treatment (SAT) by analysis of a broad range of trace organic chemicals (TOrCs) and their transformation products (TPs). Water Res. 2019, 163, 114857. [Google Scholar] [CrossRef]
- Laws, B.V.; Dickenson, E.R.V.; Johnson, T.A.; Snyder, S.A.; Drewes, J.E. Attenuation of contaminants of emerging concern during surface-spreading aquifer recharge. Sci. Total Environ. 2011, 409, 1087–1094. [Google Scholar] [CrossRef]
- Funke, J.; Prasse, C.; Lütke Eversloh, C.; Ternes, T.A. Oxypurinol—A novel marker for wastewater contamination of the aquatic environment. Water Res. 2015, 74, 257–265. [Google Scholar] [CrossRef]
- McCance, W.; Jones, O.A.H.; Edwards, M.; Surapaneni, A.; Chadalavada, S.; Currell, M. Contaminants of Emerging Concern as novel groundwater tracers for delineating wastewater impacts in urban and peri-urban areas. Water Res. 2018, 146, 118–133. [Google Scholar] [CrossRef]
- Gasser, G.; Rona, M.; Voloshenko, A.; Shelkov, R.; Tal, N.; Pankratov, I.; Elhanany, S.; Lev, O. Quantitative Evaluation of Tracers for Quantification of Wastewater Contamination of Potable Water Sources. Environ. Sci. Technol. 2010, 44, 3919–3925. [Google Scholar] [CrossRef] [PubMed]
- Schaffer, M.; Börnick, H.; Nödler, K.; Licha, T.; Worch, E. Role of cation exchange processes on the sorption influenced transport of cationic β-blockers in aquifer sediments. Water Res. 2012, 46, 5472–5482. [Google Scholar] [CrossRef] [PubMed]
- Bertelkamp, C.; Verliefde, A.R.D.; Schoutteten, K.; Vanhaecke, L.; Vanden Bussche, J.; Singhal, N.; van der Hoek, J.P. The effect of redox conditions and adaptation time on organic micropollutant removal during river bank filtration: A laboratory-scale column study. Sci. Total Environ. 2016, 544, 309–318. [Google Scholar] [CrossRef] [PubMed]
- Bertelkamp, C.; Reungoat, J.; Cornelissen, E.R.; Singhal, N.; Reynisson, J.; Cabo, A.J.; van der Hoek, J.P.; Verliefde, A.R.D. Sorption and biodegradation of organic micropollutants during river bank filtration: A laboratory column study. Water Res. 2014, 52, 231–241. [Google Scholar] [CrossRef]
- Nham, H.T.T.; Greskowiak, J.; Nödler, K.; Rahman, M.A.; Spachos, T.; Rusteberg, B.; Massmann, G.; Sauter, M.; Licha, T. Modeling the transport behavior of 16 emerging organic contaminants during soil aquifer treatment. Sci. Total Environ. 2015, 514, 450–458. [Google Scholar] [CrossRef]
- Dimkic, M.; Kovacevic, S.; Pusic, M.; Dotlic, M. Modeling of sorption and degradation of selected pharmaceuticals: Case study of Belgrade groundwater source. Geol. Balk Poluos 2017, 47–59. [Google Scholar] [CrossRef]
Figure 1.
(a) Setup of 6 m high soil column with location of measuring ports and (b) installation of measuring devices at each port.
Figure 1.
(a) Setup of 6 m high soil column with location of measuring ports and (b) installation of measuring devices at each port.

Figure 2.
Depth profiles of DO (mg/L) along the 6 m soil column for different scenarios separated into wet phase (infiltration) and dry phase (no infiltration). Values are maximum DO during the dry phase and minimum DO during the wet phase averaged over ten infiltration cycles. Range of values is indicated by error bars. Additional scenarios are depicted in Supplementary Figure S1.

Figure 3.
Depth profiles of dissolved organic carbon (DOC) and nitrate (NO3-) concentrations (mg/L) in the 6 m soil column for three different scenarios. Values are averages of six evaluated infiltration cycles per scenario; minimum and maximum values are indicated by error bars.
Figure 3.
Depth profiles of dissolved organic carbon (DOC) and nitrate (NO3-) concentrations (mg/L) in the 6 m soil column for three different scenarios. Values are averages of six evaluated infiltration cycles per scenario; minimum and maximum values are indicated by error bars.

Figure 4.
Removal rates (-) of CECs for all 11 scenarios conducted. The removal efficiencies are divided into three categories: efficient (>0.8), moderate (0.3–0.8) and poor (<0.3). White dots indicate measured values, and boxplots show median, range, quartiles and outliers (black dots). Values below detection limit (DL) were regarded with DL/2.

Figure 5.
Depth profiles of removal rates (-) for amidotrizoic acid, benzotriazole, bezafibrate, iopromide and venlafaxine along 6 m column for five different scenarios. Values below DL were regarded with DL/2.
Figure 5.
Depth profiles of removal rates (-) for amidotrizoic acid, benzotriazole, bezafibrate, iopromide and venlafaxine along 6 m column for five different scenarios. Values below DL were regarded with DL/2.

Figure 6.
Removal efficiency (%) of 5-methylbenzotriazole, hydrochlorothiazide, iopamidol, irbesartan and sulfamethoxazole under different HLCs. Not all substances were measured for all scenarios. Significance of trends is indicated by coefficient of determination (R2) and probability in statistical significance (P). Values below DL were regarded with DL/2.

Figure 7.
Removal efficiency (%) of 4-methylbenzotriazole, amidotrizoic acid, benzotriazole and candesartan under different HLCs. Not all substances were measured for all scenarios. Significance of trends is indicated by coefficient of determination (R2) and probability in statistical significance (P). Values below DL were regarded with DL/2.


Table 1.
Soil layer characteristics of 6 m high soil column with total organic carbon (TOC).
| Layer | Depths (m) | Gravel (%) | Sand (%) | Silt (%) | Clay (%) | Bulk Density (g/cm3) | TOC (%) |
|---|---|---|---|---|---|---|---|
| 1 | 0.00–1.53 | 0.7 | 93.9 | 2.4 | 3.0 | 1.38 | 0.25 |
| 2 | 1.53–2.58 | 0.6 | 94.4 | 2.1 | 2.9 | 1.36 | 0.10 |
| 3 | 2.58–3.52 | 0.0 | 99.2 | 0.1 | 0.7 | 1.40 | 0.01 |
| 4 | 3.52–4.62 | 0.0 | 97.4 | 0.6 | 2.0 | 1.51 | 0.02 |
| 5 | 4.62–6.00 | 0.4 | 86.4 | 5.6 | 7.6 | 1.48 | 0.05 |
Table 2.
Scenarios conducted in 6 m high soil column with different HLC (ratio wet: dry phase).
| Scenario | 1.1 | 1.2 | 1.3 | 1.4 | 1.5 | 1.6 | 2.1 | 2.2 | 3 | 4 | 5 |
|---|---|---|---|---|---|---|---|---|---|---|---|
| HLC | 60:100 min 1 | 60:150 min | 60:210 min | 60:240 min | 60:360 min | 60:444 min | 90:225 min | 90:360 min | 120:720 min | 3:4 d | 2:5 d |
| No. of cycles | 116 | 96 | 59 | 48 | 42 | 46 | 51 | 45 | 20 | 8 | 8 |
| Duration (days) | 14 | 14 | 11 | 10 | 24 | 17 | 11 | 14 | 12 | 56 | 56 |
1 Scenario was changed to 60:240 min once dissolved oxygen (DO) fell below a defined level. Hydraulic loading cycle (HLC) was changed back to 60:100 after DO recovery.
Table 3.
Characterization of TWW used in the experiments with measured ranges of dissolved organic carbon (DOC), ammonium and pH. Biochemical oxygen demand (BOD) and chemical oxygen demand (COD) were taken from [38].
Table 3.
Characterization of TWW used in the experiments with measured ranges of dissolved organic carbon (DOC), ammonium and pH. Biochemical oxygen demand (BOD) and chemical oxygen demand (COD) were taken from [38].
| DOC (mg/L) | Ammonium (mg/L) | Nitrate NO3- (mg/L) | BOD (mg/L) | COD (mg/L) | pH |
|---|---|---|---|---|---|
| 5–11 | 0.4–0.7 | 23–35 | 4 | 32 | 7 |
Table 4.
Target CECs and their physicochemical properties. Log Kow, acidity constant (pka) and log Dow are calculated using Advanced Chemistry Development Inc. (© 1998–2020 ChemAxon Ltd.). Note that log Dow is evaluated at pH = 7. Note that the values of Kd and Koc are estimated using Equations (2) and (3) considering an organic carbon content of 0.25%. The metabolites are highlighted in bold.
| CEC Type | Substance | log Kow | pKa 1 | log Dow (pH = 7) | Predominant Charge (pH = 7) | log Koc | log Kd |
|---|---|---|---|---|---|---|---|
| Artificial sweetener | Acesulfame | −0.55 | 3.02 (a) | −1.49 | Anionic | 0.25 | −2.50 |
| Triazole | Benzotriazole | 1.3 | 9.04 (a) | 1.29 | Neutral | 1.69 | −1.87 |
| 4-Methylbenzotriazole | 1.82 | 9.12 (a) | 1.81 | Neutral | 1.96 | −1.75 | |
| 5-Methylbenzotriazole | 1.82 | 9.29 (a) | 1.81 | Neutral | 1.96 | −1.75 | |
| Analgesics/anti-inflammatories | 4-Formylaminoantipyrine | 0.11 | 12.66 (a) | 0.11 | Neutral | 1.08 | −2.13 |
| Diclofenac | 4.26 | 4 (a) | 1.37 | Anionic | 1.73 | −1.85 | |
| Ibuprofen | 3.84 | 4.85 (a) | 1.71 | Anionic | 1.91 | −1.77 | |
| Angiotensin agents | Candesartan | 5.31 | 3.51, 5.85 (a) | 1.04 | Anionic | 1.56 | −1.92 |
| Irbesartan | 5.34 | 5.85 (a) | 4.46 | Anionic | 3.71 | −0.99 | |
| Valsartan | 5.27 | 4.35, 5.86 (a) | 1.65 | Anionic | 1.88 | −1.79 | |
| Antibiotics | Sulfamethoxazole | 0.79 | 6.16 (a) | 0.14 | Anionic | 1.09 | −2.13 |
| Acetylsulfamethoxazole | 0.86 | 5.88 (a) | 0.1 | Anionic | 1.07 | −2.14 | |
| Antidepressant | Venlafaxine | 2.74 | 8.91 (b) | 0.84 | Cationic | 1.46 | −1.97 |
| Antiepileptic | Carbamazepine | 2.77 | 15.96 (a) | 2.77 | Neutral | 2.46 | −1.53 |
| Gabapentin | −1.27 | 4.63 (a), 9.91 (b) | −1.27 | Zwitterion | 0.36 | −2.45 | |
| Gabapentin-Lactam | 3.985 | 3.83 (a) | 1.03 | Anionic | 1.56 | −1.93 | |
| Primidone | 1.12 | 11.5 (a) | 1.12 | Neutral | 1.60 | −1.91 | |
| Antigout agent | Oxypurinol | −1.67 | 6.25 (a) | −2.46 | Anionic | −0.26 | −2.71 |
| Cardiovascular drugs | Atenolol | 0.43 | 9.67 (b) | −2.14 | Cationic | −0.09 | −2.64 |
| Hydrochlorothiazide | −0.58 | 9.09 (a) | −0.58 | Neutral | 0.72 | −2.29 | |
| Metoprolol | 1.76 | 9.67 (b) | −0.81 | Cationic | 0.60 | −2.34 | |
| Contrast media | Amidotrizoic acid | 2.89 | 2.17 (a) | −0.62 | Anionic | 0.70 | −2.30 |
| Iohexol | −1.95 | 11.73 (a) | −1.95 | Neutral | 0.01 | −2.60 | |
| Iomeprol | −1.45 | 11.73 (a) | −1.45 | Neutral | 0.27 | −2.49 | |
| Iopamidol | −0.74 | 11 (a) | −0.74 | Neutral | 0.64 | −2.33 | |
| Iopromide | −0.45 | 11.09 (a) | −0.44 | Neutral | 0.79 | −2.26 | |
| Lipid regulator | Bezafibrate | 3.99 | 3.83 (a) | 0.97 | Anionic | 1.52 | −1.94 |
1 (a) acidic pKa, (b) basic pKa.
Table 5.
Concentration of CECs at influent source (TWW) and at the outlet of the 6 m column averaged over a maximum of 9 (TWW) and 11 (outflow) different experimental scenarios. Concentrations are given in µg/L. <DL: below the detection limit (DL). The metabolites are highlighted in bold.
Table 5.
Concentration of CECs at influent source (TWW) and at the outlet of the 6 m column averaged over a maximum of 9 (TWW) and 11 (outflow) different experimental scenarios. Concentrations are given in µg/L. <DL: below the detection limit (DL). The metabolites are highlighted in bold.
| Substance | Concentration in TWW (µg/L) | Concentration in Outflow (µg/L) | No. of Measurements 1 | ||
|---|---|---|---|---|---|
| Average | Std. Deviation | Average | Std. Deviation | (TWW/Outflow) | |
| Acesulfame | 4 | 2.97 | 0.31 | 0.27 | 5/3 |
| Benzotriazole | 12.66 | 5.56 | 5.24 | 2.81 | 7/11 |
| 4-Methylbenzotriazole | 9.9 | 1.85 | 5.79 | 1.85 | 4/8 |
| 5-Methylbenzotriazole | 1.35 | 0.3 | 0.25 | 0.09 | 4/8 |
| 4-Formylaminoantipyrine | 3.14 | 0.03 | <DL | 3/3 | |
| Diclofenac | 3.38 | 1 | <DL | 9/11 | |
| Ibuprofen | 0.07 | 0 | 0.01 | 0.02 | 1/4 |
| Candesartan | 1.93 | 0.21 | 1.47 | 0.3 | 3/7 |
| Irbesartan | 0.52 | 0.11 | 0.08 | 0.05 | 3/8 |
| Valsartan | 3.12 | 3.29 | <DL | 4/3 | |
| Sulfamethoxazole | 0.2 | 0.04 | 0.05 | 0.04 | 9/11 |
| Acetylsulfamethoxazole | 0.18 | 0.04 | <DL | 2/4 | |
| Venlafaxine | 0.72 | 0.1 | 0.18 | 0.1 | 4/3 |
| Carbamazepine | 0.99 | 0.36 | 0.71 | 0.36 | 9/11 |
| Gabapentin | 10.41 | 1.38 | 0.82 | 1.11 | 5/3 |
| Gabapentin-Lactam | 1.2 | 0.09 | <DL | 2/2 | |
| Primidone | 0.54 | 0.03 | 0.48 | 0.07 | 4/3 |
| Oxypurinol | 13 | 0 | 13.5 | 1.12 | 1/4 |
| Atenolol | 0.33 | 0.21 | <DL | 2/2 | |
| Hydrochlorothiazide | 2.33 | 0.23 | 1.44 | 0.31 | 4/8 |
| Metoprolol | 1.85 | 1.67 | <DL | 8/11 | |
| Amidotrizoic acid | 4.71 | 0.95 | 2.42 | 1.7 | 8/9 |
| Iohexol | 0.84 | 0.82 | <DL | 3/8 | |
| Iomeprol | 2.29 | 0.92 | <DL | 5/3 | |
| Iopamidol | 2.36 | 2.74 | 0.72 | 0.57 | 4/8 |
| Iopromide | 1.81 | 1.54 | <DL | 8/11 | |
| Bezafibrate | 0.96 | 1.27 | <DL | 7/7 | |
1 Number of measurement campaigns out of nine overall samples for treated wastewater (TWW) and 11 samples for outflow where the substance was analyzed (3.3). Removal efficiency of contaminants of emerging concern (CECs) during soil aquifer treatment (SAT).
© 2020 by the authors. Licensee MDPI, Basel, Switzerland. This article is an open access article distributed under the terms and conditions of the Creative Commons Attribution (CC BY) license (http://creativecommons.org/licenses/by/4.0/).
Share and Cite
MDPI and ACS Style
Sallwey, J.; Jurado, A.; Barquero, F.; Fahl, J. Enhanced Removal of Contaminants of Emerging Concern through Hydraulic Adjustments in Soil Aquifer Treatment. Water 2020, 12, 2627. https://doi.org/10.3390/w12092627
AMA Style
Sallwey J, Jurado A, Barquero F, Fahl J. Enhanced Removal of Contaminants of Emerging Concern through Hydraulic Adjustments in Soil Aquifer Treatment. Water. 2020; 12(9):2627. https://doi.org/10.3390/w12092627
Chicago/Turabian StyleSallwey, Jana, Anna Jurado, Felix Barquero, and Jens Fahl. 2020. "Enhanced Removal of Contaminants of Emerging Concern through Hydraulic Adjustments in Soil Aquifer Treatment" Water 12, no. 9: 2627. https://doi.org/10.3390/w12092627
Note that from the first issue of 2016, this journal uses article numbers instead of page numbers. See further details here.