Chasing the Major Sphingolipids on Earth: Automated Annotation of Plant Glycosyl Inositol Phospho Ceramides by Glycolipidomics

 ,
,  and
and
Abstract
:
1. Introduction
2. Results
2.1. Method Development for Automated GIPC Assignment
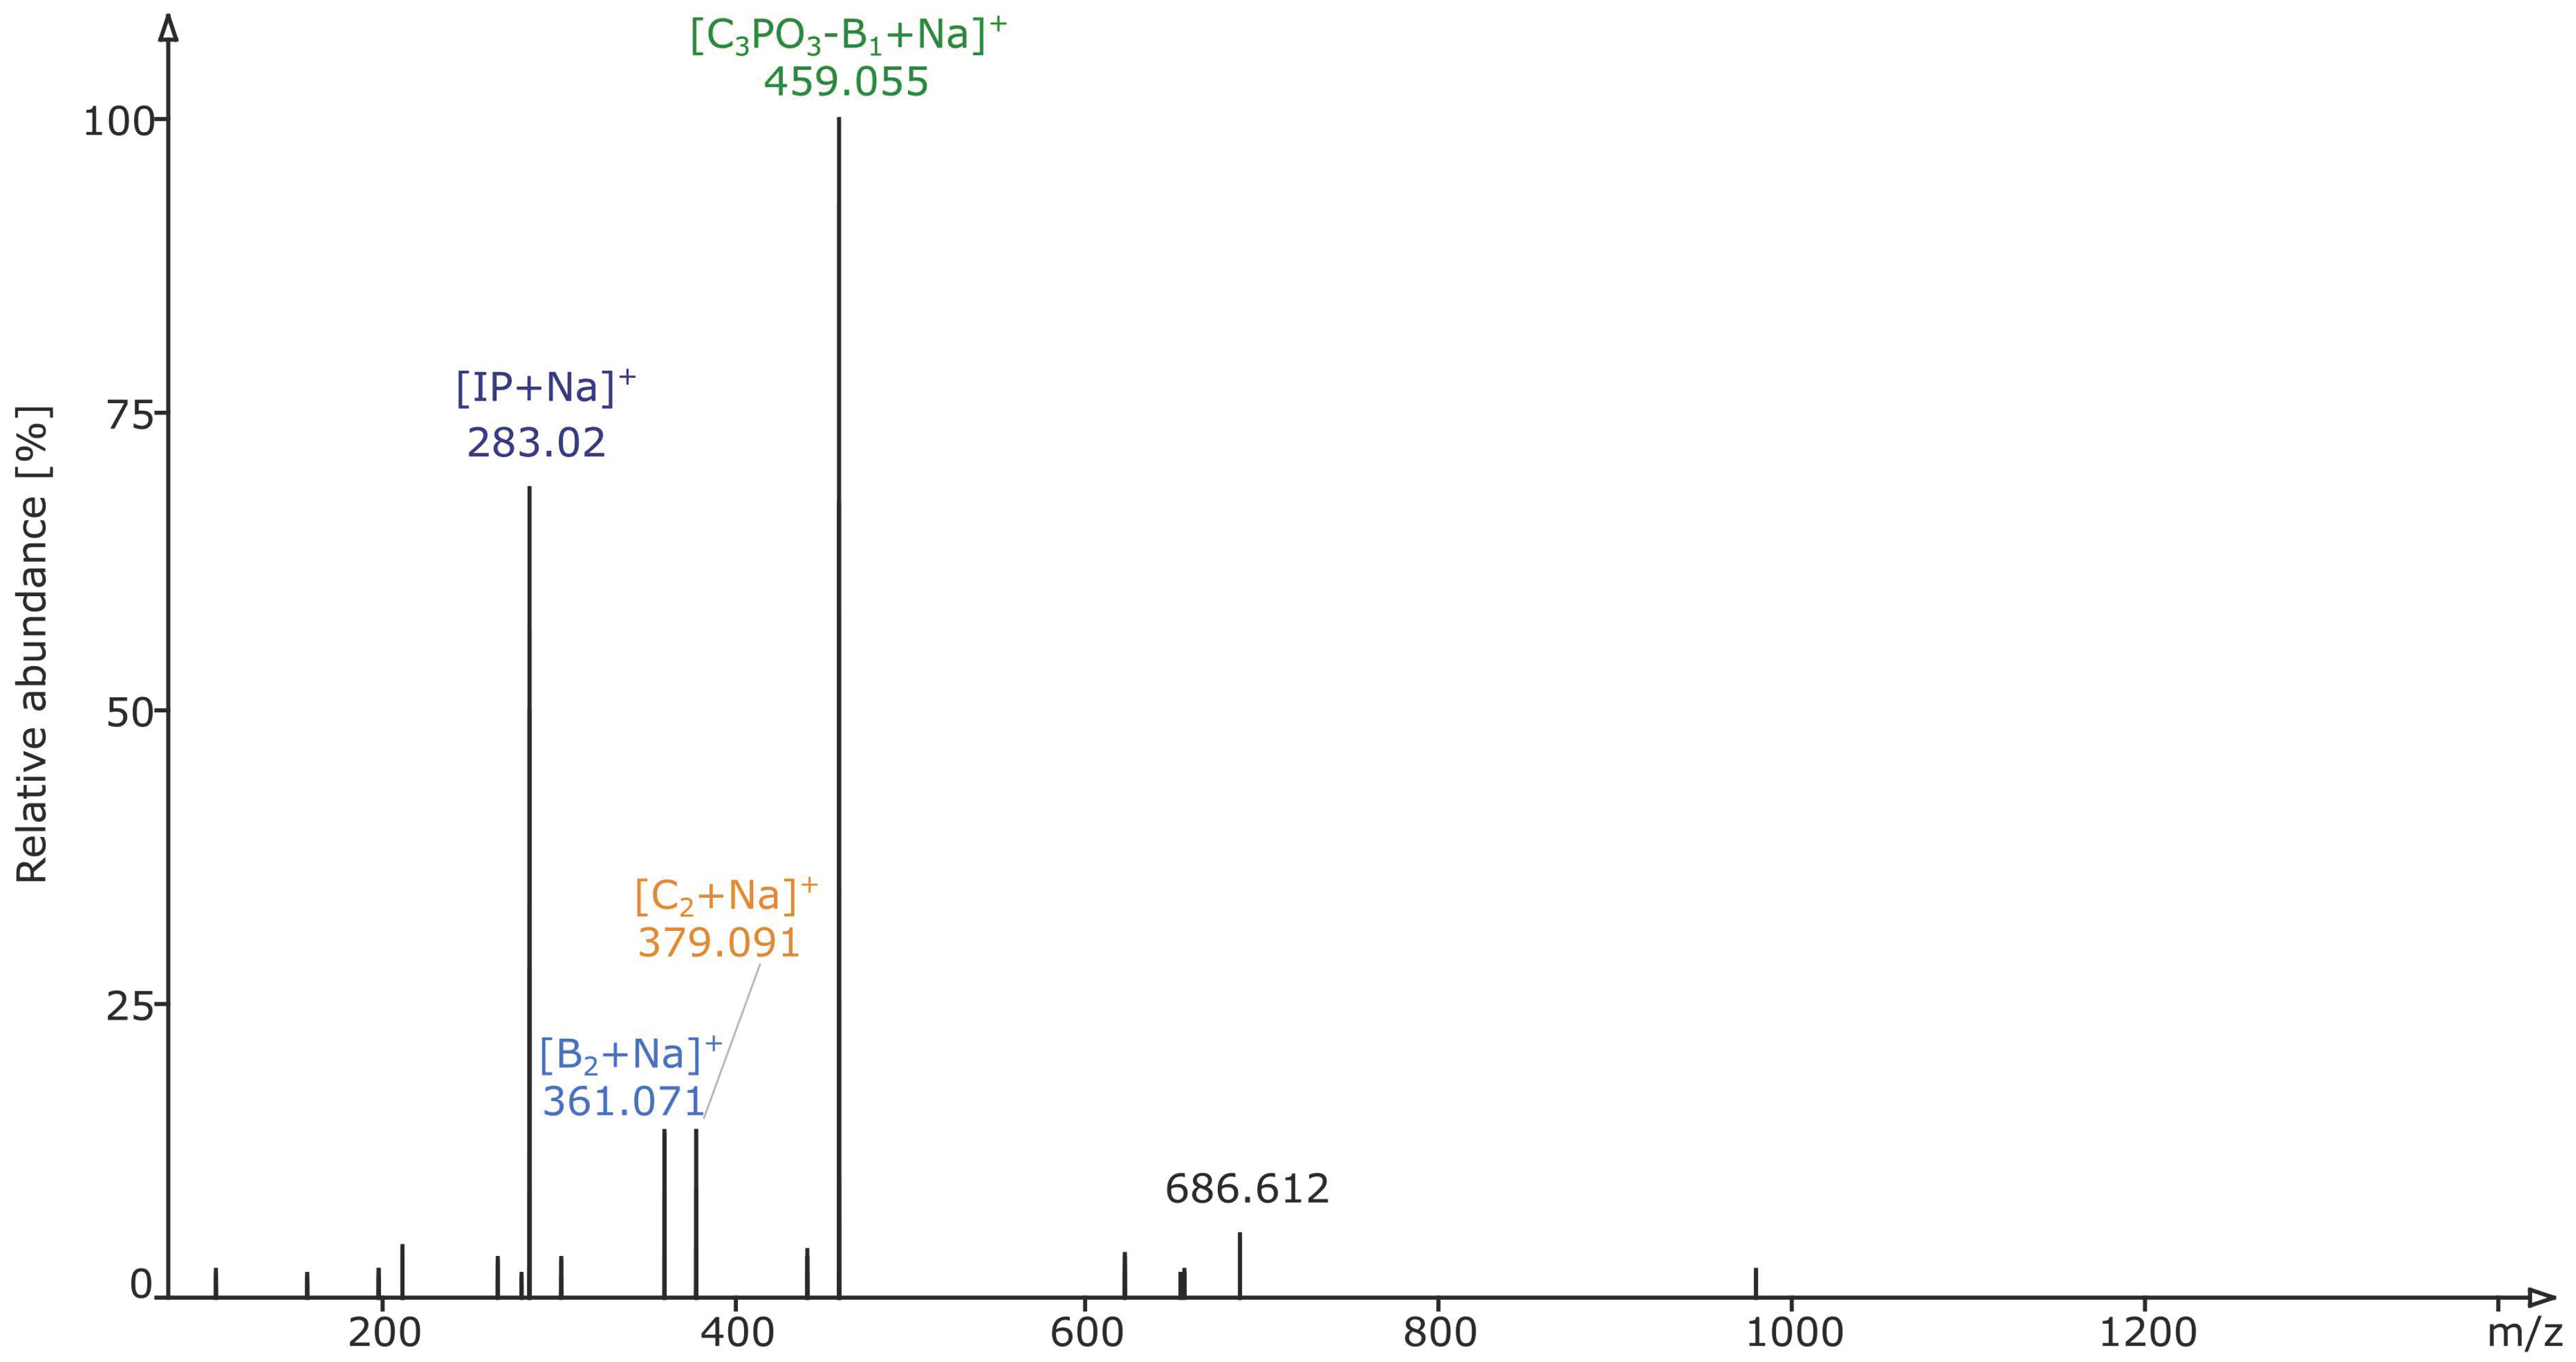
2.2. Structural Elucidation and GIPC Annotation Based on MS2 Information
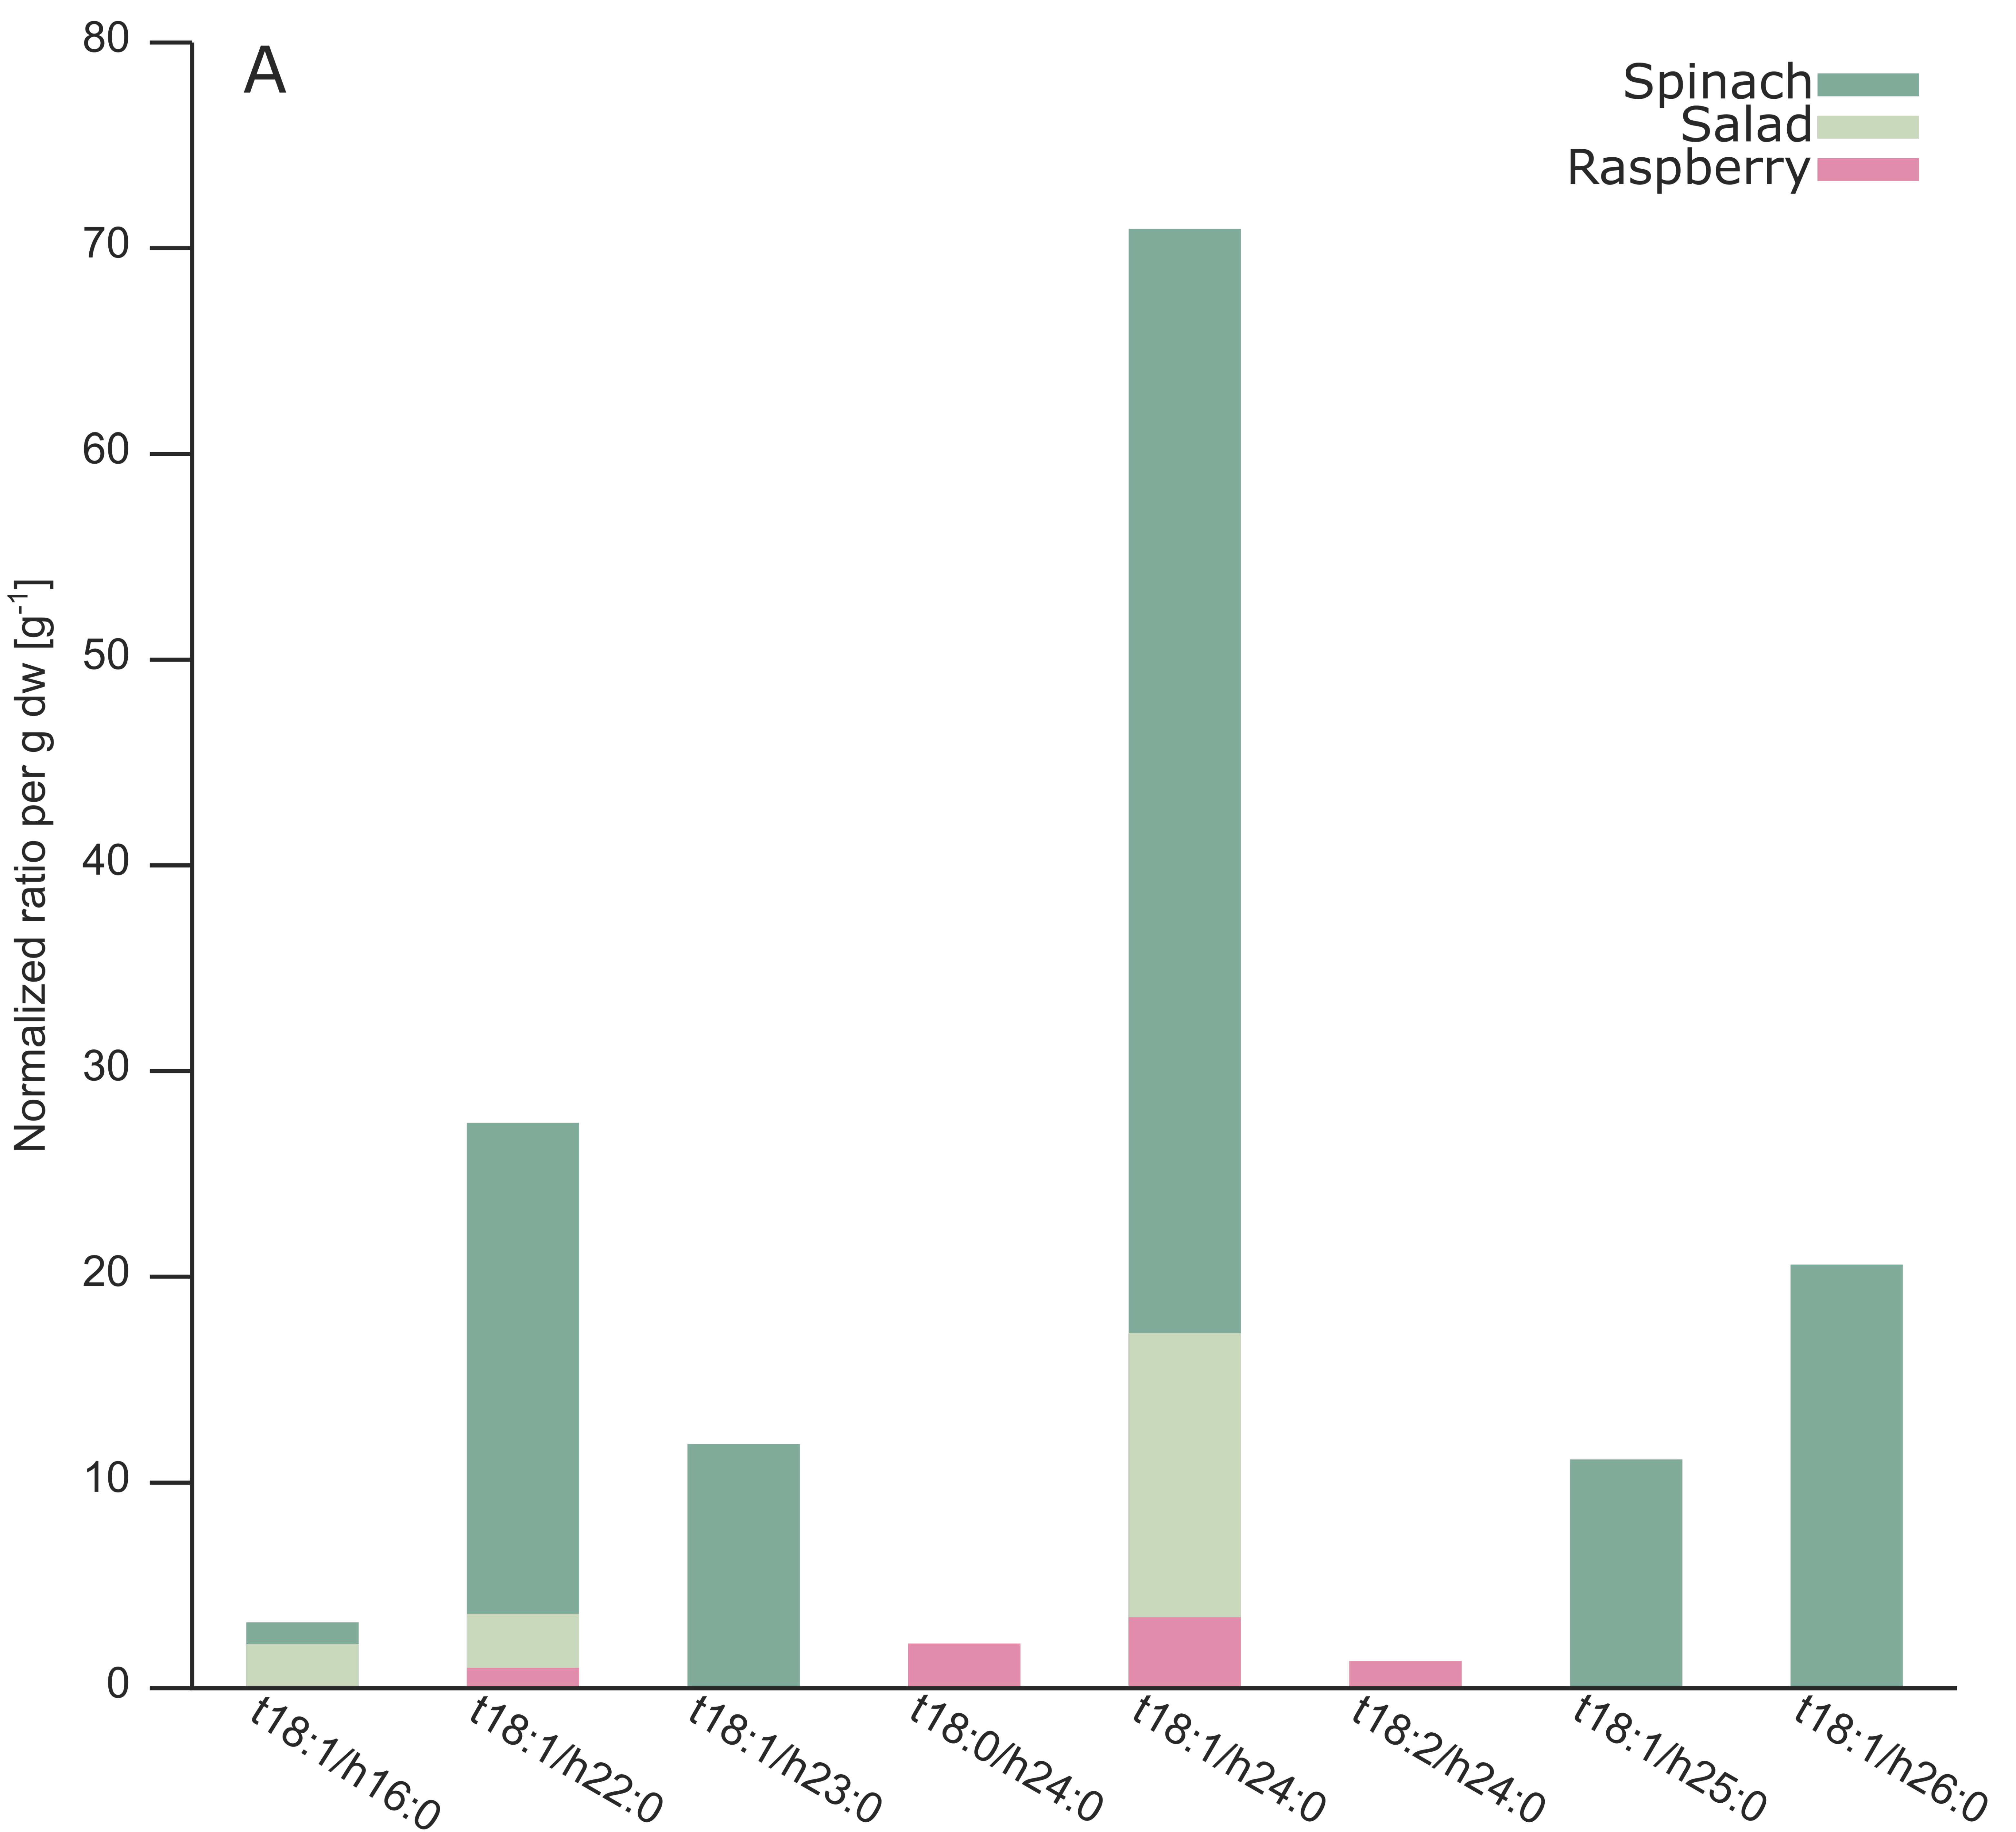
2.3. Analysis of Different Plant GIPCs by UHPLC-HRMS Suggesting t18:2 LCB
3. Discussion
4. Materials and Methods
4.1. Material
4.2. Sample Preparation
4.2.1. One-Phase Extraction
4.2.2. One-Phase Extraction Combined with Alkaline Hydrolysis
4.2.3. Centrifugation, Drying and Reconstitution
4.3. Reversed-Phase Chromatography
4.4. High-Resolution Mass Spectrometry
4.5. Data Analysis
Supplementary Materials
Author Contributions
Funding
Acknowledgments
Conflicts of Interest
Appendix A

| Composition | Plant | m/z [M − H]− | m/z [M + H]+ | Rt_neg [min] | Rt_pos [min] | Level | Normalized Ratio/g dw [g−1] | CV [%] |
|---|---|---|---|---|---|---|---|---|
| A-NAc-t18:1/h16:0 | Spinach | 1189.6246 | 1191.6388 | 8.00 | 8.00 | 2 | 3.15 | 25 |
| A-NAc-t18:1/h16:0 | Salad | 1189.6246 | 1191.6397 | 8.01 | 8.00 | 2 | 2.10 | 28 |
| A-NAc-t18:1/h22:0 | Spinach | 1273.7179 | 1275.7359 | 14.25 | 14.25 | 2 | 27.43 | 19 |
| A-NAc-t18:1/h22:0 | Salad | 1273.7193 | 1275.7344 | 14.19 | 14.26 | 2 | 3.57 | 44 |
| A-NAc-t18:1/h22:0 | Raspberry | 1273.7172 | 1275.7341 | 14.21 | 14.19 | 2 | 0.94 | 6 |
| A-NAc-t18:1/h23:0 | Spinach | 1287.7325 | 1289.7504 | 15.64 | 15.65 | 2 | 11.83 | 21 |
| A-NAc-t18:0/h24:0 | Raspberry | 1303.7648 | 1305.7813 | 17.94 | 18.17 | 2 | 2.13 | 4 |
| A-NAc-t18:1/h24:0 | Spinach | 1301.7502 | 1303.7657 | 16.98 | 16.98 | 2 | 70.89 | 21 |
| A-NAc-t18:1/h24:0 | Salad | 1301.7498 | 1303.7637 | 16.98 | 16.94 | 2 | 17.23 | 32 |
| A-NAc-t18:1/h24:0 | Raspberry | 1301.7491 | 1303.7649 | 16.96 | 16.94 | 2 | 3.40 | 5 |
| A-NAc-t18:2/h24:0 | Raspberry | 1299.7322 | 1301.749 | 14.98 | 14.97 | 2 | 1.27 | 3 |
| A-NAc-t18:1/h25:0 | Spinach | 1315.7652 | 1317.7811 | 18.41 | 18.41 | 2 | 11.08 | 20 |
| A-NAc-t18:1/h26:0 | Spinach | 1329.7811 | 1331.797 | 19.75 | 19.75 | 2 | 20.54 | 16 |
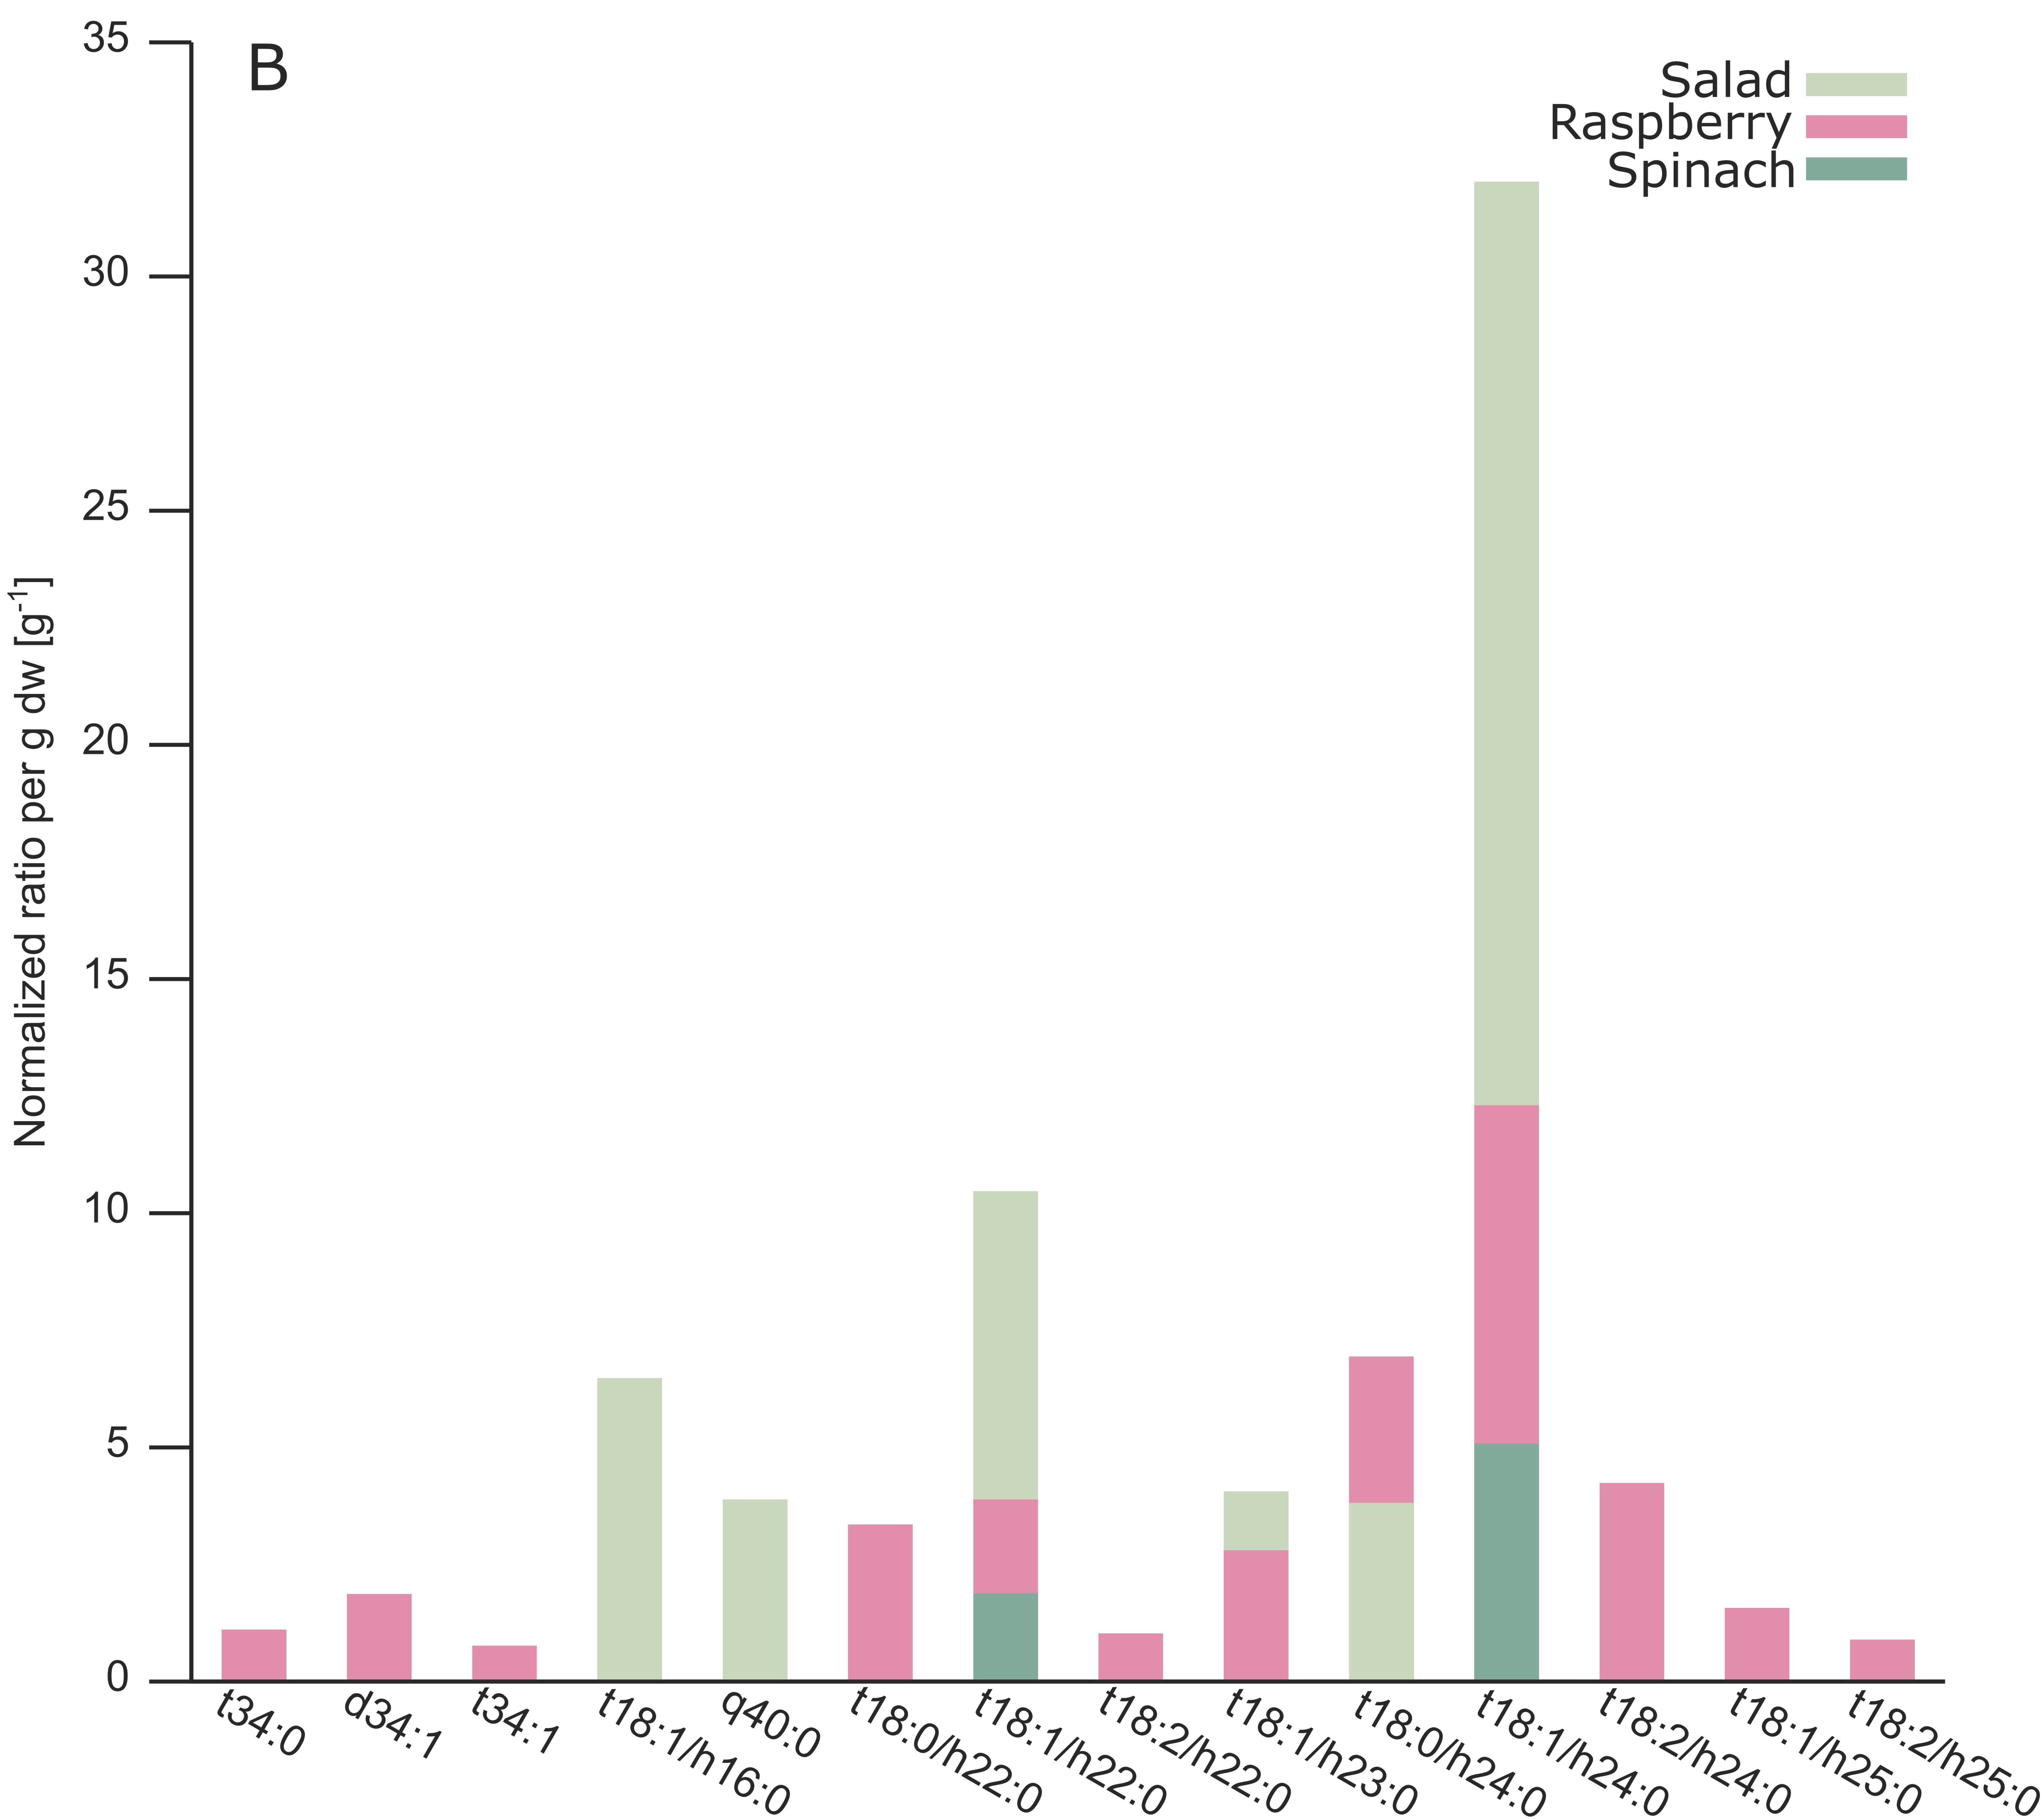
| A-NH2-t34:0 | Raspberry | 1133.6346 | 1135.6506 | 10.91 | 10.92 | 2 | 1.09 | 6 |
| A-NH2-d34:1 | Raspberry | 1115.6248 * | 1117.6415 | 10.89 | 10.90 | 3 | 1.85 | 7 |
| A-NH2-t34:1 | Raspberry | 1131.6196 * | 1133.6365 | 10.27 | 10.27 | 3 | 0.75 | 8 |
| A-NH2-t18:1/h16:0 | Salad | 1147.6148 | 1149.6302 | 8.64 | 8.52 | 2 | 6.46 | 5 |
| A-NH2-q40:0 | Salad | 1233.7225 * | 1235.7372 | 16.82 | 16.76 | 3 | 3.87 | 27 |
| A-NH2-t18:0/h22:0 | Raspberry | 1233.7242 | 1235.7389 | 16.64 | 16.55 | 2 | 3.33 | 7 |
| A-NH2-t18:1/h22:0 | Spinach | 1231.7058 * | 1233.7229 | 15.56 | 15.52 | 3 | 1.87 | 18 |
| A-NH2-t18:1/h22:0 | Salad | 1231.7083 | 1233.7226 | 15.51 | 15.49 | 2 | 10.45 | 11 |
| A-NH2-t18:1/h22:0 | Raspberry | 1231.7082 | 1233.7234 | 15.41 | 15.25 | 2 | 3.87 | 7 |
| A-NH2-t18:2/h22:0 | Raspberry | 1229.6945 * | 1231.7076 | 13.42 | 13.42 | 3 | 1.01 | 4 |
| A-NH2-t18:1/h23:0 | Salad | 1245.7242 * | 1247.7400 | 16.78 | 16.87 | 3 | 4.04 | 15 |
| A-NH2-t18:1/h23:0 | Raspberry | 1245.7248 | 1247.7388 | 16.89 | 16.85 | 2 | 2.79 | 7 |
| A-NH2-t18:0/h24:0 | Raspberry | 1261.7551 | 1263.7704 | 19.62 | 19.64 | 2 | 6.92 | 9 |
| A-NH2-t18:0/h24:0 | Salad | 1261.7531* | 1263.7701 | 19.82 | 19.53 | 3 | 3.80 | 27 |
| A-NH2-t18:1/h24:0 | Spinach | 1259.7391 | 1261.7565 | 18.32 | 18.30 | 2 | 5.06 | 18 |
| A-NH2-t18:1/h24:0 | Salad | 1259.7400 | 1261.7554 | 18.52 | 18.44 | 2 | 32.00 | 6 |
| A-NH2-t18:1/h24:0 | Raspberry | 1259.7400 | 1261.7543 | 18.46 | 18.42 | 2 | 12.28 | 8 |
| A-NH2-t18:2/h24:0 | Raspberry | 1257.7231 | 1259.7397 | 15.98 | 16.25 | 2 | 4.22 | 8 |
| A-NH2-t18:1/h25:0 | Raspberry | 1273.7539 * | 1275.7692 | 19.55 | 19.78 | 3 | 1.55 | 11 |
| A-NH2-q43:2 | Raspberry | 1271.7419 * | 1273.7571 | 17.71 | 17.73 | 3 | 0.87 | 9 |
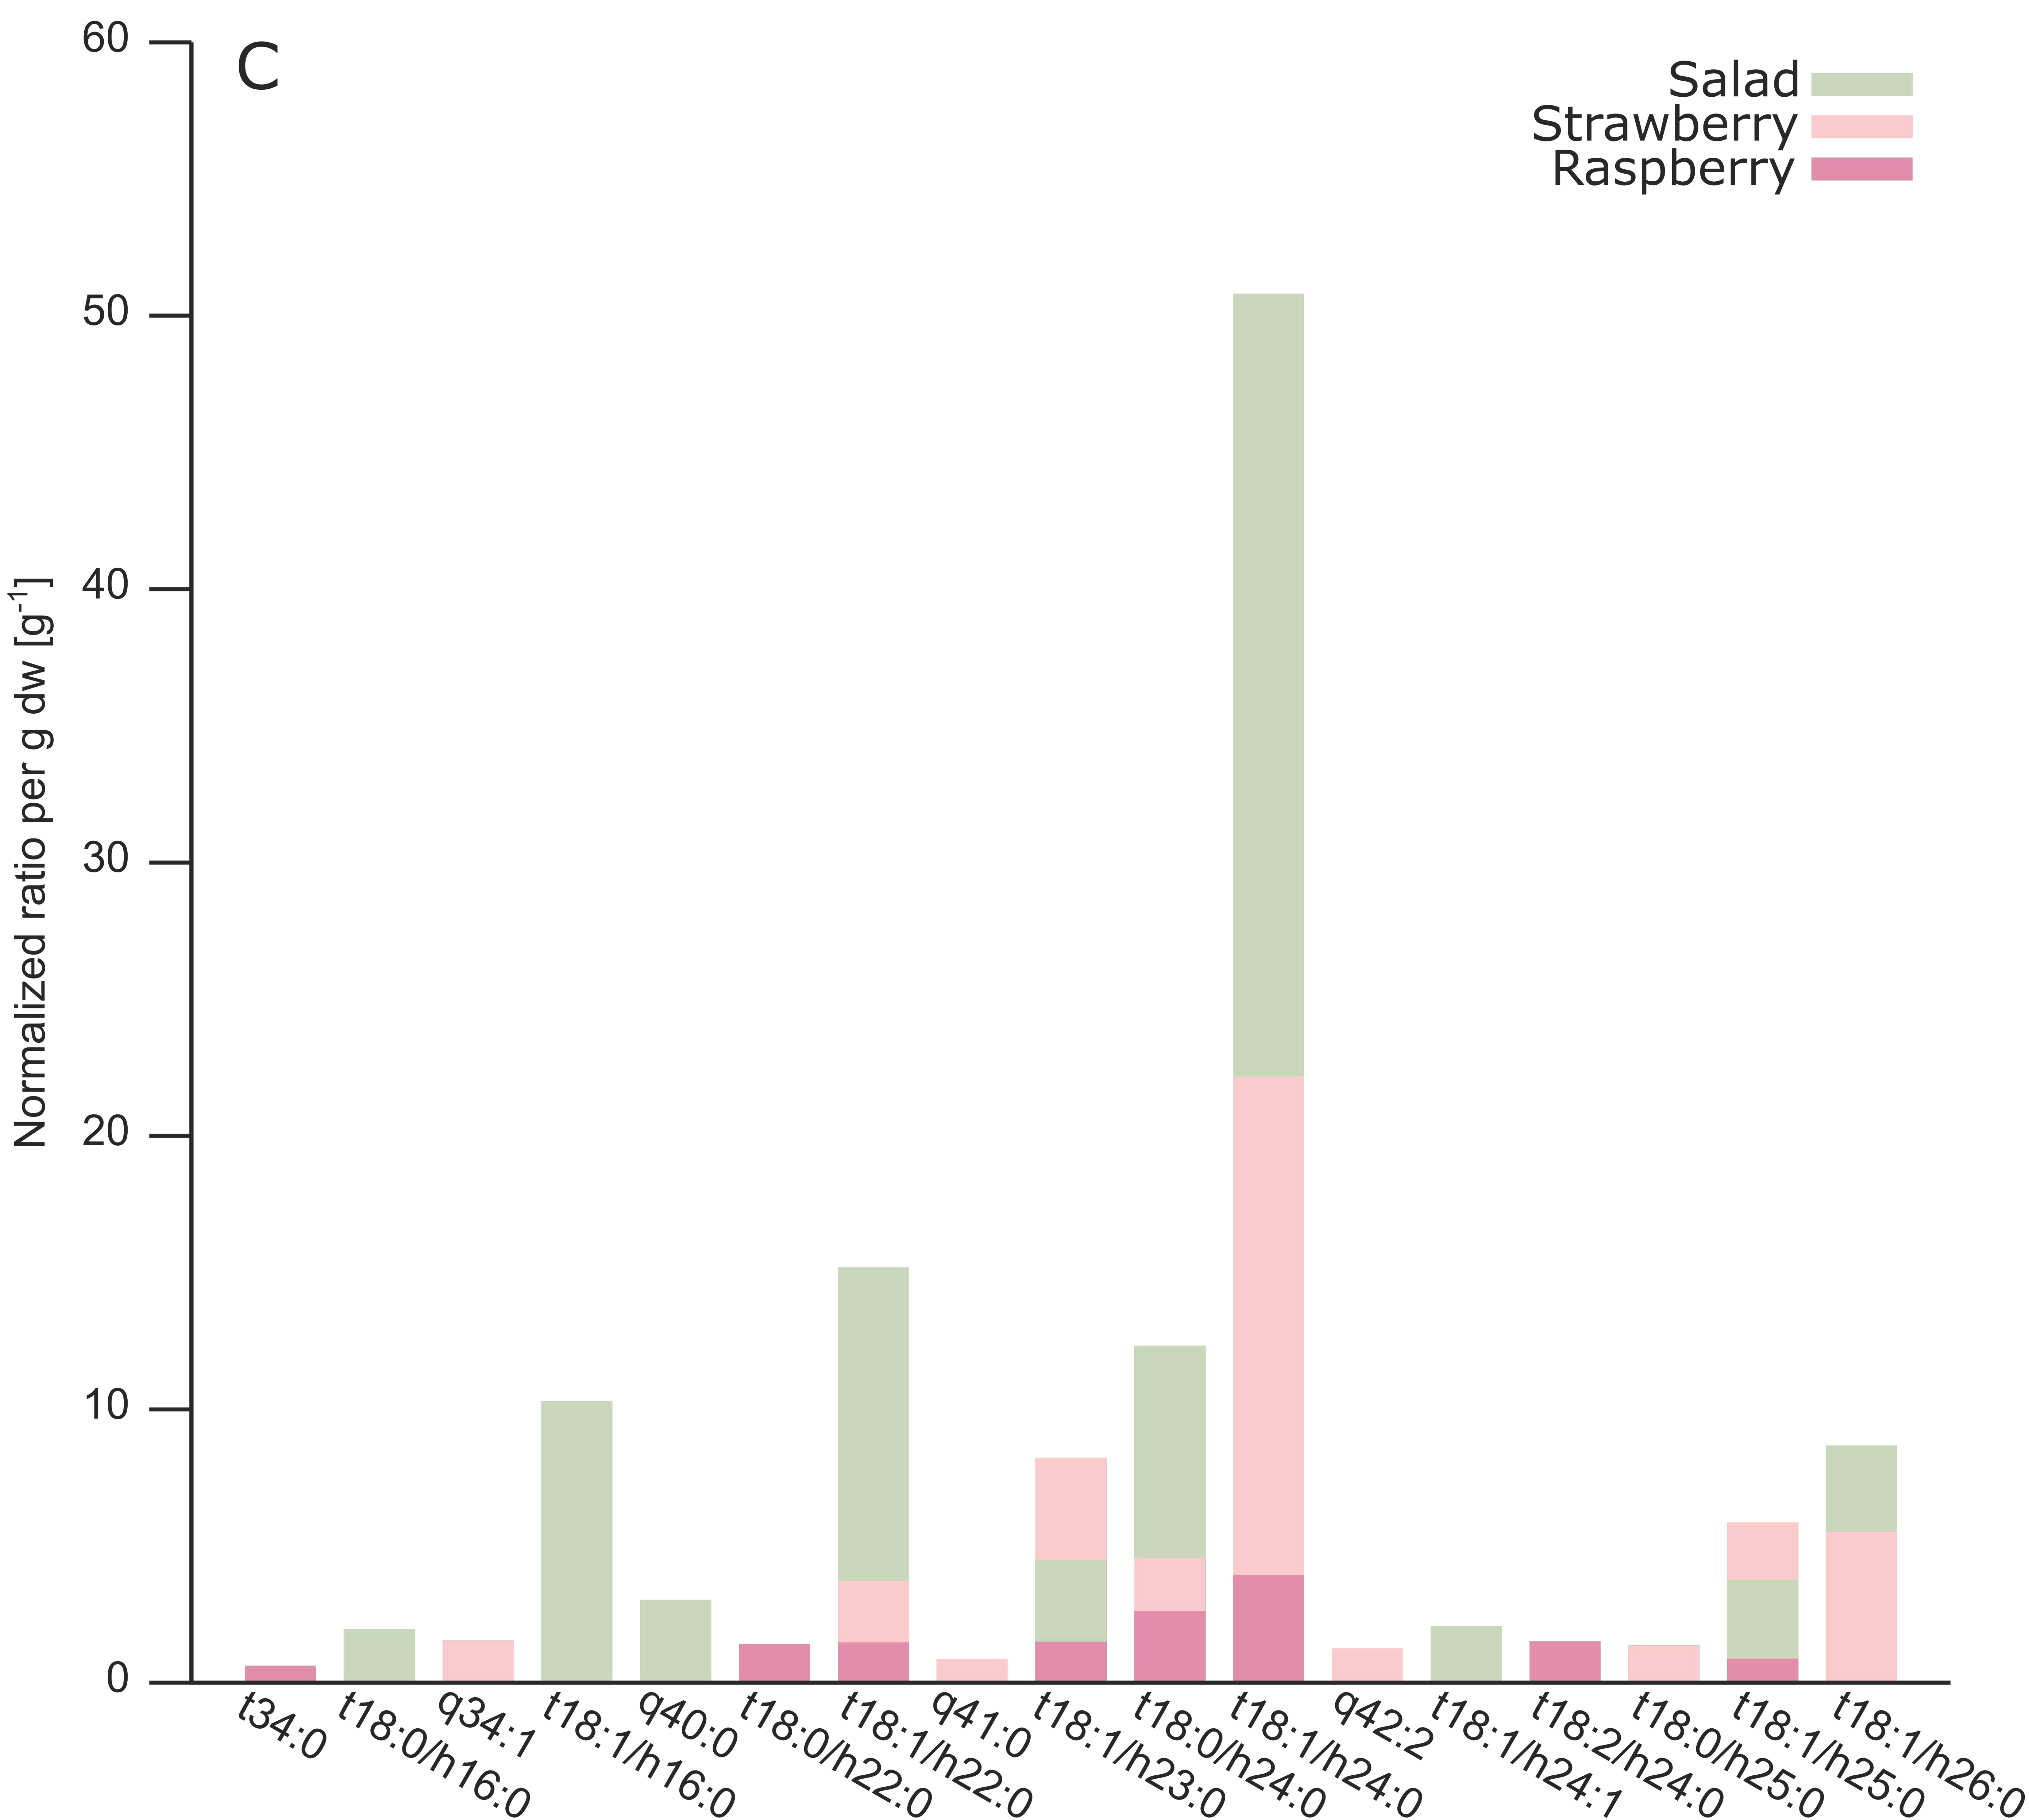
| A-OH-t34:0 | Raspberry | 1134.6192 | 1136.6369 | 10.21 | 10.21 | 2 | 0.58 | 8 |
| A-OH-t18:0/h16:0 | Salad | 1150.6148 | 1152.6313 | 8.84 | 8.83 | 2 | 1.93 | 0 |
| A-OH-t18:1/h16:0 | Salad | 1148.5984 | 1150.6138 | 8.14 | 8.13 | 2 | 10.27 | 16 |
| A-OH-q34:1 | Strawberry | 1148.5982 | 1150.6144 | 8.11 | 8.13 | 2 | 1.51 | 6 |
| A-OH-q40:0 | Salad | 1234.7095 | 1236.7239 * | 15.66 | 15.60 | 3 | 3.00 | 2 |
| A-OH-t18:0/h22:0 | Raspberry | 1234.7084 | 1236.7247 | 15.36 | 15.63 | 2 | 1.37 | 6 |
| A-OH-t18:1/h22:0 | Salad | 1232.6921 | 1234.7071 | 14.47 | 14.44 | 2 | 15.16 | 19 |
| A-OH-t18:1/h22:0 | Strawberry | 1232.6921 | 1234.7083 | 14.25 | 14.43 | 2 | 3.69 | 2 |
| A-OH-t18:1/h22:0 | Raspberry | 1232.6924 | 1234.7055 | 14.43 | 14.43 | 2 | 1.44 | 6 |
| A-OH-q41:0 | Strawberry | 1248.7232 | 1250.7395 * | 17.01 | 16.98 | 3 | 0.83 | 2 |
| A-OH-t18:1/h23:0 | Raspberry | 1246.7076 | 1248.78221 | 15.82 | 15.77 | 2 | 1.46 | 7 |
| A-OH-t18:1/h23:0 | Salad | 1246.7079 | 1248.7209 | 15.85 | 15.84 | 2 | 4.45 | 18 |
| A-OH-t18:1/h23:0 | Strawberry | 1246.7076 | 1248.7238 | 15.53 | 15.76 | 2 | 8.20 | 1 |
| A-OH-t18:0/h24:0 | Salad | 1262.7397 | 1264.7564 | 18.55 | 18.50 | 2 | 12.30 | 4 |
| A-OH-t18:0/h24:0 | Raspberry | 1262.7385 | 1264.754 | 18.51 | 18.53 | 2 | 2.58 | 6 |
| A-OH-t18:0/h24:0 | Strawberry | 1262.7387 | 1264.7553 | 18.44 | 18.32 | 2 | 4.53 | 1 |
| A-OH-t18:1/h24:0 | Salad | 1260.7237 | 1262.7389 | 17.30 | 17.26 | 2 | 50.77 | 14 |
| A-OH-t18:1/h24:0 | Strawberry | 1260.7227 | 1262.7391 | 17.26 | 17.00 | 2 | 22.15 | 2 |
| A-OH-t18:1/h24:0 | Raspberry | 1260.7240 | 1262.7388 | 17.25 | 17.23 | 2 | 3.89 | 6 |
| A-OH-q42:2 | Strawberry | 1258.7073 | 1260.7238 * | 15.21 | 15.22 | 3 | 1.22 | 2 |
| A-OH-t18:1/h24:1 | Salad | 1258.7067 | 1260.7243 | 14.36 | 14.33 | 2 | 2.04 | 10 |
| A-OH-t18:2/h24:0 | Raspberry | 1258.7082 | 1260.7234 | 15.23 | 15.23 | 2 | 1.47 | 5 |
| A-OH-t18:0/h25:0 | Strawberry | 1276.7542 | 1278.7687 | 19.80 | 19.80 | 2 | 1.33 | 5 |
| A-OH-t18:1/h25:0 | Salad | 1274.7387 | 1276.7533 | 18.76 | 18.75 | 2 | 3.72 | 11 |
| A-OH-t18:1/h25:0 | Strawberry | 1274.7371 | 1276.7557 | 18.42 | 18.48 | 2 | 5.83 | 2 |
| A-OH-t18:1/h25:0 | Raspberry | 1274.7381 | 1276.7548 | 18.71 | 18.73 | 2 | 0.84 | 9 |
| A-OH-t18:1/h26:0 | Salad | 1288.7553 | 1290.7706 | 20.01 | 20.01 | 2 | 8.65 | 18 |
| A-OH-t18:1/h26:0 | Strawberry | 1288.7540 * | 1290.7697 | 19.76 | 19.94 | 3 | 5.49 | 2 |
| A-NH2-d18:2/16:0 | Raspberry | 1113.6100 * | 1115.6255 | 9.89 | 9.89 | 3 ** | 0.57 | 10 |
| A-NH2-q41:0 | Raspberry | 1247.7383 * | 1249.7544 | 18.16 | 18.17 | 3 ** | 2.03 | 7 |
| A-NH2-q41:2 | Raspberry | 1243.7076 * | 1245.7232 | 14.77 | 14.80 | 3 ** | 0.87 | 7 |


| Plant Species | Origin | Replicates | Fresh Weight [g] | Dry Weight [g] |
|---|---|---|---|---|
| Salad | Local supermarket | 4 | ~1 | ~0.04 |
| Spinach | Local supermarket | 4 | ~1.2 | ~0.08 |
| Strawberries | 47°58′ N, 16°6′ O | 5 | ~1.1 | ~0.10 |
| Raspberries | 47°58′ N, 16°6′ O | 5 | ~1.1 | ~0.16 |
| Parameter | Setting |
|---|---|
| Time before tol. | 1 min |
| Time after tol. | 1 min |
| Rel. Base-peak cutoff | 0.1‰ |
| Rt-shift | 0.0 min |
| Isotopic quantitation of _ isotopes where _ isotopic peak(s) have to match | 2, 1 |
| Find molecules where retention time is unknown | yes |
| LDA-version | 2.8.0 |
| machineName | OrbiTrap_exactive |
| neutronMass | 1.005 |
| coarseChromMzTolerance | 0.015 |
| MS2 | true |
| basePeakCutoff | 0.1 |
| massShift | 0.0 |
| threeDViewerDefaultTimeResolution | 2 |
| threeDViewerDefaultMZResolution | 0.005 |
| ms2PrecursorTolerance | 0.013 |
| ms2MzTolerance | 0.02 |
| ms2MinIntsForNoiseRemoval | 100 |
| ms2IsobarSCExclusionRatio | 0.01 |
| ms2IsobarSCFarExclusionRatio | 0.1 |
| ms2IsobaricOtherRtDifference | 2.0 |
| chainCutoffValue | 0.01 |
| ms2ChromMultiplicationFactorForInt | 10 |
| threeDViewerMs2DefaultTimeResolution | 1 |
| threeDViewerMs2DefaultMZResolution | 1 |
| maxFileSizeForChromTranslationAtOnce | 500 |
| chromMultiplicationFactorForInt | 1000 |
| chromLowestResolution | 1 |
| chromSmoothRange | 8.0 |
| chromSmoothRepeats | 4 |
| use3D | true |
| isotopeCorrection | false |
| removeFromOtherIsotopes | true |
| respectIsotopicDistribution | true |
| checkChainLabelCombinationFromSpeciesName | false |
| useNoiseCutoff | true |
| noiseCutoffDeviationValue | 2.0 |
| scanStep | 2 |
| profileMzRangeExtraction | 0.05 |
| profileTimeTolerance | 5.0 |
| profileIntThreshold | 5.0 |
| broaderProfileTimeTolerance | 3.0 |
| profileSmoothRange | 0.0025 |
| profileSmoothRepeats | 1 |
| profileMeanSmoothRepeats | 2 |
| profileMzMinRange | 0.002 |
| profileSteepnessChange1 | 1.5 |
| profileSteepnessChange2 | 1.8 |
| profileIntensityCutoff1 | 0.15 |
| profileIntensityCutoff2 | 0.2 |
| profileGeneralIntCutoff | 0.03 |
| profilePeakAcceptanceRange | 0.012 |
| profileSmoothingCorrection | 0.0 |
| profileMaxRange | 0.03 |
| smallChromMzRange | 0.004 |
| smallChromSmoothRepeats | 3 |
| smallChromMeanSmoothRepeats | 0 |
| smallChromSmoothRange | 2.0 |
| smallChromIntensityCutoff | 0.03 |
| broadChromSmoothRepeats | 5 |
| broadChromMeanSmoothRepeats | 0 |
| broadChromSmoothRange | 2 |
| broadChromIntensityCutoff | 0.0 |
| broadChromSteepnessChangeNoSmall | 1.33 |
| broadChromIntensityCutoffNoSmall | 0.05 |
| finalProbeTimeCompTolerance | 0.1 |
| finalProbeMzCompTolerance | 5.0E-4 |
| overlapDistanceDeviationFactor | 1.5 |
| overlapPossibleIntensityThreshold | 0.15 |
| overlapSureIntensityThreshold | 0.7 |
| overlapPeakDistanceDivisor | 3.0 |
| overlapFullDistanceDivisor | 6.0 |
| peakDiscardingAreaFactor | 1000 |
| isotopeInBetweenTime | 30 |
| isoInBetweenAreaFactor | 3.0 |
| isoNearNormalProbeTime | 30 |
| relativeAreaCutoff | 0.05 |
| relativeFarAreaCutoff | 0.05 |
| relativeFarAreaTimeSpace | 30 |
| relativeIsoInBetweenCutoff | 0.5 |
| isoInBetweenMaxTimeDistance | 300 |
| twinPeakMzTolerance | 0.01 |
| closePeakTimeTolerance | 10 |
| twinInBetweenCutoff | 0.95 |
| unionInBetweenCutoff | 0.8 |
| sparseData | false |
Appendix B
References
- Gronnier, J.; Germain, V.; Gouguet, P.; Cacas, J.-L.; Mongrand, S. GIPC: Glycosyl Inositol Phospho Ceramides, the major sphingolipids on earth. Plant Signal. Behav. 2016, 11, e1152438. [Google Scholar] [CrossRef] [PubMed] [Green Version]
- Carter, H.E.; Gigg, R.H.; Laws, J.H. Structure of Phytoglyolipide. J. Biol. Chem. 1958, 233, 1309–1314. [Google Scholar] [PubMed]
- Cacas, J.; Buré, C.; Grosjean, K.; Gerbeau-Pissot, P.; Lherminier, J.; Rombouts, Y.; Maes, E.; Bossard, C.; Gronnier, J.; Furt, F.; et al. Revisiting Plant Plasma Membrane Lipids in Tobacco: A Focus on Sphingolipids. Plant Physiol. 2016, 170, 367–384. [Google Scholar] [CrossRef] [PubMed]
- Carter, H.E.; Strobach, D.R.; Hawthorne, J.N. Biochemistry of the Sphingolipids. XVIII. Complete Structure of Tetrasaccharide Phytoglycolipid. Biochemistry 1969, 8, 383–388. [Google Scholar] [CrossRef] [PubMed]
- Buré, C.; Cacas, J.; Mongrand, S.; Schmitter, J.-M. Characterization of glycosyl inositol phosphoryl ceramides from plants and fungi by mass spectrometry. Anal. Bioanal. Chem. 2014, 406, 995–1010. [Google Scholar] [CrossRef]
- LIPID MAPS® Lipidomics Gateway. Available online: https://lipidmaps.org/resources/lipidweb/index.php?page=lipids/sphingo/glyP_ino/index.htm (accessed on 4 August 2020).
- Buré, C.; Cacas, J.-L.; Wang, F.; Gaudin, K.; Domergue, F.; Mongrand, S.; Schmitter, J.-M. Fast screening of highly glycosylated plant sphingolipids by tandem mass spectrometry. Rapid Commun. Mass Spectrom. 2011, 25, 3131–3145. [Google Scholar] [CrossRef]
- Hastings, J.; Owen, G.; Dekker, A.; Ennis, M.; Kale, N.; Muthukrishnan, V.; Turner, S.; Swainston, N.; Mendes, P.; Steinbeck, C. ChEBI in 2016: Improved services and an expanding collection of metabolites. Nucleic Acids Res. 2016, 44, D1214–D1219. [Google Scholar] [CrossRef]
- Sud, M.; Fahy, E.; Cotter, D.; Brown, A.; Dennis, E.A.; Glass, C.K.; Merrill, A.H.; Murphy, R.C.; Raetz, C.R.H.; Russell, D.W.; et al. LMSD: LIPID MAPS structure database. Nucleic Acids Res. 2007, 35, 527–532. [Google Scholar] [CrossRef] [Green Version]
- Barrientos, R.C.; Zhang, Q. Recent advances in the mass spectrometric analysis of glycosphingolipidome—A review. Anal. Chim. Acta 2020. [Google Scholar] [CrossRef]
- Markham, J.E.; Jaworski, J.G. Rapid measurement of sphingolipids from Arabidopsis thaliana by reversed-phase high-performance liquid chromatography coupled to electrospray ionization tandem mass spectrometry. Rapid Commun. Mass Spectrom. 2007, 21, 1304–1314. [Google Scholar] [CrossRef]
- Blaas, N.; Humpf, H.U. Structural profiling and quantitation of glycosyl inositol phosphoceramides in plants with fourier transform mass spectrometry. J. Agric. Food Chem. 2013, 61, 4257–4269. [Google Scholar] [CrossRef] [PubMed]
- Cacas, J.; Buré, C.; Furt, F.; Maalouf, J.; Badoc, A.; Cluzet, S.; Schmitter, J.; Antajan, E.; Mongrand, S. Biochemical survey of the polar head of plant glycosylinositolphosphoceramides unravels broad diversity. Phytochemistry 2013, 96, 191–200. [Google Scholar] [CrossRef] [PubMed]
- Domon, B.; Costello, C.E. Structure Elucidation of Glycosphingolipids and Gangliosides Using High-Performance Tandem Mass Spectrometry. Biochemistry 1988, 27, 1534–1543. [Google Scholar] [CrossRef] [PubMed]
- Domon, B.; Costello, C.E. A systematic nomenclature for carbohydrate fragmentations in FAB-MS/MS spectra of glycoconjugates. Glycoconj. J. 1988, 5, 397–409. [Google Scholar] [CrossRef]
- Hsu, F.; Turk, J. Glycosphingolipids as Lithiated Adducts by Dissociation on a Triple Stage Quadrupole Instrument. J. Am. Soc. Mass Spectrom. 2001, 12, 61–79. [Google Scholar] [CrossRef] [Green Version]
- Hartler, J.; Triebl, A.; Ziegl, A.; Trötzmüller, M.; Rechberger, G.N.; Zeleznik, O.A.; Zierler, K.A.; Torta, F.; Cazenave-Gassiot, A.; Wenk, M.R.; et al. Deciphering lipid structures based on platform-independent decision rules. Nat. Methods 2017, 14, 1171–1174. [Google Scholar] [CrossRef]
- Markham, J.E.; Li, J.; Cahoon, E.B.; Jaworski, J.G. Separation and Identification of Major Plant Sphingolipid Classes from Leaves. J. Biol. Chem. 2006, 281, 22684–22694. [Google Scholar] [CrossRef] [Green Version]
- Dugo, P.; Cacciola, F.; Kumm, T.; Dugo, G.; Mondello, L. Comprehensive multidimensional liquid chromatography: Theory and applications. J. Chromatogr. A 2008, 1184, 353–368. [Google Scholar] [CrossRef]
- Lísa, M.; Holčapek, M. Triacylglycerols profiling in plant oils important in food industry, dietetics and cosmetics using high-performance liquid chromatography–atmospheric pressure chemical ionization mass spectrometry. J. Chromatogr. A 2008, 1198–1199, 115–130. [Google Scholar] [CrossRef]
- Ovčačíková, M.; Lísa, M.; Cífková, E.; Holčapek, M. Retention behavior of lipids in reversed-phase ultrahigh-performance liquid chromatography–electrospray ionization mass spectrometry. J. Chromatogr. A 2016, 1450, 76–85. [Google Scholar] [CrossRef]
- Hartler, J.; Trötzmüller, M.; Chitraju, C.; Spener, F.; Köfeler, H.C.; Thallinger, G.G. Lipid Data Analyzer: Unattended identification and quantitation of lipids in LC-MS data. Bioinformatics 2011, 27, 572–577. [Google Scholar] [CrossRef] [PubMed] [Green Version]
- LIPID MAPS® Lipidomics Gateway. Available online: https://www.lipidmaps.org/data/LMSDRecord.php?LMID=LMSP03030005 (accessed on 15 March 2020).
- Salek, R.M.; Steinbeck, C.; Viant, M.R.; Goodacre, R.; Dunn, W.B. The role of reporting standards for metabolite annotation and identification in metabolomic studies. Gigascience 2013, 2, 2047-217X-2-13. [Google Scholar] [CrossRef] [PubMed]
- Adams, K.J.; Pratt, B.; Bose, N.; Dubois, L.G.; St. John-Williams, L.; Perrott, K.M.; Ky, K.; Kapahi, P.; Sharma, V.; Maccoss, M.J.; et al. Skyline for Small Molecules: A Unifying Software Package for Quantitative Metabolomics. J. Proteome Res. 2020, 19, 1447–1458. [Google Scholar] [CrossRef] [PubMed]
- Metabolomics Society. Available online: http://metabolomicssociety.org/ (accessed on 14 July 2020).
- Shiva, S.; Enninful, R.; Roth, M.R.; Tamura, P.; Jagadish, K.; Welti, R. An efficient modified method for plant leaf lipid extraction results in improved recovery of phosphatidic acid. Plant Methods 2018, 14, 1–8. [Google Scholar] [CrossRef] [Green Version]
- Peng, B.; Weintraub, S.T.; Coman, C.; Ponnaiyan, S.; Sharma, R.; Tews, B.; Winter, D.; Ahrends, R. A Comprehensive High-Resolution Targeted Workflow for the Deep Profiling of Sphingolipids. Anal. Chem. 2017, 89, 12480–12487. [Google Scholar] [CrossRef] [PubMed]
- Loos, M.; Gerber, C.; Corona, F.; Hollender, J.; Singer, H. Accelerated Isotope Fine Structure Calculation Using Pruned Transition Trees. Anal. Chem. 2015, 87, 5738–5744. [Google Scholar] [CrossRef] [PubMed]
- Koelmel, J.P.; Kroeger, N.M.; Gill, E.L.; Ulmer, C.Z.; Bowden, J.A.; Patterson, R.E.; Yost, R.A.; Garrett, T.J. Expanding Lipidome Coverage Using LC-MS/MS Data-Dependent Acquisition with Automated Exclusion List Generation. J. Am. Soc. Mass Spectrom. 2017, 28, 908–917. [Google Scholar] [CrossRef] [Green Version]
- LDA User Manual. Available online: http://genome.tugraz.at/lda2/2.6/LDA_2.6.pdf (accessed on 17 September 2020).


© 2020 by the authors. Licensee MDPI, Basel, Switzerland. This article is an open access article distributed under the terms and conditions of the Creative Commons Attribution (CC BY) license (http://creativecommons.org/licenses/by/4.0/).
Share and Cite
Panzenboeck, L.; Troppmair, N.; Schlachter, S.; Koellensperger, G.; Hartler, J.; Rampler, E. Chasing the Major Sphingolipids on Earth: Automated Annotation of Plant Glycosyl Inositol Phospho Ceramides by Glycolipidomics. Metabolites 2020, 10, 375. https://doi.org/10.3390/metabo10090375
Panzenboeck L, Troppmair N, Schlachter S, Koellensperger G, Hartler J, Rampler E. Chasing the Major Sphingolipids on Earth: Automated Annotation of Plant Glycosyl Inositol Phospho Ceramides by Glycolipidomics. Metabolites. 2020; 10(9):375. https://doi.org/10.3390/metabo10090375
Chicago/Turabian StylePanzenboeck, Lisa, Nina Troppmair, Sara Schlachter, Gunda Koellensperger, Jürgen Hartler, and Evelyn Rampler. 2020. "Chasing the Major Sphingolipids on Earth: Automated Annotation of Plant Glycosyl Inositol Phospho Ceramides by Glycolipidomics" Metabolites 10, no. 9: 375. https://doi.org/10.3390/metabo10090375