Article

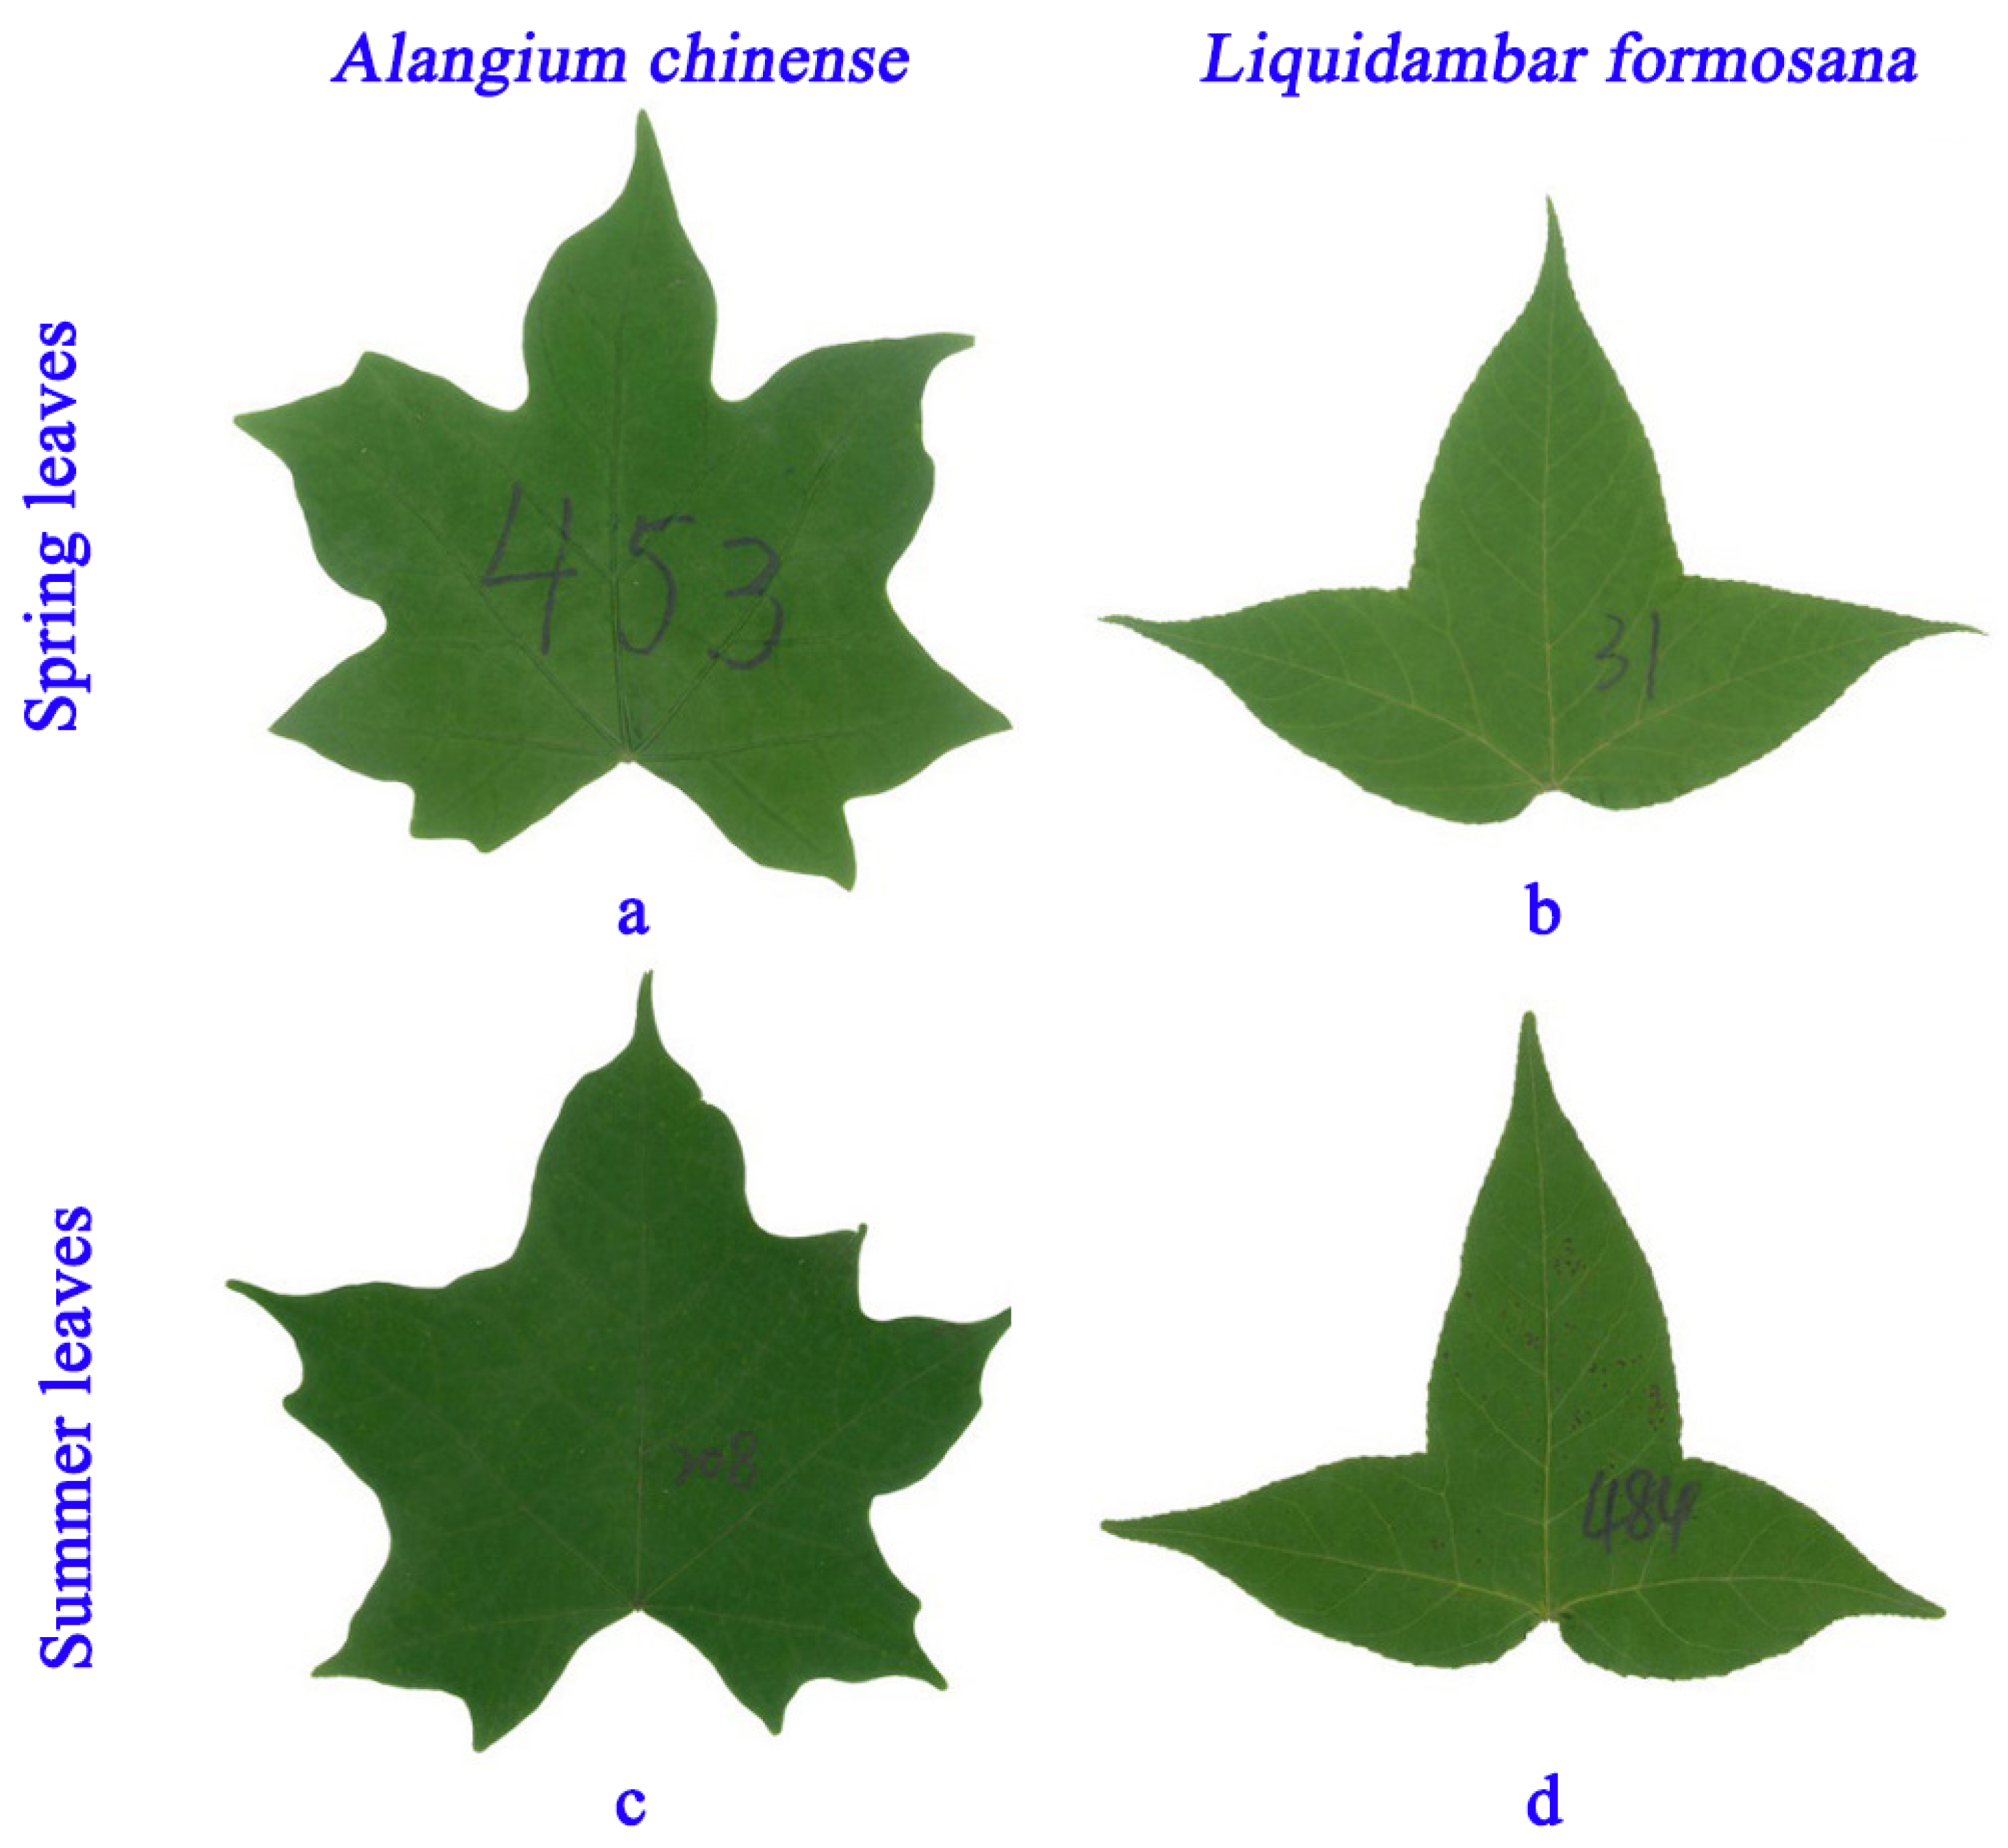
Comparison of the Scaling Relationships of Leaf Biomass versus Surface Area between Spring and Summer for Two Deciduous Tree Species

1
Bamboo Research Institute, College of Biology and the Environment, Nanjing Forestry University, Nanjing 210037, China
2
Plant Biology Section, School of Integrative Plant Science, Cornell University, Ithaca, NY 14853, USA
3
Institute of Agricultural and Environmental Sciences, Estonian University of Life Sciences, 51006 Tartu, Estonia
4
Estonian Academy of Sciences, 10130 Tallinn, Estonia
5
Tropical Silviculture and Forest Ecology, University of Göttingen, Büsgenweg 1, 37077 Göttingen, Germany
*
Author to whom correspondence should be addressed.
Forests 2020, 11(9), 1010; https://doi.org/10.3390/f11091010
Submission received: 4 September 2020 / Revised: 14 September 2020 / Accepted: 16 September 2020 / Published: 20 September 2020
(This article belongs to the Section Forest Ecophysiology and Biology)

Abstract

:
The scaling relationship between either leaf dry or fresh mass (M) and surface area (A) can reflect the photosynthetic potential and efficiency of light harvesting in different broad-leaved plants. In growing leaves, lamina area expansion is typically finished before the completion of leaf biomass accumulation, thereby affecting the M vs. A scaling relationship at different developmental stages of leaves (e.g., young vs. adult leaves). In addition, growing plants can have different-sized leaves at different plant ages, potentially also changing M vs. A scaling. Furthermore, leaf shape can also change during the course of ontogeny and modify the M vs. A scaling relationship. Indeed, the effect of seasonal changes in leaf shape on M vs. A scaling has not been examined in any previous studies known to us. The study presented here was conducted using two deciduous tree species: Alangium chinense (saplings forming leaves through the growing season) and Liquidambar formosana (adult trees producing only one leaf flush in spring) that both have complex but nearly bilaterally symmetrical leaf shapes. We determined (i) whether leaf shapes differed in spring versus summer; (ii) whether the M vs. A scaling relationship varied over time; and (iii) whether there is a link between leaf shape and the scaling exponent governing the M vs. A scaling relationship. The data indicated that (i) the leaf dissection index in spring was higher than that in summer for both species (i.e., leaf-shape complexity decreased from young to adult leaves); (ii) there was a significant difference in the numerical value of the scaling exponent of leaf perimeter vs. area between leaves sampled at the two dates; (iii) spring leaves had a higher water content than summer leaves, and the scaling exponents of dry mass vs. area and fresh mass vs. area were all greater than unity; (iv) the scaling relationship between fresh mass and area was statistically more robust than that between leaf dry mass and area; (v) the scaling exponents of leaf dry and fresh mass vs. area of A. chinense leaves in spring were greater than those in summer (i.e., leaves in younger plants tend to be larger than leaves in older plants), whereas, for the adult trees of L. formosana, the scaling exponent in spring was smaller than that in summer, indicating increases in leaf dry mass per unit area with increasing leaf age; and (vi) leaf shape appears not to be related to the scaling relationship between either leaf dry or fresh mass and area, but is correlated with the scaling exponent of leaf perimeter vs. area (which tends to be a ½ power function). These trends indicate that studies of leaf morphometrics and scaling relationships must consider the influence of seasonality and plant age in sampling of leaves and the interpretation of data.

1. Introduction

The morphometrics of leaves make a substantial contribution to light capture, gas exchange, and temperature regulation [1]. Leaf size, which can be quantified by lamina area, tissue volume, and dry (and fresh) mass, is a particularly influential functional trait [2]. Indeed, changes of leaf size can change leaf energy balances and influence the distribution of leaf biomass between support and photosynthetic tissues [3]. Previous studies have reported that differences in leaf size can affect whole plant biomass distribution patterns and the efficiency of light capture [4,5,6]. The relationship between either leaf dry or fresh mass (M) and area (A) can be described by a power law taking the form M = βAα, where β is the normalization constant and α is the scaling exponent [7,8]. Many studies have confirmed that the numerical value of the scaling exponents governing M vs. A relationship is greater than unity [9,10,11,12,13], i.e., increases in A fail to keep pace with increases in M, a phenomenon referred to as “diminishing returns” [9]. Thus, in general, larger leaf areas require disproportionately greater investments in biomass, which limits the maximum leaf size when other growth conditions are the same [14].
An important consideration is ontogenetic changes in the functional traits of leaves produced over the course of a growing season, particularly in perennial species [15,16]. In light of data concerning leaf dry mass per unit area (LMA), the growth of the leaves of deciduous plants can be partitioned into three periods (1) spring leaf development (up to late May); (2) summer, in which leaves are fully expanded (up to early September); and (3) autumn leaf senescence [17]. Although these three periods do not exactly match calendar months because of year-to-year variability in climate, they provide a useful template for considering the development of leaves of broad-leaved deciduous species. Previous research has shown that leaf functional traits can exhibit considerable seasonal variation [18]. For example, there are seasonal differences in photosynthetic capacity and leaf water use efficiency during the three periods [17,18,19]. Such variation is important because most previous studies have dealt with data collected during a single time during the growing season [20,21,22,23,24]. Thus, the extent to which functional traits (or the relationship among traits) in plants are directly affected by developmental changes over the course of seasonal phenology are often neglected [25,26,27].
Leaf traits also change between developmental stages in deciduous and evergreen perennials. Previous studies have reported a decrease in leaf photosynthetic rates with increasing tree size and age for conifers [28,29,30,31], and the photosynthetic capacity (expressed per unit dry mass) of the leaves of broad-leaved tree saplings can be greater than that of mature trees [32,33], although not always [34]. Previous studies have also found that the thickness, LMA, nitrogen content, and cellulose and hemicellulose concentrations are lower in the leaves of adult trees compared to those produced during early stages of growth [35,36,37], whereas lignin content is higher [38,39]. These and other studies have mainly focused on the physiological and anatomical structure of leaves, and showed that during growth and development, strategies of resource utilization can change significantly. Jagodziński et al. [40] found significant seasonal variation in total leaf area and specific leaf area (SLA) for 12 species of understory herbaceous plants in deciduous forests of Central Europe from 19 April 2013 to 4 October 2013 in two-week intervals, and they speculated that light availability rather than light use efficiency was more important for the generative propagation of the plants considering that the SLA values of flowering individuals were lower than those of vegetative individuals. It is apparent that the variation in leaf functional traits of the understory herbs is subject to the seasonal (temporal) change in spatial arrangement of the upper canopies of trees.
Another factor requiring consideration is leaf shape, which can vary during leaf growth and development, and during plant ontogeny as well as among diverse species. For example, the leaves of the newly germinated saplings of Broussonetia papyrifera begin to divaricate to different degrees as a function of leaf position on the stem [41]. Such changes in leaf shape are known to affect the scaling relationship of leaf dry mass vs. surface area [42]. However, it is still unknown whether seasonal changes in leaf shape cause changes in the scaling relationships between leaf dry and fresh mass and leaf surface area.
In this study, we examined the functional traits of the leaves produced by the saplings of Alangium chinense (Lour.) Harms and the adult trees of Liquidambar formosana Hance. These two species were selected because of their complex leaf shapes (Figure 1) and because preliminary observations indicated that leaves collected in the spring and in the summer differ in a number of potentially significant ways. We focused on the relationship between lamina fresh and dry mass, area, and perimeter to address (i) whether leaf shape systematically changes with time; (ii) whether the scaling relationships of leaf dry and fresh biomass vs. area differ over time; and (iii) whether there is a link between leaf shape and the scaling exponents of leaf dry and fresh mass vs. area.

2. Materials and Methods

2.1. Leaf Sampling

The leaves of A. chinense and L. formosana (Figure 1) were collected in spring and summer (21 April and 31 July 2019) from healthy specimens growing in the Nanjing Forestry University campus (China Nanjing, Jiangsu Province, 32°4′47″ N, 118°49′2″ E). The leaves of A. chinense were obtained from saplings with a diameter at breast height (DBH) of 2 to 7 cm; the leaves of L. formosana were obtained from adult trees with a DBH of 30 to 50 cm. The spatial distributions of leaf size and shape of plants are usually not homogenous. Thus, we sampled leaves in the middle canopy of each tree. However, the mean of a special leaf functional trait (e.g., leaf area, LMA) of sun leaves is likely different from that of shade leaves even though both leaves grow in the middle canopy but in different positions of branches. To reduce the effect of leaf position on leaf functional traits, a large sample size was used to represent the general trends of the functional traits. More than 400 leaves were randomly collected from 5–10 healthy individuals of each species from the middle canopy without distinguishing sun leaves and shade leaves between 8 a.m. and 9 a.m. Four leaves were placed in plastic self-sealing bags (28 cm × 20 cm) to avoid leaf shrinking and water loss, and immediately taken to the laboratory for measurements.

2.2. Traits Measurements of Leaf Functional Traits

Lamina fresh mass was measured using an electric balance (Type: ML 204; Mettler Toledo Company, Greifensee, Switzerland; measurement accuracy 0.0001 g). Laminae were subsequently scanned to bitmap images at a 600 dpi resolution using a scanner (Type: Aficio MP 7502; Ricoh, Tokyo, Japan). After scanning, leaves were placed into Kraft paper envelopes (33 cm × 24 cm), and dried in an oven (Type: XMTD-8222; Jinghong Experimental Equipment Co., Ltd., Shanghai, China) at 105 °C for two hours and then continuously at 80 °C until achieving a constant dry mass. Dry mass was measured with the Mettler Toledo ML 204 electronic balance. The scanned leaf images were processed by Adobe Photoshop CC (version: 14.0) to obtain black-white bitmaps of the lamina edge. The planar coordinates of leaf edges were obtained using an M-file based on MATLAB (version 2009a) developed by Shi et al. [43]. Leaf perimeter and area were calculated using an R script (R version 4.0.2) [44] developed by Shi et al. [43] and Su et al. [45]. All the data were tabulated in Table S1 in the online Supplementary Materials.

2.3. Statistical Methods
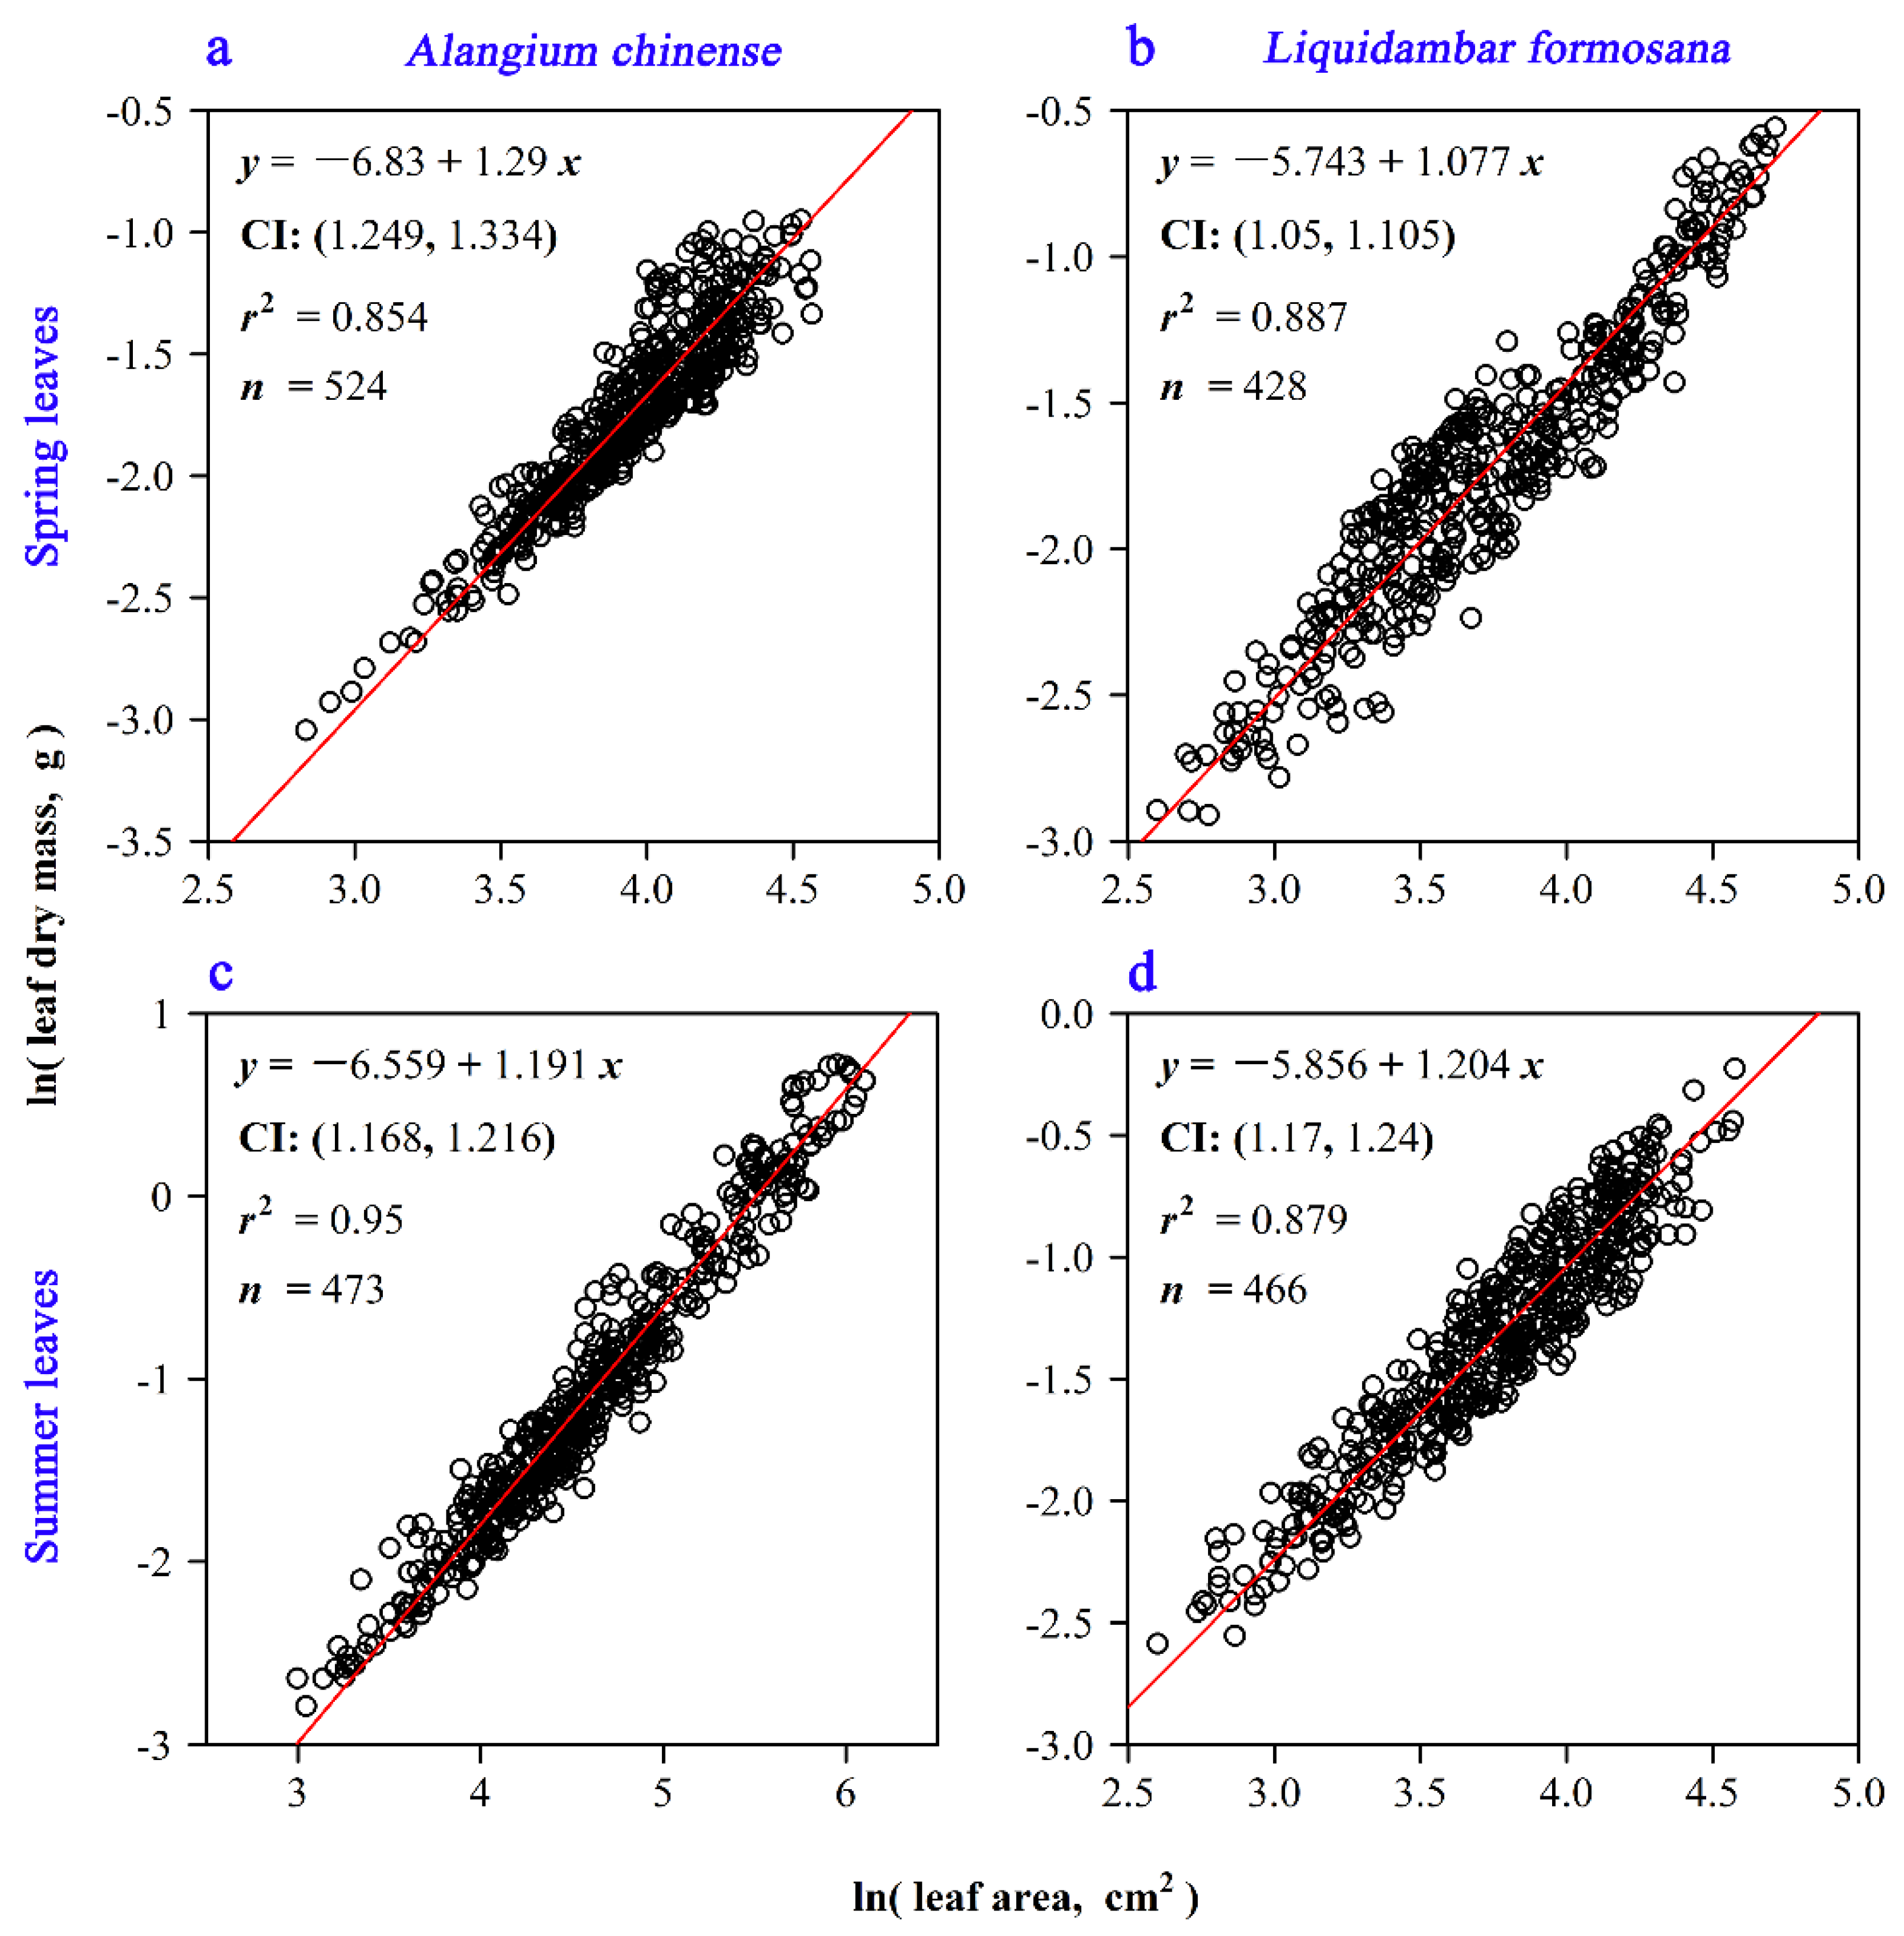
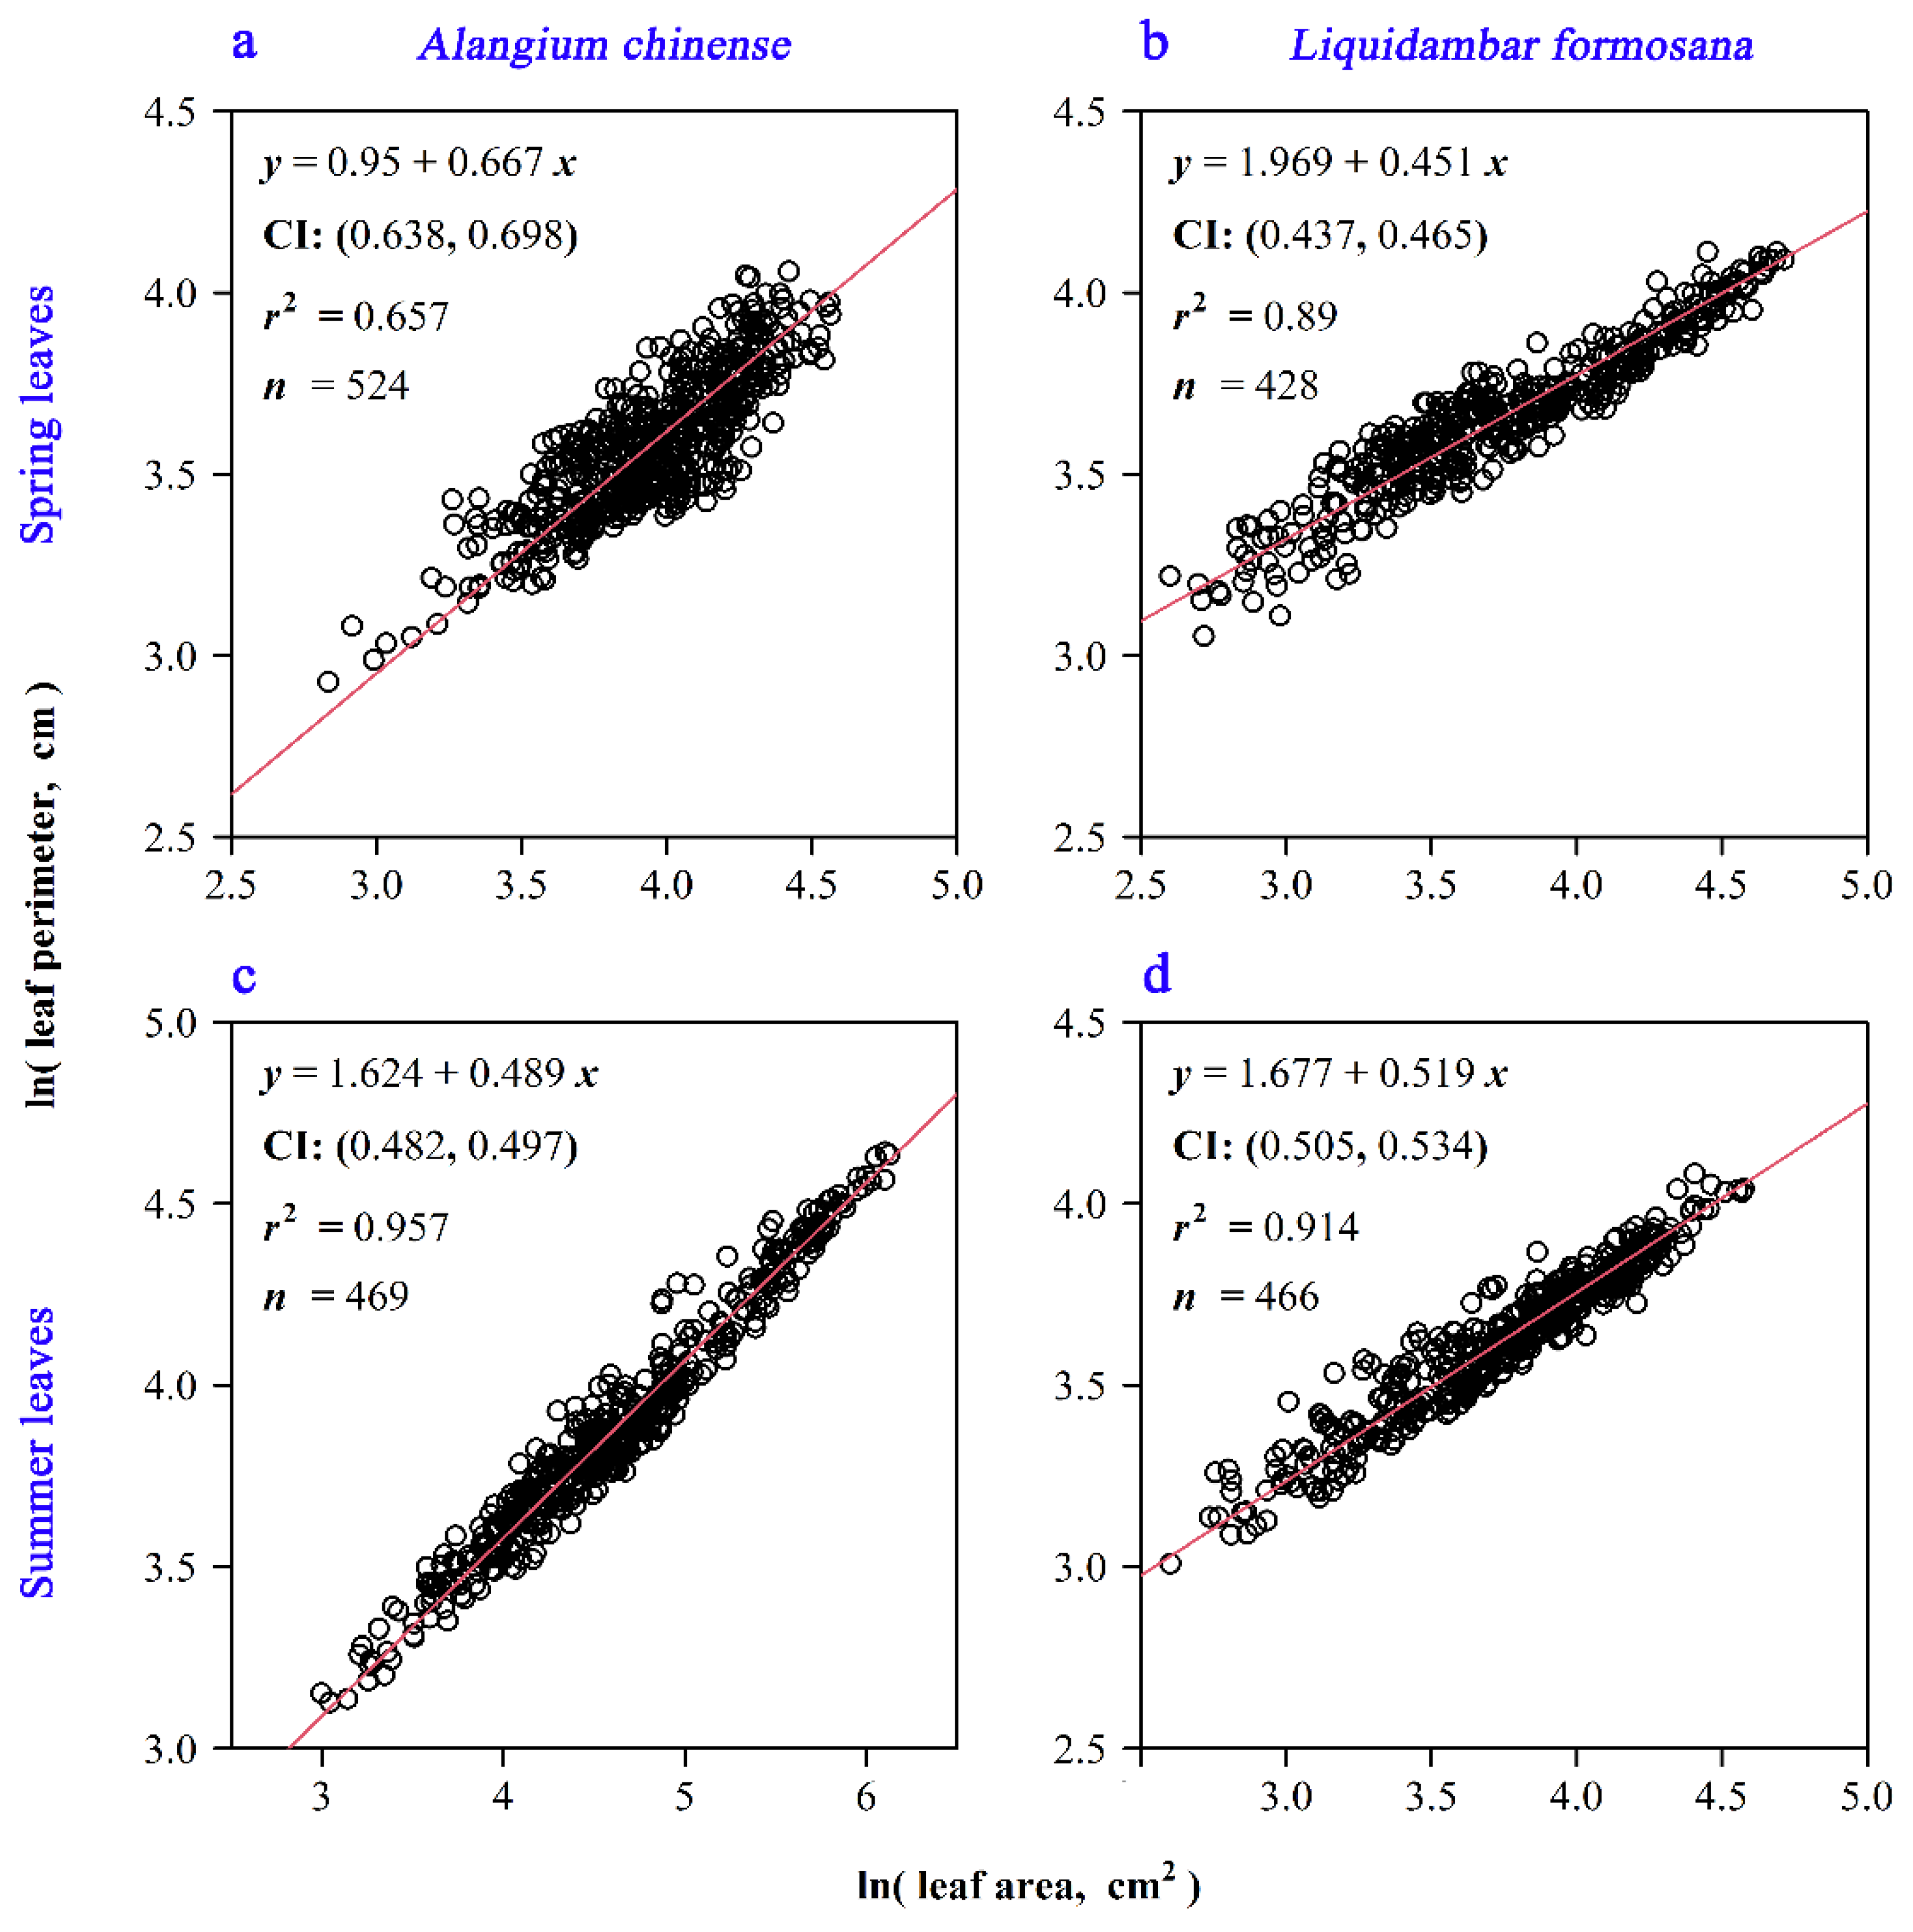
The leaf dissection index (DI) [46,47] was used to determine the extent of leaf complexity:
DI = P 2 π A
where P is leaf perimeter, and A is lamina surface area.
The relationships between any two interdependent variables of interest (e.g., lamina dry and fresh mass, M, and surface area, A) were statistically well described by means of power-law functions taking the form
Y 1 = β Y 2 α
where Y1 and Y2 are any two interdependent variables of interest (e.g., A and M), β is the normalization constant, and α is the scaling exponent [7,9].
In order to stabilize variance, Equation (2) was log-transformed to obtain the linearized formula
y = γ + α x
where y = ln(Y1), γ = ln(β), and x = ln(Y2). Reduced major axis regression protocols were used to estimate γ and α [9,14,48]. The bootstrap percentile method was used to compare the significance of the difference in the numerical values of the scaling exponents of Y1 vs. Y2 relationships between juvenile and mature leaves (and also the two species) [49,50]. All statistical analyses were executed using R software (version 4.0.2; R Core Tem 2020).
The Tukey’s Honestly Significant Difference test [51] at a 0.05 significance level was used to test whether there is a significant difference in leaf dissection index, leaf fresh mass, leaf dry mass, leaf surface area, the quotient of leaf dry mass and fresh mass, and leaf dry mass per unit area (LMA) among the four datasets (two species × two seasons). The Tukey’s HSD test was executed using the special package “agricolae” (version 1.3-3) based on R software (version 4.0.2) [44].

3. Results

The leaf dissection index (see Equation (1)) of A. chinense was between 1.0 and 2.0, whereas that of L. formosana was between 1.5 and 2.5 (Figure 2a), i.e., the leaf dissection of L. formosana was more pronounced than that of A. chinense. The leaf dissection index in spring was higher than that in summer for both species, i.e., the complexity of leaf shape decreased from young to mature leaves. There were significant differences in leaf fresh mass, dry mass, and area between spring and summer for A. chinense (datasets 1 and 2 in Figure 2b–d). However, except for leaf dry mass, there were no significant differences in fresh mass and area between spring and summer L. formosana leaves (datasets 3 and 4 in Figure 2b–d).
The ratio (more precisely, the quotient) of dry mass to fresh mass of spring leaves for each of the two species was significantly smaller than that of summer leaves, i.e., spring leaves had higher relative water contents than summer leaves (Figure 2e). The LMA values of A. chinense were between 20 and 60 g∙m−2 (datasets 1 and 2 in Figure 2f). There was no significant difference in LMA between spring and summer leaves, indicating that the leaves of young plants expand in area in both spring and summer (which would enhance the capacity for light interception by increasing lamina area). The LMA values of L. formosana fell within the range of 20 to 100 g∙m−2, and there was a significant difference in LMA between spring and summer leaves. The mean LMA value of summer leaves was greater than that of spring leaves, indicating that summer leaves of adult plants have a higher cost for leaf expansion than spring leaves.
An approximately proportional relationship between leaf dry mass and fresh mass was observed for each species, based on the numerical value of the scaling exponent describing the leaf dry mass vs. fresh mass scaling relationship (Figure 3). The numerical values of the scaling exponents of dry mass vs. fresh mass were all approximately one, i.e., the scaling exponents were approximately isometric rather than strongly allometric. For the saplings of A. chinense, the summer leaves had a statistically stronger linear relationship between dry and fresh mass than the spring leaves (Figure 3a,c). For the adult trees of L. formosana, the spring leaves had a statistically stronger linear relationship than the summer leaves (Figure 3b,d).
The scaling exponents of leaf fresh mass vs. surface area and leaf dry mass vs. surface area exceeded unity in all cases (Figure 4 and Figure 5). Thus, the data were consistent with the hypothesis of “diminishing returns.” However, the exponents of the leaf fresh mass vs. surface area scaling relationship were numerically smaller than those of the leaf dry mass vs. surface area scaling relationship. In addition, there was a statistically stronger linear relationship between fresh mass and area than that between dry mass and area. With the exception of the data for the leaves of A. chinense collected in the spring, all of the coefficients of determination for perimeter vs. area scaling relationships exceeded 0.88 (Figure 6), i.e., the scaling relationship between perimeter and area was statistically very strong. In addition, the scaling exponents of leaf perimeter vs. area for leaves collected in the summer were approximately equal to 0.5 compared to the exponents of leaves collected in the spring (Figure 6c,d vs. Figure 6a,b). Thus, leaf area tends to be proportional to the square of the perimeter of the lamina in mature leaves (see also Figure 2a).

4. Discussion

4.1. Cost-Benefit Considerations for Lamina Expansion

The allocation of leaf biomass to whole plant biomass is closely related to plant ecological strategies, growth rate, and reproduction [52]. Leaf dry mass represents the investment in leaf construction (largely attributable to the requirements for mechanical support and xylem/phloem hydraulics), whereas leaf area reflects light harvesting potential. Previous studies have shown that increases in leaf dry mass tend to exceed increases in leaf area, a phenomenon called “diminishing returns” [9,10,11,13,53]. Our results are consistent with this phenomenon. However, they also indicate that this phenomenon is influenced by seasonality and plant age. The scaling exponents for the biomass (for both fresh and dry mass) vs. area relationships for the leaves A. chinense saplings are numerically higher in spring compared to summer, whereas those of the leaves of adult L. formosana plants are higher in the summer than in the spring. These differences indicate that, at least for these two species, juvenile plants (A. chinense saplings) invest more biomass in the construction of early leaves compared to leaves produced later in the growing season, whereas the reverse is true for the leaves of adult L. formosana plants.
Although the data are limited, the trends reported here are also consistent with other reports, particularly in the context of LMA, which is an important leaf functional trait [54], because it plays a central role in plant ecological strategies [55]. Jurik [56] studied the temporal and spatial patterns of LMA for adult deciduous hardwood tree species in natural habitats in northern lower Michigan, USA, and found that the LMA values of deciduous trees were higher after budding, decreased rapidly during leaf expansion, and increased rapidly after leaf expansion had finished. Our results confirm this pattern. The LMA values of adult L. formosana leaves are higher than those of the saplings of A. chinense and the data indicate that the LMA values of the saplings during leaf expansion are almost constant. This is consistent with the idea that the growth strategy of saplings is to increase the investment in leaf area regardless of the cost in investing mechanically supporting tissues. According to previous studies [9,14], the estimated scaling exponents of leaf dry mass vs. area for most plants are greater than unity. LMA is the quotient of leaf dry mass and leaf area, so it is usually an increasing function of leaf area. This means that with leaf area expanding the costs for supporting leaf structure and achieving its functions (e.g., developing economic and efficient venation patterns, and investing more energy to main veins) are rising even faster, which may inhibit its further growth after exceeding a trade-off point between the support cost and the benefits leaf size confers. LMA actually reflects the boundary that a special plant type can reach to maximize the benefits from the photosynthesis based on the current leaf size and structure that are usually influenced by biotic (e.g., the interspecific and intraspecific competition, and the challenges by herbivores and diseases) and abiotic factors (e.g., temperature and drought). There is some evidence to demonstrate that LMA largely varies with different plant sizes, and trees are likely to have higher LMA values than aquatic plants, ferns, herbs, grasses, and deciduous shrubs [57]. A. chinense saplings can be regarded as a typical shrub, its LMA value is significantly smaller than that of adult L. formosana plants (Figure 2f). This implies that plants with low biomass might tend to invest more energy to leaves for improving their competitive ability relative to the plants with large biomass but low population density, which is reflected by a low LMA value [58].

4.2. Leaf Shape and the Scaling of Leaf Biomass vs. Area

One factor affecting the relationship between leaf biomass and area is leaf shape. Leaf shape is strongly related to vascular venation patterns and thus the allocation of leaf biomass between supporting and photosynthetic tissues [59,60]. For example, Shi et al. [58] studied four species of dwarf bamboos (Indocalamus sp.) and found that the bamboo with the widest leaves had the largest ratio of fresh mass to surface area. Lin et al. [42] reported that leaf shape, defined as leaf width/length, has a significant effect on the scaling exponent of leaf dry mass vs. area based on 101 bamboo taxa. The larger the quotient of the width and length, the smaller the scaling exponent of leaf dry mass vs. area. With increasing width/length, the scaling exponent tends to decrease toward unity. Thus, the width/length of the lamina essentially reflects the allocation of dry mass to the acropetal pattern of mechanical tissue investment [2]. However, our results differ from this trend. The data reported here indicate that the scaling relationships between dry mass and area and between fresh mass and area are not affected by the leaf shapes of A. chinense and L. formosana. This disparity may be due to the fact that the width/length ratios of these two species are not strongly related to the position of mass center along the leaf lamina. Additional research is required to resolve this issue.
The ratio of leaf perimeter to area is often used as a proxy to describe leaf shape [61]. Yu et al. [12] studied the relationships between leaf perimeter and area for 12 Rosaceae species and found that 10 of the 12 scaling exponents of leaf perimeter vs. area fell between 0.4 and 0.6. Similarly, Shi et al. [47] reported that the scaling exponents of leaf perimeter vs. area for 15 species of vines fell within the range of 0.45 to 0.60. These results indicate that leaf perimeter tends to be proportional to the square root of the area. The current study supports this contention based on the data for the leaves of A. chinense and L. formosana (see Figure 6). The data also show that the complexity of leaf shape tends to decrease gradually from young leaves to fully mature leaves (Figure 2e), and the corresponding scaling exponents of leaf perimeter vs. area change from values deviating from 0.5 to those converging to 0.5 (Figure 6).
Leaf growth consists of two parts: an increase in area as the result of cell multiplication and increase in volume, and an increase in thickness and dry matter accumulation [62]. Turgor pressure that is maintained by water flux provides the main mechanism for cell expansion, whereas the addition of carbon (and attending changes in cell wall rheological properties) account for the increase in leaf dry matter. Importantly, leaf water content and dry matter do not increase proportionally with increasing leaf size [9], i.e., the scaling exponent of leaf dry mass vs. fresh mass is not equal. In this context, Huang et al. [11,63] reported that the goodness of fit for the scaling relationship between leaf fresh mass and area exceeds that of between leaf dry mass and area, and thus suggest that leaf fresh mass is a better predictor than leaf dry mass when studying the scaling relationship of leaf surface area. Our study further supports this conclusion both when considering the species level relationships and the relationships for different-aged leaves and plants.

4.3. The Limitations and Extensions of the Current Research Results

The current study has two limitations: (i) a limited number of species; (ii) a single study site belonging to an artificial landscape. However, we think that it is not a fatal flaw to carry out the experiment at the same site. If trees grow in the wild (e.g., trees in natural forest communities rather than in an artificial landscape), the seasonal variation and leaf scaling might be largely affected by other biotic factors (e.g., light availability [40,64]), and the changes cannot completely reflect their survival strategies. The Wild trees in fierce interspecific and intraspecific competition are more likely to interact with other individuals and other species [65]. Several abiotic factors can also affect such a seasonal variation in leaf functional traits, e.g., storms and dry seasons [66]. As a result, leaf functional traits are unambiguously compromises with these influences. However, on the campus, the trees grow in low density, and light is sufficient. The difference in light interception for a tree is mainly influenced by the aboveground architecture of branches and leaf arrangement [67]. The continuous growth of trees in the area can be directly divided to two simple seasonal treatments: spring for leaf fast expansion (after which there is more time for plants to grow) and summer for leaf maturation (after which plants have limited time to grow and have to weigh the benefits from increasing leaf area against the potential loss for the forthcoming leaf falling in autumn). It is surely better to use more homogeneous sites that have the same two tree species with similar ages and in the same environment, but it is difficult to find similar experimental sites with the two tree species in practice. However, it would be possible to study two similar species with different age groups or better two age groups of the same tree species under natural and artificial landscapes. We believe that our results for the leaf scaling should apply to plants with low population density under an artificial landscape where the external limitations (e.g., the lack of light, soil nutrients, water, and the feeding of herbivores, etc.,) play weak roles in the process of leaf formation and growth. However, for trees growing in their natural state, leaf functional traits and leaf scaling might be different. Thus, whether the current results can be extended to other broad-leaved plants growing in artificial and natural environments deserves further study.

5. Conclusions

The data presented here indicate that the complexity of leaf shape decreases from young to fully mature leaves for both A. chinense and L. formosana, i.e., there is a significant scaling relationship between leaf perimeter and area for each species, and the scaling exponent changes from a numerical value largely deviating from 0.5 in spring to a numerical value close to 0.5 in summer (the shape of fully mature leaves is less complex than the shape of young and juvenile leaves). In the case of young trees, summer leaves have a smaller scaling exponent for leaf dry mass vs. area compared with spring leaves, which may confer faster growth to young trees via increasing leaf area). In the case of adult trees, summer leaves have a larger scaling exponent governing leaf dry mass vs. area compared to the scaling exponent of spring leaves. These results indicate that future studies of leaf biomass and area investments need to consider the influence of leaf shape and seasonality when investigating scaling relationships.

Supplementary Materials

The following are available online at https://www.mdpi.com/1999-4907/11/9/1010/s1, Table S1. Raw data of leaf measures.

Author Contributions

K.J.N. and P.S. designed this experiment; M.L. and L.C. carried out the experiment; M.L. wrote the initial draft, and K.J.N., Ü.N., D.H., and P.S. commented on and revised the manuscript. All authors have read and agreed to the published version of the manuscript.

Funding

This research received no external funding.

Acknowledgments

We thank the two anonymous reviewers and the academic editor for their invaluable comments on the earlier version of this manuscript.

Conflicts of Interest

The authors declare no conflict of interest.

References

  1. Chitwood, D.H.; Sinha, N.R. Evolutionary and environmental forces sculpting leaf development. Curr. Biol. 2016, 26, R297–R306. [Google Scholar] [CrossRef] [Green Version]
  2. Niinemets, Ü.; Portsmuth, A.; Tena, D.; Tobias, M.; Matesanz, S.; Valladares, F. Do we underestimate the importance of leaf size in plant economics? Disproportional scaling of support costs within the spectrum of leaf physiognomy. Ann. Bot. 2007, 100, 283–303. [Google Scholar] [CrossRef] [PubMed]
  3. Niinemets, Ü.; Portsmuth, A.; Tobias, M. Leaf size modifies support biomass distribution among stems, petioles and mid ribs in temperate plants. New Phytol. 2006, 171, 91–104. [Google Scholar] [CrossRef] [PubMed]
  4. Ackerly, D.; Knight, C.; Weiss, S.; Barton, K.; Starmer, K. Leaf size, specific leaf area and microhabitat distribution of chaparral woody plants, contrasting patterns in species level and community level analyses. Oecologia 2002, 130, 449–457. [Google Scholar] [CrossRef]
  5. Knight, C.A.; Ackerly, D.D. Evolution and plasticity of photosynthetic thermal tolerance, specific leaf area and leaf size: Congeneric species from desert and coastal environments. New Phytol. 2003, 160, 337–347. [Google Scholar] [CrossRef] [Green Version]
  6. Wright, I.J.; Leishman, M.R.; Read, C.; Westoby, M. Gradients of light availability and leaf traits with leaf age and canopy position in 28 Australian shrubs and trees. Funct. Plant. Biol. 2006, 33, 407–419. [Google Scholar] [CrossRef] [PubMed] [Green Version]
  7. Niklas, K.J. Plant Allometry, the Scaling of Form and Process; The University of Chicago Press: Chicago, IL, USA, 1994; 412p. [Google Scholar]
  8. West, G.B.; Brown, J.H.; Enquist, B.J. A general model for the origin of allometric scaling laws in biology. Science 1997, 276, 122–126. [Google Scholar] [CrossRef]
  9. Niklas, K.J.; Cobb, E.D.; Niinemets, Ü.; Reich, P.B.; Sellin, A.; Shipley, B.; Wright, I.J. “Diminishing returns” in the scaling of functional leaf traits across and within species groups. Proc. Natl. Acad. Sci. USA 2007, 104, 8891–8896. [Google Scholar] [CrossRef] [Green Version]
  10. Sun, J.; Fan, R.R.; Niklas, K.J.; Zhong, Q.L.; Yang, F.C.; Li, M.; Chen, X.P.; Sun, M.K.; Cheng, D.L. “Diminishing returns” in the scaling of leaf area vs. dry mass in Wuyi Mountain bamboos, Southeast China. Am. J. Bot. 2017, 104, 993–998. [Google Scholar] [CrossRef] [Green Version]
  11. Huang, W.W.; Su, X.F.; Ratkowsky, D.A.; Niklas, K.J.; Gielis, J.; Shi, P.J. The scaling relationships of leaf biomass vs. leaf surface area of 12 bamboo species. Glob. Ecol. Conserv. 2019, 20, e00793. [Google Scholar] [CrossRef]
  12. Yu, X.J.; Hui, C.; Sandhu, H.S.; Lin, Z.Y.; Shi, P.J. Scaling relationships between leaf shape and area of 12 Rosaceae species. Symmetry 2019, 11, 1255. [Google Scholar] [CrossRef] [Green Version]
  13. Shi, P.J.; Li, Y.R.; Hui, C.; Ratkowsky, D.A.; Yu, X.J.; Niinemets, Ü. Does the law of diminishing returns in leaf scaling apply to vines–Evidence from 12 species of climbing plants. Glob. Ecol. Conserv. 2020, 21, e00830. [Google Scholar] [CrossRef]
  14. Milla, R.; Reich, P.B. The scaling of leaf area and mass, the cost of light interception increases with leaf size. Proc. Roy. Soc. B Biol. Sci. 2007, 274, 2109–2115. [Google Scholar] [CrossRef] [PubMed] [Green Version]
  15. Milla, R.; Reich, P.B.; Niinemets, Ü.; Castro, D.P. Environmental and developmental controls on specific leaf area are little modified by leaf allometry. Funct. Ecol. 2008, 22, 565–576. [Google Scholar] [CrossRef]
  16. McKown, A.D.; Guy, R.D.; Azam, M.S.; Drewes, E.C.; Quamme, L.K. Seasonality and phenology alter functional leaf traits. Oecologia 2013, 172, 653–665. [Google Scholar] [CrossRef] [PubMed]
  17. Grassi, G.; Vicinelli, E.; Ponti, F.; Cantoni, L.; Magnani, F. Seasonal and interannual variability of photosynthetic capacity in relation to leaf nitrogen in a deciduous forest plantation in northern Italy. Tree Physiol. 2005, 25, 349–360. [Google Scholar] [CrossRef]
  18. Niinemets, Ü.; Kull, O.; Tenhunen, J.D. Within canopy variation in the rate of development of photosynthetic capacity is proportional to integrated quantum flux density in temperate deciduous trees. Plant. Cell. Environ. 2004, 27, 293–313. [Google Scholar] [CrossRef]
  19. Stokes, V.J.; Morecroft, M.D.; Morison, J.L. Comparison of leaf water use efficiency of oak and sycamore in the canopy over two growing seasons. Trees. Struct. Funct. 2010, 24, 297–306. [Google Scholar] [CrossRef] [Green Version]
  20. Wright, I.J.; Reich, P.B.; Westoby, M.; Ackerly, D.D.; Baruch, Z.; Bongers, F.; Cavender-Bares, J.; Chapin, T.; Cornelissen, J.C.; Diemer, M.; et al. The worldwide leaf economics spectrum. Nature 2004, 428, 821–827. [Google Scholar] [CrossRef]
  21. Wright, I.J.; Dong, N.; Maire, V.; Prentice, I.C.; Westoby, M.; Díaz, S.; Gallagher, R.V.; Jacobs, B.F.; Kooyman, R.; Law, E.A.; et al. Global climatic drivers of leaf size. Science 2017, 357, 917–921. [Google Scholar] [CrossRef] [Green Version]
  22. Funk, J.L.; Cornwell, W.K. Leaf traits within communities, context may affect the mapping of traits to function. Ecology 2013, 94, 1893–1897. [Google Scholar] [CrossRef] [PubMed]
  23. Li, L.; McCormack, M.L.; Ma, C.; Kong, D.; Zhang, Q.; Chen, X.Y.; Zeng, H.; Niinemets, Ü.; Guo, D.L. Leaf economics and hydraulic traits are decoupled in five species-rich tropical-subtropical forests. Ecol. Lett. 2015, 18, 899–906. [Google Scholar] [CrossRef] [PubMed]
  24. Midolo, G.; De, F.P.; Hölzel, N.; Wellstein, C. Global patterns of intraspecific leaf trait responses to elevation. Glob. Chang. Biol. 2019, 25, 2485–2498. [Google Scholar] [CrossRef] [PubMed]
  25. Ackerly, D.D. Adaptation, niche conservatism, and convergence: Comparative studies of leaf evolution in the California chaparral. Am. Nat. 2004, 163, 654–671. [Google Scholar] [CrossRef] [PubMed]
  26. Grime, J.P. Trait convergence and trait divergence in herbaceous plant communities, mechanisms and consequences. J. Veg. Sci. 2006, 17, 255–260. [Google Scholar] [CrossRef]
  27. Pau, S.; Wolkovich, E.M.; Cook, B.I.; Davies, T.J.; Kraft, N.J.; Bolmgren, K.; Betancourt, J.L.; Cleland, E.E. Predicting phenology by integrating ecology, evolution and climate science. Glob. Chang. Biol. 2011, 17, 3633–3643. [Google Scholar] [CrossRef]
  28. Niinemets, Ü. Stomatal conductance alone does not explain the decline in foliar photosynthetic rates with increasing tree age and size in Picea abies and Pinus sylvestris. Tree Physiol. 2002, 22, 515–535. [Google Scholar] [CrossRef] [Green Version]
  29. Martínez, V.J.; Vanderklein, D.; Mencuccini, M. Tree height and age-related decline in growth in Scots pine (Pinus sylvestris L.). Oecologia 2007, 150, 529–544. [Google Scholar] [CrossRef]
  30. Greenwood, M.S.; Ward, M.H.; Day, M.E.; Adams, S.L.; Bond, B.J. Age-related trends in red spruce foliar plasticity in relation to declining productivity. Tree Physiol. 2008, 28, 225–232. [Google Scholar] [CrossRef]
  31. Drake, J.E.; Raetz, L.M.; Davis, S.C.; Delucia, E.H. Hydraulic limitation not declining nitrogen availability causes the age−related photosynthetic decline in loblolly pine (Pinus taeda L.). Plant. Cell. Environ. 2010, 33, 1756–1766. [Google Scholar] [CrossRef]
  32. Thomas, S.C.; Winner, W.E. Photosynthetic differences between saplings and adult trees, an integration of field results by meta-analysis. Tree Physiol. 2002, 22, 117–127. [Google Scholar] [CrossRef] [PubMed]
  33. Ishida, A.; Yazaki, K.; Hoe, A.L. Ontogenetic transition of leaf physiology and anatomy from seedlings to mature trees of a rain forest pioneer tree, Macaranga gigantea. Tree Physiol. 2005, 25, 513–522. [Google Scholar] [CrossRef] [PubMed]
  34. Steppe, K.; Niinemets, Ü.; Teskey, R.O. Tree size and age related changes in leaf physiology and their influence on carbon gain. In Size- and Age-Related Changes in Tree Structure and Function; Meinzer, F.C., Dawson, T., Lachenbruch, B., Eds.; Springer: Berlin, Germany, 2011; pp. 235–253. [Google Scholar]
  35. Kolb, T.E.; Stone, J.E. Differences in leaf gas exchange and water relations among species and tree sizes in an Arizona pine-oak forest. Tree Physiol. 2000, 20, 1–12. [Google Scholar] [CrossRef] [PubMed]
  36. Palow, D.T.; Nolting, K.; Kitajima, K. Functional trait divergence of juveniles and adults of nine I nga species with contrasting soil preference in a tropical rain forest. Funct. Ecol. 2012, 26, 1144–1152. [Google Scholar] [CrossRef]
  37. Sendall, K.M.; Reich, P.B. Variation in leaf and twig CO2 flux as a function of plant size: A comparison of seedlings, saplings and trees. Tree Physiol. 2013, 33, 713–729. [Google Scholar] [CrossRef]
  38. Niinemets, Ü. Energy requirement for foliage construction depends on tree size in young Picea abies trees. Trees. Struct. Funct. 1997, 11, 420–431. [Google Scholar]
  39. Mediavilla, S.; Herranz, M.; González, Z.P.; Escudero, A. Ontogenetic transition in leaf traits: A new cost associated with the increase in leaf longevity. J. Plant. Ecol. 2014, 7, 567–575. [Google Scholar] [CrossRef] [Green Version]
  40. Jagodziński, A.M.; Dyderski, M.K.; Rawlik, K.; Kątna, B. Seasonal variability of biomass, total leaf area and specific leaf area of forest understory herbs reflects their life strategies. For. Ecol. Manag. 2016, 374, 71–81. [Google Scholar] [CrossRef]
  41. Seelenfreund, D.; Clarke, A.C.; Oyanedel, N.; Piña, R.; Lobos, S.; Matisoo, E.A.; Seelenfreund, A. Paper mulberry (Broussonetia papyrifera) as a commensal model for human mobility in Oceania: Anthropological, botanical and genetic considerations. N. Z. J. Bot. 2010, 48, 231–247. [Google Scholar] [CrossRef]
  42. Lin, S.Y.; Niklas, K.J.; Wan, Y.J.; Hölscher, D.; Hui, C.; Ding, Y.L.; Shi, P.J. Leaf shape influences the scaling of leaf dry mass vs. area: A test case using bamboos. Ann. For. Sci. 2020, 77, 11. [Google Scholar] [CrossRef] [Green Version]
  43. Shi, P.; Ratkowsky, D.A.; Li, Y.; Zhang, L.; Lin, S.; Gielis, J. General leaf-area geometric formula exists for plants—Evidence from the simplified Gielis equation. Forests 2018, 9, 714. [Google Scholar] [CrossRef] [Green Version]
  44. R Core Team. R: A Language and Environment for Statistical Computing; R Foundation for Statistical Computing: Vienna, Austria, 2015. [Google Scholar]
  45. Su, J.L.; Niklas, K.J.; Huang, W.W.; Yu, X.J.; Yang, Y.Y.; Shi, P.J. Lamina shape does not correlate with lamina surface area, An analysis based on the simplified Gielis equation. Glob. Ecol. Conserv. 2019, 19, 2351–9894. [Google Scholar] [CrossRef]
  46. Kincaid, D.T.; Schneider, R.B. Quantification of leaf shape with a microcomputer and Fourier transform. Can. J. Bot. 1983, 61, 2333–2342. [Google Scholar] [CrossRef]
  47. Shi, P.J.; Niinemets, Ü.; Hui, C.; Niklas, K.J.; Yu, X.J.; Hölscher, D. Leaf bilateral symmetry and the scaling of the perimeter vs. the surface area in 15 vine species. Forests 2020, 11, 246. [Google Scholar] [CrossRef] [Green Version]
  48. Smith, R.J. Use and misuse of the reduced major axis for line fitting. Am. J. Phys. Anthropol. 2009, 140, 476–486. [Google Scholar] [CrossRef]
  49. Efron, B.; Tibshirani, R.J. An Introduction to the Bootstrap; Chapman and Hall: New York, NY, USA, 1993; Volume 57, p. 456. [Google Scholar]
  50. Sandhu, H.S.; Shi, P.J.; Kuang, X.J.; Xue, F.S.; Ge, F. Applications of the bootstrap to insect physiology. Fla. Entomol. 2011, 94, 1036–1041. [Google Scholar] [CrossRef]
  51. Hsu, J.C. Multiple Comparisons, Theory and Methods; Chapman and Hall: New York, NY, USA, 1996; p. 277. [Google Scholar]
  52. Yan, X.H.; He, C.L.; Zhou, B.; Wang, N.; Yin, Z.F. Biomass distribution and allometric analysis of Bidens frondosa relative to growth stage. J. Ecol. Rur. Environ. 2017, 33, 150–158. [Google Scholar]
  53. Li, G.Y.; Yang, D.M.; Sun, S.C. Allometric relationships between lamina area, lamina mass and petiole mass of 93 temperate woody species vary with leaf habit, leaf form and altitude. Funct. Ecol. 2008, 22, 557–564. [Google Scholar] [CrossRef]
  54. Witkowski, E.; Lamont, B.B. Leaf specific mass confounds leaf density and thickness. Oecologia 1991, 88, 486–493. [Google Scholar] [CrossRef]
  55. Westoby, M.; Falster, D.S.; Moles, A.T.; Vesk, P.A.; Wright, I.J. Plant ecological strategies: Some leading dimensions of variation between species. Annu. Rev. Ecol. Evol. Syst. 2002, 33, 125–159. [Google Scholar] [CrossRef] [Green Version]
  56. Jurik, T.W. Temporal and spatial patterns of specific leaf weight in successional northern hardwood tree species. Am. J. Bot. 1986, 73, 1083–1092. [Google Scholar] [CrossRef]
  57. Poorter, H.; Niinemets, Ü.; Poorter, L.; Wright, I.J.; Villar, R. Causes and consequences of variation in leaf mass per area (LMA): A meta-analysis. New Phytol. 2009, 182, 565–588. [Google Scholar] [CrossRef] [PubMed]
  58. Shi, P.J.; Xu, Q.; Sandhu, H.S.; Gielis, J.; Ding, Y.L.; Li, H.R.; Dong, X.B. Comparison of dwarf bamboos (Indocalamus sp.) leaf parameters to determine relationship between spatial density of plants and total leaf area per plant. Ecol. Evol. 2015, 5, 4578–4589. [Google Scholar] [CrossRef] [PubMed]
  59. Niklas, K.J. The evolution of leaf form and function. In Leaf Development and Canopy Growth; Marshall, B., Roberts, J.A., Eds.; Scheffield Academic Press: Scheffield, UK, 2000; pp. 1–35. [Google Scholar]
  60. Niinemets, Ü.; Portsmuth, A.; Tobias, M. Leaf shape and venation pattern alter the support investments within leaf lamina in temperate species, a neglected source of leaf physiological differentiation? Funct. Ecol. 2007, 21, 28–40. [Google Scholar] [CrossRef]
  61. Royer, D.L.; McElwain, J.C.; Adams, J.M.; Wilf, P. Sensitivity of leaf size and shape to climate within Acer rubrum and Quercus kelloggii. New Phytol. 2008, 179, 808–817. [Google Scholar] [CrossRef] [PubMed]
  62. Walter, A.; Silk, W.K.; Schurr, U. Environmental effects on spatial and temporal patterns of leaf and root growth. Annu. Rev. Plant. Biol. 2009, 60, 279–304. [Google Scholar] [CrossRef]
  63. Huang, W.W.; Ratkowsky, D.A.; Hui, C.; Wang, P.; Su, J.L.; Shi, P.J. Leaf fresh weight versus dry weight, which is better for describing the scaling relationship between leaf biomass and leaf area for broad-leaved plants. Forests 2019, 10, 256. [Google Scholar] [CrossRef] [Green Version]
  64. Paź-Dyderska, S.; Dydersik, M.K.; Nowak, K.; Jagodziński, A.M. On the sunny side of the crown–quantification of intra-canopy SLA variation among 179 taxa. For. Ecol. Manag. 2020, 472, 118254. [Google Scholar] [CrossRef]
  65. Shi, P.J.; Gao, J.; Song, Z.P.; Liu, Y.H.; Hui, C. Spatial segregation facilitates the coexistence of tree species in temperate forests. Forests 2018, 9, 768. [Google Scholar] [CrossRef] [Green Version]
  66. Jimenez-Rodríguez, D.L.; Alvarez-Añorve, M.Y.; Pineda-Cortes, M.; Flores-Puerto, J.I.; Benítez-Malvido, J.; Oyama, K.; Avila-Cabadilla, L.D. Structural and functional traits predict short term response of tropical dry forests to a high intensity hurricane. For. Ecol. Manag. 2018, 374, 101–114. [Google Scholar] [CrossRef]
  67. Küppers, M. Ecological significance of above-ground architectural patterns in woody plants: A question of cost-benefit relationships. Trends Ecol. Evol. 1989, 4, 375–379. [Google Scholar] [CrossRef]
Figure 1. Representative leaves of the two species of deciduous broad-leaved trees: (a,b) spring leaves, (c,d) summer leaves.
Forests 11 01010 g001
Figure 2. Comparisons of leaf traits between the two deciduous broad-leaved species including: (a) leaf dissection index, (b) leaf fresh mass, (c) leaf dry mass, (d) leaf area, (e) leaf dry mass/fresh mass, and (f) leaf dry mass per unit area. Dataset codes 1 and 2 represent the spring and summer leaves of Alangium chinense, respectively; dataset codes 3 and 4 represent the spring and summer leaves of Liquidambar formosana, respectively. The lower and upper edges of each box represent the first and third quartiles of the data, respectively. The lower whisker’s end point of each box represents the 1.5-fold difference between the third and first quartiles below the lower edge of the box if there are low outliners; otherwise, it represents the minimum value of the data. The upper whisker’s end point of each box represents the 1.5-fold difference between the third and first quartiles above the upper edge of the box if there are high outliners; otherwise, it represents the maximum value of the data. The numbers above the whiskers represent the coefficients of variation (%). In each panel, the same letters represent non-significant differences between any two means for the data of interest (P > 0.05) based on the Tukey’s HSD test, while different letters represent significant differences (P < 0.05). The horizontal solid lines represent the medians, and the filled circles within each box represent the means. The sample size (n) information for the six panels are the same.
Forests 11 01010 g002
Figure 3. Scaling relationships between leaf dry mass and fresh mass of the two species. Panels (a,b) represent spring leaves of A. chinense and L. formosana; panels (c,d) represent summer leaves of A. chinense and L. formosana. In each panel, y represents the natural logarithm of leaf dry mass in g; x represents the natural logarithm of leaf fresh mass in g; CI represents the 95% confidence interval of the slope; r2 is the coefficient of determination that is used to indicate the goodness of fit of the linear fitting; and n represents the number of sampled leaves.
Forests 11 01010 g003
Figure 4. Scaling relationships between leaf fresh mass and area of the two species. Panels (a,b) represent spring leaves of A. chinense and L. formosana; panels (c,d) represent summer leaves of A. chinense and L. formosana. y represents the natural logarithm of leaf fresh mass in g; x represents the natural logarithm of leaf area in cm2; CI represents the 95% confidence interval of the slope; r2 is the coefficient of determination that is used to indicate the goodness of fit of the linear fitting; and n is the number of sampled leaves.
Forests 11 01010 g004
Figure 5. Scaling relationships between leaf dry mass and area for the two species. Panels (a,b) represent spring leaves of A. chinense and L. formosana; panels (c,d) represent summer leaves of A. chinense and L. formosana. In each panel, y represents the natural logarithm of leaf dry mass in g; x represents the natural logarithm of leaf area in cm2; CI represents the 95% confidence interval of the slope; r2 is the coefficient of determination that is used to indicate the goodness of fit of the linear fitting; and n represents the number of sampled leaves.
Forests 11 01010 g005
Figure 6. Scaling relationships between leaf perimeter and area for the two species. Panels (a,b) represent spring leaves of A. chinense and L. formosana; panels (c,d) represent summer leaves of A. chinense and L. formosana. In each panel, y represents the natural logarithm of leaf perimeter in cm; x represents the natural logarithm of leaf area in cm2; CI represents the 95% confidence interval of the slope; r2 is the coefficient of determination that is used to indicate the goodness of fit of the linear fitting; and n represents the number of sampled leaves.
Forests 11 01010 g006

