Article

Recent and Rapid Radiation of the Highly Endangered Harlequin Frogs (Atelopus) into Central America Inferred from Mitochondrial DNA Sequences

by
Juan P. Ramírez
1,2,
César A. Jaramillo
3,4,5,
Erik D. Lindquist
6,
Andrew J. Crawford
1,3,5 and
Roberto Ibáñez
3,5,7,8,*
1
Department of Biological Sciences, Universidad de los Andes, Calle 19 No. 1-60, Bogotá 111711, Colombia
2
Department of Biology, San Diego State University, San Diego, CA 92182, USA
3
Círculo Herpetológico de Panamá, Apartado 0824-00122, Panama
4
Departamento de Histología y Neuroanatomía Humana, Facultad de Medicina, Universidad de Panamá, Apartado 0824-03366, Panama
5
Smithsonian Tropical Research Institute, Apartado 0843-03092, Panama
6
Department of Biological Sciences, Messiah University, Mechanicsburg, PA 17055, USA
7
Sistema Nacional de Investigación, SENACYT, Apartado 0816-02852, Panama
8
Departamento de Zoología, Universidad de Panamá, Apartado 0824-03366, Panama
*
Author to whom correspondence should be addressed.
Diversity 2020, 12(9), 360; https://doi.org/10.3390/d12090360
Submission received: 21 August 2020 / Revised: 12 September 2020 / Accepted: 15 September 2020 / Published: 18 September 2020
(This article belongs to the Special Issue Systematics and Conservation of Neotropical Amphibians and Reptiles)

Abstract

:
Populations of amphibians are experiencing severe declines worldwide. One group with the most catastrophic declines is the Neotropical genus Atelopus (Anura: Bufonidae). Many species of Atelopus have not been seen for decades and all eight Central American species are considered “Critically Endangered”, three of them very likely extinct. Nonetheless, the taxonomy, phylogeny, and biogeographic history of Central American Atelopus are still poorly known. In this study, the phylogenetic relationships among seven of the eight described species in Central America were inferred based on mitochondrial DNA sequences from 103 individuals, including decades-old museum samples and two likely extinct species, plus ten South American species. Among Central American samples, we discovered two candidate species that should be incorporated into conservation programs. Phylogenetic inference revealed a ladderized topology, placing species geographically furthest from South America more nested in the tree. Model-based ancestral area estimation supported either one or two colonization events from South America. Relaxed-clock analysis of divergence times indicated that Atelopus colonized Central America prior to 4 million years ago (Ma), supporting a slightly older than traditional date for the closure of the Isthmus. This study highlights the invaluable role of museum collections in documenting past biodiversity, and these results could guide future conservation efforts. An abstract in Spanish (Resumen) is available as supplementary material.

Graphical Abstract

1. Introduction

Amphibians are experiencing a global conservation crisis, with an estimated 41 to 50% of species suffering population declines [1,2,3]. These declines are likely the result of interactions among several factors of primarily anthropic origin, including overexploitation, habitat destruction, pollution, and the effects of emerging epizootic pathogens [4]. The most alarming cause of global declines and extinctions of amphibians is chytridiomycosis, a disease caused by the chytrid fungus, Batrachochytrium dendrobatidis (Bd) [5,6].
Harlequin frogs of the genus Atelopus (Anura: Bufonidae) have arguably suffered the most dramatic population declines and extinctions of any diverse genus of amphibians. Because of their diurnal habits, bright coloration, and previously high local abundance, species of this genus were a prominent element of many Neotropical communities until about 35 years ago [7,8,9]. Since the late 1980’s, the majority of species of Atelopus have not been seen in their historic localities [10]. These declines were likely driven by Bd, and Atelopus are known to be highly susceptible to chytridiomycosis [11,12]. Declines of Atelopus and other amphibian species have been considered to be most severe in populations at higher elevations (above 1000 m above sea level) [13], hypothetically because the lower temperatures present at higher altitudes are associated with higher levels of infectivity and fecundity in Bd [14].
The eight species of Central American Atelopus are no exception to these patterns of endangerment and decline. These forest species have a very similar natural history, in which reproduction is associated with fast-flowing streams where eggs are laid in the water and tadpoles develop ([15], pers. obs.). The only exception is the scarcely known A. chirripoensis from the Costa Rican páramo which breeds in small ponds [16]. Central American Atelopus were once abundant members of amphibian communities at certain localities, particularly during their breeding season ([15,16], pers. obs.). Currently, all eight are listed as Critically Endangered by the International Union for Conservation of Nature (IUCN) and the three species restricted to elevations above 1000 m (A. chiriquiensis, A. chirripoensis, and A. senex [17]) are considered possibly extinct [18]. The much reduced populations of the remaining five species have been prioritized for ex situ conservation through captive breeding programs in Panama and abroad [19,20]. Atelopus zeteki is endemic to central Panama and it has not been seen in the wild since 2009. Individuals were collected before the epizootic declines, however, and this species is maintained in a well-managed captive breeding program [21]. The four species still found in the wild, A. varius of Costa Rica and Panama, plus A. certus, A. glyphus, and A. limosus of eastern Panama, are being reared in captivity by the Panama Amphibian Rescue and Conservation Project [22,23].
The success of ex situ conservation programs depends on having a complete and robust taxonomy, because correct delimitation and identification of species (1) allows a more efficient use of resources by avoiding the unnecessary protection of taxonomically invalid species [24], (2) can prevent neglecting previously unrecognized species in conservation programs [25], and (3) helps to avoid the ex situ generation of hybrids possibly maladapted to the environments inhabited by their parental species [26]. However, the taxonomy of Central American Atelopus is still incompletely resolved. Most species have been evaluated only based on characteristics of adult external morphology, and coloration pattern has been given special importance, even though it has been found that in Atelopus this character is not always concordant with genetic differentiation [27,28]. Additionally, the phylogenetic relationships of the species of Atelopus in Central America are drastically understudied, because only three species have been included in any published molecular phylogenies of the genus [10,28,29].
Given that Central American Atelopus seem to have a South American origin [10], understanding their phylogenetic relationships and historical biogeography could shed light on the timing of the closure of the Isthmus of Panama and its effect on animal lineages moving between continents. The term Great American Biotic Interchange (GABI) is sometimes used to refer to the massive interchange of mammalian lineages starting around 2.7 million years ago (Ma) [30]. Here, however, we use the term more broadly to refer to any exchange of fauna or flora between North and South America during the Neogene and Quaternary periods (cf. [31]). How the GABI relates temporally to the final geological completion of the Isthmus of Panama is a controversial topic, because the traditional date of roughly 3 Ma [32,33] has been challenged recently by Montes et al. [34] on geological evidence, and by Bacon et al. [35] on DNA sequence data, who propose a much older closing of the Isthmus around 15–10 Ma. In turn, O’Dea et al. [36] charged both studies with biased data collection and erroneous interpretation, and the controversy continues. Nonetheless, DNA sequence studies on amphibians and reptiles are often supportive of a closure date older than 3 Ma (e.g., [37,38,39]). In this work, the phylogenetic relationships of the species of Atelopus of Central America are estimated from mitochondrial DNA sequence data in order to evaluate the current taxonomic status of populations and species, as well as to investigate the number and timing of colonization events between South America and Central America.

2. Materials and Methods
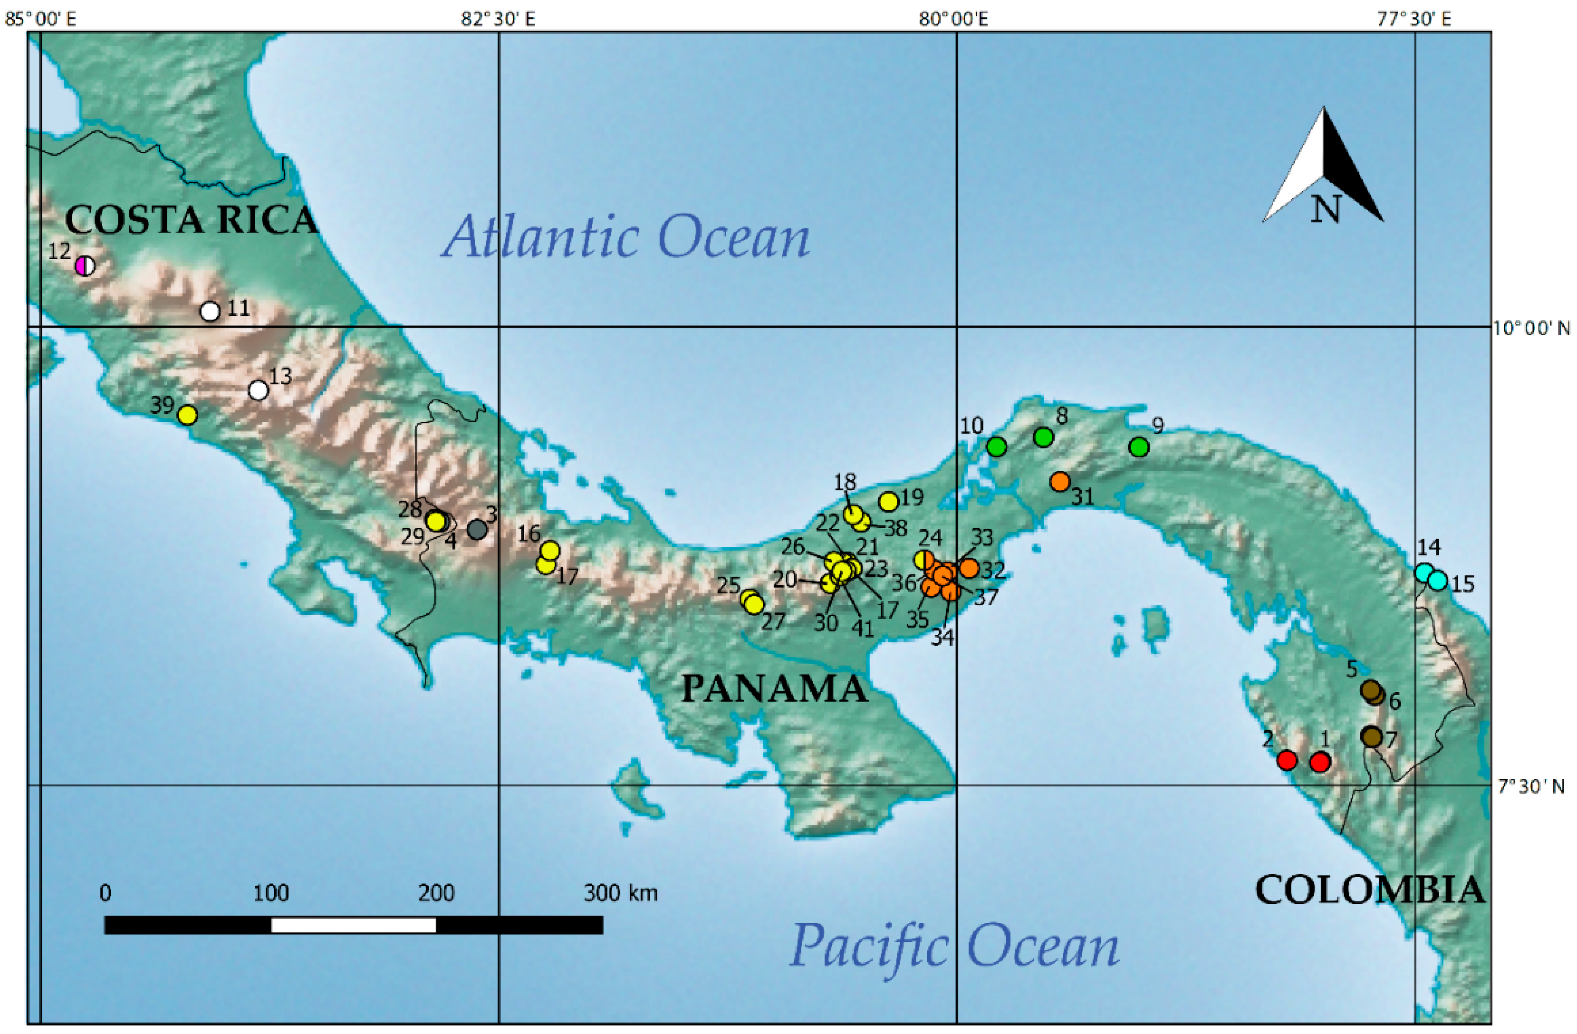
2.1. Sampling

The character data generated for this study consisted of mitochondrial DNA sequences from 103 individuals of Central American Atelopus (Figure 1) plus congeneric samples of individuals from Colombia, representing A. elegans, and A. laetissimus. Samples included toe-clips and tissue samples from vouchered specimens, including many tissue loans from natural history museum collections. DNA sequence data from an additional eight South American species of Atelopus were obtained from GenBank to evaluate the possible monophyly of Central American samples, including data from A. cf. spumarius, A. flavescens, A. cf. hoogmoedi, A. nanay, A. peruensis, A. pulcher, A. epikheistos, and A. bomolochos. As outgroup to the genus Atelopus, we included additional GenBank sequence data representing the bufonids Bufo gargarizans minshanicus, B. japonicus, B. stejnegeri, Duttaphrynus melanostictus, Anaxyrus boreas, and Bufotes viridis. See Supplementary Table S1.

2.2. Molecular Laboratory Protocols

Genomic DNA was extracted using a standard phenol-chloroform procedure. A 714-base pair (bp) fragment of cytochrome b (cyt b) was amplified with the primers CB1 (5′-CCATCCAACATCTCAGCATGATGAAA-3′) and CB3 (5′-GGCGAATAGGAAGTATCATTC-3′ [40]). A 639-bp fragment of the 3′ end of cytochrome oxidase I (COI) was amplified using the primers COIf (5′-CCTGCAGGAGGAGGAGAYCC-3′) and COIa (5′-AGTATAAGCGTCTGGGTAGTC-3′ [41]). PCR, DNA sequencing, and contig assembly protocols followed those of Crawford et al. [42]. As no internal gaps were inferred, sequences were aligned by eye and no premature codons were found when translating inferred codons with the software Mesquite version 3.10 [43].

2.3. Phylogenetic Analyses

Phylogenetic inference was performed on the concatenated 2-gene data set totaling 1353 bp using maximum parsimony (MP), maximum likelihood (ML), and Bayesian criteria. The software PAUP∗, version 4.0a149 for Windows [44] was used for heuristic tree searching under MP inference, based on 5000 replicate searches (each from random starting trees) with both the MaxTrees command and the rearrangement limit on each tree set to 100,000. These search conditions were repeated five additional times to evaluate the completeness of each search by counting the number of novel most-parsimonious trees obtained per each additional run. In total, 97 equally parsimonious trees were obtained as a result, which differed only slightly in terms of branch lengths and phylogenetic position of some highly similar samples of Atelopus senex, A. varius, A. zeteki, and A. glyphus.
The software PartitionFinder 2 [45] was used to simultaneously select the best-fit partition scheme and corresponding substitution models according to the Bayesian Information Criterion (BIC) and using the greedy algorithm of Lanfear et al. [46]. We assumed a maximum of six possible partitions across the concatenated data matrix (i.e., by gene and by codon). The resulting partition scheme and models are presented in Table S2. Posteriorly, a total of 300 independent tree searches (i.e., three runs with hundred replicates each) were conducted using GARLI version 2.01 [47] on the Cyberinfrastructure for Phylogenetic Research (CIPRES) online platform [48], maintaining the search parameter values as default.
For MP and ML analyses we assessed statistical support of branches via 1000 non-parametric bootstrap replicates [49]. MP bootstrapping was done in PAUP∗, with 30 tree searches performed on each character matrix generated by sampling with replacement, and with other search parameters as above. For ML bootstrapping in GARLI, 1000 pseudo-replicates distributed in twenty runs of 50 independent searches each were run on CIPRES, again maintaining the parameter values as default.
Bayesian phylogenetic analysis (BA) using reversible-jump Markov chain Monte Carlo (rjMCMC) was performed with BEAST 2 version 4.8 [50], as implemented in the CIPRES portal, and using the based substitution model implemented in the RBS package of BEAST 2 [50,51]. The posterior distribution of trees including dates and rates was estimated by assuming a relaxed normal clock model of evolution and a birth-death tree prior (a diversification model that considers both speciation and extinction [52]). The prior on substitution rate assumed a normal distribution with a mean of 0.00957 (i.e., 0.957%) and standard deviation of 0.0010 per lineage per million years. The mean was based on the mitochondrial substitution rate of Macey et al. [53], obtained from mitochondrial protein-coding genes in Eurasian toads of the genus Bufo, as corrected by Crawford [54]. The prior distribution of other parameters were not modified from their default values. Bayesian rjMCMC analyses were run for 100 million generations, saving one sampled tree per 1000 generations and with the first 10% of trees discarded as burn-in. Stationarity and mixing of the log-likelihood values and parameter estimates were evaluated with Tracer version 1.7 [55]. We confirmed that all parameters estimated from the post-burn-in set of trees had effective sample sizes > 200. The resulting set of trees was summarized with TreeAnnotator 2.4.8, part of the BEAST 2 package.

2.4. Biogeographic Analyses

To determine the number and direction of colonizations between South America and Central America, we inferred ancestral areas using a model-based approach assuming the BA tree trimmed to one sample per species (including unconfirmed candidate species, see below). The R-package ‘BioGeoBEARS’ [56,57] was used to evaluate the fit of six biogeographical models (DEC, DEC-J, DIVA, DIVA-J, BAYAREA-LIKE, BAYAREALIKE-J) to our data based on the corrected Akaike information criterion (AICc). The model recovered as having the best fit was then used for conducting the ancestral area estimation, again using ‘BioGeoBEARS’. Species of Atelopus were coded as being from either Central America or South America, with the dividing line assumed to be the Uramita fault that runs parallel to the Atrato River in Chocó, Colombia [34].

2.5. Pairwise Genetic Distances

The genetic distances between sequences of each gene among all samples were estimated with the software MEGA version 7 [58], assuming a Kimura 2-parameter model of sequence evolution (K2P [59]). Default values were retained for all parameters. Sites with ambiguous or missing bases were removed only in pairwise comparisons. An unconfirmed candidate species was identified as a reciprocally monophyletic clade recovered in the BA consensus tree that had a genetic distance from its sister clades larger than the minimum genetic distances between other named sister species (2.08% or 2.44% in COI or cyt b, respectively). Even though the genetic distance cut-offs used herein may seem low in comparison to those used for other frogs and for different loci (e.g., 3% for the case of the 16S ribosomal RNA gene and 10% for the barcode fragment of COI [60,61]), they allow defining clades that mostly correspond to the species recognized by the current taxonomy of the genus in Central America.

3. Results

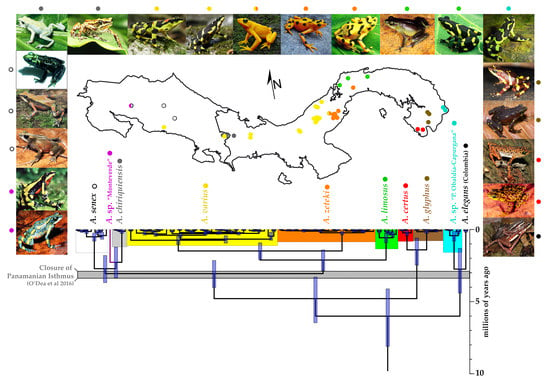
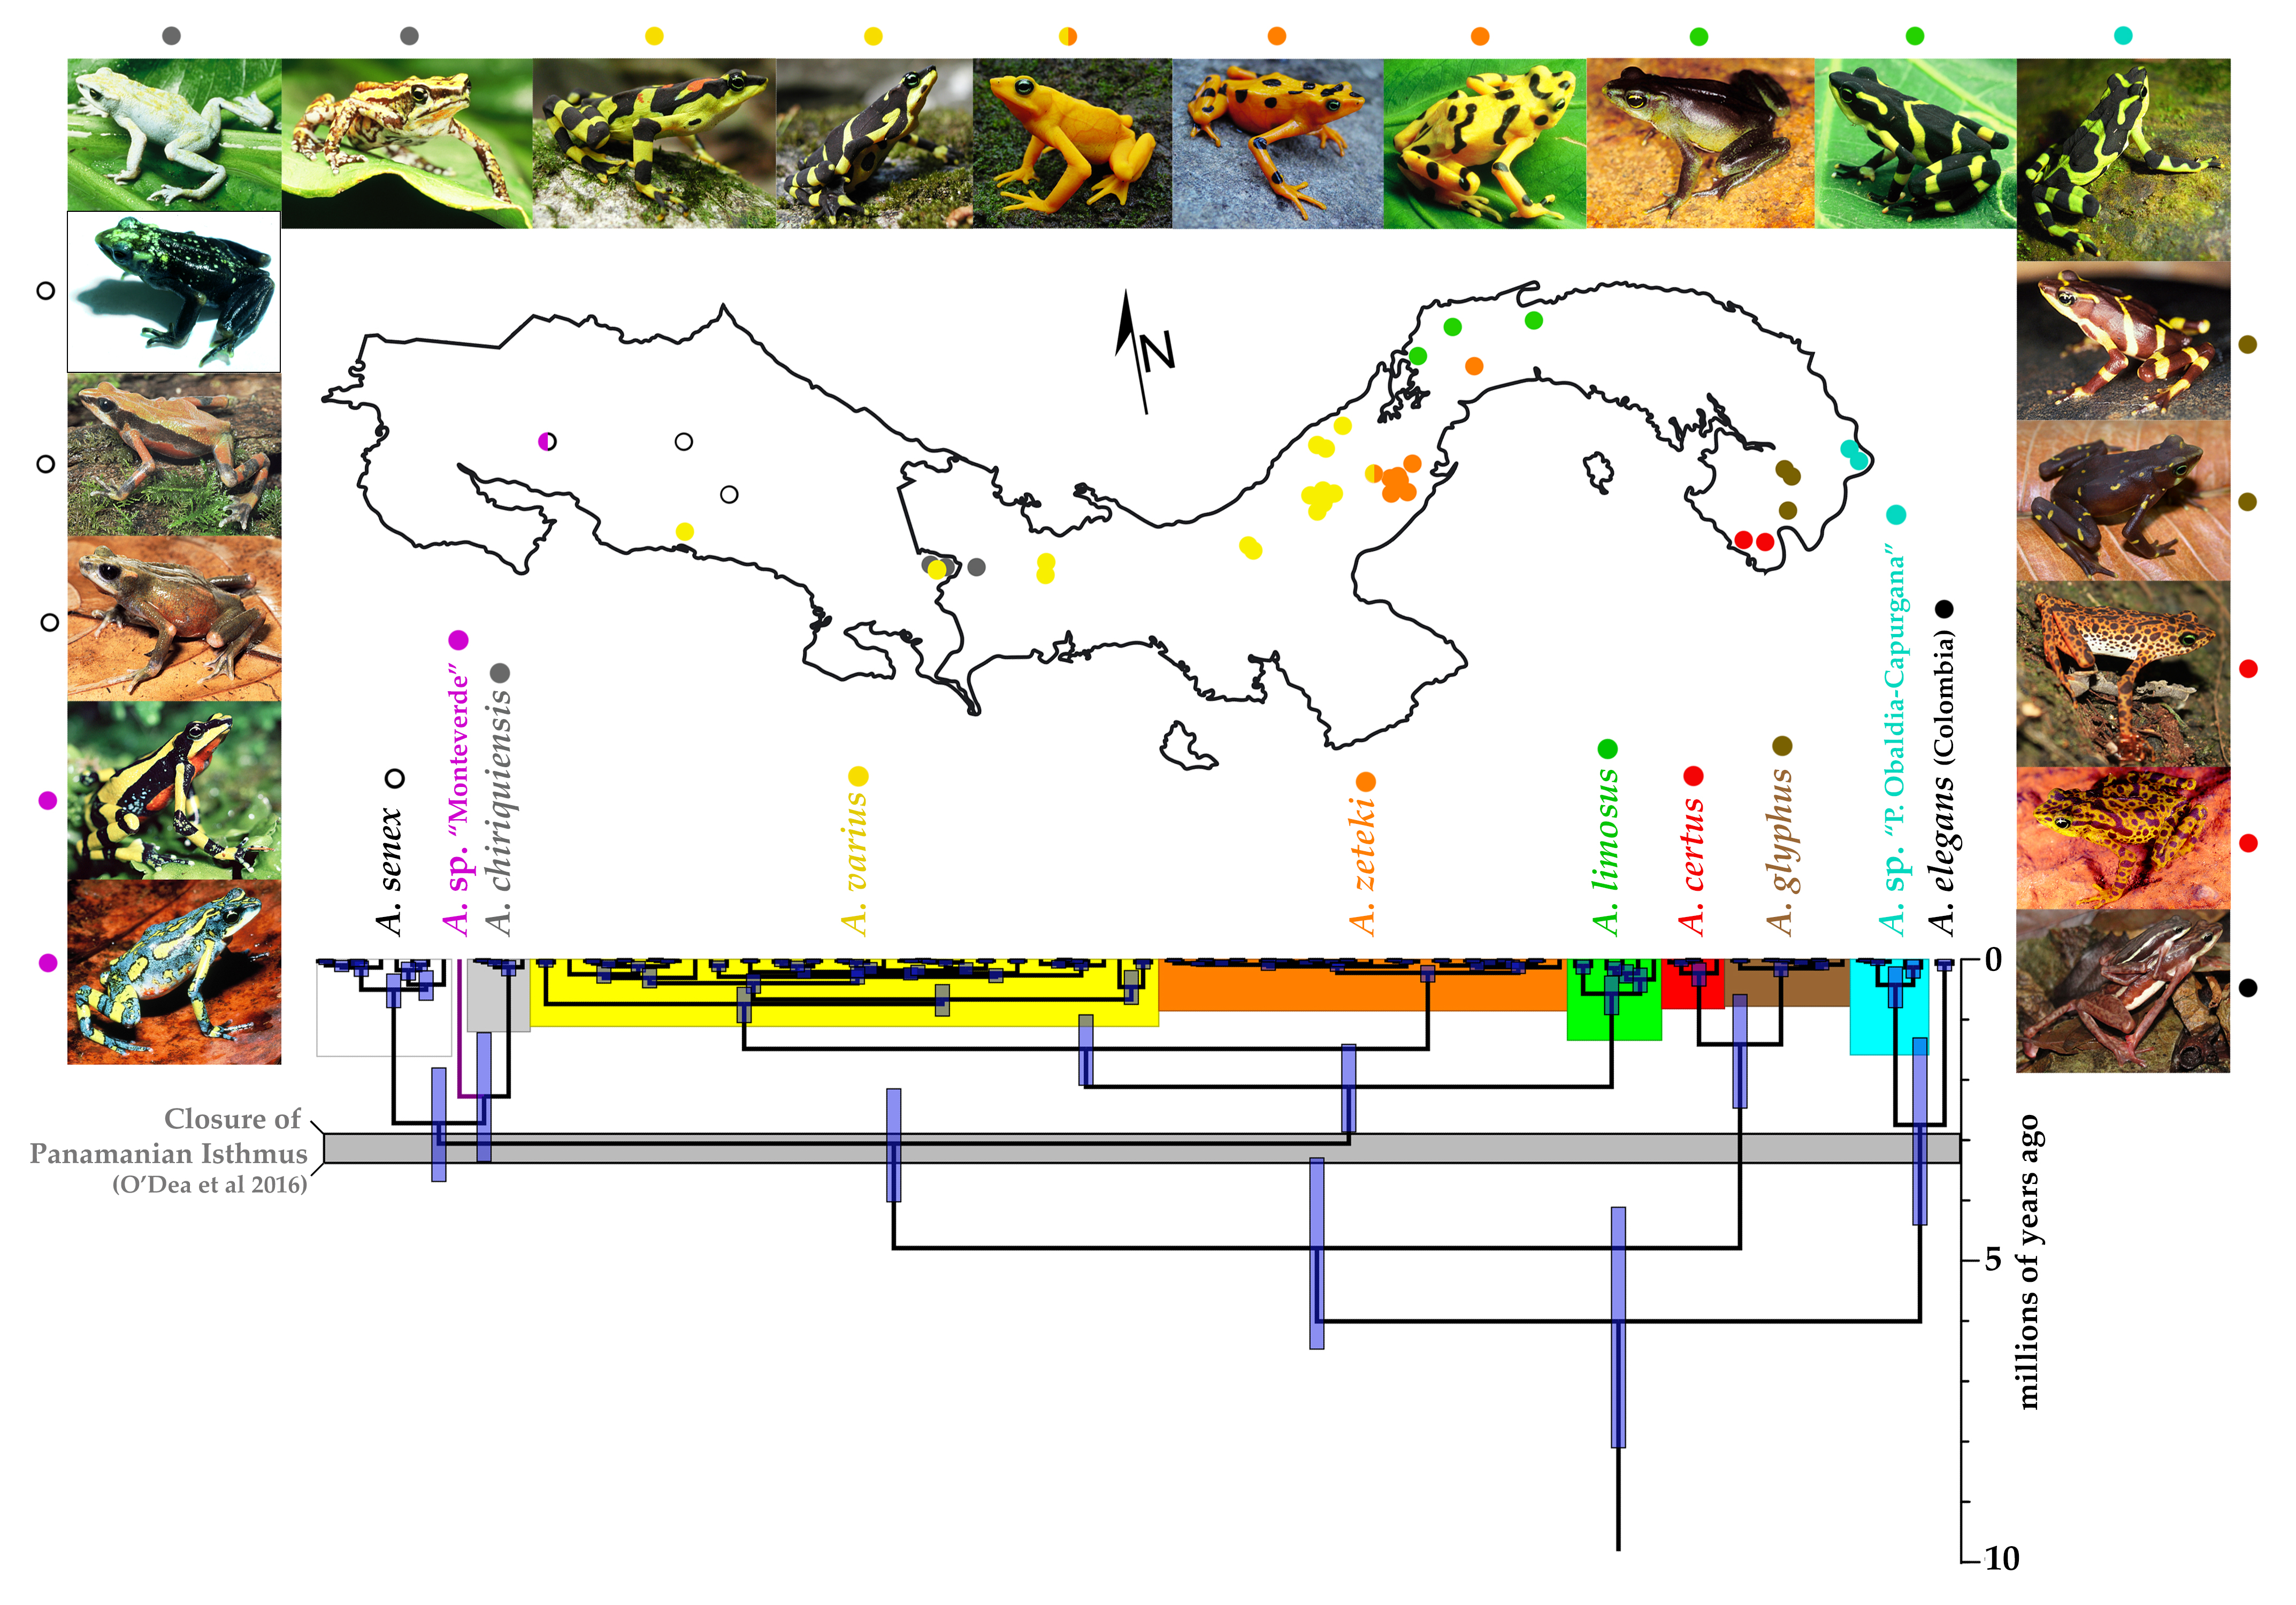
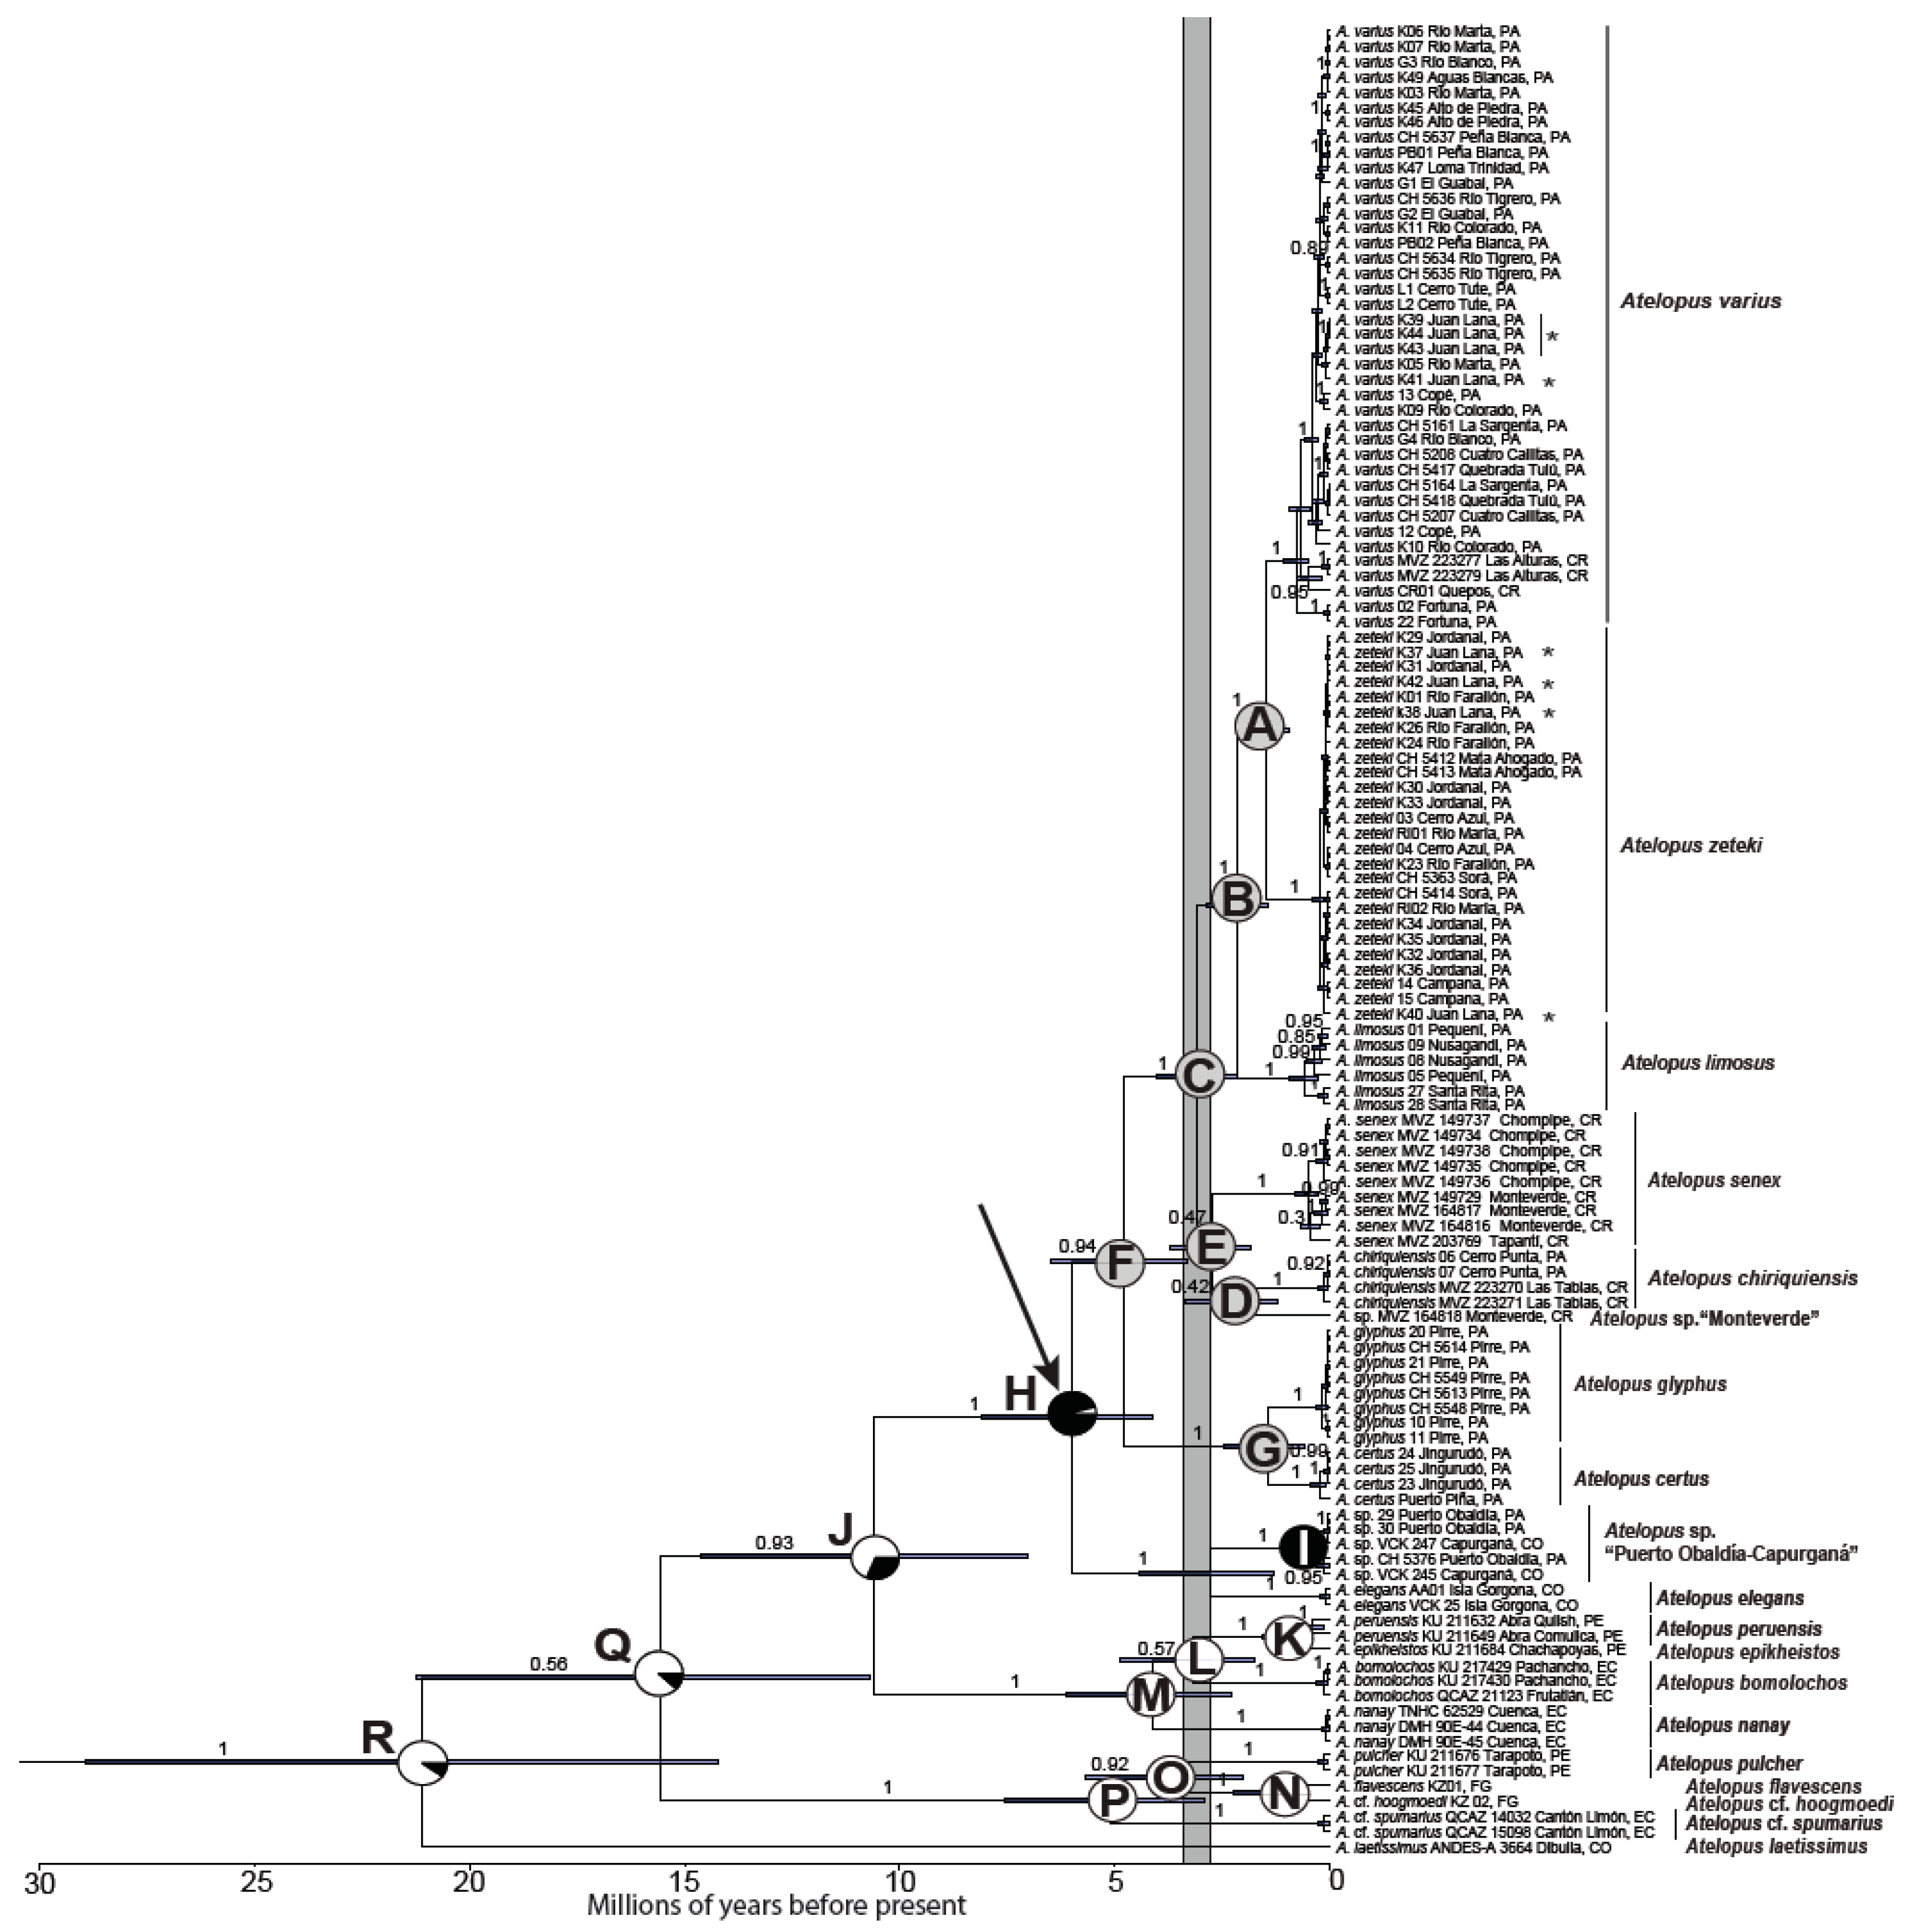
3.1. Phylogenetic Analyses

The complete, concatenated DNA sequence alignment consisted of a total of 1353 bp from 121 individuals of Atelopus plus samples from six individuals of outgroup bufonids. The majority of ingroup samples had sequences of the COI fragment (unavailable for two samples, or 1.6% of the total), whereas six ingroup terminals (4.7% of the total) lack DNA sequence data from cyt b. Premature stop codons were not observed in any of the sequences. Taking into account the ingroup only, of the 714 sites in cyt b, 142 were parsimony-informative and 35 were singletons, and of the 639 aligned sites of COI, 136 were parsimony-informative and 10 were singletons (Table 1).
The trees with the highest likelihood and parsimony scores (one of the 97 more parsimonious and very similar trees was chosen randomly) are shown in Figure 2 and Supplementary Figure S1, respectively, but outgroup non-Atelopus bufonid samples were removed to aid in visualization of the ingroup. The Bayesian consensus phylogeny of ingroup samples is shown in Figure 3, while the complete BA tree with the outgroup is presented in Supplementary Figure S3. The topologies obtained by the three inference methods (MP, ML and BA) were highly congruent with respect to the Central American samples, differing only in the phylogenetic position of A. senex and A. chiriquiensis. The South American Atelopus samples consistently formed three well supported clades and the phylogenetic relationships among the three were distinct among the different inference methods (see below). In general, the majority of nodes in the three phylogenies were highly supported (e.g., bootstrap values > 75% or posterior probabilities > 0.95), with the exception of most internal nodes within A. zeteki and A. varius, among some nodes within Central American Atelopus in the ML topology (see Figure 2), and regarding the phylogenetic relationships between A. senex and A. chiriquiensis.
In all topologies, the genus Atelopus was recovered as monophyletic. The South American congeners, with the exception of A. elegans (see below), comprised three clades, all with significant support: (1) the species of the Amazonian foothills of Peru and Ecuador, plus the Guianan lowlands (Atelopus cf. spumarius, A. pulcher, A. flavescens, and A. cf. hoogmoedi), corresponding to the ‘Amazonian-Guianan clade’ of Lötters et al. (2011); (2) species from the high Andes of Ecuador and Peru (A. epikheistos, A. nanay, A. bomolochos, and A. peruensis); and (3) A. laetissimus from the Sierra Nevada de Santa Marta of north-western Colombia. In the MP topology, clade 1 was the sister to all other Atelopus, whereas in the ML and BA topologies, A. laetissimus was the sister to all other sampled congeners. Clade 2 was the sister to our focal Central American lineage of Atelopus in both MP and BA topologies, with relatively high support in the BA consensus tree (posterior probability of 0.93; Figure 3 and Supplementary Figure S2). In the ML tree, clades 1 and 2 were sisters and formed the sister lineage to the Central American clade of Atelopus.
The remaining species of Atelopus included in this work comprised a monophyletic group containing eight clades of mostly Central American distribution. All but two of these clades were assignable to a previously described name, because we included samples from near the type localities of all known Central American species of the genus. The two exceptions were that we had no samples of A. chirripoensis, and the group comprised of Caribbean Coast samples from Puerto Obaldía, Panama, and Capurganá, Colombia may represent an unnamed species, referred to as A. aff. limosus in Flechas et al. [62] and Lewis et al. [23]. This latter clade plus A. elegans from the Pacific coast of Colombia (Figure 4D5) together formed the sister lineage of all other Central American species in all analyses (Figure 2 and Figure 3). The first split within this clade of Central American endemics separated (from all remaining samples) two species from eastern Panama, A. certus and A. glyphus, which were recovered as sisters in all analyses. The next split separated from all remaining samples either A. senex plus A. chiriquiensis (BA) or a clade containing A. senex, A. chiriquiensis, plus the central Panama species, A. limosus, A. varius, and A. zeteki (ML and MP), although neither of these hypotheses received high statistical support. In trees inferred by all three methods, A. limosus of central Panama was the sister group to a clade containing samples identified as A. varius and A. zeteki. Atelopus varius (e.g., Figure 4B3,B4) ranges from central Costa Rica to central Panama, and A. zeteki (e.g., Figure 4B5,C1,C2) is found near and east of Penonomé in central Panama. Specimens of these two species were found in sympatry in Juan Lana, near San Miguel Abajo, Panama. The identification of the Atelopus from the Monteverde Cloud Forest Reserve in northern Costa Rica (Figure 4A1,A2), as A. varius, was not supported by the phylogenetic analyses. Therefore, A. varius seems to have a smaller distribution range in Costa Rica, whose type locality is “Veragoa”, western Panama [63,64].
For both mitochondrial genes, the genetic distances between the eight clades of Central American Atelopus were generally much larger than within any clade (Table 2), with the exception of the mtDNA clades designated as A. varius and A. senex. However, this pattern is driven by the individual with institutional code MVZ 164818 (from Monteverde, Costa Rica) which has genetic distances comparable to, or even larger than, those found among the eight clades previously mentioned (Table 2). Each of the eight clades had genetic distances greater than 2.08 at COI (and greater than 2.44 at cyt b) from their sister clade (Table 2), except for the case of A. glyphus, for which its estimated COI genetic distance (1.43–2.07) from its sister species is lower than the cut-off value.

3.2. Divergence Times and Ancestral Area Estimation

The Dispersal and Local Extinction and Cladogenesis biogeographical model (DEC [67]) was found to have the best fit to the geographic distribution of species and the BA phylogeny (Figure 3, Supplementary Table S3). The ancestral area estimation was mostly well-supported with probabilities > 0.95 across nodes (Table 3 and Supplementary Table S4). Combining these results with the BA timetree suggested that the most recent common ancestor (MRCA) of the genus Atelopus existed in the early Miocene of South America, 21.1 Ma (95% posterior credibility interval, CI: 14.21 to 28.95 Ma). In addition, the most recent common ancestor (MRCA) of the Central American species of the genus (plus the Colombian A. elegans) was recovered as diverging from the other species of Atelopus during the late Miocene, (i.e., stem age at 10.6 Ma, CI: 7.02 to 14.64 Ma; Figure 3, node J), with a high probability (0.958) that it was distributed in both Central and South America at the time. Atelopus sp. “Puerto Obaldía-Capurganá” (aka, A. aff. limosus) plus A. elegans shared a MRCA 2.72 Ma (late Pliocene; CI: 1.8 to 3.69 Ma) which was inferred to inhabit both Central and South America, while all members of the sister lineage (Figure 3, node F) to this clade were recovered as being firmly of Central American origin. The timetree allowed us to bound the timing of dispersal into Central America as follows. The hypothesis of just one colonization of Central America (followed by one back dispersal event by Atelopus elegans) implies that the colonization took place between the stem age (Figure 3, node J; 10.6 Ma) and crown age (node H at 6.01 Ma, CI: 4.11 to 8.1 Ma) of the MRCA of all Central America samples, i.e., between roughly 10.6 Ma and 6.01 Ma. The alternative scenario of two independent invasions implies the age of first and more successful (in terms of descendants) took place between the stem age (node H at 6.01 Ma) and crown age (node F at 4.79 Ma, CI: 3.29 to 6.47 Ma) of the oldest clade of exclusively (i.e., monophyletic) Central American samples (Figure 3).
Table 3. Estimated crown ages (in millions of years ago, Ma) and results of the ancestral area estimation using the Dispersal-Extinction-Cladogenesis (DEC) model for the species of Atelopus of Central America and other selected nodes within the genus. Ages were estimated by concatenated MCMC Bayesian analyses using the software BEAST 2. See text for details. Node labels are indicated on the tree in Figure 3. CA = Central America, SA = South America.
Node LabelMean Crown Age (Ma)95% Posterior Credibility IntervalDEC Estimation
A1.490.92–2.09CA (100%)
B2.121.41–2.86CA (100%)
C3.062.15–4.02CA (100%)
D2.271.22–3.35CA (100%)
E2.721.80–3.69CA (100%)
F4.793.29–6.47CA (100%)
G1.410.59–2.47CA (100%)
H6.014.11–8.10CA-SA (95.8%), CA (4.2%)
I2.751.30–4.41CA-SA (100%)
J10.67.02–14.64SA (69.7%), CA-SA (30.3%)
Q15.5510.68–21.23CA-SA (14.5%), SA (85.5%)
R21.1214.21–28.95CA-SA (11.3%), SA (88.7%)

4. Discussion

4.1. Phylogenetic Systematics and Biogeography

The phylogenetic relationships inferred here among Atelopus are mostly in agreement with those found by Lötters et al. [10], a study also based solely on mitochondrial DNA sequences (12S and 16S genes), but which included only three of the Central American species, A. varius, A. zeteki, and A. chiriquiensis. The current study and Lötters et al. [10] found that Atelopus is monophyletic and of South American origin. Additionally, both studies recovered a clade of Amazonian-Guianan species which is sister to a clade containing the Andean, Chocoan, and Central American species. In contrast with Lötters et al. [10], however, in this work we included sequences of one species (A. laetissimus) from the Sierra Nevada de Santa Marta (SNSM), an isolated massif in north-western Colombia well known for its endemicity. The phylogenetic position of A. laetissimus is noteworthy, as it diverged very early in the history of the genus, being either sister to the rest of Atelopus (Figure 2 and Figure 3), or the sister to a clade formed by Andean, Chocoan, and Central American species (Supplementary Figure S1). A similar pattern was found in the frogs of the clade Allocentroleniae, in which the basal split separates the Guianas and Amazonian regions from a clade containing a species from the SNSM that is sister to all other known species [68].
While a single colonization event can explain the presence of Atelopus in Central America, our data are also compatible with two dispersal events (Figure 3). Further sampling of other Chocoan Atelopus, such as A. spurrelli, A. longibrachius, A. balios, and the mainland populations of A. elegans, may be needed to resolve this ambiguity. Savage and Bolaños [16] proposed that the enigmatic A. chirripoensis of Costa Rica is more closely related to the A. ignescens species complex of Ecuador and southern Colombia than to other Central American species of Atelopus, which would imply yet another potential colonization event. However, testing this hypothesis is difficult given that A. chirripoensis has not been seen since 1980, and it is now probably extinct [16,18]. The remarkable external similarity between A. chirripoensis and the A. ignescens complex might also be explained by morphological convergence, given that both are found in similar páramo environments [16].
Our analyses suggest that the ancestral lineage of Atelopus reached Central America between 14.64 and 3.29 Ma with point estimates ranging from 10.6 to 4.79 Ma, depending on whether one postulates one or two invasions. In all cases, the estimated time frame is consistent with recent molecular biogeographic studies (e.g., [38,69]) supporting a non-traditional, older closure date for the Panamanian Isthmus by 10 Ma [34]. One could also argue that Atelopus dispersed over water prior to the completion of the Isthmus, although amphibians are sensitive to dehydration and to salt water [66,70,71]. Assuming an old date for the formation of the Isthmus, one recent hypothesis predicts that the Isthmus was forested during the Miocene and Pliocene epochs until 2.5 Ma when savanna-like environments appeared [72]. Our proposed time-frame for colonization by Atelopus of the Isthmus is temporally consistent with this prediction, as Atelopus species are affiliated with moist forests. Studies of additional groups of terrestrial organisms with low dispersal capabilities (such as insects, fossorial reptiles, or understory birds) or that are sensitive to salt water (such as amphibians) are needed to confirm whether there may be a tendency of inferring early crossings between continents by wet-forest lineages [31].

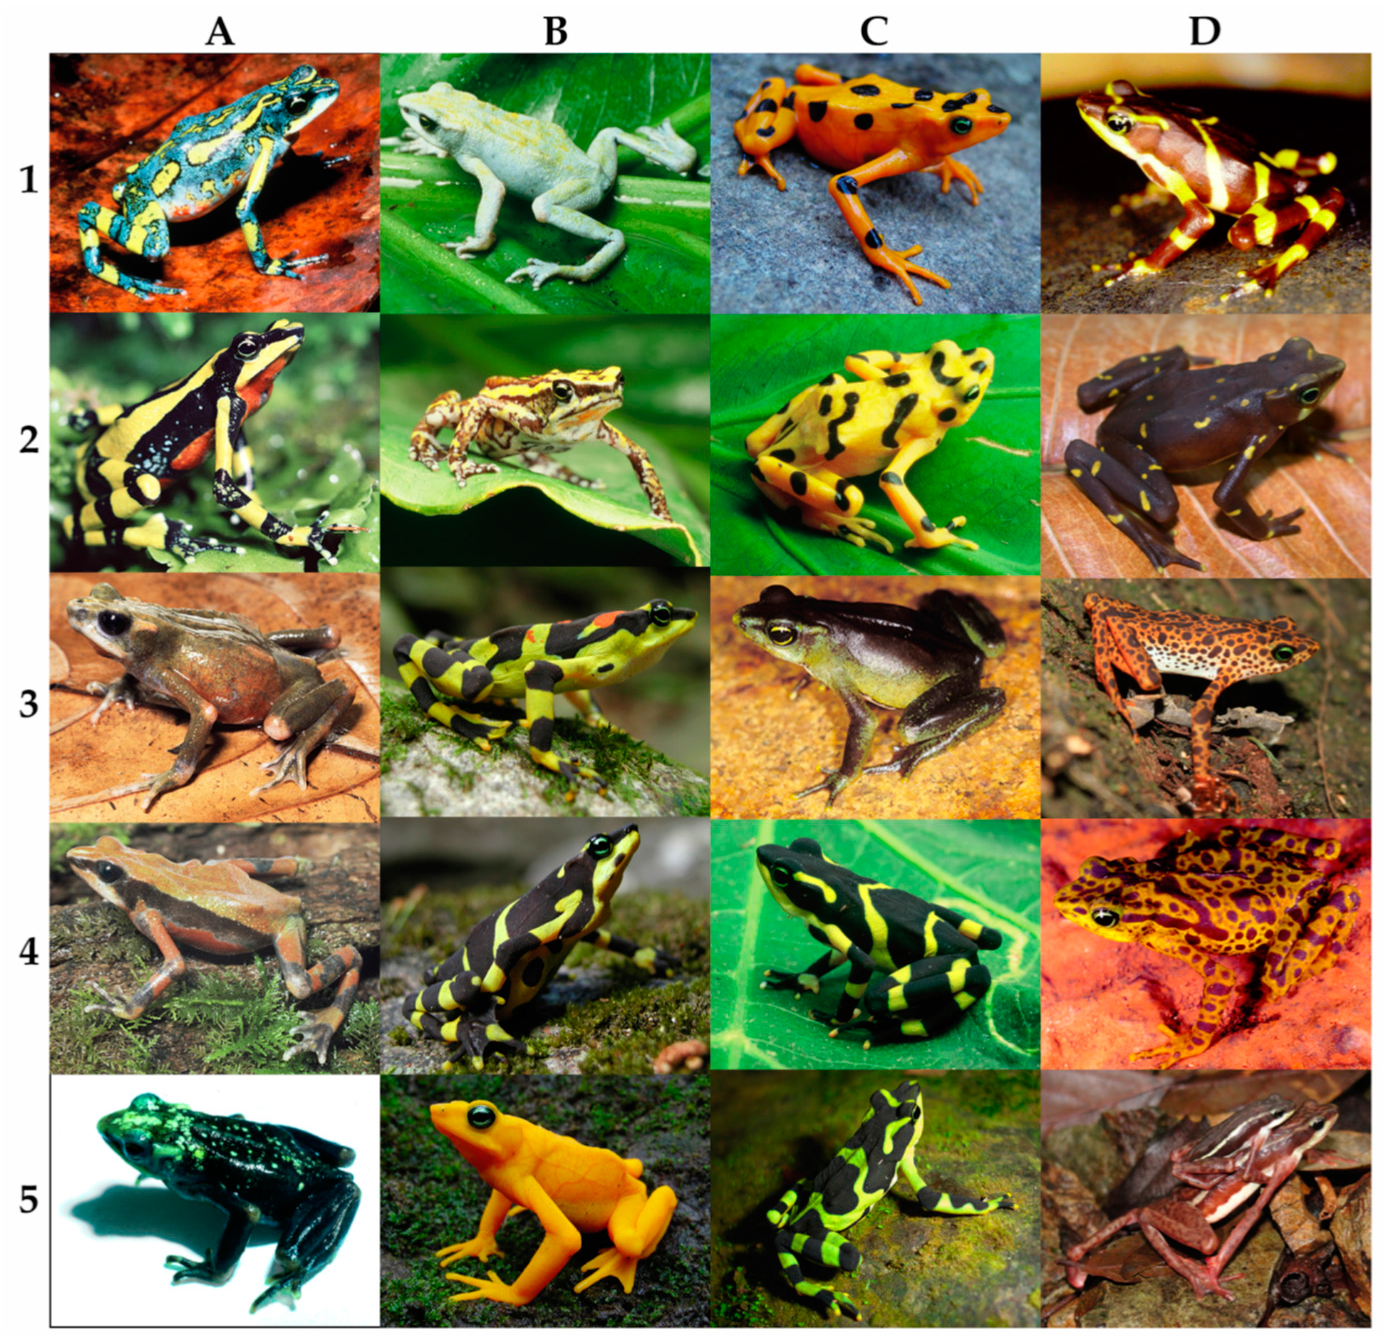
4.2. Geographic Color Pattern Variation

Most Central American species of Atelopus are strikingly variable in their color patterns, not only between but also within populations (e.g., [63]). In some species, such as A. chiriquiensis (Figure 4B1,B2), A. senex (Figure 4A3,A4) and populations of A. varius, a noticeable sexual dimorphism in coloration is sometimes present. On the other hand, color patterns can be very similar between species, resulting in species misidentification [28,73], especially in species that lack other clear diagnostic morphological characters. Our molecular data revealed the presence of a distinct species in the Monteverde Cloud Forest Reserve, northern Costa Rica, that has until now been confused with A. varius, very likely due to their similarity in color pattern.
In general, recently metamorphosed and juvenile individuals of A. certus, A. chiriquiensis, A. glyphus, A. limosus, A. varius, and A. zeteki have a barred dorsal color pattern, consisting of a series of dark and light colored chevrons, which usually changes or fades ontogenetically as they grow older ([74], E.D.L. and R.I. pers. obs.). This barred pattern sometimes remains in adult individuals within certain populations, and may even be the predominant color pattern, as observed in some populations of A. glyphus (Figure 4D1), A. limosus (Figure 4C4), A. varius (Figure 4B3,B4), and A. zeteki. Therefore, natural and/or sexual selection pressures might be behind this ontogenetic change in coloration, resulting in color pattern differences among geographic areas.
Geographic variation in color pattern has been documented for A. varius and A. zeteki [63,73], and we found distinct color pattern variants among populations of A. glyphus and A. limosus along their distribution ranges. In the northern region of the Serranía de Pirre (e.g., Figure 1, localities 5 and 6), adults of A. glyphus have a barred dorsal color pattern (Figure 4D1), while in the highlands of the southern portion of Serranía de Pirre above Cana (e.g., Figure 1, locality 7), adults have a predominantly uniform brown dorsum with small, light markings (Figure 4D2). In the western area of the distribution range of A. limosus (e.g., Figure 1, localities 8 and 10), adults have a uniform olive green dorsum ([63,75]; Figure 4C3), whereas populations to the East (e.g., Figure 1, locality 9) have a barred color pattern on the dorsum (Figure 4C4). The mtDNA data presented here supports our contention that these color pattern differences indeed represent geographic variation between conspecific populations. In contrast, the undescribed Atelopus sp. “Puerto Obaldía-Capurganá” from eastern Panama seems to exclusively have a barred dorsal color pattern (Figure 4C5).

4.3. Taxonomic and Conservation Implications

The phylogenetic results obtained here are broadly concordant with the current taxonomic arrangement of the species of Atelopus. Our data reveal two Central American lineages whose taxonomic status needs further attention, however. First, the specimens from Puerto Obaldía, Panama, and Capurganá, Colombia, were already of uncertain taxonomy. The names A. varius glyphus [76,77], A. varius [78] and A. aff. limosus [23,62] have been applied to this binational population, but our molecular phylogenetic results are not compatible with these proposed names. We cannot, however, reject the hypothesis that these Caribbean samples might correspond to a previously unreported population of A. spurrelli from the Pacific coast of Colombia, since we were unable to sample this latter taxon. More likely, however, these specimens represent an undescribed species.
Second, a specimen from the Monteverde Cloud Forest in Costa Rica (MVZ 164818) is most likely a member of an undescribed (and probably extinct) species, given its large genetic distance from all other specimens, including several sympatric individuals of its sister lineage, A. senex. The specimens from the Monteverde, Chompipe, and Tapantí areas in Costa Rica highlight a taxonomic problem that requires further study. Specimens from populations at Chompipe (the slopes of Volcán Barba) and Tapantí are traditionally considered to be A. senex (Figure 4A3–A5), while the ones from around Monteverde are assigned to A. varius ([15,63,79]; Figure 4A1,A2). The specimen (MVZ 164818) from the Monteverde Cloud Forest Reserve stood as a member of an undescribed (and probably extinct) species, although its phylogenetic position had no significant statistical support. This specimen was inferred to be the sister clade to either A. senex, A. chiriquiensis, or to a larger clade containing both. Richards and Knowles [28] also reported on the taxonomic confusion around Monteverde specimens and noted the low genetic divergence (i.e., 0.5–1.2%) between samples from Monteverde and A. senex specimens. However, we confirm that the specimen MVZ 164818 from Monteverde is certainly not A. varius, and it should likely be assigned to an undescribed species. Furthermore, the specimens from Monteverde MVZ 164816 and MVZ 164818 share the same morphology and color pattern based on our examination, but here we show they are genetically distinct at the level of species, as A. senex and A. sp. “Monteverde”, respectively. Assuming no errors on the original source of the samples and DNA sequencing, possible explanations for the difference between morphological features and our mtDNA analysis are that genetic introgression between species has occurred or both species and/or their hybrids were present at Monteverde. To resolve this taxonomic problem, we suggest including more DNA data in future analyses, since further sampling of individuals would be difficult given the catastrophic population declines. Finally, the poorly known A. spurrelli, A. certus (Figure 4D3,D4), and A. glyphus (Figure 4D1,D2) are in need of further taxonomic study.
We confirm the results of Richards and Knowles [28] regarding the distinctiveness of A. zeteki (Figure 4B5) from A. varius, and we uncovered the locality (Juan Lana, Panama) in which these species are found in sympatry, as was hinted by Zippel et al. [73]. As previously suggested [28,73], these two species could have been hybridizing in sympatry at this locality, a hypothesis that deserves further exploration given their morphological similarity and recent divergence (2.12 Ma, CI: 1.41 to 2.86 Ma). Additionally, we established the identity of individuals from a population in Cerro Azul (Cerro La Victoria), Panama (Figure 4C2). Savage [63] suggested this to be an introduced population of A. varius that resembled those from El Valle de Antón and Cerro Campana. According to our phylogenetic analyses, the individuals from this population are A. zeteki.
Finding support for the traditional taxonomy of Central American Atelopus brings hope to the success of the ex situ conservation programs being undertaken with the described species, as it indicates that resources are being used efficiently in frog conservation, given that all surviving species are being included by these programs. In addition, since each named species appears to be a distinct genetic entity, species ranges are not being underestimated, and no species is being protected unnecessarily. However, this is not the case for the two candidate species uncovered in this study, as they are not currently part of any ex situ or in situ conservation program. Furthermore, finding that the original identification of most specimens (except some specimens of A. varius and A. zeteki, Supplementary Table S1) is concordant with the results of the phylogenetic analyses, suggests that cryptic diversity is low among Central American Atelopus, and that hybridization resulting from misidentifications of specimens in captive programs should be rare. At least in the case of A. limosus this has been shown to be the case [80]. Further study is needed using multilocus nuclear markers or genomic data, especially on the likely case of hybridization between A. varius and A. zeteki. Additional genotyping should be conducted on captive specimens currently housed in ex situ programs. Finally, recognizing the taxonomic distinctiveness of the candidate species found herein is urgently needed in order to initiate the corresponding conservation measures to guarantee their long-term survival.

5. Conclusions

In this work, the phylogenetic relationships among seven of the eight described species of Central American Atelopus, plus eight South American congeneric species, were inferred based on mitochondrial DNA sequence data. The phylogenetic analyses revealed a ladderized topology showing the Central American species as a monophyletic group, and placing the species geographically furthest from South America more nested in the tree. We detected two previously unrecognized candidate species, including an undescribed species from Costa Rica involved in a taxonomic confusion that requires further study. We showed that species in eastern Panama, also show geographic variation in their color patterns, and clarify the species identity of individuals from some of these populations. Biogeographic models supported either one or two colonization events from South America, indicating that Atelopus reached Central America prior to 4 million years ago (Ma), a timing slightly older than the traditional date estimated for the closure of the Isthmus. Furthermore, this study underscores the invaluable role of museum collections in documenting biodiversity, and the relevance of genetic analyses for guiding conservation efforts.

Supplementary Materials

The following are available online at https://www.mdpi.com/1424-2818/12/9/360/s1; Resumen (Abstract in Spanish); Figure S1: One of the 97 most-parsimonious trees (selected arbitrarily) inferred from DNA sequences of two mitochondrial genes (COI and cyt b) for samples of Atelopus of Central and South America; Figure S2: Maximum likelihood phylogenetic tree inferred from DNA sequences of two mitochondrial genes (COI and cyt b) from species of Atelopus of Central and South America, including the extended non-Atelopus bufonid outgroup; Figure S3: Timetree of Atelopus based on a relaxed-clock MCMC Bayesian analysis of DNA sequences of two mitochondrial genes, COI and cyt b, calibrated using the estimated substitution rate for bufonid frogs of Macey et al. [53], as corrected by Crawford [54], and including the extended non-Atelopus bufonid outgroup; Table S1: Specimens of Atelopus and other bufonid frogs used for the present study, including museum voucher, locality, geographic coordinates, elevation and GenBank accession numbers; Table S2: Best-fit partitioning scheme for the two protein-coding mitochondrial genes, cytochrome b (cyt b) and cytochrome oxidase subunit I (COI) and models of nucleotide substitution for each partition, based on the Bayesian information criterion (BIC) as implemented in PartitionFinder 2 [45]; Table S3: Comparison among biogeographic models evaluated with the software BioGeoBEARS; Table S4: Estimated crown ages (in millions of years ago, Ma) and results of the ancestral area estimates under the Dispersal-Extinction-Cladogenesis (DEC) model, assuming the MCMC Bayesian consensus tree obtained using the software BEAST 2 and concatenating the two mitochondrial genes.

Author Contributions

J.P.R., C.A.J., E.D.L., A.J.C. and R.I. designed the study; C.A.J., E.D.L. and R.I. collected and procured tissues; C.A.J. and R.I. examined specimens; C.A.J. conducted laboratory work to extract and sequence DNA; J.P.R., C.J.A. and A.J.C. performed the bioinformatic analyses on DNA sequences; J.P.R., C.A.J. and A.J.C. performed data curation; J.P.R., A.J.C. and R.I. prepared the manuscript with the contributions and edits from all authors. All authors have read and agreed to the published version of the manuscript.

Funding

This research was partially funded by Jegg Ettling, Field Research for Conservation (FRC) Program, Saint Louis Zoological Park. A.J.C. was supported by Research Program INV-2017-51-1432 from the School of Sciences, Universidad de los Andes. R.I. was funded by the Panama Amphibian Rescue and Conservation project, Sistema Nacional de Investigación (Secretaría Nacional de Ciencia, Tecnología e Innovación–SENACYT) and Minera Panamá (First Quantum Minerals Ltd.), during the preparation of the manuscript.

Acknowledgments

We thank the following persons and museums for providing access to tissue samples and/or specimens: David B. Wake and Tami Mott (Museum of Vertebrate Zoology, University of California at Berkeley), David C. Cannatella, Travis LaDuc, and Santiago Ron (Texas Natural History Collection, Texas Memorial Museum, University of Texas at Austin), Luis A. Coloma (Museo de Zoología, Pontificia Universidad Católica del Ecuador), William E. Duellman and Juan M. Guayasamin (Natural History Museum and Biodiversity Research Center, University of Kansas), Federico Bolaños (Museo de Zoología, Universidad de Costa Rica), and Yiselle Cano (Museo de Historia Natural C. J. Marinkelle, Universidad de los Andes, Bogotá). Thanks to Kevin Zippel, Anthony P. Wisniewski, Edgardo J. Griffith, Vicky Poole, Peter B. Johantgen, Allan Gillogly, Fidel E. Jaramillo, José Luis Atehortúa, Carlos A. Navas, Shyh-Hwang Chen, Victoriano González, and Karla Aparicio for donating specimens or tissues. Field assistance in Panama was provided by Frank A. Solís, James Coronado, and G. Urrieta. Alessandro Catenazzi and Juan C. Chaparro helped with permits in Peru. This work was conducted under the following permits: Instituto Nacional de Recursos Naturales Renovables de Panamá (scientific permits No. 27-92, No. 27-93, No. 46-94, No. 58-95, No. 03-97, No. 10-98, No. 20-2000, No. 39-2000 and No. 41-2000), Autoridad Nacional del Ambiente de Panamá (scientific permits No. SC/A 013-2001, No. SE/A-083-2001, No. SE/A-104-2001, No. SE/A-2-03, No. SE/A-78-03 and No. SE/A-07902, scientific import permits No. SIM/A 007-02, No. SIM/A 011-02, No. SIM/A-14-02, No. SIM/A-14-03 and No. SIM/A-16-03, scientific re-exportation permit No. SEX/A 059-02 and No. SER/A-1-04), and the U.S. Fish and Wildlife Service (declaration for export). We owe thanks to Eldredge Bermingham for opening the doors of his molecular genetics laboratory to us, to Lee A. Weigt for preliminary molecular work of initial tissues, and to Nimiadina Herrera and Maribel González for support and guidance in the laboratory. Thanks also to the members of the @CrawLab, especially Paola Montoya and Luis A. Rueda, for their feedback on this project. We acknowledge David Cannatella, David M. Dennis, Sandra V. Flechas, Michael and Patricia Fogden, Marcos A. Guerra, and Guido Sterkendries for photographic images of frogs in the graphical abstract and Figure 4. J.P.R. thanks Viviana Romero-Alarcón for constructive discussions about phylogenetic analyses and Martha Ramírez-Pinilla for support.

Conflicts of Interest

The authors declare no conflict of interest.

References

  1. Stuart, S.; Chanson, J.S.; Cox, N.A.; Young, B.E.; Rodrigues, A.S.L.; Fishman, D.L.; Waller, R.W. Status and trends of amphibian declines and extinctions worldwide. Science 2004, 306, 1783–1786. [Google Scholar] [CrossRef] [PubMed] [Green Version]
  2. Hoffmann, M.; Hilton-Taylor, C.; Angulo, A.; Böhm, M.; Brooks, T.M.; Butchart, S.H.M.; Carpenter, K.E.; Chanson, J.; Collen, B.; Cox, N.A.; et al. The impact of conservation on the status of the world’s vertebrates. Science 2010, 330, 1503–1509. [Google Scholar] [CrossRef] [PubMed] [Green Version]
  3. González-del-Pliego, P.; Freckleton, R.P.; Edwards, D.P.; Koo, M.S.; Scheffers, B.R.; Pyron, R.A.; Jetz, W. Phylogenetic and trait-based prediction of extinction risk for data-deficient amphibians. Curr. Biol. 2019, 29, 1557–1563. [Google Scholar] [CrossRef]
  4. Hayes, T.B.; Falso, P.; Gallipeau, S.; Stice, M. The cause of global amphibian declines: A developmental endocrinologist’s perspective. J. Exp. Biol. 2010, 213, 921–933. [Google Scholar] [CrossRef] [PubMed] [Green Version]
  5. Skerratt, L.F.; Berger, L.; Speare, R.; Cashins, S.; McDonald, K.R.; Phillott, A.D.; Hines, H.B.; Kenyon, N. Spread of chytridiomycosis has caused the rapid global decline and extinction of frogs. EcoHealth 2007, 4, 125–134. [Google Scholar] [CrossRef]
  6. Scheele, B.C.; Pasmans, F.; Skerratt, L.F.; Berger, L.; Martel, A.; Beukema, W.; Acevedo, A.A.; Burrowes, P.A.; Carvalho, T.; Catenazzi, A.; et al. Amphibian fungal panzootic causes catastrophic and ongoing loss of biodiversity. Science 2019, 363, 1459–1463. [Google Scholar] [CrossRef]
  7. Ron, S.R.; Duellman, W.E.; Coloma, L.A.; Bustamante, M.R. Population decline of the Jambato toad Atelopus ignescens (Anura: Bufonidae) in the Andes of Ecuador. J. Herpetol. 2003, 37, 116–126. [Google Scholar] [CrossRef]
  8. Coloma, L.A.; Duellman, W.E.; Almendáriz C., A.; Ron, S.R.; Terán-Valdez, A.; Guayasamin, J.M. Five new (extinct?) species of Atelopus (Anura: Bufonidae) from Andean Colombia, Ecuador, and Peru. Zootaxa 2010, 2574, 1–54. [Google Scholar] [CrossRef]
  9. Guayasamin, J.M.; Bonaccorso, E.; Duellman, W.E.; Coloma, L.A. Genetic differentiation in the nearly extinct harlequin frogs (Bufonidae: Atelopus), with emphasis on the Andean Atelopus ignescens and A. bomolochos species complexes. Zootaxa 2010, 2574, 55–68. [Google Scholar] [CrossRef]
  10. Lötters, S.; Meijden, A.; Coloma, L.A.; Boistel, R.; Cloetens, P.; Ernst, R.; Lehr, E.; Veith, M. Assessing the molecular phylogeny of a near extinct group of vertebrates: The Neotropical harlequin frogs (Bufonidae: Atelopus). Syst. Biodivers. 2011, 9, 45–57. [Google Scholar] [CrossRef]
  11. DiRenzo, G.V.; Langhammer, P.F.; Zamudio, K.R.; Lips, K.R. Fungal infection intensity and zoospore output of Atelopus zeteki, a potential acute chytrid supershedder. PLoS ONE 2014, 9, e93356. [Google Scholar] [CrossRef] [PubMed] [Green Version]
  12. DiRenzo, G.V.; Tunstall, T.S.; Ibáñez, R.; deVries, M.S.; Longo, A.V.; Zamudio, K.R.; Lips, K.R. External reinfection of a fungal pathogen does not contribute to pathogen growth. EcoHealth 2018, 15, 815–826. [Google Scholar] [CrossRef] [PubMed]
  13. La Marca, E.; Lötters, S.; Puschendorf, R.; Ibáñez, R.; Rueda-Almonacid, J.V.; Schulte, R.; Marty, C.; Castro, F.; Manzanilla-Puppo, J.; García-Pérez, J.E.; et al. Catastrophic population declines and extinctions in neotropical harlequin frogs (Bufonidae: Atelopus). Biotropica 2005, 37, 190–201. [Google Scholar] [CrossRef]
  14. Woodhams, D.C.; Alford, R.A.; Briggs, C.J.; Johnson, M.; Rollins-Smith, L.A. Life-history trade-offs influence disease in changing climates: Strategies of an amphibian pathogen. Ecology 2008, 89, 1627–1639. [Google Scholar] [CrossRef] [Green Version]
  15. Savage, J.M. The Amphibians and Reptiles of Costa Rica: A Herpetofauna between Two Continents, between Two Seas; University of Chicago Press: Chicago, IL, USA, 2002. [Google Scholar]
  16. Savage, J.M.; Bolaños, F. An enigmatic frog of the genus Atelopus (Family Bufonidae) from Parque Nacional Chirripó, Cordillera de Talamanca, Costa Rica. Rev. Biol. Trop. 2009, 57, 381–386. [Google Scholar] [CrossRef] [Green Version]
  17. Köhler, G. Amphibians of Central America; Herpeton Verlag: Offenbach, Germany, 2011. [Google Scholar]
  18. IUCN The IUCN Red List of Threatened Species. Available online: www.iucnredlist.org (accessed on 10 January 2019).
  19. Gagliardo, R.; Crump, P.; Griffith, E.; Mendelson, J.; Ross, H.; Zippel, K. The principles of rapid response for amphibian conservation, using the programmes in Panama as an example. Int. Zoo Yearb. 2008, 42, 125–135. [Google Scholar] [CrossRef]
  20. Zippel, K.; Johnson, K.; Gagliardo, R.; Gibson, R.; McFadden, M.; Browne, R.; Martinez, C.; Townsend, E. The Amphibian Ark: A global community for ex situ conservation of amphibians. Herpetol. Conserv. Biol. 2011, 6, 340–352. [Google Scholar]
  21. Estrada, A.; Gratwicke, B.; Benedetti, A.; DellaTogna, G.; Garrelle, G.; Griffith, E.; Ibáñez, R.; Ryan, S.; Miller, P.S. The Golden Frogs of Panama (Atelopus zeteki, A. varius): A Conservation Planning Workshop; IUSN/SSC Conservation Breeding Specialist Group: Apple Valley, MN, USA, 2014. [Google Scholar]
  22. Cikanek, S.J.; Nockold, S.; Brown, J.L.; Carpenter, J.W.; Estrada, A.; Guerrel, J.; Hope, K.; Ibáñez, R.; Putman, S.B.; Gratwicke, B. Evaluating group housing strategies for the ex-situ conservation of harlequin frogs (Atelopus spp.) using behavioral and physiological indicators. PLoS ONE 2014, 9, e90218. [Google Scholar] [CrossRef]
  23. Lewis, C.H.R.; Richards-Zawacki, C.L.; Ibáñez, R.; Luedtke, J.; Voyles, J.; Houser, P.; Gratwicke, B. Conserving Panamanian harlequin frogs by integrating captive-breeding and research programs. Biol. Conserv. 2019, 236, 180–187. [Google Scholar] [CrossRef]
  24. Allendorf, F.W.; Luikart, G.H.; Aitken, S.N. Conservation and the Genetics of Populations, 2nd ed.; John Wiley & Sons, Ltd.: West Sussex, UK, 2012. [Google Scholar]
  25. Daugherty, C.H.; Cree, A.; Hay, J.M.; Thompson, M.B. Neglected taxonomy and continuing extinctions of tuatara (Sphenodon). Nature 1990, 347, 177–179. [Google Scholar] [CrossRef]
  26. Frankham, R.; Briscoe, D.A.; Ballou, J.D. Introduction to Conservation Genetics; Cambridge University Press: Cambridge, UK, 2002. [Google Scholar]
  27. Noonan, B.P.; Gaucher, P. Phylogeography and demography of Guianan harlequin toads (Atelopus): Diversification within a refuge. Mol. Ecol. 2005, 14, 3017–3031. [Google Scholar] [CrossRef] [PubMed]
  28. Richards, C.L.; Knowles, L.L. Tests of phenotypic and genetic concordance and their application to the conservation of Panamanian golden frogs (Anura, Bufonidae). Mol. Ecol. 2007, 16, 3119–3133. [Google Scholar] [CrossRef] [PubMed]
  29. Lötters, S.; van der Meijden, A.; Rödder, D.; Köster, T.E.; Kraus, T.; La Marca, E.; Haddad, C.F.B.; Veith, M. Reinforcing and expanding the predictions of the disturbance vicariance hypothesis in Amazonian harlequin frogs: A molecular phylogenetic and climate envelope modelling approach. Biodivers. Conserv. 2010, 19, 2125–2146. [Google Scholar] [CrossRef] [Green Version]
  30. Stehli, F.G.; Webb, S.D. The Great American Biotic Interchange; Plenum Press: New York, NY, USA, 1985. [Google Scholar]
  31. Cody, S.; Richardson, J.E.; Rull, V.; Ellis, C.; Pennington, R.T. The Great American Biotic Interchange revisited. Ecography 2010, 33, 326–332. [Google Scholar] [CrossRef]
  32. Keigwin, J.D., Jr. Pliocene closing of the Isthmus of Panama, based on biostratigraphic evidence from nearby Pacific Ocean and Caribbean Sea cores. Geology 1978, 6, 630–634. [Google Scholar] [CrossRef]
  33. Coates, A.G.; Obando, J.A. The geologic evolution of the Central American Isthmus. In Evolution and Environment in Tropical America; Jackson, J.B.C., Budd, A.F., Coates, A.G., Eds.; University of Chicago Press: Chicago, IL, USA, 1996; pp. 21–56. [Google Scholar]
  34. Montes, C.; Cardona, A.; Jaramillo, C.; Pardo, A.; Silva, J.C.; Valencia, V.; Ayala, C.; Pérez-Angel, L.C.; Ramírez, V.; Niño, H. Middle Miocene closure of the Central American seaway. Science 2015, 348, 226–229. [Google Scholar] [CrossRef] [Green Version]
  35. Bacon, C.D.; Silvestro, D.; Jaramillo, C.; Smith, B.T.; Chakrabarty, P.; Antonelli, A. Biological evidence supports an early and complex emergence of the Isthmus of Panama. Proc. Natl. Acad. Sci. USA 2015, 112, 6110–6115. [Google Scholar] [CrossRef] [Green Version]
  36. O’Dea, A.; Lessios, H.A.; Coates, A.G.; Eytan, R.I.; Restrepo-Moreno, S.A.; Cione, A.L.; Collins, L.; de Queiroz, K.; Farris, D.W.; Norris, R.D.; et al. Formation of the Isthmus of Panama. Sci. Adv. 2016, 2, e1600883. [Google Scholar] [CrossRef] [Green Version]
  37. Daza, J.M.; Smith, E.N.; Páez, V.P.; Parkinson, C.L. Complex evolution in the Neotropics: The origin and diversification of the widespread genus Leptodeira (Serpentes: Colubridae). Mol. Phylogenet. Evol. 2009, 53, 653–667. [Google Scholar] [CrossRef]
  38. Pinto-Sánchez, N.R.; Ibáñez, R.; Madriñán, S.; Sanjur, O.I.; Bermingham, E.; Crawford, A.J. The Great American Biotic Interchange in frogs: Multiple and early colonization of Central America by the South American genus Pristimantis (Anura: Craugastoridae). Mol. Phylogenet. Evol. 2012, 62, 954–972. [Google Scholar] [CrossRef]
  39. Elmer, K.R.; Bonett, R.M.; Wake, D.B.; Lougheed, S.C. Early Miocene origin and cryptic diversification of South American salamanders. BMC Evol. Biol. 2013, 13, 59. [Google Scholar] [CrossRef] [Green Version]
  40. Palumbi, S.R. Nucleic acids II: The polymerase chain reaction. In Molecular Systematics; Hillis, D.M., Moritz, C., Mable, B.K., Eds.; Sinauer Associates: Sunderland, MA, USA, 1996; pp. 205–247. [Google Scholar]
  41. Kessing, B.; Croom, H.; Martin, A.; McIntosh, C.; McMillan, W.O.; Palumbi, S. The Simple Fool’s Guide to PCR, Version 1.0; University of Hawaii: Honolulu, HI, USA, 1989. [Google Scholar]
  42. Crawford, A.J.; Bermingham, E.; Polanía, C. The role of tropical dry forest as a long-term barrier to dispersal: A comparative phylogeographical analysis of dry forest tolerant and intolerant frogs. Mol. Ecol. 2007, 16, 4789–4807. [Google Scholar] [CrossRef] [PubMed]
  43. Maddison, W.P.; Maddison, D.R. Mesquite: A Modular System for Evolutionary Analysis. Version 3.10. Available online: http://mesquiteproject.org (accessed on 1 September 2016).
  44. Swofford, D.L. PAUP*. Phylogenetic Analysis Using Parsimony (*and Other Methods); Version 4; Sinauer Associates: Sunderland, MA, USA, 2003. [Google Scholar]
  45. Lanfear, R.; Frandsen, P.B.; Wright, A.M.; Senfeld, T.; Calcott, B. PartitionFinder 2: New methods for selecting partitioned models of evolution for molecular and morphological phylogenetic analyses. Mol. Biol. Evol. 2016, 34, 772–773. [Google Scholar] [CrossRef] [Green Version]
  46. Lanfear, R.; Calcott, B.; Ho, S.Y.; Guindon, S. PartitionFinder: Combined selection of partitioning schemes and substitution models for phylogenetic analyses. Mol. Biol. Evol. 2012, 29, 1695–1701. [Google Scholar] [CrossRef] [Green Version]
  47. Zwickl, D.J. Genetic Algorithm Approaches for the Phylogenetic Analysis of Large Biological Sequence Datasets under the Maximum Likelihood Criterion. Ph.D. Thesis, The University of Texas at Austin, Austin, TX, USA, 2006. [Google Scholar]
  48. Miller, M.A.; Pfeiffer, W.; Schwartz, T. Creating the CIPRES Science Gateway for inference of large phylogenetic trees. In Proceedings of the Gateway Computing Environments Workshop (GCE), New Orleans, LA, USA, 14 November 2010; pp. 1–8. [Google Scholar]
  49. Felsenstein, J. Confidence limits on phylogenies: An approach using the bootstrap. Evolution 1985, 39, 783–791. [Google Scholar] [CrossRef] [PubMed]
  50. Bouckaert, R.; Heled, J.; Kühnert, D.; Vaughan, T.; Wu, C.H.; Xie, D.; Suchard, M.A.; Rambaut, A.; Drummond, A.J. BEAST 2: A software platform for Bayesian evolutionary analysis. PLoS Comput. Biol. 2014, 10, e1003537. [Google Scholar] [CrossRef] [PubMed] [Green Version]
  51. Bouckaert, R.; Alvarado-Mora, M.V.; Pinho, J.R. Evolutionary rates and HBV: Issues of rate estimation with Bayesian molecular methods. Antivir. Ther. 2013, 18, 497–503. [Google Scholar] [CrossRef] [PubMed] [Green Version]
  52. Gernhard, T. The conditioned reconstructed process. J. Theor. Biol. 2008, 253, 769–778. [Google Scholar] [CrossRef] [Green Version]
  53. Macey, J.R.; Schulte, J.A., II; Larson, A.; Fang, Z.; Wang, Y.; Tuniyev, B.S.; Papenfuss, T.J. Phylogenetic relationships of toads in the Bufo bufo species group from the eastern escarpment of the Tibetan Plateau: A case of vicariance and dispersal. Mol. Phylogenet. Evol. 1998, 9, 80–87. [Google Scholar] [CrossRef] [Green Version]
  54. Crawford, A.J. Relative rates of nucleotide substitution in frogs. J. Mol. Evol. 2003, 57, 636–641. [Google Scholar] [CrossRef]
  55. Rambaut, A.; Drummond, A.J.; Xie, D.; Baele, G.; Suchard, M.A. Posterior summarization in Bayesian phylogenetics using Tracer 1.7. Syst. Biol. 2018, 67, 901–904. [Google Scholar] [CrossRef] [Green Version]
  56. Matzke, N.J. BioGeoBEARS’: Biogeography with Bayesian (and Likelihood) Evolutionary Analysis in R Scripts. Available online: http://CRAN.R-project.org/package=BioGeoBEARS (accessed on 21 February 2018).
  57. Matzke, N.J. Model selection in historical biogeography reveals that founder-event speciation is a crucial process in island clades. Syst. Biol. 2014, 63, 951–970. [Google Scholar] [CrossRef]
  58. Kumar, S.; Stecher, G.; Tamura, K. MEGA7: Molecular Evolutionary Genetics Analysis version 7.0 for bigger datasets. Mol. Biol. Evol. 2016, 33, 1870–1874. [Google Scholar] [CrossRef] [Green Version]
  59. Kimura, M. A simple method for estimating evolutionary rate of base substitutions through comparative studies of nucleotide sequences. J. Mol. Evol. 1980, 16, 111–120. [Google Scholar] [CrossRef] [PubMed]
  60. Fouquet, A.; Gilles, A.; Vences, M.; Marty, C.; Blanc, M.; Gemmel, N.J. Underestimation of species richness in Neotropical frogs revealed by mtDNA analyses. PLoS ONE 2007, 2, e1109. [Google Scholar] [CrossRef] [PubMed]
  61. Vences, M.; Thomas, M.; Bonett, R.M.; Vieites, D.R. Deciphering amphibian diversity through DNA barcoding: Chances and challenges. Philos. Trans. R. Soc. B Biol. Sci. 2005, 360, 1859–1868. [Google Scholar] [CrossRef] [Green Version]
  62. Flechas, S.V.; Sarmiento, C.; Cárdenas, M.E.; Medina, E.M.; Restrepo, S.; Amézquita, A. Surviving chytridiomycosis: Differential anti-Batrachochytrium dendrobatidis activity in bacterial isolates from three lowland species of Atelopus. PLoS ONE 2012, 7, e44832. [Google Scholar] [CrossRef] [Green Version]
  63. Savage, J.M. The harlequin frogs, genus Atelopus, of Costa Rica and western Panama. Herpetologica 1972, 28, 77–94. [Google Scholar]
  64. Lötters, S.; Böhme, W.; Günther, R. Notes on the type material of the neotropical harlequin frogs Atelopus varius (Lichtenstein & Martens, 1856) and Atelopus cruciger (Lichtenstein & Martens, 1856) deposited in the Museum für Naturkunde of Berlin (Anura, Bufonidae). Mitteilungen Aus Dem Mus. Für Naturkunde Berl. Zool. Reihe 1998, 74, 173–184. [Google Scholar]
  65. Rodríguez, C.; Rollins-Smith, L.; Ibáñez, R.; Durant-Archibold, A.A.; Gutiérrez, M. Toxins and pharmacologically active compounds from species of the family Bufonidae (Amphibia, Anura). J. Ethnopharmacol. 2017, 198, 235–254. [Google Scholar] [CrossRef] [Green Version]
  66. Wells, K.D. The Ecology and Behavior of Amphibians; University of Chicago Press: Chicago, IL, USA, 2007. [Google Scholar]
  67. Ree, R.H.; Smith, S.A. Maximum likelihood inference of geographic range evolution by dispersal, local extinction, and cladogenesis. Syst. Biol. 2008, 57, 4–14. [Google Scholar] [CrossRef] [Green Version]
  68. Castroviejo-Fisher, S.; Guayasamin, J.M.; Gonzalez-Voyer, A.; Vila, C. Neotropical diversification seen through glassfrogs. J. Biogeogr. 2014, 4, 66–80. [Google Scholar] [CrossRef] [Green Version]
  69. Winston, M.E.; Kronaure, D.J.C.; Moreau, C.S. Early and dynamic colonization of Central America drives speciation in Neotropical army ants. Mol. Ecol. 2017, 26, 859–870. [Google Scholar] [CrossRef]
  70. Warburg, M.R. Ecophysiology of Amphibians Inhabiting Xeric Environments; Springer: Berlin, Germany, 1997. [Google Scholar]
  71. Cruz-Piedrahita, C.; Navas, C.A.; Crawford, A.J. Life on the edge: A comparative study of ecophysiological adaptations of frogs to tropical semiarid environments. Physiol. Biochem. Zool. 2018, 91, 740–756. [Google Scholar] [CrossRef] [Green Version]
  72. Bacon, C.D.; Molnar, P.; Antonelli, A.; Crawford, A.J.; Montes, C.; Vallejo-Pareja, M.C. Quaternary glaciation and the Great American Biotic Interchange. Geology 2016, 44, 375–378. [Google Scholar] [CrossRef] [Green Version]
  73. Zippel, K.; Ibáñez, D.R.; Lindquist, E.D.; Richards, C.L.; Jaramillo, A.C.A.; Griffith, E.J. Implicaciones en la conservación de las ranas dorados de Panamá, asociadas con su revisión taxonómica. Herpetotropicos 2006, 3, 29–39. [Google Scholar]
  74. Lindquist, E.D.; Hetherington, T.E. Tadpoles and juveniles of the Panamanian golden frog, Atelopus zeteki (Bufonidae), with information on development of coloration and patterning. Herpetologica 1998, 54, 370–376. [Google Scholar]
  75. Ibáñez, D.R.; Jaramillo, C.A.; Solís, F.A. Una especie nueva de Atelopus (Amphibia: Bufonidae) de Panamá. Caribb. J. Sci. 1995, 31, 57–64. [Google Scholar]
  76. Dunn, E.R. New frogs from Panama and Costa Rica. Occas. Pap. Boston Soc. Nat. Hist. 1931, 5, 385–401. [Google Scholar]
  77. Cochran, D.M.; Goin, C.J. Frogs of Colombia. U. S. Natl. Mus. Bull. 1970, 288, 1–655. [Google Scholar] [CrossRef]
  78. Lynch, J.D.; Suárez-Mayorga, A. Catálogo de anfibios en el Chocó Biogeográfico. In Colombia Diversidad Biótica IV, El Chocó Biogeográfico/Costa Pacífica; Rangel, O., Ed.; Universidad Nacional de Colombia: Bogotá, Colombia, 2004; Volume I, pp. 654–668. [Google Scholar]
  79. Pounds, J.A. Amphibians and reptiles. In Monteverde: Ecology and Conservation of a Tropical Cloud Forest; Nadkarni, N.M., Wheelwright, N.T., Eds.; Oxford University Press: New York, NY, USA, 2000; pp. 149–177. [Google Scholar]
  80. Crawford, A.J.; Cruz, C.; Griffith, E.; Ross, H.; Ibáñez, R.; Lips, K.R.; Driskell, A.C.; Bermingham, E.; Crump, P. DNA barcoding applied to ex situ tropical amphibian conservation programme reveals cryptic diversity in captive populations. Mol. Ecol. Resour. 2013, 13, 1005–1018. [Google Scholar] [CrossRef]
Figure 1. Map of Isthmian Central America showing the collecting localities of the samples used for this study. Each species is indicated with a different color, as follows: Atelopus chiriquiensis, grey; A. senex, white; A. varius, yellow; A. zeteki, orange; A. limosus, green; A. certus, red; A. glyphus, brown; A. sp. “Puerto Obaldía-Capurganá”, light blue; A. sp. “Monteverde”, violet. The yellow|orange and violet|white circles indicate the localities where A. varius and A. zeteki or A. sp. “Monteverde” and A. senex, respectively, were found in sympatry.
Diversity 12 00360 g001
Figure 2. Maximum likelihood (ML) tree inferred from DNA sequences of two mitochondrial genes (COI and cyt b) from the species of Atelopus of Central and South America. Outgroup samples consisting of non-Atelopus bufonids were removed for better visualization of the ingroup and are shown in Supplementary Figure S2. Branch support for all major clades is indicated as non-parametric bootstrap values under ML and maximum parsimony (MP) above and below each branch, respectively. However, to improve visualization of the tree, support values for only the earliest-diverging lineages of within-population samples are shown. A dash indicates MP bootstrap support below 50%. Specimens are indicated by their field or museum voucher number, or if not available, by the name of the locality where they were obtained. Specimens from the locality in which A. varius and A. zeteki are found in sympatry (Juan Lana, Panama) are marked with asterisks.
Diversity 12 00360 g002
Figure 3. A timetree of Atelopus diversification from a relaxed-clock MCMC Bayesian analysis using the software BEAST 2, calibrated using a mitochondrial DNA substitution rates of mitochondrial genes of bufonid frogs of Macey et al. [53], as corrected by Crawford [54]. Outgroup samples of non-Atelopus bufonid genera were trimmed for improved visualization of the ingroup and are shown in Supplementary Figure S3. Numbers above branches are the posterior probabilities of adjacent nodes. 95% credibility interval of the age of each node is indicated by horizontal bars. The grey vertical shading shows an interval between 3.2 to 2.76 million years ago (Ma) indicating the estimated time when gene flow among shallow marine animals and movement of surface water across the Panamanian Isthmus ended, according to O’Dea et al. [36]. Note that the minimum age of node H, the oldest node reconstructed as being entirely Central American, is still older than 3.2 Ma. Shading in the circles on each node correspond to the ancestral area reconstructions under the DEC model (white refers to South America, pale grey to Central America, and black to ancestors recovered as inhabiting both continents), and the letters in each circle correspond to rows in Table 3. Specimens are indicated by their field or museum voucher number, or if not available, with an arbitrary number and the name of the locality where they were obtained (sample details in Supplementary Table S1). Specimens from the locality in which A. varius and A. zeteki are found in sympatry (Juan Lana, Panamá) are marked with asterisks.
Diversity 12 00360 g003
Figure 4. Geographic color pattern variation of some harlequin frogs from central to eastern Panama and adjacent Colombia. Rows are arranged from west (1) to east (5) for columns (AC), and north (1) to south (5) for column (D). Columns represent regions from Central America to Colombia: (A) Costa Rica; (B) western to central Panama; (C) central to eastern Panama and adjacent Colombia; (D) eastern Panama and Darién Province, Panama (14) to adjacent Colombia (5). Unscaled photographic images of: (A1,A2) Atelopus sp. “Monteverde” from the Monteverde Cloud Forest Reserve, Punta Arenas-Alajuela Provinces, Costa Rica (Figure 1, locality 12); (A3) male and (A4) female Atelopus senex from Volcán Barba, Parque Nacional Braulio Carrillo, Heredia Province, Costa Rica; (A5) male Atelopus senex, MVZ 203769, from the Refugio Nacional Tapantí, Costa Rica (Figure 1, locality 13); (B1) male and (B2) female Atelopus chiriquiensis from Río Candelaria, Parque Internacional La Amistad, Panama; (B3) Atelopus varius from Cerro Tute, Parque Nacional Santa Fe, Panama (Figure 1, locality 27); (B4) Atelopus varius from Río Tigrero, Coclé Province, Panama (Figure 1, locality 20); (B5) Atelopus zeteki, sample K37, Quebrada Juan Lana, San Miguel Abajo, Coclé Province, Panama (Figure 1, locality 24); (C1) Atelopus zeteki from the headwaters of Río María, Sorá, Panamá Oeste Province, Panama (Figure 1, locality 37); (C2) Atelopus zeteki from Cerro Azul (Cerro La Victoria), Panamá Province, Panama (Figure 1, locality 31); (C3) Atelopus limosus from type locality, San Juan de Pequení, Panamá Province, Panama (Figure 1, locality 8); (C4) Atelopus limosus from Nusagandi, Comarca Guna Yala, Panama (Figure 1, locality 9); (C5) Atelopus sp. “Puerto Obaldía-Capurganá” from Capurganá, Chocó Department, Colombia (Figure 1, locality 15); (D1) Atelopus glyphus, sample no. 10, from north-western Serranía de Pirre, Panama (Figure 1, locality 5); (D2) Atelopus glyphus, CH 5613, from southern Serranía de Pirre, Panama (Figure 1, locality 7); (D3) Atelopus certus from Cerro Sapo, Darién Province, Panama; (D4) Atelopus certus, CH 4665, from Serranía de Jingurudó, Darién Province, Panama (Figure 1, locality 1); (D5) Atelopus elegans from Isla Gorgona, Cauca Department, Colombia. Some of Central American Atelopus have bright colors with contrasting patterns and are known to have potent skin toxins [65] and are, therefore, considered to be aposematic [66]. Photo credits: David Cannatella (A5), David M. Dennis (A1,B1,B2,C2,C4), Sandra V. Flechas (C5,D5), Michael and Patricia Fogden (A2,A3,A4), Marcos A. Guerra (C3,D1,D2), Roberto Ibáñez (D4), César A. Jaramillo (D3), Erik D. Lindquist (B3,B4), and Guido Sterkendries (B5,C1).
Diversity 12 00360 g004
Table 1. Number of parsimony-informative sites, singletons, and invariant sites (in base pairs) for each gene region among the ingroup samples.
GeneLength of Sequence (bp)Invariant SitesSingletonsParsimony-Informative Sites
cyt b71453735142
COI63949310136
Table 2. Pairwise genetic distances obtained using a Kimura 2-parameter model of sequence evolution (i.e., K2P distance × 100) for the mitochondrial fragments of the COI and cyt b genes of the species of Atelopus from Central America. Ranges represent minimum and maximum observed distances. Intraspecific genetic distances are shown along the diagonal of the matrix. Values above and below the diagonal correspond to the interspecific genetic distances of the cyt b and COI genes, respectively.
Taxon123456789
1A. sp. “Puerto Obaldía-Capurganá”0–0.797.94–8.597.45–7.939.17–10.6010.9–11.48.58–8.919.23–10.809.57–11.8010.1–10.80
0–0.86
2A. certus 0–0.632.91–3.167.58–9.609.78–9.967.77–7.807.95–9.117.31–8.268.12–8.45
4.55–5.400–0.28
3A. glyphus 07.58–9.119.93–10.107.62–7.798.28–9.107.93–8.908.44–8.77
4.89–5.221.43–2.070–0.42
4A. senex 0.16–1.337.00–8.684.06–5.195.90–8.425.12–8.446.86–8.18
6.09–7.146.78–8.226.59–7.320–1.92
5A. sp. “Monteverde” (MVZ 164818) 05.276.36–7.006.67–7.467.00–7.32
6.80–7.136.61–7.316.434.62–4.910
6A. chiriquiensis 0–0.163.46–4.374.20–5.585.13–5.75
5.76–6.276.80–7.336.62–6.804.91–5.534.73–4.900–0.28
7A. limosus 0.31–1.263.75–5.274.36–5.91
5.92–6.796.09–7.495.92–6.624.72–5.935.93–6.285.08–5.430.28–1.42
8A. varius 0–2.082.86–4.66
6.12–7.006.28–8.255.92–6.984.81–5.965.56–6.294.24–4.923.89–4.740–2.44
9A. zeteki 0–0.79
6.44–7.136.63–7.696.09–6.445.15–6.455.92–6.634.73–5.243.71–4.892.72–3.720–0.28

