Article

Medium-Term Influence of Organic Fertilization on the Quality and Yield of a Celery Crop

by
Antonio Sánchez Navarro
1,*,
Juan Antonio Sánchez Romero
2,
María del Carmen Salas Sanjuan
2,
María Arantzazu Blanco Bernardeau
1 and
María José Delgado Iniesta
1,*
1
Department of Agricultural Chemistry, Geology and Pedology, Faculty of Chemistry, University of Murcia, Campus de Espinardo, 30100 Murcia, Spain
2
Department of Plant Production, University of Almeria, La Cañada San Urbano, 04120 Almeria, Spain
*
Authors to whom correspondence should be addressed.
Agronomy 2020, 10(9), 1418; https://doi.org/10.3390/agronomy10091418
Submission received: 22 July 2020 / Revised: 9 September 2020 / Accepted: 10 September 2020 / Published: 18 September 2020
(This article belongs to the Special Issue Agroecology and Organic Agriculture for Sustainable Crop Production)

Abstract

:
For some years now, part of society has been demanding the implementation of circular economy models and so the use of organic matter as a source of nutrients is once again taking center stage. In this scenario, the aim of this work was to implement an integrated management model for a farm and to study the influence on a celery crop of organic amendments (animal and vegetable) obtained on the farm, as opposed to inorganic fertilization. This influence was evaluated for the yield and the nutritional, organoleptic, and sanitary quality of the resulting crops. The yield and size of the marketable parts of the celery plants were greater with the inorganic treatment; however, the nutritional and sanitary quality was better in the organic treatments, while the chromatic attributes, as well as the total P and Ca, were not affected by the different fertilization treatments applied. It is therefore concluded that the organic management model is environmentally and economically sustainable.

1. Introduction

The promotion of the circular economy is one of the priority objectives to protect our planet and to alleviate the greenhouse effect that has been gradually increasing in recent years [1]. One way of promoting it in the agricultural sector is through the development of integral management systems for farms, where the use of sustainable cultivation techniques and the reuse, within the productive process, of the remains or wastes of both animal and vegetable origin are promoted [2,3,4].
Among the sustainable agricultural practices, one of the most widely used is the use of organic fertilizers as substitutes for synthetic mineral fertilizers. The use of organic amendments increases the quality and fertility of the soils dedicated to crops [5,6] and has positive effects on production by supplying the macro and micronutrients essential for crop development [7], thereby enhancing yields [8]. It also improves the physical properties, such as the structure [9,10], as well as the chemical [11] and biological [12] properties of the soil. In addition, it has been demonstrated that the use of organic amendments promotes the role of soil as a carbon sink [12,13,14,15,16].
The influence of cropping systems on nutrition and food safety is a controversial matter [17]. The management of sustainable agriculture, which implies the application of organic fertilizer to the soil as an alternative to mineral fertilizer, requires a better knowledge of the processes which take place after such application [17]. Some studies have found that organically managed systems are less productive than conventional systems [18], while others have indicated that they can be as productive as conventional ones [19,20]. During the transition from conventional to organic systems, crop yields frequently fall, although the subsequent recovery of yields indicates that organic systems could be profitable [21,22].
When organic amendments of animal or vegetable origin are generated within the same agricultural operation, their use not only has the favorable effects mentioned, but can also be considered as a sustainable method of waste disposal and therefore makes a positive contribution to the integral preservation of the carbon cycle.
Likewise, the use of organic amendments can also influence the quality of the crops, understood in a broad sense that includes criteria related to both their external appearance (color, freshness) and their internal appearance, as well as other factors or concepts. Therefore, the overall quality of a product must be the sum of the following concepts and/or standards: (1) commercial quality, (2) hygienic and health protection quality, (3) nutritional quality, and (4) sensory quality. The quality of fruits and vegetables is determined principally by their color and other visual aspects, firmness, flavor, and nutritional value [23,24]. Several authors [25,26,27] have shown that there are real differences between the nutrient contents of organic and conventional crops. The nitrate content in organic crops is significantly lower than in conventional crops [28,29]. A low content of nitrate in the edible part of the plant is very important for human health, due to its potential transformation into nitrite, which is more likely to interact with hemoglobin and affect oxygen transportation and can also form nitrosamines in the stomach that are carcinogenic [30]. In particular, leafy vegetables such as spinach, lettuce, beetroot, and celery contain nitrate at significant levels [31].
To carry out this study, a 2.5 km2 farm, located in the NE of Granada province (southern Spain), was selected to develop several projects for the sustainable management of its water, soil, and livestock resources [32]. The farm includes a plot of almond trees, which occupies most of it, and a plot of cereals, both in dry farming regimes. There is also a plot with water available for irrigation, dedicated to the cultivation of vegetables. The farm is completed with a flock of Segureña breed sheep. The climate is markedly continental, so the management of the holding consists of a rotation of dryland arable crops, based on cereals and legumes, between the months of October and May. It is completed by a cycle of open-air horticulture on the irrigated plot, taking advantage of the summer period. The selection of the horticultural crops grown took into account the soil and climatic characteristics of the area, as well as the seasonal situation of the markets; there is little demand for these products during the summer, because other countries (international markets) have their own production at this time and because they are in low demand in national markets. That is why the selected vegetables (celery, broccoli, cabbage, tomato, pepper, etc.) are preferably destined for agro-industrial processing, and the selection of varieties, the design of the plantation, and the specifications for harvesting take this into account.
Celery, the species chosen for this research, has good agronomic behavior as a summer crop and can form part of rotation systems together with other traditional crops in the area, such as cereals or winter legumes, thus contributing to sustainable soil management. In addition, celery contains volatile compounds with toxic effects, which may be related to its resistance to pests [33]. Nutritionally, celery has good vitamin C (80 mg kg−1) and vitamin A (2.07 mg kg−1) levels and is rich in potassium (2800 mg kg−1), yet it is a hypocaloric vegetable: every edible kilogram provides only 200 kcal [34]. Many of its phytonutrients fall into the category of phenolic antioxidants and have been shown to provide anti-inflammatory benefits as well. Consequently, celery is widely consumed in Western Europe and North America, where it has a high commercial value.
The starting hypotheses that justify this study are as follows:
Hypothesis 1.
Organic fertilization (i.e., the use of organic animal and vegetable waste generated on the farm), as the basis of nutritional contributions together with crop rotation will form a system of integrated and sustainable management of the farm.
Hypothesis 2.
The yield and quality of celery will differ depending on the type of fertilization used.
The objectives to be achieved in this project are as follows:
  • To compare organic and inorganic fertilization regarding the production and quality of a celery crop destined for the agro-food industry.
  • To determine the suitability of the proposed integrated management system for the farm, before transferring the results to the productive sector as a more environmentally friendly agricultural model.

2. Materials and Methods

2.1. Field Experiment Design

The experiment was carried out on a soil with an Ap1-Ap2-Bw-Ckm profile, which meets the requirements for classification as a Petrocalcic Kastanozem [35]. The study site, UTM coordinates 30S 535450-4192119, was located at the Research Center of Agriculture (Patronato Rodríguez Penalva) farm in Huéscar (Granada, Spain). Some characteristics of the soil, before starting the experiment, are shown in Table 1.
The area is characterized by a cold continental Mediterranean climate, with a mean annual temperature of 12.7 °C and a thermal oscillation of 15 °C. The annual precipitation is 400 mm, rainfall being concentrated in spring and autumn while winter and summer are predominantly dry. The annual ETP is 599 mm, and so the annual water deficit is approximately 200 mm.
Three fertilization treatments were tested: two organic treatments, local sheep manure (LSM) (Table 2) and a commercial organic amendment (COA) called ECOMAÑAN (F0001491/2020) (Table 3), and one inorganic treatment (I), considered as the control. In treatment LSM local sheep manure was applied at a rate of 1.7 kg m−2, while in the COA treatment a commercial organic amendment based on sheep manure and peat was applied at a rate of 0.7 kg m−2.
The inorganic or mineral treatment (I) involved conventional chemical fertilizers (such as 15-15-15, NH4NO3, KNO3, K2SO4, H3PO4, Ca(NO3)2NH4NO3, and Mg(NO3)2 solution) applied, both as a basal dressing and in drip irrigation systems, at the levels recommended by various authors [36] for this crop, as listed in Table 4. The experimental design of the trial was based on two initial precepts. The first was that treatment I should be carried out taking as a reference the fertilizer recommendations existing in the bibliography, especially in similar soils. The second was the imposition of the European regulations governing organic farming, which limit the amount of N/ha to a maximum of 170 kg.
A completely randomized experimental design with three treatments and four replicates was used, giving a total of 12 plots, each of 64 m2. The organic plots received organic amendments before planting. The mineral plot received synthetic fertilizer applied, according to values recommended for celery crops, through drip irrigation systems [36]. The doses (kg ha−1) of the nutrients (N, P, K, Ca, and Mg) applied to the inorganic and organic plots are shown in Table 4. Commercial pesticides were not used during this study on any of the experimental plots, and only products authorized for organic agriculture (R (EC) 834/2007) were used for pest and disease control.
During the three years of the experiment, the celery crop (Apium graveolens var. dulce cv. Golden Spartan) was rotated with cereal and legume mixtures in winter and spring. Celery was sown in the first week of May, with a density of 12 plants m−2. Transplanting was done in the third week of June and harvesting at the end of October, in all crop cycles. Before sowing the celery crop, the field was prepared and chisel-plowed in order to ensure homogeneous conditions regarding both soil and irrigation. Plant residues from the celery crop were grazed in autumn and, therefore, not incorporated into the soil. Subsequently, the field was tilled with a disk harrow before sowing the cereal and legume crop at the end of January.

2.2. Sampling and Plant Analysis

In order to determine the quality of the crops obtained in the different treatments and to determine the optimal harvest date, measurements of physical parameters (such as commercial classification according to size, defects in the flesh, and surface color) were made in the field during the last two weeks of the vegetative cycle, using non-destructive methods. As an index of maturity, to establish the most appropriate harvest date, the color coordinates L*, a*, and b* (CIELAB system) were measured directly on the surface of the fresh stalks, together with the color attributes C*, H*, and S*, using an X-RITE colorimeter (model 918).
In addition, samples were obtained for the physical and chemical analyses of the fresh or freeze-dried stalks in the laboratory. For each replicate of the three fertilization treatments, all the plants from an area of 8 m2, randomly selected in each replicate, were harvested for the evaluation of yield parameters (total and commercial yield, plant density, and harvest index). Of these, four plants were selected at random to measure the physical parameters and chemical parameters.
Macro and mesonutrients contents (N, P, K, Ca, and Mg) were determined on three different dates in the second half of the vegetative cycle, with the last sampling coinciding with the harvest. Four leaves and four stalks, each oriented towards one cardinal point, were sampled from each plant, one from each of four different plants. The samples were dried at 105 °C for 5 h, crushed for plant material, and stored for later chemical analysis. Three sets of plant analyses were performed during each crop cycle to determine the content of bioelements (N, P, K, Ca, and Mg).

2.3. Yield

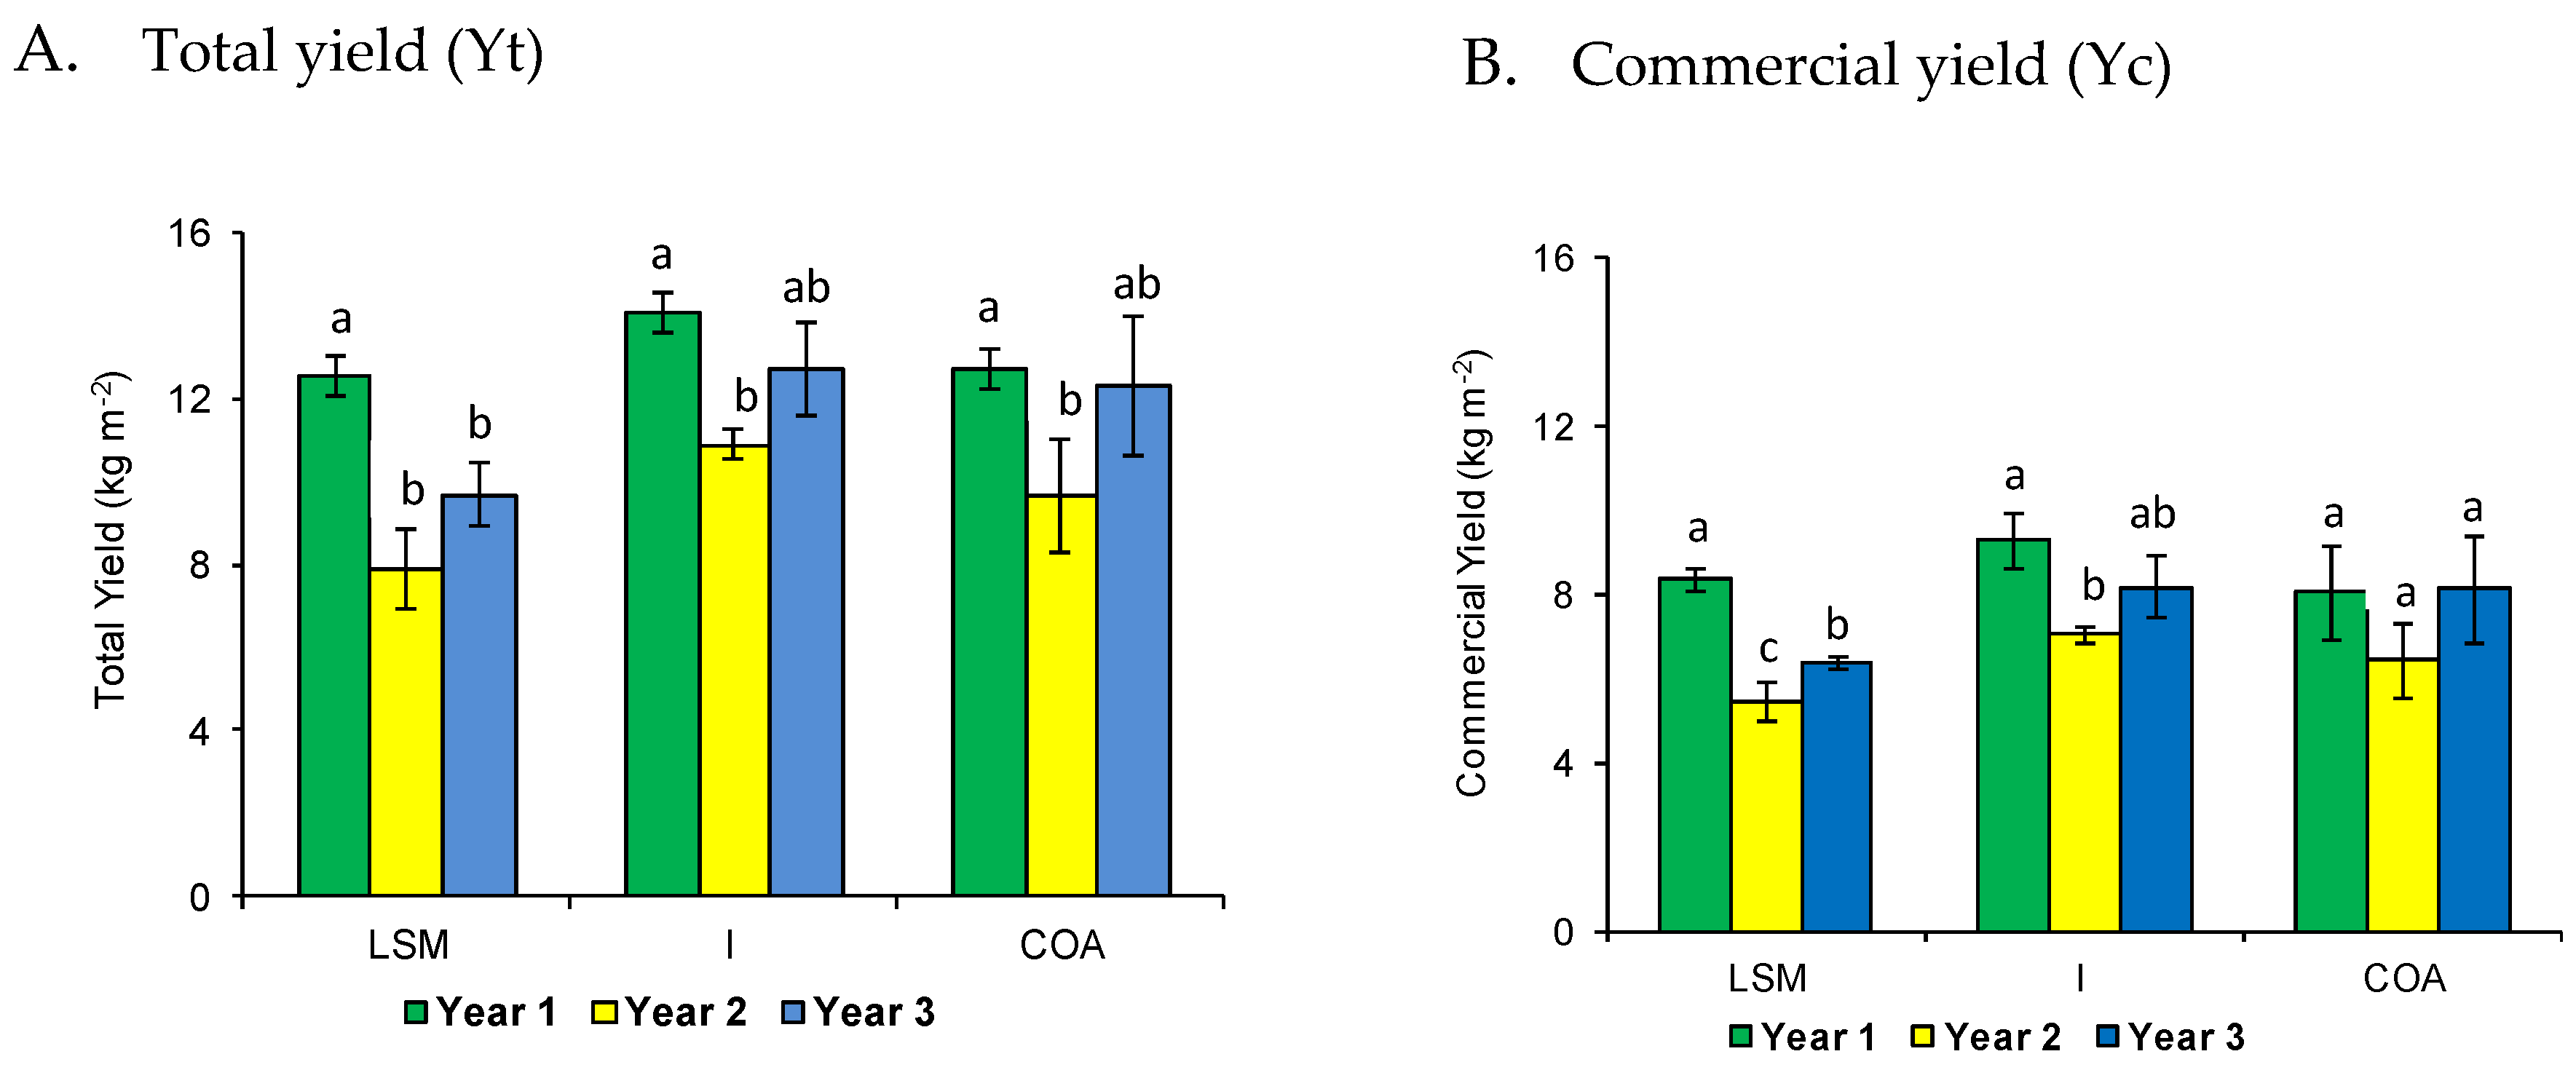
During the three years of the trial, data were obtained for the total yield (Yt) and commercial yield (Yc), expressed in kg m−2, and the harvest index (HI), for each fertilization treatment.
The harvested yield corresponds to the total yield after the removal of senescent leaves from the stalks, whereas the commercial yield refers to the stalks cut 28 cm above the stalk base and devoid of leaves. These specifications are the standards required by most customers for industry ly processed celery.
The HI represents the ratio between the Yc and the total harvested yield, expressed as part per unit.

2.4. Physical Parameters

To follow the development of the celery surface color, a non-destructive method was used. The reflected color was measured as CIELAB coordinates (L*, a*, and b*), using an X-RITE colorimeter (model 918), for four randomly selected areas of the stalk surface. I, II, III, and IV are the average values of the four readings of each replicate. All color measurements refer to the CIE (Commission Internationale de l’Eclairage) and the Standard Illuminate D65 at a 10° observer angle. The chromatic attributes H (metric angle of tonality), C (chroma), and S (metric saturation) were calculated from the CIELAB coordinates, according to Equations (1)–(3), respectively. The a*/b* ratio and the color index (CI, Equation (4)) were also calculated.
H ( rad ) = tan 1 b * / a *
C = ( a * 2 + b * 2 ) 1 / 2
S = C 2 / L * = ( a * 2 + b * 2 ) / L *
CI = 1000 a * / ( L * b * )
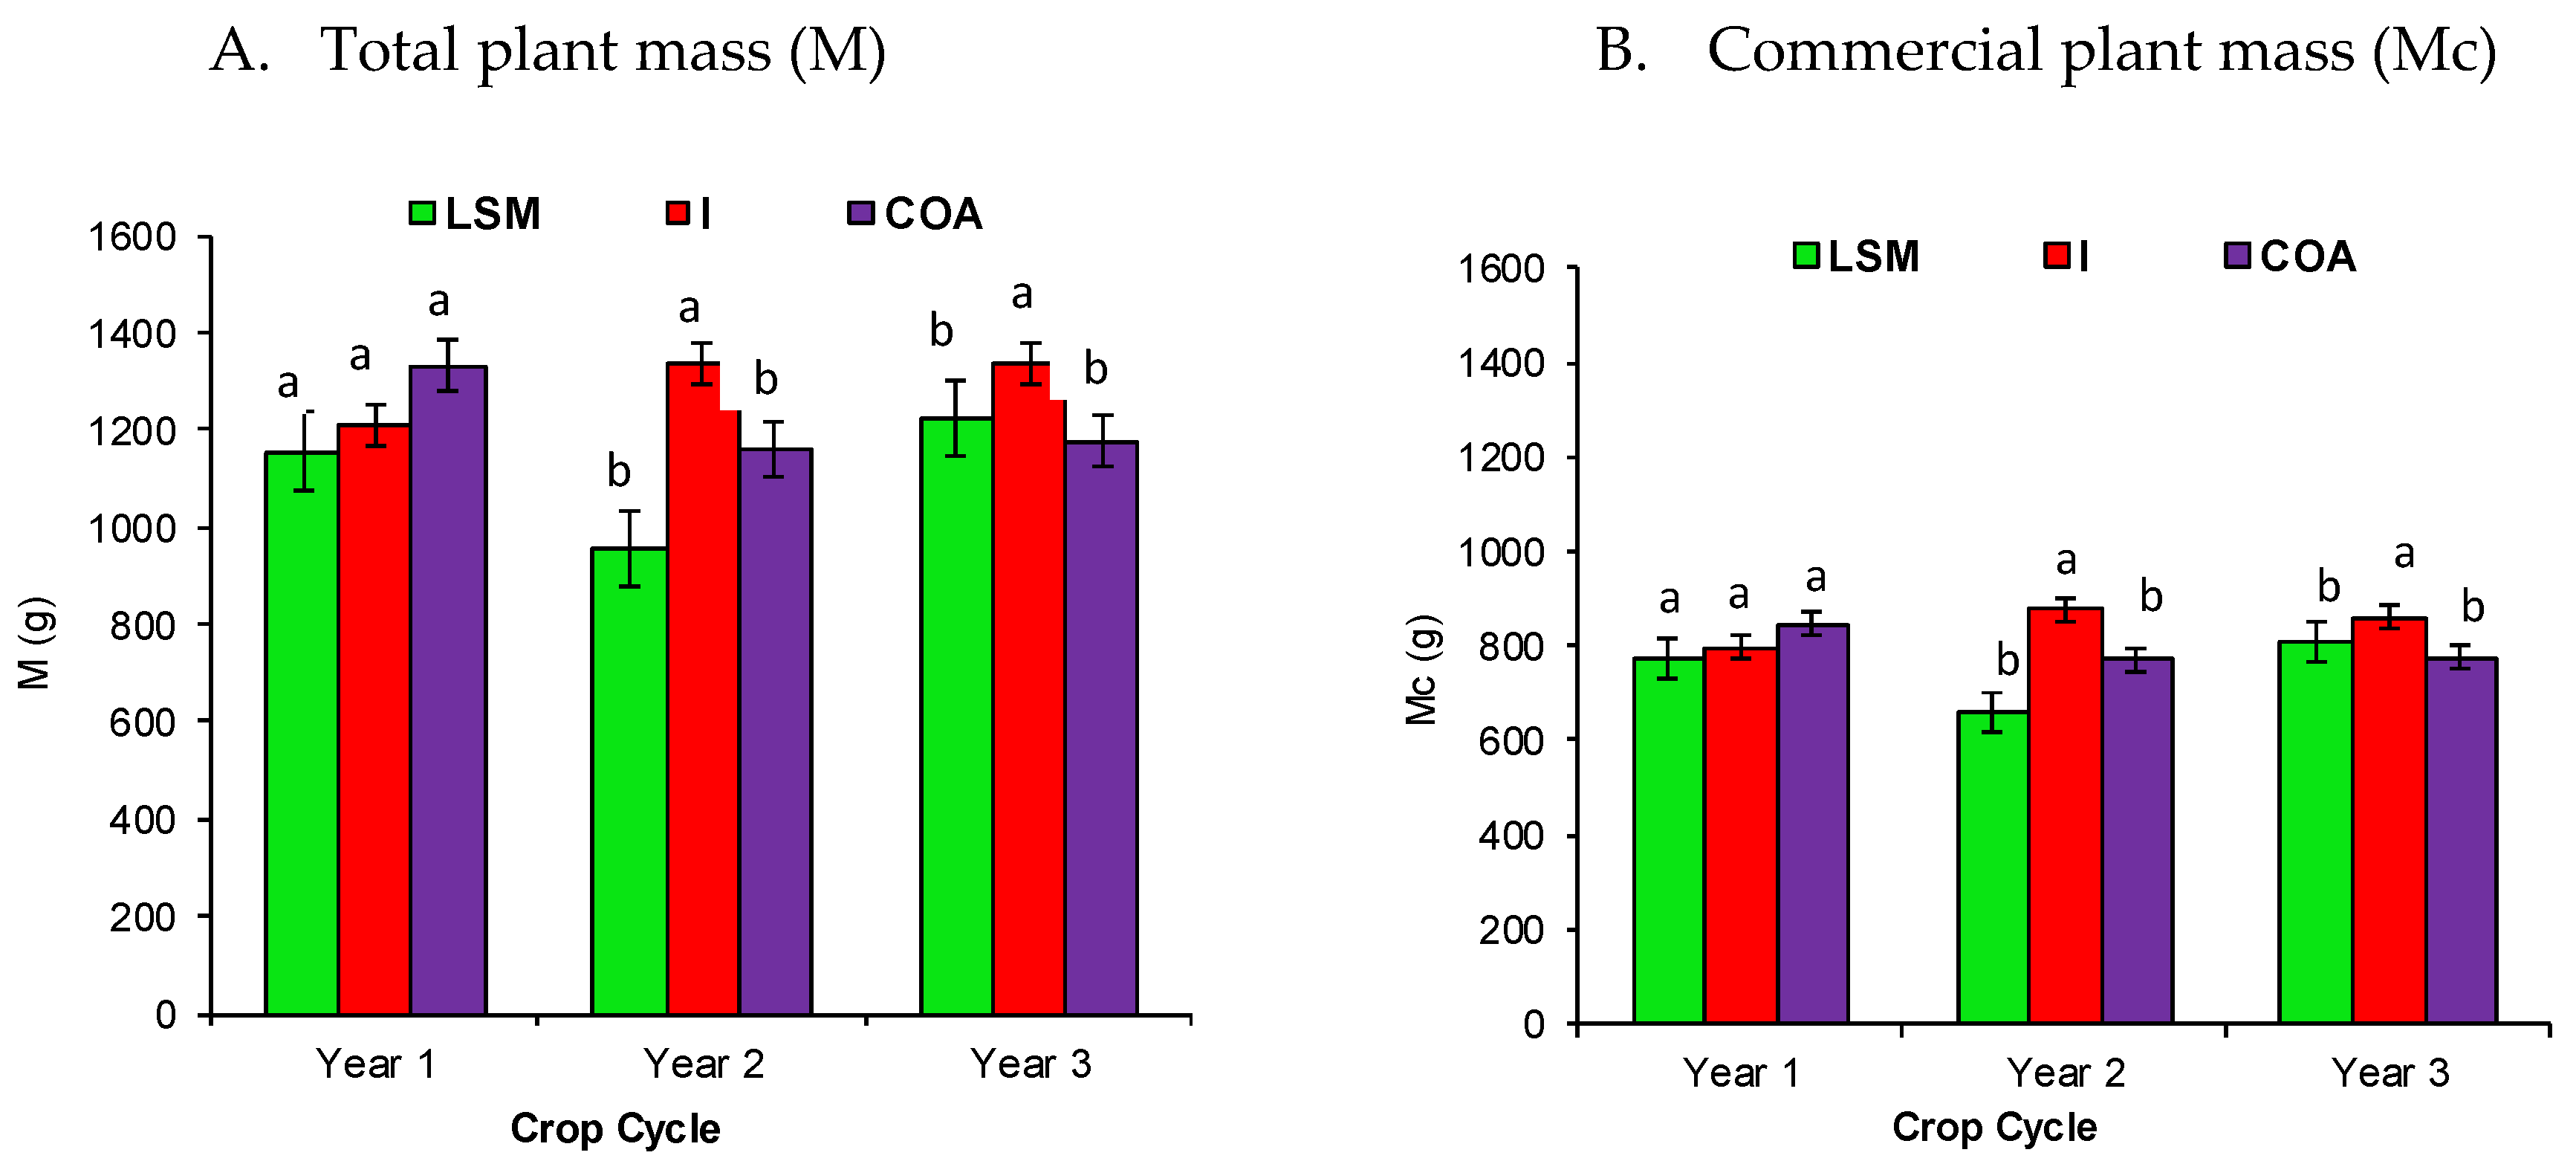
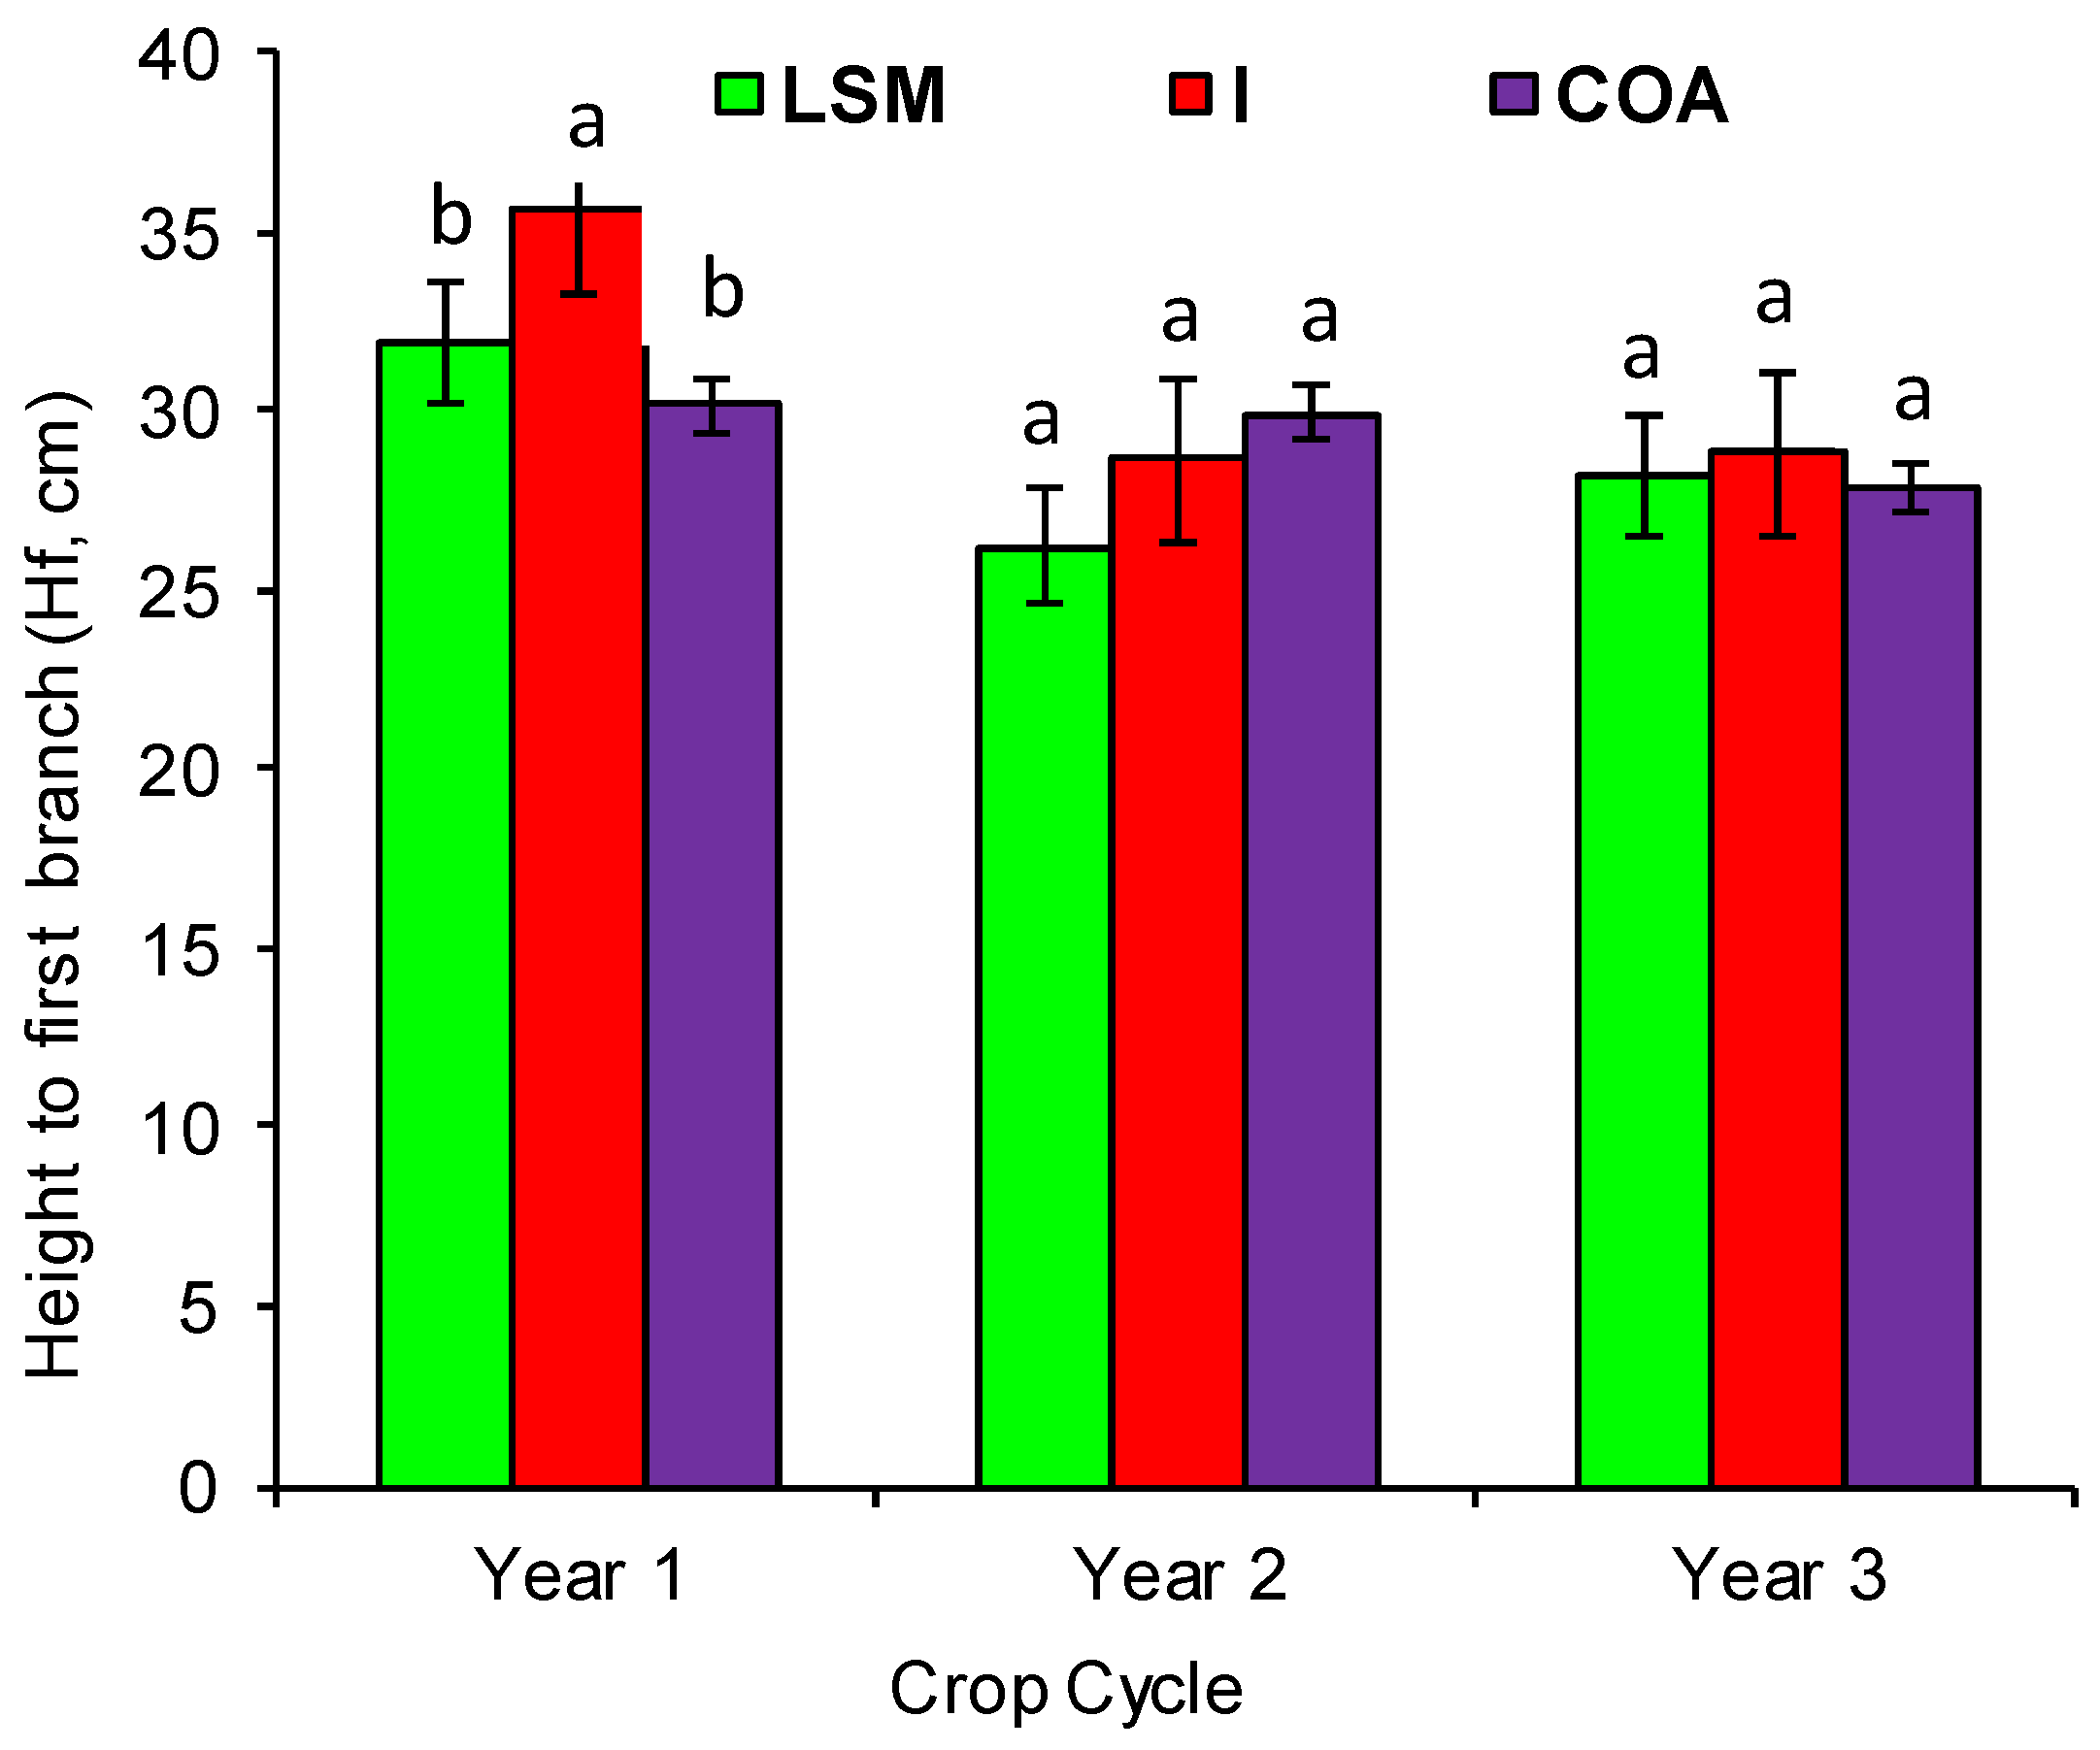
The physical parameters evaluated in this work were determined at the time considered optimal for harvest. The physical quality of the celery plant from each treatment was characterized by reference to the following parameters: total plant mass (M), commercial plant mass (Mc), height to first branch (Hf), head diameter (Dh), and dry matter percentage (DM) in stalks and leaves.
Total plant mass (M) can be considered a direct measurement of the size of the plant and therefore of its caliber. It may therefore be considered the first quality attribute and the most easily quantifiable. The commercial mass (Mc) refers to the fresh mass of the plant harvested by cutting the stalks and leaves at a distance of 28 cm from the base. Both M and Mc were measured to the nearest 0.01 g.
Many wholesale customers request to be informed about the value of the Hf since it is an important commercial parameter.
The dry matter (DM) content was determined according to the official method, using the mass of the stalk when fresh and after drying it in a forced-air oven at 105 °C for 5 h.
The Hf and the Dh were measured with gauging devices of 1 and 0.01 mm precision, respectively.

2.5. Chemical Parameters

The chemical parameters relevant to celery quality were determined at the time considered optimal at full harvest. The total soluble solids content (TSS) was measured with a refractometer with a sensitivity of 0.1° Brix. The stalk nitrate concentration was determined according to the Brucine method [37].
The bioelement (N, P, K, Ca, Mg) concentrations in the celery stalk and leaf were determined by ICP-MS following acid-digestion (HNO3 + HClO4), on three dates in the second half of the celery crop cycle. The results correspond to the averages of the four replicates per treatment.

2.6. Statistical Analysis

The data were analyzed using the General Linear Model of the SPSS Version 10.0 statistical package (SPSS, Chicago, IL, USA). The experimental data were subjected to analysis of variance (ANOVA) [38], using Tukey’s multiple range test to estimate statistical differences among means. Differences were considered significant at the 5% and 1% level (p = 0.05 and p = 0.01, respectively).

3. Results and Discussion

3.1. Crop Yield

Figure 1A,B show the values of Yt and Yc, respectively obtained in the mineral and organic fertilization plots over a period of three years. As can be seen, the highest yields were obtained in the first year in all the treatments, with a considerable decrease in the second year (of 38% in LSM and 23% in I). Finally, in the third year, the total and commercial yields of celery returned almost to the levels of the first year, except in the LSM treatment, the production being 23% lower than in the first year. The sharp decrease in production in the second year was probably related to the adverse meteorological conditions that year, which led to 20–25% of celery plants being inviable.
Statistically significant differences in yield were observed between the organically amended plots and those receiving synthetic fertilizer, especially between LSM and I. In this sense, Yt was highest in treatment I, lowest in LSM, and intermediate in COA, with average values for the three campaigns of 12.54, 10.04, and 11.55 kg m−2, respectively. Yc behaved similarly, with average values for the same treatments of 8.16, 6.73, and 7.53 kg m−2, respectively. Finally, considering the yields of LSM as 100%, the relative Yt percentages were 125 and 115 for I and COA, respectively, and the Yc percentages were 121 and 112 for I and COA, respectively. In addition, the HI was consistent among the treatments, at around 0.65.
The influence of the use of organic amendments on crop growth is quite a controversial matter, but in general organically managed soils provide lower crop yields than conventionally managed ones [39,40,41]. However, the yields of the former improve after successive applications, since organic amendments act as a source of slow-release N [42]. In this regard, it should be noted that in organic agriculture the most important nutritional limitation is usually N, because its concentration and availability in the soil depend on the mineralization of organic matter and the amounts of N in the form of NH4+ that can be retained in the exchange complex. Organic N mineralization is controlled by soil and climatic conditions and cultural practices, among other factors [43]. These factors also moderate the mineralization-immobilization balance of N [44].
The efficiency of N use by the crop—i.e., the ratio between the kg ha−1 of fresh matter obtained as biomass and the kg ha−1 of N incorporated into the soil—was much higher in the organic treatments, especially in the case of COA, with a mean of 477 kg ha−1 of biomass present in the commercial product per kg of N incorporated into the soil, compared with 399 for LSM and 324 for I. This greater efficiency in the first years of conversion to organic agriculture was also observed in other experiments [22,45,46]. These results contrast with the amount of N supplied in the different treatments, which was inversely proportional to the efficiency found. Indeed, the highest amount of N added, in the control treatment, was about 250 kg ha−1 per year, which is similar to the levels described in the relevant literature [36]. In contrast, the lowest amount of N supplied was in the organic treatment with LSM, which had a high C/N ratio (≥20), indicating that the N was present in complex structures (proteins, amino acids, amines, etc.), difficult for the plants to take up in the short term, but also scarcely leachable and therefore with low contaminating power. In the COA treatment even lower quantities of N were supplied, but a commercial amendment of this type contains significant quantities of easily available N (15% of the N is in the ammoniacal form) that can be used in the first stages of growth by the celery. The use of organic amendments as a source of N should be properly managed, as the supply of N may be lower than the demand of the crops, leading to possible deficiencies of this macronutrient, while in other cases, if the mineralization is very fast, the supply may be higher than the demand, therefore leading to losses of N [47].

3.2. Physical Properties

3.2.1. Color Parameters

Table 5 shows the mean values of the CIELAB colorimetric coordinates L*, a*, and b* determined at the surface in ripe celery for each of the fertilizer treatments employed (LSM, I, and COA). With these three coordinates, we obtained the chromatic attributes H, C, and S (Table 6).
There were no significant differences among the three fertilization treatments, although the highest luminosity (L*) values were reached in LSM, followed by COA, and finally the control (I). Similar results were obtained by Madrid et al. [27] in a study of the influence of organic fertilization and irrigation levels on the production of tomato fruit for industrial processing. The a* and b* values were homogeneous across the three treatments. The food industry uses the Hunter color values (L*, a*, b*) to determine the quality of the products it processes; so, based on these, the quality of the crops obtained was homogeneous. A decrease in brightness (L*) has been associated with browning [48]; consequently, the chromatic attributes are an indicator that allows one to determine the state of ripeness of fruits and vegetables and, therefore, to estimate the optimal length of the ripening stage. The hue angle (H) is an indicator of color change from green to yellow and red, related to the enzymatic degradation of chlorophyll [49]. The maximum value of H represents the date on which ripening commenced, while the minimum (full color intensity) indicates full ripeness and the initiation of senescence. The values of H were similar for the three treatments (LSM, I, and COA) and during the three years of the trial, with no significant differences among them (Table 6). The values of chroma (C) were higher in the organic fertilizer treatments (LSM and COA) than in the control (I), which suggests that in the organic treatments the ripening process was faster and therefore the optimal harvesting point was reached earlier, a conclusion also reached by other authors [50].
Regardless of whether the product is intended for fresh consumption or for industrial processing, the first signs of decay and decreasing shelf life for celery are the loss of green color and the onset of pithiness [51]. Furthermore, during handling, cutting, washing, and rinsing for minimal processing, mechanical damage occurs, together with oxidative stress [52]. Vascular browning at the ends of fresh-cut celery stalks is one of three major changes that reduce their shelf life [53]. According to Viña and Chaves [54], the main factors reducing celery quality are physiological effects, the increased rate of several biochemical reactions, and damage induced by microorganisms. To evaluate the variation in the surface color of celery, it is common practice to follow the post-harvest evolution of the a*/b* ratio and the color index (CI). Negative values close to zero were obtained for the first of these parameters in all three treatments, making it impossible to statistically differentiate among them. The CI behaved similarly to the a*/b* ratio (Table 6).

3.2.2. Total Plant Mass

From a commercial point of view, if destined for fresh consumption, the celery plant should weigh more than 800 g for industrial processing, the intended use of the crop obtained in our trial, all plants are cut to a length of 28 cm from the plant base, regardless of their mass.
In our case, except for the first year, there were significant differences between the control (I) and the organically treated plants, the former being larger. However, there were no significant differences between the LSM and COA treatments, the individual plants weighing between 956 and 1332 g. In this respect it is normal for organically grown vegetables to have slightly lower masses and calibers than their conventionally grown counterparts [39,55] and for the number of plants harvested to be lower than the number originally transplanted as a result of losses sustained through competition with weeds [56], as occurred in our experiment (Figure 2A).

3.2.3. Total and Commercial Plant Mass

In general, the HI had a value of 0.65–0.66, regardless of the year and treatment. As can be seen in Figure 2B, Mc indicates significant differences between the inorganic treatment and the two organic treatments in the last two years of the experiment. This superior development with the conventional cultivation may be due to the greater availability of N, which would induce more rapid and greater growth [18].

3.2.4. Height to First Branch

As indicated above, Hf is a commercial quality indicator of importance to some customers, especially when celery is intended for fresh consumption. As can be seen in Figure 3, except in the first year of the trial, when Hf was highest in the inorganic treatment (significantly so), no significant differences were observed among the treatments. Again, this greater development of the conventionally cultivated crop may be due to the superior availability of N, and the consequent more rapid and greater growth [18].

3.2.5. Head Diameter and Dry Matter

Table 7 shows the data corresponding to the Dh and the DM of the stalk and leaf, parameters related to the commercial and nutritional quality, respectively. As can be seen, Dhs showed no clear tendency. For example, the highest value was observed in COA in year 1, in I in the second year, and in LSM plants in the third year, but statistically significant differences were only found in last two years.
The DM percentage (Table 7) was higher in the leaves than in the stalk.
There were no statistically significant differences in the DM percentage among the treatments except in the second year, when it was lower in I and COA, which agrees with the findings of other authors, who attributed it to an increase in the level of water in the cell protoplasm resulting from fertilization with nitrogenated chemicals [57,58].

3.3. Chemical Properties

3.3.1. Total Soluble Solids

The TSS levels were similar in all three treatments in the first and third years (Table 8), while in the second year the LSM plants had significantly higher levels. The second-year results agree with the findings of other authors in different crops [59], which strengthens the idea that organic farming based on sheep manure produces food with a higher organoleptic quality than conventional agriculture [58].

3.3.2. Nitrate Content

Figure 4A,B show the nitrate concentrations in the stalk and leaf, respectively of the celery plants at the time of harvest in the three crop cycles of the experiment. A low content of nitrate in the plants is very important for human health, due to its potential for transformation into nitrite, which is more likely to interact with hemoglobin and affect blood oxygen transportation [30]. The nitrate concentrations were significantly higher following the inorganic and COA treatments than with the LSM treatment. Many studies have found lower nitrate contents in organically fertilized crops, particularly leafy vegetables [29,60,61,62]. The nitrate concentration in a plant is the balance between the nitrate uptake and its metabolic reduction. Excessive commercial fertilizer or animal waste application, or its improper timing, can lead to excessive nitrate levels in the plants [31]. In addition, nitrate can combine with secondary amines to yield nitrosamines with carcinogenic effects [63].

3.3.3. Macro and Mesonutrients Contents

Nitrogen

The N content in the stalk and leaf of celery was significantly higher after mineral fertilization than with organic fertilization, especially LSM, for which the lowest values were obtained (Table 9). Other authors have reported similar results in bean [64], in tomato [11,62,65], and in beetroot, chard, carrot, marrow, and pepper [62]. Very few studies found a higher content in organic crops, as was the case in carrot, cabbage, and lettuce [66]. In other studies, performed in lettuce [67], in potato tubers and sweet corn [68], and in celery [69], no differences were found between organic and mineral fertilization. These apparently uneven results suggest that the concentration of N in plant tissues depends on the availability of N in the soil. The nature of the organic amendments and their degree of maturity might have a strong influence on this. Thus, in a fresh waste the amount of N in the form of NH4+ can be high, while in amendments subjected to composting N becomes part of more complex organic structures and, therefore, in order to be available, it is necessary to mineralize or degrade them [70].
However, the lower levels of N found in the plants from the organic plots are not necessarily a negative point because high assimilation of N may produce a high content of protein, but of lower quality [71].

Phosphorus

The leaf and stalk concentrations of P did not differ significantly between the organic and mineral fertilization (Table 9). Likewise, the P concentrations reported in the literature do not show clear significant differences between celery crops receiving organic fertilizer and those receiving mineral fertilizer [69]. Another report showed no differences between the P concentrations of organically and conventionally fertilized bean crops [64]. In our study, the higher available P content in the soil of the LSM plots (45.4 mg kg−1 in LSM, compared to 27.1 mg kg−1 in I and 28.3 mg kg−1 in COA) did not lead to higher P concentrations in the stalk and leaf of the celery plants. However, in various long-term organic farming field experiments the plant P concentrations were higher in organic treatments than in mineral treatments [62].

Potassium

Table 9 shows the generally higher concentration of K in the celery stalk and leaf in the organic plots, especially LSM, in the first and third years of the experiment. There were some significant differences among the treatments in the first and third celery crop cycles. It is interesting to note that, although the supply of K was lower with organic fertilization, the K concentration in the stalk and leaf was higher, especially in LSM, due to the higher soil available K concentration in the organic plots, with average values of 0.93, 0.44, and 0.49 g kg−1 of K in LSM, I, and COA soil, respectively. Similarly, other authors have found significant differences in the plant K concentration when comparing organic and conventional farming [62,69,72].

Calcium

The leaf Ca concentration was higher in the plants grown in the organic plots, although in the stalk there were no significant differences between organic and mineral fertilization (Table 9). Results similar to ours were obtained in previous experiments in several vegetable species [59,62], in potato [61], and in snap bean [64].

Magnesium

The stalk Mg concentration was higher in the plants from the organic plots, while the leaf Mg concentration was higher in the mineral plots, with some significant differences (Table 9). As observed in this study, the Mg concentrations reported in the literature do not show any clear trend in relation to organic and mineral fertilization [69,72,73,74,75].

4. Conclusions

The use of organic amendments as a basis for fertilization in a celery crop destined for industrial processing originated significant differences with respect to conventional fertilization, both in the yield and in the quality of the harvested product. In this sense, the yield and the size of the stalks were greatest in treatment I, followed by COA and LSM. Similar differences in yield were observed throughout the study period, related to the higher availability of N in treatment I, followed by COA. However, the efficiency of use of the applied N as well as certain quality parameters the nitrate, N, K, and Ca contents were improved by organic fertilization, which can be considered positive for both human health and the environment. The chromatic attributes of the celery stalks, as well as their total P and Ca contents, were not affected by the fertilization treatments applied and so it can be said that the growth and ripening cycle of the celery plants was independent of the fertilization applied.
In addition, the results obtained suggest that the most appropriate management system for this farm should contemplate a symbiosis between the crops and the livestock existing on it, so that the waste or by-products of one can be used as sustainable inputs for the other. Thus, the proposed integrated management system would use the manure from the livestock, duly composted, to fertilize the existing crops, especially summer vegetables, and, in turn, the remains of these crops, as well as the herbaceous crops (legumes and grasses), would be used as feed for the sheep. This management model could be extended to the other farms in the area, where some 268000 tm of manure is generated annually, thus contributing to the consolidation of a circular economic model that is economically and environmentally sustainable.

Author Contributions

Conceptualization: A.S.N. Methodology: A.S.N., M.J.D.I.; Software: A.S.N., M.A.B.B.; Formal analysis: M.A.B.B., J.A.S.R., M.d.C.S.S.; Research: A.S.N., J.A.S.R., M.d.C.S.S., M.J.D.I.; Preparation of the original draft of the writing: A.S.N., J.A.S.R., M.d.C.S.S.; Review and editing of the writing: A.S.N., M.J.D.I.; Visualization: A.S.N., M.J.D.I.; Supervision: A.S.N., M.J.D.I.; Administration of the project: A.S.N.; Acquisition of funds: A.S.N. All authors have read and agreed to the published version of the manuscript.

Funding

This research received no external funding.

Acknowledgments

We thank David J. Walker for his revision of the written English in the manuscript. This project would not have been possible without the kind collaboration of the Rodriguez Penalva Patronage, which provided the plot and contributed to the daily management of the study.

Conflicts of Interest

The authors declare no conflict of interest.

References

  1. Sauvé:, S.; Bernard, S.; Sloan, P. Environmental Science. Sustainable development and circular economy: Alternative concepts for transdisciplinary research. Environ. Dev. 2016, 17, 48–56. [Google Scholar] [CrossRef] [Green Version]
  2. Adediran, J.A.; Taiwo, L.B.; Sobulo, R.A. Effect of Organic Wastes and Method of Composting on Compost Maturity. Nutrient Composition of Compost and Yields of Two Vegetable Crops. J. Sustain. Agric. 2003, 22, 95–109. [Google Scholar] [CrossRef]
  3. Lal, R. Soils and sustainable agriculture. A review. Agron. Sustain. Dev. 2008, 28, 57–64. [Google Scholar] [CrossRef]
  4. Lichtfouse, E.; Navarrete, M.; Debeaked, P.; Souchère, V.; Alberola, C.; Ménassieu, J. Agronomy for Sustainable Agriculture: A Review. In Sustainable Agricululture; Lichtfouse, E., Navarrete, M., Debaeke, P., Véronique, S., Alberola, C., Eds.; Springer: Berlin/Heidelberg, Germany, 2009. [Google Scholar]
  5. Madrid, R.; Valverde, M.; Guillén, I.; Sánchez, A.; Lax, A. Evolution of organic matter added to soil under cultivation conditions. J. Plant Nutr. Soil Sci. 2004, 167, 39–44. [Google Scholar] [CrossRef]
  6. Williams, H.; Colombi, T.; Keller, T. The influence of soil management on soil health: An on-farm study in southern Sweden. Geoderma 2020, 360, 114010. [Google Scholar] [CrossRef]
  7. Bulluck, L.R.; Brosius, M.; Evanylo, G.K.; Ristaino, J.B. Organic and synthetic amendments influence soil microbial, physical and chemical properties on organic and conventional farms. Appl. Soil Ecol. 2002, 19, 147–160. [Google Scholar] [CrossRef]
  8. Bonanomi, G.; D’Ascoli, R.; Scotti, R.; Gaglione, S.A.; Gonzalez-Caceres, M.; Sultana, S.; Scelza, R.; Rao, M.A.; Zoina, A. Soil quality recovery and crop yield enhancement by combined application of compost and wood to vegetables grown under plastic tunnels. Agric. Ecosyst. Environ. 2014, 192, 1–7. [Google Scholar] [CrossRef]
  9. Jiao, C.J.; Xu, Q.L.; Wang, C.Y.; Li, F.M.; Li, Z.X.; Wang, Y.F. Patrón de acumulación de toxina—ODAP durante la vida útil y efecto de elementos nutrientes sobre el contenido de—ODAP en plántulas de Lathyrus sativus. J. Agric. Sci. 2006, 144, 543–549. [Google Scholar] [CrossRef]
  10. Bottinelli, N.; Angers, D.A.; Hallaire, V.; Michot, D.; Le Guillou, C.; Cluzeau, D.; Heddadj, D.; Menasseri-Aubry, S. Tillage and fertilization practices affect soil aggregate stability in a Humic Cambisol of Northwest France. Soil Tillage Res. 2017, 170, 14–17. [Google Scholar] [CrossRef]
  11. Clark, M.S.; Horwath, W.R.; Shennan, C.; Scow, K.M. Changes in soil chemical properties resulting from organic and low input farming practices. Agron. J. 1998, 90, 662–671. [Google Scholar] [CrossRef] [Green Version]
  12. Ferreras, L.; Gomez, E.; Toresani, S.; Firpo, I.; Rotondo, R. Effect of organic amendments on some physical. chemical and biological properties in a horticultural soil. Bioresour. Technol. 2006, 97, 635–640. [Google Scholar] [CrossRef] [PubMed]
  13. Mikha, M.M.; Rice, C.W. Tillage and manure effects on soil and aggregate-associated carbon and nitrogen. Soil Sci. Soc. Am. J. 2004, 68, 809–816. [Google Scholar] [CrossRef]
  14. Blair, N.; Faulkner, R.D.; Till, A.R.; Korschens, M.; Schulz, E. Impactos de la gestión a largo plazo en el suelo C. N y la fertilidad física: Parte II: Bad Lauchstadt experimentos estáticos y extremos FYM. Soil Tillage Res. 2006, 91, 39–47. [Google Scholar] [CrossRef]
  15. Huang, Y.; Wang, L.; Wang, W.; Li, T.; He, Z.; Yang, X. Current status of agricultural soil pollution by heavy metals in China: A meta-analysis. Sci. Total Environ. 2019, 651, 3034–3042. [Google Scholar] [CrossRef]
  16. Mathew, I.; Shimelis, H.; Mutema, M.; Minasny, B.; Chaplot, V. Crops for increasing soil organic carbon stocks a global metaanalysis. Geoderma 2020, 367. [Google Scholar] [CrossRef]
  17. Zhang, Y.; Cao, S.Z.; Zhang, Z.Y.; Meng, X.D.; Hsiaoping, C.; Yin, C.B.; Jiang, H.; Wang, S. Nutritional quality and health risks of wheat grains from organic and conventional cropping systems. Food Chem. 2020, 308, 82–93. [Google Scholar] [CrossRef]
  18. Mäder, P.; Fliessbach, A.; Dubois, D.; Gunst, L.; Fried, P.; Niggli, U. Soil fertility and biodiversity in Organ. Farm. Science 2002, 296, 1694–1697. [Google Scholar] [CrossRef] [Green Version]
  19. Pimentel, D.; Hepperly, P.; Hanson, J.; Douds, D.; Seidel, R. Environmental, Energetic, and economic comparisons of organic and conventional farming systems. Bioscience 2005, 55, 573–582. [Google Scholar] [CrossRef]
  20. Posner, J.L.; Baldock, J.O.; Hedtcke, J.L. Organic and conventional production systems in the Wisconsin integrated cropping systems trials: I Productivity 1990–2002. Agron. J. 2008, 100, 253–260. [Google Scholar]
  21. Altieri, M.A. Agroecology: The science of sustainable agriculture. In Intermediate Technology; CRC Press: Boca Raton, FL, USA, 1995. [Google Scholar]
  22. Archer, D.W.; Jaradat, A.A.; Johnson, J.M.; Weyers, S.L.; Gesch, R.W.; Forcella, F.Y.; Kludze, H.K. Crop productivity and economics during the transition to alternative cropping systems. Agron. J. 2007, 99, 1538–1547. [Google Scholar] [CrossRef] [Green Version]
  23. Chapagain, B.P.; Wiesman, Z. Effect of Nutri-Vant-Pea k foliar spray on plant development. yield and fruit quality in greenhouse tomatoes. Sci. Hortic. 2004, 102, 177–188. [Google Scholar] [CrossRef]
  24. Cooper, J.; Niggli, U.; Leifert, C. Handbook of Organic Food Safety and Quality; Woodhead Publishing: Cambridge, UK, 2007. [Google Scholar]
  25. Worthington, V. Nutritional Quality of Organic Versus Conventional Fruits, Vegetables, and Grains. J. Altern. Complement. Med. 2001, 7, 161–173. [Google Scholar] [CrossRef] [PubMed]
  26. Valverde, M.; Madrid, R.; García, A.L. Effect of the irrigation regime, type of fertilization and culture year on the physical properties of almond (cv. Guara). J. Food Eng. 2006, 76, 584–593. [Google Scholar] [CrossRef]
  27. Madrid, M.; Barba, E.M.; Sánchez-Navarro, A.; Lino, A. Effects of organic fertilizers and irrigation on processing tomato quality. J. Sci. Food Agric. 2009, 89, 2608–2615. [Google Scholar] [CrossRef]
  28. Vogtmann, H.; Matthies, K.; Kehres, B.; Meier-Ploeger, A. Enhanced food quality: Effects of compost on the quality of plant foods. Compos. Sci. Util. 1993, 1, 82–100. [Google Scholar] [CrossRef]
  29. Williams, C.M. Nutritional quality of organic food: Shades of grey or shades of green. Proc. Nutr. Soc. 2002, 51, 19–24. [Google Scholar] [CrossRef]
  30. Causeret, J. Nitrates, nitrites, nitrosamines: Apports alimentaires et santé. Ann. Fals. Exp. Chim. 1984, 77, 131–151. [Google Scholar]
  31. Maynard, D.N.; Barker, A.V.; Minotti, P.L.; Peck, N.H. Nitrate accumulation in vegetables. Adv. Agron. 1976, 28, 71–118. [Google Scholar]
  32. Ramos, M.E.; Robles, A.B.; Sánchez-Navarro, A.; González-Rebollar, J.L. Soil responses to different management practices in rainfed orchards in semiarid environments. Soil Tillage Res. 2011, 112, 85–91. [Google Scholar] [CrossRef]
  33. Hare, J.D. Ecological role of volatiles produced by plants in response to damage by herbivorous insects. Ann. Rev. Entomol. 2011, 56, 161–180. [Google Scholar] [CrossRef]
  34. Rizzo, V.; Muratore, T. Effects of packaging on shelf life of fresh celery. J. Food Eng. 2009, 90, 124–128. [Google Scholar] [CrossRef]
  35. Organización de las Naciones Unidas para la Agricultura y la Alimentación. Base Referencial Mundial del Recurso Suelo, 2014. Roma. Available online: http://www.fao.org/3/i3794es/I3794es.pdf (accessed on 12 May 2020).
  36. Rincón, L.; Pérez, C.; Sáez, J.; Abadía, A.; Pellicer, C. Extracción de nutrientes del apio en riego por goteo. Agrícola Vergel 2001, 233, 252–257. [Google Scholar]
  37. Ranney, T.A.; Bartlett, R.J. Rapid field determination of nitrate in natural waters. Soil Sci. Plant Anal. 1972, 3, 183–186. [Google Scholar] [CrossRef]
  38. Little, T.M.; Hills, F.J. Métodos Estadísticos para la Investigación en la Agricultura; Trillas: México City, Mexico, 1976. [Google Scholar]
  39. Gliessman, S.R.; Werner, M.R.; Swezey, S.L.; Caswell, E.; Cochran, J.; Rosado-May, F. Conversion to organic strawberry management changes ecological processes. Calif. Agric. 1996, 50, 24–31. [Google Scholar] [CrossRef]
  40. Herencia, J.F.; Ruiz, J.C.; Melero, S.; Maqueda, C.; Garcia-Galavis, P.A. A short-term comparison of organic and conventional agriculture in a silty loam soil using two organic amendments. J. Agric. Sci. 2008, 146, 1–11. [Google Scholar] [CrossRef] [Green Version]
  41. Eremeev, V.; Keres, I.; Tein, B.; Läniste, P.; Selge, A.; Luik, A. Effect of different production systems on yield and quality of potato. Agron. Res. 2009, 7, 245–250. [Google Scholar]
  42. Hartl, W.; Erhart, E. Crop nitrogen recovery and soil nitrogen dynamics in a 10-year field experiment with biowaste compost. J. Plant Nutr. Soil Sci. 2005, 168, 781–788. [Google Scholar] [CrossRef]
  43. Amlinger, F.; Götz, B.; Dreher, P.; Geszti, J.; Weissteiner, C. Nitrogen in biowaste and yard waste compost: Dynamics of mobilisation and availability—A review. Eur. J. Soil Biol. 2003, 39, 107–116. [Google Scholar] [CrossRef]
  44. Reddy, K.S.; Mohanty, M.; Rao, D.L.N.; Singh, M.; Dalal, R.C.; Rao, A.S.; Pandey, M.; Menzies, N. Nitrogen mineralization in a Vertisol from organic manures. green manures and crop residues in relation to their quality. Agrochimica 2008, 52, 377–388. [Google Scholar]
  45. Custic, M.; Poljak, M.; Cóga, L.; Cosic, T.; Toth, N.; Pecina, M. The influence of organic and mineral fertilization on nutrient status, nitrate accumulation and yield of head chicory. Plant. Soil Environ. 2003, 49, 218–222. [Google Scholar] [CrossRef]
  46. Hargreaves, J.C.; Adl, M.S.; Warman, P.R. The effects of organic and conventional nutrient amendments on strawberry cultivation: Fruit yield and quality. J. Sci. Food Agric. 2008, 88, 2669–2675. [Google Scholar] [CrossRef]
  47. Thorup-Kristensen, K.; Dresbøll, D.B. Incorporation time of nitrogen catch crops influences the N effect for the succeeding crop. Soil Use Manag. 2010, 26, 27–35. [Google Scholar] [CrossRef]
  48. Labuza, T.P.; Baisier, W.M. The kinetics of nonenzymatic browning. In Physical Chemistry of Foods; Schwartzberg, H.G., Hartel, R.W., Eds.; Marcel Dekker Inc.: New York, NY, USA, 1992; pp. 595–649. [Google Scholar]
  49. Brady, C.J. Fruit ripening. Ann. Rev. Plant Physiol. 1987, 38, 155–178. [Google Scholar] [CrossRef]
  50. Kabelka, E.; Yang, W.; Francis, D.M. Improved tomato fruit color within an inbred backcross line derived from Lycopersicon esculentum and L. hirsutum involves the interaction of loci. J. Am. Soc. Hortic. Sci. 2004, 129, 250–257. [Google Scholar] [CrossRef] [Green Version]
  51. Gomez, P.A.; Artes, F. Improved keeping quality of minimally fresh processed celery sticks by modified atmosphere packaging. LWT 2005, 38, 323–329. [Google Scholar] [CrossRef]
  52. Viña, S.Z.; Chaves, A.R. Antioxidant responses in minimally processed celery during refrigerated storage. Food Chem. 2006, 94, 68–74. [Google Scholar] [CrossRef]
  53. Saltveit, M.E.; Mangrich, M.E. Use of density measurements to study the effect of excision, storage, abscissic acid and ethylene on the development of pithiness in celery (Apium graveolens L.) stalks. J. Am. Soc. Hortic. Sci. 1996, 121, 137–141. [Google Scholar] [CrossRef]
  54. Viña, S.Z.; Chaves, A.R. Texture changes in fresh cut celery during refrigerated storage. J. Sci. Food Agric. 2003, 83, 1308–1314. [Google Scholar] [CrossRef]
  55. Vidal, C.; Steffens, C.; Mafra, A.L.; Albuquerque, J.A. Yield and fruit quality of apple from conventional and organic production systems. Pesqui. Agropecuária Bras. 2008, 4, 333–340. [Google Scholar]
  56. Delate, K.; Cambardella, A. Agroecosystem performance during transition to certified organic grain production. Agron. J. 2004, 96, 1288–1298. [Google Scholar] [CrossRef]
  57. Pieper, J.R.; Barrett, D.M. Effects of organic and conventional production systems on quality and nutritional parameters of processing tomatoes. J. Sci. Food Agric. 2008, 89, 177–194. [Google Scholar] [CrossRef]
  58. Rembialkowska, E.; Średnicka, D. Organic food quality and impact on human health. Agron. Res. 2009, 7, 719–727. [Google Scholar]
  59. Rembiałkowska, E. Organic food quality—Axioms and ambiguities. In Proceedings of the Joint Organic Congress, Odense, Denmark, 30–31 May 2006. [Google Scholar]
  60. Malmauret, L.; Parent-Massin, D.; Hardy, J.L.; Verger, P. Contaminants in organic and conventional food stuffs in France. Food Addit. Contam. 2002, 19, 524–532. [Google Scholar] [CrossRef] [PubMed]
  61. Hajslova, J.; Schulzova, V.; Slanina, P.; Janné, K.; Hellenäs, K.E.; Andersson, C. Quality of organically and conventionally grown potatoes: Four years study of micronutrients, metals, secondary metabolites, enzymic browning and organoleptic properties. Food Addit. Contam. 2005, 19, 524–532. [Google Scholar]
  62. Herencia, J.F.; Ruiz, J.C.; Melero, S.; Garcia-Galavis, P.A.; Morillo, E.; Maqueda, C. Comparison between organic and mineral fertilization for soil fertility levels, crop macronutrient concentrations and yield. Agron. J. 2007, 99, 973–983. [Google Scholar] [CrossRef]
  63. Farré, R.; Frígola, A. Nitratos: Aspectos bromatológicos. toxicológicos y analíticos. Alimentaria 1987, 14, 15–21. [Google Scholar]
  64. Phillips, S.B.; Mullins, G.L.; Donohue, S.J. Changes in snap bean yield. nutrient composition. and soil chemical characteristics when using broiler litter as fertilizer source. J. Plant Nutr. 2002, 25, 1607–1620. [Google Scholar] [CrossRef]
  65. Colla, G.; Mitchell, J.P.; Poudel, D.D.; Temple, S.R. Changes of tomato yield and fruit elemental composition in conventional, low input and organic systems. J. Sustain. Agric. 2002, 20, 53–67. [Google Scholar] [CrossRef]
  66. Schuphan, W. Nutritional value of crops as influenced by organic and inorganic fertilizer treatments. Qual. Plant. 1974, 23, 233–358. [Google Scholar] [CrossRef]
  67. Lairon, D.; Lafont, H.; Leonardi, J.; Hauton, J.C.; Ribaud, P. Comparaison de l’intérêt nutrítif de légumes produits par l’agriculture conventionnelle ou biologique. Sci. Aliment. 1982, 2, 203–205. [Google Scholar]
  68. Warman, P.R.; Havard, K.A. Yield. vitamin and mineral content of organically and conventionally grown potatoes and sweet corn. Agric. Ecosyst. Environ. 1998, 68, 207–216. [Google Scholar] [CrossRef]
  69. Sheng, J.P.; Liu, C.; Shen, L. Comparative Study of Minerals and Some Nutrients in Organic Celery and Traditional Celery. Spectrosc. Spectr. Anal. 2009, 29, 247–249. [Google Scholar]
  70. Antil, R.S.; Bar-Tal, A.; Fine, P.; Hadas, A. Predicting Nitrogen and Carbon Mineralization of Composted Manure and Sewage Sludge in Soil. Compost Sci. Util. 2013, 19, 33–43. [Google Scholar] [CrossRef]
  71. Magkos, F.; Arvaniti, F.; Zampelas, A. Organic food: Nutritious food or food for thought? A review of the evidence. Int. J. Food Sci. Nutr. 2003, 54, 357–371. [Google Scholar] [CrossRef] [PubMed]
  72. Gómez, A.; Pomares, F.; Baixauli, C. Valor nutritivo de la alcachofa y la lechuga bajo diferentes tipos de fertilización. Una alternativa para el mundo rural del tercer milenio. Actas III Congr. Soc. Esp. Agric. Ecol. 1998, 1, 299–308. [Google Scholar]
  73. Stamatiadis, S.; Werner, M.; Buchanan, M. Field assessment of soil quality as affected by compost and fertilizer application in a broccoli field (San Benito County. California). Appl. Soil Ecol. 1999, 12, 217–225. [Google Scholar] [CrossRef]
  74. Nakano, A.; Uehara, Y.; Yamauchi, A. Effect of organic and inorganic fertirrigation on yields. δ15N values. and δ13C values of tomato (Lycopersicon esculentum Mill cv Saturn). Plants Soil 2003, 255, 343–349. [Google Scholar] [CrossRef]
  75. Hirzel, J.; Rodriguez, N.; Zagal, E. Efecto de diferentes dosis de fertilización inorgánica con N. P. K y fuente orgánica (estiércol de broiler) sobre la producción de maíz y la fertilidad del suelo. Agric. Technol. 2004, 64, 365–374. [Google Scholar] [CrossRef]
Figure 1. (A). Total yield (Yt) and (B). commercial yield (Yc) of celery, as a function of the fertilization treatment: local sheep manure (LSM), mineral (I), and commercial organic amendment (COA). “a” and “b” indicate significant differences between the three years of each treatment at the 95% confidence level.
Agronomy 10 01418 g001
Figure 2. (A). Total plant mass (M) and (B). commercial plant mass (Mc) of the celery crop, as a function of the fertilization treatment: local sheep manure (LSM), inorganic treatment (I), and commercial organic amendment (COA). “a” and “b” indicate significant differences between the three years of each treatment at the 95% confidence level.
Agronomy 10 01418 g002
Figure 3. Height to first branch (Hf) of the celery crop, as a function of the fertilization treatment: local sheep manure (LSM), mineral (I), and commercial organic amendment (COA). “a” and “b” indicate significant differences between the three years of each treatment at the 95% confidence level.
Agronomy 10 01418 g003
Figure 4. (A). The nitrate content in the celery stalk and (B). The nitrate content in the celery leaf, according to the fertilization treatment: local sheep manure (LSM), inorganic treatment (I), and commercial organic amendment (COA). “a” and “b” indicate significant differences between the three years of each treatment at the 95% confidence level.
Agronomy 10 01418 g004
Table 1. Characteristics of the soil at the beginning of the experiment.
HorizonDepth (cm)OCTNC/NpHwpHKClECCECCaCO3
Ap10–3521.63.17.08.27.61.111.1453
Ap235–5212.41.77.38.37.61.512.3402
Bw52–6513.61.78.08.47.51.418.5349
Ckm65------ 875
OC (organic carbon, g kg−1); TN (total nitrogen, g kg−1); pHw (pH soil–water 1:1); pHKCl (pH soil–KCl 1:1); EC (electrical conductivity, dS m−1); CEC (cation exchange capacity, cmol+ kg−1); CaCO3 (calcium carbonate equivalents, g kg−1).
Table 2. Chemical analysis of the sheep manure (LSM), nutrients, given on a dry matter basis.
YearMpHECC/NOCTNPKCaMg
164.88.15.520481.124.06.119.618.03.7
259.78.05.320445.722.36.131.026.62.8
361.18.35.219439.023.16.125.421.14.2
M (% moisture); pH (pH 1:10); EC (electrical conductivity 1:5, dS m−1); OC (organic carbon, g kg−1); TN (total nitrogen, g kg−1); P (total phosphorus, g kg−1); K (total potassium, g kg−1); Ca (total calcium, g kg−1; Mg (total magnesium, g kg−1).
Table 3. Chemical analysis of the commercial organic amendment (COA), nutrients, given on a dry matter basis.
MpHECC/NOCTNONPKMgFeS
14.06.09.611.8232.623.319.810.29.61.411.641.9
M (% moisture); pH (pH 1:10); EC (electrical conductivity 1:10, dS m−1); OC (organic carbon, g kg−1); TN (total nitrogen, g kg−1); ON (organic nitrogen, g kg−1); P (total phosphorus, g kg−1); K (total potassium, g kg−1); Mg (total magnesium, g kg−1); Fe (total iron, g kg−1); S (total sulfur, g kg−1).
Table 4. The N, P, K, Ca, and Mg applied to the inorganic and organic plots (kg ha−1).
YearLSMICOA
NPKCaMgNPKCaMgNPKCaMg
11654626410722231364311172816172175958
21654226818219298425341323615362151928
3169402021402824137461110341566292908
Mean1664324514323257384751203315765139928
Table 5. Color (a*, b*, L*) changes during the development of three celery crops grown in the field, as a function of the fertilization treatment: local sheep manure (LSM), mineral (I), and commercial organic amendment (COA).
a* b*L*
Year LSMICOALSMICOALSMICOA
1I−2.0−2.0−1.324.419.216.056.155.847.4
II−4.1−1.6−3.123.215.923.154.651.458.5
III−2.2−3.0−3.120.217.916.653.755.652.4
IV−2.8−2.2−2.522.617.718.654.854.352.7
Mean−2.8−2.2−2.522.617.718.654.854.352.7
SD1.20.71.02.11.73.91.22.55.6
MSD0.05nsnsnsnsnsnsnsnsns
MSD0.01nsnsnsnsnsnsnsnsns
2I−1.5−1.3−2.420.414.226.954.952.653.8
II−2.3−0.5−2.823.028.023.456.154.152
III−1.2−0.60.320.78.417.452.447.456.7
IV−1.6−1.6−1.321.122.518.654.958.752
Mean−1.6−1.0−1.621.318.321.654.653.253.6
SD0.40.51.41.18.74.41.64.72.2
MSD0.05nsnsnsnsnsnsnsnsns
MSD0.01nsnsnsnsnsnsnsnsns
3I−2.2−1.0−2.423.022.424.55.55255.1
II−5.0−1.5−2.524.417.620.353.252.754.6
III−1.4−2.6−1.916.521.921.057.653.054.5
IV−3.3−1.3−3.220.016.24.053.557.955
Mean−3.0−1.6−2.520.919.422.55553.954.8
SD1.600.70.53.53.32.12.12.70.3
MSD0.05nsnsnsnsnsnsnsnsns
MSD0.01nsnsnsnsnsnsnsnsns
ns: not significant; the MSD0.05 and MSD0.01 values indicate the significance of the differences at the 95 and 99% confidence level, respectively.
Table 6. Chromatic attributes (H*, C*, S*), a*/b* ratio, and color index (CI) during three cycles of celery crops grown in the field, as a function of the fertilization treatment: local sheep manure (LSM), inorganic treatment (I), and commercial organic amendment (COA).
Chromatic Attributes
H*C*S*a*/b* CI
Year LSMICOALSMICOALSMICOALSMICOALSMICOA
1I1.651.671.6524.4819.3016.0510.686.685.44−0.08−0.10−0.08−1.46−1.87−1.71
II1.751.671.7023.5615.9823.3110.174.979.29−0.18−0.10−0.13−3.24−1.96−2.29
III1.681.741.7620.3218.1516.897.695.925.44−0.11−0.17−0.19−2.03−3.01−3.56
IV1.691.691.7022.7717.8418.779.465.866.68−0.12−0.12−0.13−2.26−2.29−2.55
Mean1.691.691.7022.7817.8218.759.505.866.71−0.12−0.12−0.13−2.25−2.28−2.53
SD0.00.00.01.51.22.81.10.61.60.00.00.00.60.50.7
MSD0.05nsnsnsbbabbansnsnsnsnsns
MSD0.01nsnsnsnsnsnsababnsnsnsnsnsns
2I1.641.661.6620.4614.2627.017.623.8713.56−0.07−0.09−0.09−1.34−1.74−1.66
II1.671.591.6923.1128.0023.579.5214.5010.68−0.10−0.02−0.12−1.78−0.33−2.30
III1.631.641.5520.738.4217.408.201.505.34−0.06−0.070.02−1.11−1.510.30
IV1.651.641.6421.1622.5618.658.168.676.69−0.08−0.07−0.07−1.38−1.21−1.34
Mean1.651.631.6421.3718.3121.668.387.139.07−0.08−0.06−0.07−1.40−1.20−1.25
SD0.00.00.11.07.53.90.75.03.30.00.00.10.20.51.0
MSD0.05nsnsnsnsnsnsnsnsnsnsnsnsnsnsns
MSD0.01nsnsnsnsnsnsnsnsnsnsnsnsnsnsns
3I1.671.621.6723.1022.4224.229.629.6710.65−0.10−0.04−0.10−1.72−0.86−1.81
II1.771.661.6924.9117.6620.4511.665.927.66−0.20−0.09−0.12−3.85−1.62−2.26
III1.661.691.6616.5622.0521.094.769.188.16−0.08−0.12−0.09−1.47−2.24−1.66
IV1.731.651.7020.2716.0524.217.684.4510.66−0.17−0.08−0.13−3.08−1.40−2.42
Mean1.711.651.6821.2119.5522.498.437.309.28−0.14−0.08−0.11−2.53−1.53−2.04
SD0.00.00.03.22.81.72.52.21.40.00.00.01.00.50.3
MSD0.05nsnsnsnsnsnsnsnsnsnsnsnsnsnsns
MSD0.01nsnsnsnsnsnsnsnsnsnsnsnsnsnsns
ns: not significant; the MSD0.05 and MSD0.01 values indicate the significance of the differences at the 95 and 99% confidence level, respectively. Different letters indicate differences between treatments at the level of statistical significance indicated.
Table 7. The head diameter (Dh) and the dry matter percentage (DM) in the stalk and leaf during three cycles of celery crops grown in the field, as a function of the fertilization treatment: local sheep manure (LSM), mineral (I), and commercial organic amendment (COA).
DM (%)
Year Dh (cm)StalkLeaf
LSMICOALSMICOALSMICOA
1I3.34.25.05.25.14.815.115.615.8
II4.04.33.75.35.45.116.015.115.7
III3.93.24.15.25.24.915.515.315.7
IV3.64.04.35.25.24.915.415.215.7
Mean3.73.94.35.25.24.915.515.315.7
SD0.40.60.70.10.20.20.50.30.1
DSM0.05nsnsnsnsnsnsnsnsns
DSM0.01nsnsnsnsnsnsnsnsns
2I4.64.74.76.35.75.312.712.212.4
II4.34.94.55.85.75.112.510.811.6
III4.34.94.85.95.65.212.611.511.4
IV4.74.84.35.75.85.112.511.311.6
Mean4.44.94.55.85.75.112.511.211.5
SD0.20.10.30.30.10.10.10.40.1
DSM0.05babaabbnsnsns
DSM0.01nsnsnsnsnsnsnsnsns
3I4.34.03.85.65.25.415.114.014.1
II4.54.23.95.65.95.315.714.215.7
III4.74.13.95.85.95.115.015.814.8
IV4.24.04.45.75.85.215.415.114.9
Mean4.54.14.15.75.95.215.415.015.1
SD0.30.10.30.10.10.10.40.80.5
DSM0.05abbnsnsnsnsnsns
DSM0.01nsnsnsnsnsnsnsnsns
ns: not significant; the MSD0.05 and MSD0.01 values indicate the significance of the differences at the 95 and 99% confidence level, respectively. Different letters indicate differences between treatments at the level of statistical significance indicated.
Table 8. The total soluble solids (TSS) content during three cycles of celery crops grown in the field, as a function of the fertilization treatment: local sheep manure (LSM), mineral (I), and commercial organic amendment (COA).
TSS (° Brix)
Year LSMICOA
1I4.544.6
II4.44.54.2
III4.26.94.9
IV4.45.14.6
Mean4.45.14.6
SD0.20.50.4
MSD0.05nsnsns
MSD 0.01nsnsns
2I4.13.83.8
II4.33.33.5
III4.13.53.5
IV4.23.63.9
Mean4.23.63.7
SD0.10.20.2
MSD0.05abb
MSD 0.01abb
3I2.93.73.1
II3.53.13.4
III3.33.23.4
IV3.13.23.4
Mean3.23.33.3
SD0.30.30.2
MSD0.05nsnsns
MSD 0.01nsnsns
ns: not significant; the MSD0.05 and MSD0.01 values indicate the significance of the differences at the 95 and 99% confidence level, respectively. Different letters indicate differences between treatments at the level of statistical significance indicated.
Table 9. Macronutrient contents (g kg−1 dry matter) in the stalk and leaf of celery, in the inorganic (I) and organic (local sheep manure, LSM; commercial organic amendment, COA) fertilization treatments.
STALK
YearDays (*)N PKCaMg
LSMICOALSMICOALSMICOALSMICOALSMICOA
15712.8313.6712.846.706.686.4789.1064.1070.0016.2017.8416.492.702.803.40
9116.2817.1118.166.406.106.2062.6552.9060.5711.907.408.703.402.603.20
10910.3013.9014.905.715.666.4367.3157.6963.799.764.935.083.162.412.79
mean13.14 b14.89 a15.30 a6.276.156.3773.02 a58.23 b64.79 ab12.6210.0610.093.09 a2.60 b3.13 a
25413.4022.0016.406.286.285.9980.4287.2681.5321.8718.1621.183.593.203.20
8216.2021.4017.905.947.176.2869.4372.0565.5921.5018.6820.102.792.672.80
9613.3022.9021.805.727.196.2660.9556.5256.4614.3510.9113.263.202.802.60
mean14.30 b22.10 a18.70 ab5.986.886.1870.2771.9567.8619.2415.9218.183.19 a2.89 b2.86 b
35117.5826.5219.793.303.202.5079.6079.4069.708.977.397.906.856.047.40
8414.5615.5315.024.464.284.2267.1574.3967.817.866.487.007.607.916.90
10114.1813.7514.233.573.014.8168.1051.9058.805.646.486.456.016.266.10
mean15.44 b18.60 a16.35 ab3.783.503.8471.62 a68.56 b65.44 b7.496.787.126.826.746.80
LEAF
15740.3243.5435.078.126.676.8042.8033.5039.3027.0028.8125.306.207.706.40
9143.5242.3038.666.806.206.4036.0526.9631.3431.3527.4327.506.907.206.80
10934.0038.0038.106.616.147.3146.1028.5036.4030.6329.0627.006.547.597.18
mean39.28 b41.28 a37.28 b7.186.346.8441.65 a29.65 b35.68 ab29.6628.4326.606.55 b7.50 a6.79 b
25440.8050.3043.906.106.236.4441.3443.6045.0535.6034.7032.306.707.706.30
8240.8048.8046.707.297.8610.4744.9050.7040.0036.2025.0033.806.126.416.67
9638.5044.3139.179.3911.546.7837.5742.5744.4834.6135.3331.626.217.016.60
mean40.03 b47.80 a43.26 ab7.598.547.9041.2745.6243.1835.47 a31.68 b32.57 b6.347.046.52
35142.4145.8045.353.353.193.0449.5245.6043.6823.0016.0026.6013.6012.5015.20
8435.3135.4733.884.544.915.4742.6042.8033.5019.7716.6315.3611.0013.2011.20
10134.7038.0039.004.275.124.5637.0029.4029.1016.0715.3213.6910.4012.6012.80
mean37.48 b39.76 a39.41 a4.054.414.3643.04 a39.27 b35.43 b19.61 a15.99 b18.55 a11.67 b12.77 a13.07 a
(*) days after transplanting. Different letters indicate significant differences between treatments at the 95% confidence level.

