Article

Spatiotemporal Distribution of Cattle Dung Patches in a Subtropical Soybean-Beef System under Different Grazing Intensities in Winter

by
Francine D. da Silva
1,
Pedro A. de A. Nunes
2,*,
Christian Bredemeier
3,
Monica Cadenazzi
4,
Lúcio P. Amaral
5,
Fernando M. Pfeifer
6,
Ibanor Anghinoni
7 and
Paulo C. de F. Carvalho
2
1
Department of Rural Engineering, Federal University of Pelotas (UFPEL), Capão do Leão RS 96001-970, Brazil
2
Department of Forage Plants and Agrometeorology, Federal University of Rio Grande do Sul (UFRGS), Porto Alegre RS 91540-000, Brazil
3
Department of Crop Science, Federal University of Rio Grande do Sul (UFRGS), Porto Alegre RS 91540-000, Brazil
4
Department Biometrics, Statistics and Computing, Faculty of Agronomy, Universidad de la República (UDELAR), Route 3, km 363, Paysandú 60000, Uruguay
5
Department of Rural Engineering, Federal University of Santa Maria (UFSM), Santa Maria RS 97105-900, Brazil
6
Luteran University of Brazil (ULBRA), Canoas RS 92425-900, Brazil
7
Department of Soil Science, Federal University of Rio Grande do Sul (UFRGS), Porto Alegre RS 91540-000, Brazil
*
Author to whom correspondence should be addressed.
Agronomy 2020, 10(9), 1423; https://doi.org/10.3390/agronomy10091423
Submission received: 15 July 2020 / Revised: 3 September 2020 / Accepted: 4 September 2020 / Published: 19 September 2020
(This article belongs to the Section Farming Sustainability)

Abstract

:
Cattle dung distribution in pastoral ecosystems is uneven and affects nutrient availability to plants. Thus, identifying its spatiotemporal patterns is crucial to understanding the mechanisms underlying the system functioning. We aimed to characterize the spatiotemporal distribution of dung patches in mixed black oat (Avena strigosa Schreb.) and Italian ryegrass (Lolium multiflorum Lam.) pastures grazed at different intensities (sward heights of 0.1, 0.2, 0.3 and 0.4 m) in the winter stocking period of an integrated soybean-beef system in southern Brazil. All dung patches were located and georeferenced every 20 days. Dung distribution was analyzed using Thiessen polygons and semivariogram analysis. The spatial pattern of dung deposition was virtually similar over time but created distinct patterns in paddocks managed at different grazing intensities. Dung patch density was greater close to attraction points, resting and socialization areas regardless of grazing intensity. Lighter grazing intensities presented stronger spatial patterns with increased dung density in those areas, but those patterns weakened with increasing grazing intensity. Dung patches covered 0.4%, 0.9%, 1.1% and 1.5% of the area in paddocks managed at 0.4, 0.3, 0.2 and 0.1 m sward heights, respectively. Geostatistics proved useful for identifying spatial patterns in integrated crop-livestock systems and will potentially support further investigations.

1. Introduction

Increasing agricultural yields following global food demand is a major challenge faced by the sector in the 21st century. Projections foresee 9.8 billion people in 2050, a 30% growth from the current world population [1]. Associated with greater individual wealth, population growth will increase the demand for agricultural products by 70% [2]. Agricultural intensification propelled yields over the last decades [3] but the disconnection of crop and livestock production and the concentration of these activities in specialized farms impaired nutrient cycling, which is a fundamental feature of sustainable agricultural systems [4]. Resulting water contamination, soil degradation, biodiversity loss and rising atmospheric greenhouse gas emissions walked side by side with yield gains, but such costs are no longer accepted by society [5].
The urge for environmentally friendly production systems has led several authors to suggest the reintegration of crops and animals to reconcile food production and the delivery of ecosystem services underlying sustainability [5,6,7,8]. Integrated crop-livestock systems (ICLS) can promote sustainable intensification through diversifying revenue sources, which buffers market fluctuation risks [9] besides improving nutrient recycling and use efficiency [10]. As a result, reliance on external inputs is reduced and system self-sufficiency increases [11,12]. ICLS are already present in many regions of the world, from ancient smallholding systems in Asia [13] to large-scale commercial operations in Brazil [7]. In the latter case, the widespread model in the subtropical region of the country is the rotation of summer grain crops (mainly soybean, maize or rice) and winter annual pastures (mainly black oat (Avena strigosa Schreb.) and Italian ryegrass (Lolium multiflorum Lam.)).
In these systems, animals graze pasture nutrients and the undigested portion is returned to the soil via excreta (i.e., dung and urine) [14]. This recycling process facilitates nutrient mineralization due to the low carbon:nitrogen (C:N) ratio of animal wastes [15] and to the greater activity of soil protease, urease and acid phosphatase enzymes in the presence of excreta [16]. Soil fertility is thus improved, favoring plant nutrient acquisition and growth [17].
The distribution of livestock excreta in the field is, however, uneven and associated with the location of attractants (e.g., water sources and socialization areas), terrain slope, season [18,19] and grazing management practices (e.g., dung is more evenly distributed under a rotational method compared with a continuous stocking method) [20]. As a consequence, nutrient redistribution in grassland soils is also uneven, creating depletion zones where forages are grazed and accumulation zones where wastes are deposited [21]. For instance, phosphorus (P) and potassium (K) availability in the soil is 38% and 122% higher under cattle dung patches, respectively, resulting in 23% greater soybean yields in these sites compared with the ones with no dung patches in an annual rotation of soybean and winter pastures [22]. For this reason, the effects of grazing animals in no-till areas such as heterogeneous nutrient distribution and soil compaction, still raise concerns regarding ICLS adoption [7].
Understanding the spatiotemporal dynamics of cattle foraging behavior (and consequently dung distribution) in pasturelands is therefore an important factor to properly manage pasture-based livestock systems [19,23]. However, information on the spatiotemporal patterns of cattle excreta is limited [19] as most of the literature is focused on manure composition and management from intensive and usually confined systems [24]. Knowing the spatiotemporal patterns of dung deposition would be particularly important in pasture areas succeeded by commercial crops, which is the case of the annual soybean-beef cattle integration in southern Brazil. Recognizing distinct patterns in these systems when submitted to different grazing intensities would allow the prediction of cumulative effects over time and make better use of management strategies, such as livestock attractants or grazing intensity itself, to improve system efficiency. Moreover, it has been shown that ingestive behavior is affected by forage availability (i.e., satiated animals spend more time resting and ruminating while unsatiated animals need to walk more to fulfill their daily requirements) [25] and that greater dry matter intake results in greater individual fecal production and performance [26]. Thus, it is expected that dung deposition may present different distribution patterns over a gradient of grazing intensities. In this case, these patterns could work as indirect indicators of animal performance and welfare in the stocking period of ICLS or of the need for interventions.
In this study, we aimed to (1) identify whether cattle dung deposition follows distinct spatiotemporal patterns of distribution on mixed black oat and Italian ryegrass pastures under different grazing intensities during the stocking period of an annual integrated soybean-beef cattle system in southern Brazil and (2) describe the spatiotemporal patterns of dung distribution in paddocks managed at different grazing intensities using geostatistical methods. Our hypotheses were that (1) grazing intensity affects the spatiotemporal patterns of cattle dung deposition, (2) lighter grazing intensities amplify the spatial pattern of dung deposition with greater dung concentration in specific areas destined to resting and socialization and (3) individual animal excretion is greater at lighter grazing intensities while overall excretion is greater at heavier grazing intensities as a result of higher stocking rates.

2. Materials and Methods
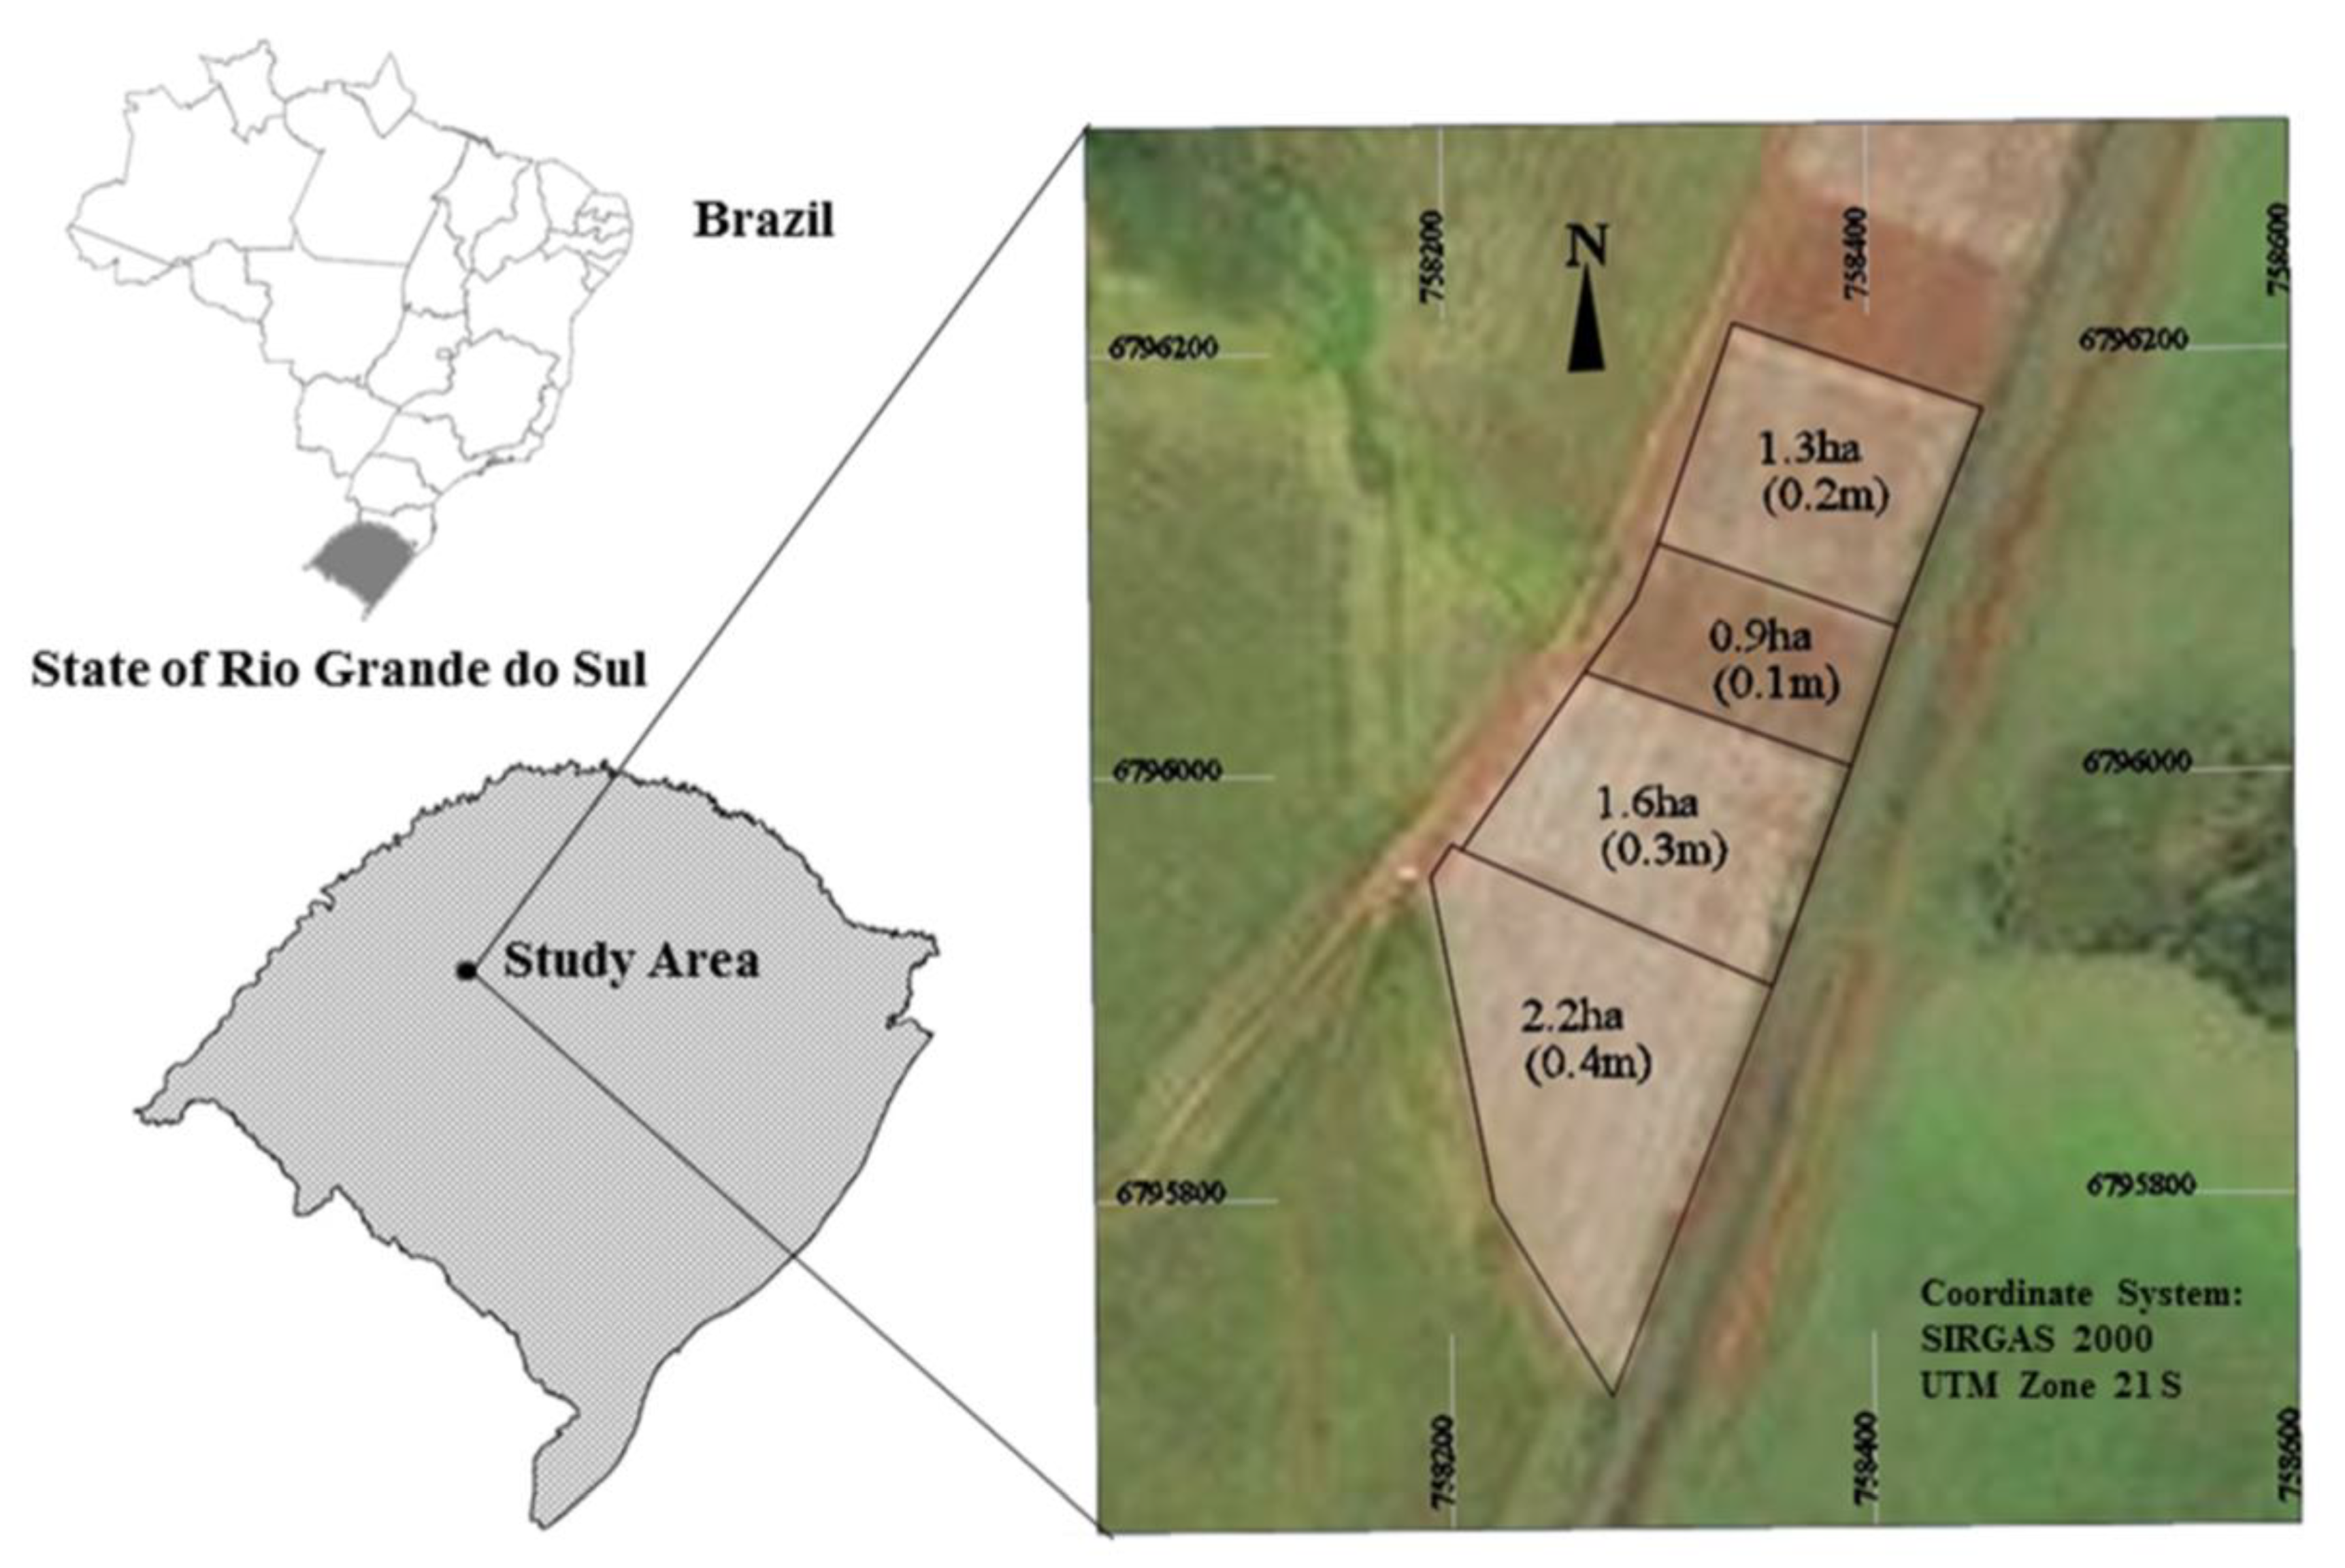
2.1. Study Area

The study was carried out at the Espinilho Farm (28°56′ S, 54°20′ W, 425 m above sea level), which is located in the municipality of São Miguel das Missões, Rio Grande do Sul State, southern Brazil, as part of a long-term no-till integrated crop-livestock system experiment. The region has a humid subtropical climate (Cfa) according to Köppen’s classification with an average annual air temperature of 19 °C and precipitation of 1850 mm [27]. During the study period, the accumulated rainfall was 838 mm and the average air temperature was 15 °C [28]. The soil is a clayey Oxisol, classified as Rhodic Hapludox [29], with a clayey texture (540, 270 and 190 g kg−1 of clay, silt and sand, respectively, in the 0–0.20 m layer) and a deep, well drained profile. The relief in the experimental site is slightly undulating.
The experimental area has been managed under no-till since 1993 when soybean [Glycine max (L.) Merr.] was cultivated in the summer and black oat (Avena strigosa Schreb.) was cultivated in the winter as a cover crop for the first time. In 2001, the integrated soybean-beef cattle system experiment was established with soybean cultivated in the summer and a mixture of Italian ryegrass (Lolium multiflorum Lam.) and black oat pastures in the winter. Data shown in this study were collected 10 years after the beginning of the experiment, namely in 2010. Black oat was sown in rows at 45 kg ha−1 seeding rate at the end of April 2010. Italian ryegrass was established by self-seeding in the previous winter. Nitrogen (45 kg ha−1) was applied as urea 45 days after sowing the black oat.
To assess the effect of grazing intensity on the spatiotemporal distribution of cattle dung, we followed a geostatistical approach in four paddocks managed at different grazing intensities under the continuous stocking method. Grazing intensities were defined by different sward management heights in the winter stocking period: 0.1 m (intense grazing), 0.2 m (moderate grazing), 0.3 m (moderate-light grazing) and 0.4 m (light grazing). To ensure that average sward heights remained as close as possible to the target sward heights, we performed 100 random measurements per paddock with a sward stick every 15 days [30]. Each paddock received three tester animals that remained throughout the stocking period and a variable number of put-and-take animals [31] that were periodically added or removed to adjust sward heights. Paddock dimensions ranged from 0.9 to 2.2 ha from the heaviest to the lightest grazing intensity (Figure 1). Paddocks differed in area to reduce the number of animals required to maintain the target sward heights especially in heavier grazing intensities.
The experimental animals were cross-bred Angus-Hereford-Nelore neutered steers with an initial body weight of 199 ± 23 kg and 10 months old. Grazing began on 6 July 2010 when pastures reached an average sward height of 0.27 ± 0.015 m and an average herbage mass of 1807 ± 97 kg ha−1. Steers remained in the experimental area up to 3 November 2010, totaling 119 grazing days. The average number of animals kept in each paddock during the interval between samplings dates is shown in Table 1. The average observed sward heights over the stocking period were 0.12, 0.18, 0.26 and 0.36 m for the target sward heights of 0.1, 0.2, 0.3 and 0.4 m, respectively. The average stocking rates required to maintain these sward heights over the experimental period were 1309, 918, 702 and 399 kg of live weight ha−1, respectively.

2.2. Samplings and Data Collection

The mapping of cattle dung patches consisted of periodically georeferencing every dung patch in the paddocks throughout the stocking period. We used a geodetic GPS with 5 mm horizontal accuracy for mapping dung sites (rapid static, Epoch 10 L1 GPS, Spectra Precision, Dayton, OH, USA) by positioning it in the center of each dung patch with another GPS working as the fixed base (static mode, Epoch 25 L1/L2 GPS, Spectra Precision, Dayton, OH, USA). The coordinate system used was the Universal Transverse Mercator (UTM) and geodesic reference system SIRGAS 2000 (Geocentric Reference System for the Americas). Dung evaluations were not replicated in space owing to the long time demanded by intense searching and georeferencing of thousands of dung patches, which could easily extend for more than 12 h in each paddock (georeferencing itself required 15 to 30 s per dung patch to stabilize the GPS signal). The lack of replication compromises the measure of variability among the experimental units with the same grazing management and thus limits our ability to extend inferences about treatment effects to other pastures (i.e., paddocks under different grazing intensities were considered as populations of interest instead of samples from a larger population). However, the use of geostatistical methods to describe patterns of variability within each of our experimental units provided a reliable characterization of dung deposition dynamics in pasture areas submitted to different grazing intensities, adding useful information to the understanding of integrated crop-livestock systems.
Evaluations were performed at intervals of approximately 20 days, totaling six sampling dates (Table 1). In each sampling date, two evaluators systematically scanned paddock areas by walking side-by-side from one edge to the opposite edge of the paddock then moving laterally in back and forth trajectories until the entire area was covered and all dung patches were georeferenced. To prevent the same dung patch from being georeferenced twice over the stocking period, each patch was marked with lime according to methodology proposed by Braz et al. [32]. On 25 September, 1 November and 16 December 2010, ten dung patches were randomly selected from each grazing intensity. Semi-major and semi-minor axes of each dung patch were measured, and the average area of the patch was calculated assuming an elliptical shape. The fresh weight of dung patches was determined in the last two sampling dates with a portable digital field scale.
Mapping allowed the determination of the total number of dung patches deposited between each sampling date. The total number of dung patches was divided by the number of animals in each paddock in that interval so that the number of dung patches excreted per animal per day was estimated for each sampling interval. At the end of the stocking period, the density of dung patches (D) was calculated by the following equation:
D = N × a A
where N is the total number of dung patches at the end of the stocking period, a is the average area of each dung patch and A is the total area of the paddock [33]. D was used to calculate the percentage of the area covered by patches (P), as following:
P = 100 × D

2.3. Statistical Analysis

The total number of dung patches, the average number of dung patches per animal per day, the average area of individual dung patches and dung patch fresh weight were submitted to analysis of variance (ANOVA) by F test at a 5% significance level. When significant differences were detected, means were compared using Tukey’s test through the PROC MIXED procedure of SAS [34]. The following statistical model was used for the analysis of variance:
Y ijkl = μ + T j + γ k + ε ijkl
where Yijkl is the response variable, µ is an average inherent in all observations, Tj is the effect of the jth paddock managed at a given grazing intensity, γk is the effect of the kth repetition time and εijkl is the random error, which is assumed to be independent and normally distributed.

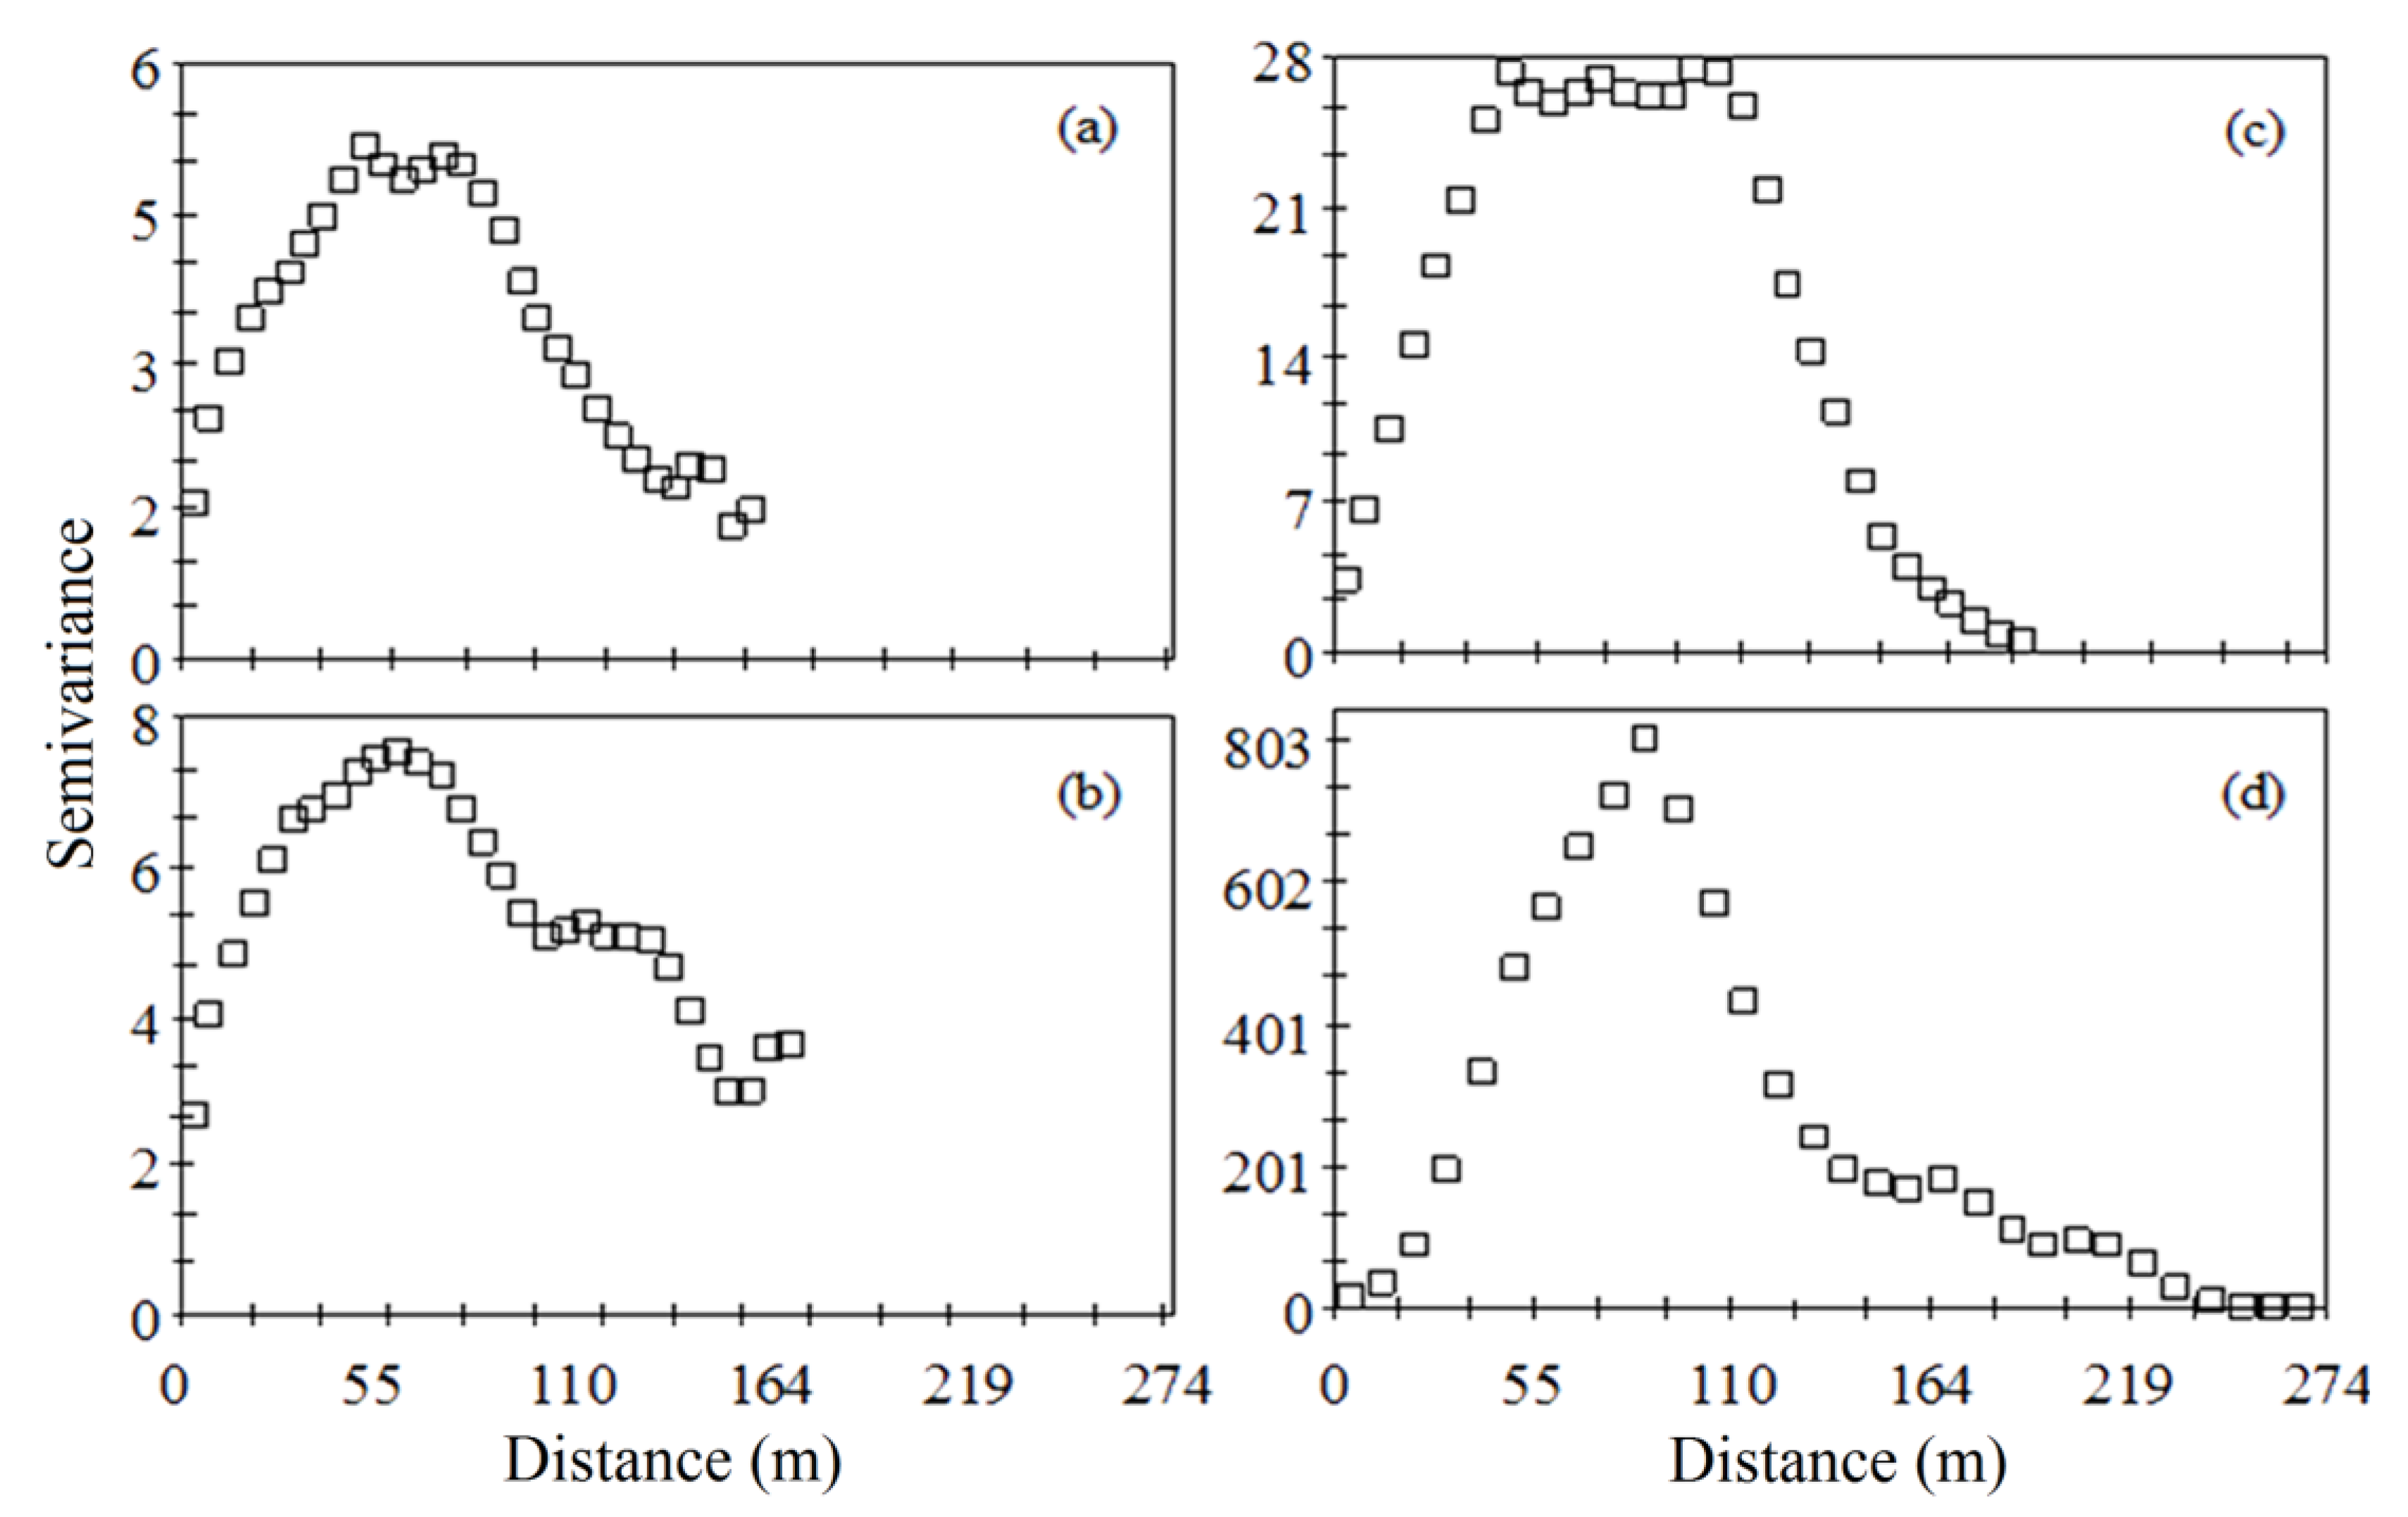
2.4. Geostatistical Analysis

There are statistical procedures to evaluate spatial distribution including random (Poisson), uniform or aggregated (binomial) distributions [14]. Binomial distribution is the one that best fits to the distribution of dung on pastures [33,35], but it only quantifies heterogeneity instead of indicating whether spatial patterns exist [36]. It is therefore necessary to use other available methods that are able to identify spatial patterns of distribution such as geostatistical methods based on semivariogram analysis [37,38].
The areas of Thiessen polygons were calculated for every dung patch using ArcView GIS 3.2 software. Each polygon defined an area inside which every location was closer to the central point (dung patch) than to the surrounding ones [37,39,40]. Polygon borders were therefore the bisection lines separating two dung patches [36]. As a possible result, a higher density of dung patches results in smaller polygons while isolated dung patches result in larger polygon areas. To describe dung deposition patterns over time and quantify spatial autocorrelations and dependence between dung patches, experimental semivariograms of polygons areas were generated using GS+ software version 7.0 (Gamma Design Software, Plainwell, MI, USA). Experimental semivariograms of Thiessen polygons areas were calculated by the following equation:
γ ( h ) = 1 2 N ( h ) i = 1 N ( h ) [ Z ( x i ) Z ( x i + h ) ] 2
in which N(h) indicates the number of pairs of measured values, Z (xi) and Z (xi + h), separated by a distance vector h. Z (xi) and Z (xi + h) are values of the ith observation of a regionalized variable collected at positions xi and xi + h (i = 1, ..., n), separated by vector h [37,38,41].
The following isotropic mathematical models were adjusted to experimental semivariograms [38,42]:
(a)
Spherical model, using:
γ ( h ) = C 0 + C 1   [ 3 2 ( h a ) 1 2 ( h a ) 3 ] ,   0 < h < a .
γ ( h ) = C 0 + C 1 ,   h a .
(b)
Exponential model, using:
γ ( h ) = C 0 + C 1 [ 1 exp ( 3 h a ) ] ,   0 < h < d .
(c)
Gaussian model, using:
γ ( h ) = C 0 + C 1 [ 1 exp   ( 3 h a ) 2 ]   0 < h < d
in which d is the maximum distance in which semivariograms were defined.
In aforementioned models, the existence of spatial dependence is verified when semivariances increase up to a given range (a) where the best-fit model reaches an asymptote (sill, C0 + C1) beyond which there is no spatial dependence between the points. C0 is the nugget effect (h = 0) representing the spatial variability that is below the minimum sampling distance or random error [43]. A large difference between the sill and nugget effect indicates a pronounced spatial pattern. When the sill equals the nugget effect, it is an indication that no spatial pattern exists. Models were adjusted according to lowest residual sum of squares (RSS) and highest degree of spatial dependence represented by the proportion of structural variance (C1) in relation to the sill (C0 + C1) [44,45]. Spatial dependence was categorized as strong (>0.75), moderate (0.75–0.25) or weak (<0.25) [46].

3. Results and Discussion

3.1. Dung Deposition at Different Grazing Intensities

Between 2467 and 3903 total dung patches were mapped up to the end of the stocking period (Table 2). The average number of patches per animal per day was 7.60 ± 2.28 with no statistical difference between paddocks grazed at different intensities (p = 0.1988, Table 2). It is clear, however, of the existence of an increasing trend in dung deposition toward the paddock managed with a sward height of 0.2 m, which probably resulted from a combination of stocking rate and greater individual dry matter (DM) intake in moderate grazing intensity. Previous studies in the same experimental protocol have shown that individual DM intake is greater at moderate to light grazing intensities (sward heights of 0.2 to 0.4 m) compared with a heavy grazing intensity (sward height of 0.1 m), which impaired individual animal performance in terms of daily gains (kg of live weight day−1) in the latter case [26]. Contrary to our results, however, those authors found a linear increase in total fecal production (kg ha−1) from the lightest to the heaviest grazing intensity with no statistical difference between sward heights of 0.1 and 0.2 m. Different outcomes could be explained by different sampling methodologies used in the studies.
The average area of individual dung patches was 0.038 ± 0.001 m2 (p = 0.7850). However, the paddock area covered with cattle dung patches at the end of the stocking period virtually quadrupled from the lightest to the heaviest grazing intensity (0.4, 0.9, 1.1 and 1.5% of the paddock area covered with dung for the sward heights of 0.4, 0.3, 0.2 and 0.1 m, respectively). This result was directly related to stocking rates but different proportions of area coverage compared with stocking rates (i.e., stocking rates tripled from the lightest to the heaviest grazing intensity while areas covered with dung quadrupled) suggested that there were other factors affecting this outcome such as distinct spatial patterns of dung deposition. The percentage of area covered by dung in our study was not far in magnitude from the values reported by Braz et al. [47] in Brachiaria decumbens pastures after 70 grazing days, i.e., 0.8% of the area covered by dung with a stocking rate of 747 kg ha−1. Dung patch fresh weight was also not affected by sward height (p = 0.3469) with an average of 1.122 ± 0.009 kg.
Fecal production is highly correlated to individual consumption [48], which in turn is correlated to animal performance [26]. Previous authors observed variations in dung patch area ranging from 0.05 to 0.09 m2 [14,47,49]. Furthermore, a variation in individual fecal production ranging from 1.86 up to 2.88 kg per steer per day in mixed black oat and Italian ryegrass pastures managed at different sward heights was also reported [26]. It was therefore expected that dung patch deposition would follow the same pattern in our study, which was not the case. Our field-level weighing methodology, however, did not take into account eventual differences in DM content and other quality aspects of dung that were shown to be different under different grazing intensities due to different sward structures and DM intake rates by the animals [26] and this could have buffered potential differences in our experiment.

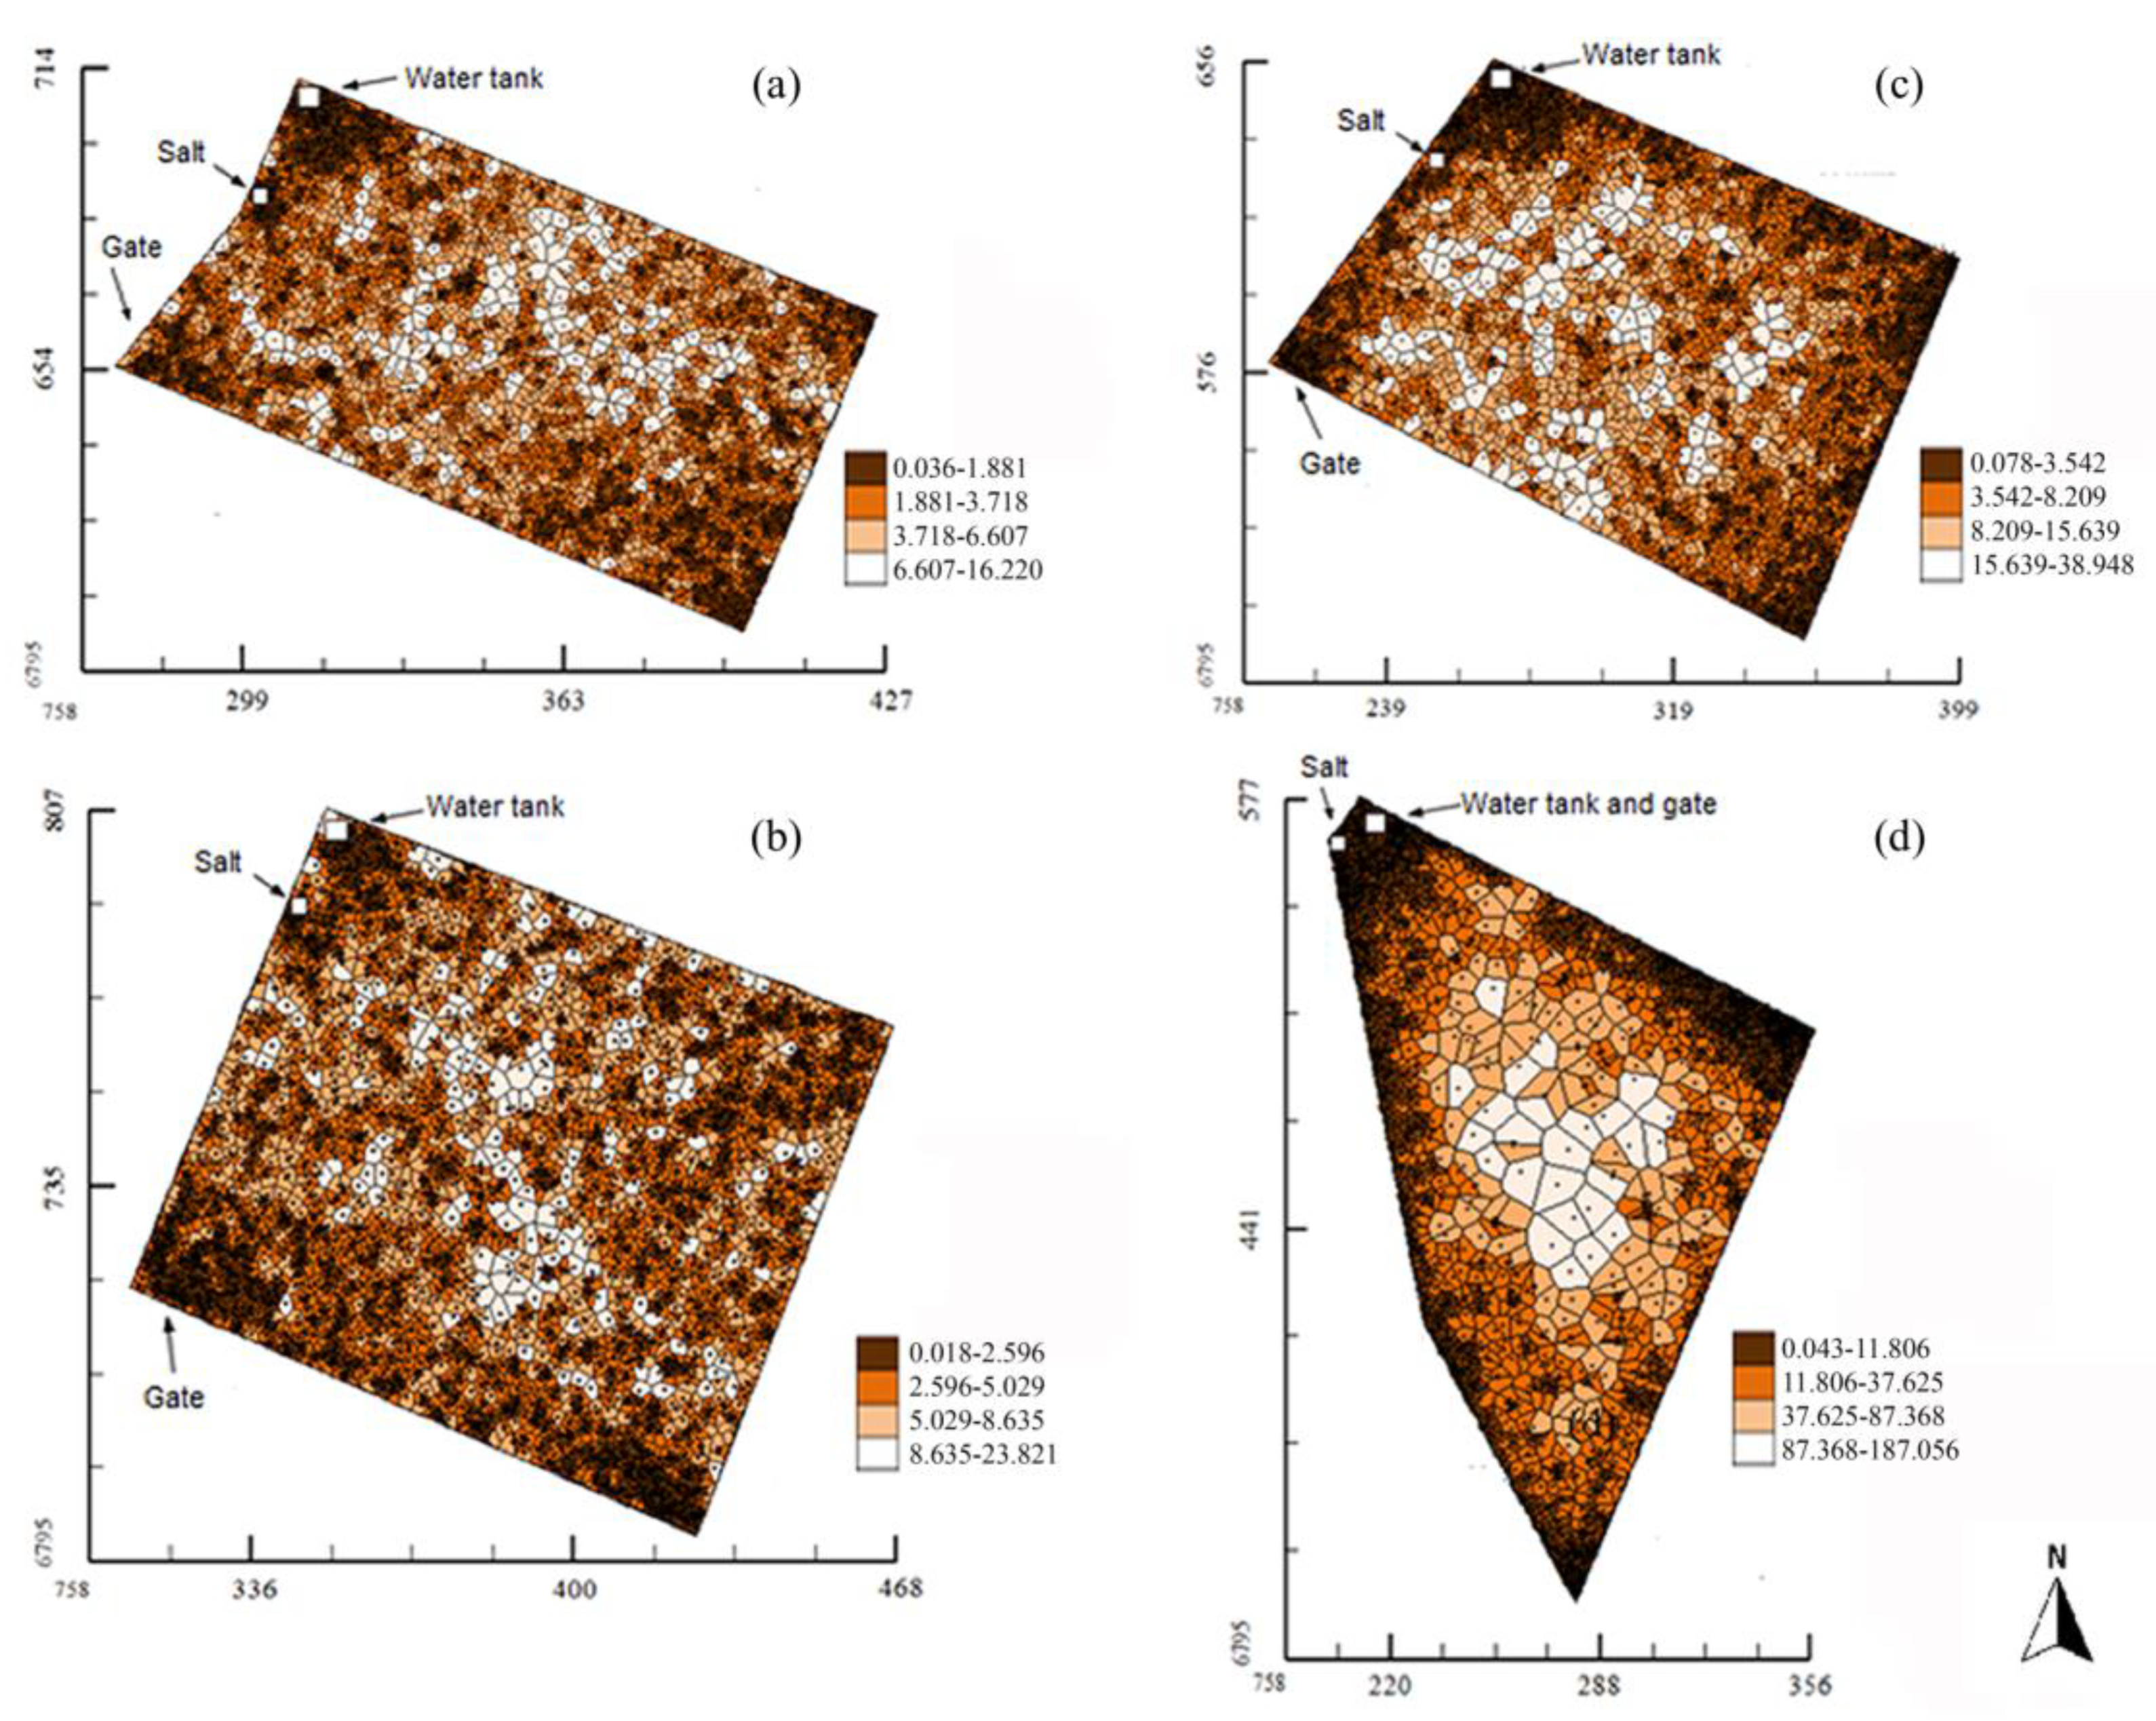
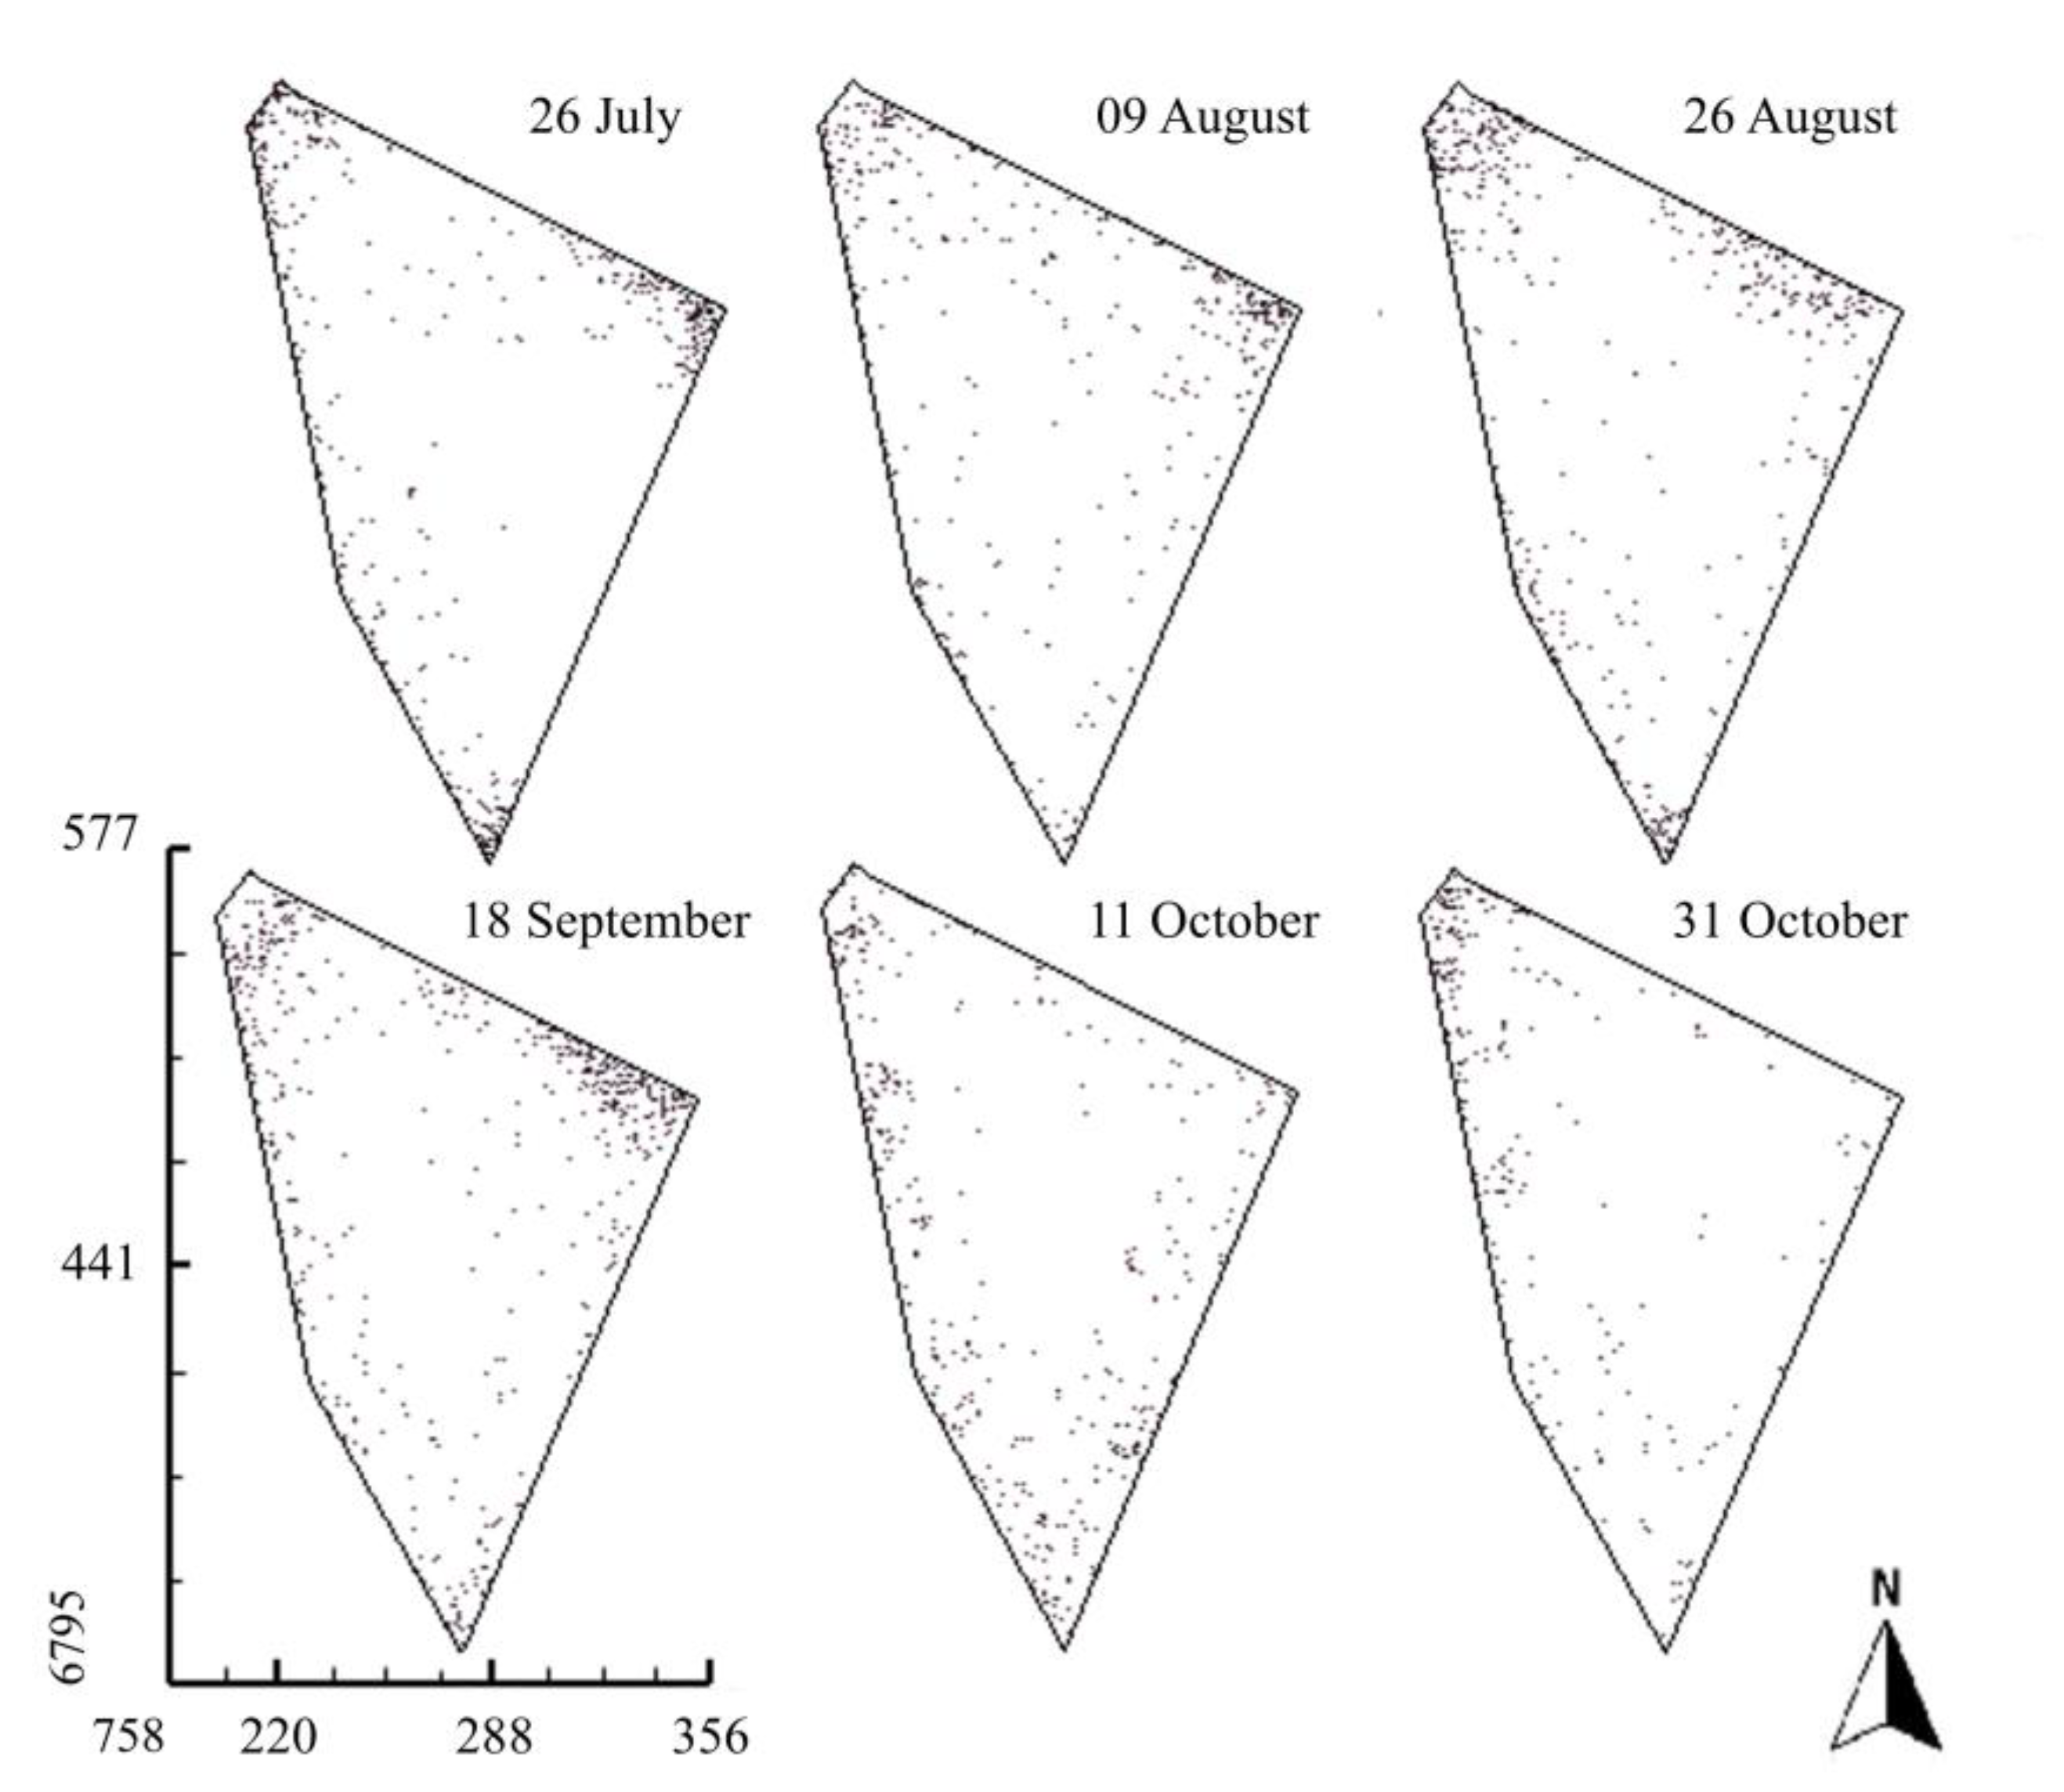
3.2. Spatiotemporal Patterns of Dung Distribution

Dung patches were concentrated close to attraction points such as fences, gates, water tanks and salt feeding sites as well as in resting and socialization areas regardless of grazing intensity, as shown by a higher dung density (i.e., a smaller polygon area) in the Thiessen polygon analysis (Figure 2). However, the area of Thiessen polygons varied from 0.04 to 16.22 m2, 0.02 to 23.82 m2, 0.08 to 38.95 m2 and 0.04 to 187.06 m2 for sward heights managed at 0.1, 0.2, 0.3 and 0.4 m, respectively, considering all dung patches deposited during the stocking period, showing that dung density increased at those attraction sites at lighter grazing intensities (Figure 2). The temporal characterization of dung distribution showed that dung deposition over time followed approximately the same pattern throughout the stocking period, regardless of slight changes in preferred attraction points over the sampling dates (Figure 3).
The geostatistical analysis of the Thiessen polygons allowed better understanding of the spatial patterns of dung distribution cumulatively created in paddocks managed under different grazing intensities in the stocking period (Figure 4). The experimental semivariograms showed a clear spatial pattern with increasing semivariances from short to medium distances up to a maximum range where the sill was reached, after which the semivariances started decreasing (Figure 4). This pattern was increasingly accentuated from 0.1 to 0.4 sward heights. The ‘hole effect’ may be attributed to the presence of fences around the experimental units, creating a pattern that was similar in every edge of the paddocks [36]. In our case, this effect was even more pronounced because all attraction points (i.e., watering and salt feeding sites) were located at the borders of the experimental units, near to fences where resting and socialization activities tended to occur [18,19,36]. Despite possible grazing intensity/paddock size interactions that were not able to be recognized due to the lack of replicates, the increasing ‘hole effect’ with decreasing grazing intensity was probably caused by the fact that satiated animals spend more time resting and ruminating while unsatiated animals need to walk more to fulfill their daily ingestion requirements [25].
Baggio et al. [25] observed that beef steers grazing mixed black oat and Italian ryegrass pastures increased the number of feeding stations and nearly doubled the total number of steps per day at 0.1 compared with 0.4 m sward heights. As a consequence, at lower stocking rates there is a decrease in the probability of the same area being revisited, which in turn reduces the chance of this area receiving excreta when compared with pastures with a shorter sward height. These factors might have led to the deposition of more dung patches in the center of more intensely grazed paddocks in our experiment (Figure 2).
Geostatistics also gave us a better tool for analyzing the temporal dynamics of dung deposition over the stocking period by observing the best-fit models to the semivariograms for each sampling date (Table 3). Thus, different theoretical models were adjusted to the empirical semivariograms for each grazing intensity and sampling date (Table 3). The results show that animals deposited dung patches in different positions in each period but always kept strong spatial patterns, as revealed by the strong degree of spatial dependence (DSD) in all sampling dates and regardless of the grazing intensity. This could reflect a strategy from herbivores’ natural behavior to avoid food contamination when forage allowance is sufficiently abundant [50] and shows that dung deposition by cattle is not randomly distributed along the pasture.
Among geostatistical parameters, the range is crucial for the interpretation of the semivariograms. It represents the maximum distance in which samples are spatially correlated [51]. In other words, the values of all points within a circle with this radius are correlated in such a way that they can be used to estimate values for any point between them [37,38,51,52]. The ranges varied between 10.7 and 90.1 m for sward heights of 0.2 to 0.4 m, respectively. Considering all sampling dates, ranges were 51.5, 39.6, 55.7 and 95.6 m for the sward heights of 0.1, 0.2, 0.3 and 0.4 m, respectively (Table 3). Higher range values indicated that spatial continuity in the distribution of dung patches extended to larger distances whereas lower values matched with less spatial structure in the area.
Different models were adjusted when all sampling points were computed together (Table 3) with weaker spatial dependence at heavier grazing intensities (classified as moderate DSD at sward heights of 0.1 and 0.2 m) compared with paddocks managed under lighter grazing intensities (classified as strong DSD at sward heights of 0.3 and 0.4 m) (Table 3). These results reinforced the marked spatial pattern (‘hole effect’) that became evident with Thiessen polygon maps (Figure 2) and the semivariograms (Figure 4). These patterns were also verified by Dubeux Jr. [53] and Dubeux Jr. et al. [54] when comparing the distribution of dung and urine at different grazing intensities.
According to Franzluebbers et al. [55], up to 33% of dung patches can be located in attraction areas, which on average represents 12% of the total pasture area. Conversely, Hirata et al. [56] pointed out that between 11.4% and 29.5% of excretions were concentrated in an area smaller than 4% of the grazing surface. Our results have shown that only a small fraction of the area in an annual integrated soybean-beef cattle system was covered by dung patches at the end of the winter stocking period, varying between 0.4% and 1.5% for sward heights of 0.4 to 0.1 m. Despite the relatively low area coverage, the presence of livestock dung has major beneficial effects to integrated crop-livestock systems.

3.3. Implications for Integrated Crop-Livestock Systems

The addition of livestock grazing cover crops in the period between the cultivation of two main cash crops, which is the case of our study, creates heterogeneity. This heterogeneity results from the accumulation of excretions (dung and urine) and the act of grazing itself (defoliation) or associated effects such as the act of trampling and can be noticed in the patterns of vegetation [57] and soil parameters [22]. Vegetation heterogeneity in annual winter pastures has been shown to be related to grazing intensity with more pronounced spatial patterns under light than heavy grazing intensity [57]. This was attributed to overgrazing, which created homogeneous, short swards with frequent bare soil sites as a result of intense cattle locomotion while foraging for food. On the other hand, pastures as tall as 0.4 m were heterogeneous and yielded more forage production (kg of herbage DM ha−1) over the stocking period due to the greater leaf area index, which improved daily accumulation rates [57]. In these conditions, cattle significantly improve their gains compared with intensely grazed areas (i.e., sward heights of 0.1 m) [58].
Our results presented the same pattern, with dung being more evenly distributed along paddock areas under intense grazing compared with paddocks managed at lighter grazing intensities. Lighter grazing intensities, in turn, resulted in greater concentration of cattle excretions near to fences and attraction points over the edges of the paddocks for reasons that have been previously discussed. As a result of dung deposition, soil available P and K were shown in previous studies to be higher at these sites compared with others with no dung patches, increasing soybean grain yield in these sites as a consequence [22]. However, the constant pursuit for landscape homogenization inherent from modern agricultural production models makes farmers conclude that field heterogeneity is negative and that such patterns created by grazing can impair subsequent crop yields, which is still a barrier to the adoption of integrated crop-livestock systems (ICLS) especially in areas followed by the cultivation of grain crops under no-till [7]. Literature, however, indicates that the presence of grazing animals improves soil biological activity and functional diversity [59] and promotes carbon sequestration and organic matter improvements similar to areas where cover crops are ungrazed (except for intensely grazed areas, where overgrazing causes nutrient losses [10,60] suggesting that this practice should be avoided). The result in the end is that overall productivity and profitability in ICLS areas is higher [7,8].
Finally, our results highlight the importance of geostatistical tools for understanding the spatiotemporal patterns in ICLS such as the distribution of soil, plant and animal characteristics and offer novel information on the effects of grazing that might support further investigation about the underlying mechanisms of ICLS dynamics. We have shown that cattle dung distribution patterns are affected by grazing intensity and attraction sites. However, further studies considering area replications and comparing paddocks of an exact same size and shape would improve our ability to discriminate the effect of grazing intensity from other factors that were not controlled in our study. Moreover, a deeper understanding of ICLS dynamics could be achieved by crossing information from crop harvest maps and specific deficiencies or surpluses of agricultural areas with information on the distribution of animal waste including urine distribution patterns where there is a lack of information. Other possible steps would be the development of integrated actions comprising stocking management and the use of site-specific management tools (i.e., using livestock attractants to change the dynamics of grazing and dung deposition) to study the effects of these practices on the overall performance and efficiency of the system towards building more sustainable ICLS designs in the future.

4. Conclusions

Geostatistics showed to be a useful tool for identifying the spatiotemporal patterns of cattle dung deposition in the stocking period of integrated crop-livestock systems (ICLS). The joint use of Thiessen polygon maps and semivariogram analysis allowed us to identify distinct patterns in mixed black oat and Italian ryegrass pastures, driven by stocking rates and factors other than the studied grazing intensities. Specifically, dung patches were concentrated at attraction points such as fences, gates, water tanks and salt feeding sites as well as at resting and socialization areas regardless of grazing intensity. Pastures grazed at lighter intensities presented stronger spatial patterns with increased dung density in attraction areas compared with heavier grazing intensities. Dung distribution tended to be more widespread over the paddock area as grazing intensity increased, probably due to more intense foraging resulting from shorter swards. The temporal pattern of dung distribution was virtually similar for each paddock over time, but slight changes of preferred deposition points in the course of the stocking period reinforced the distinct spatial patterns between paddocks under different grazing intensities at the end of the season. The area surface covered with cattle dung patches quadrupled from the paddock managed under light grazing intensity (sward height of 0.4 m; 0.4% of the area covered with feces) to the paddock managed under heavy grazing intensity (sward height of 0.1 m; 1.5% of the area covered with feces).
Our study offers novel information on the effects of grazing that might support further investigation about the underlying mechanisms of ICLS dynamics. However, further studies are needed on topics where information is still scarce such as urine distribution patterns. Combining information of spatiotemporal patterns created by cattle with complementary high-definition data (e.g., soil nutrient spatial patterns) and precision agriculture tools (e.g., crop harvesting maps), as well as the development of integrated actions comprising stocking management (e.g., different stocking methods) and the use of site-specific management tools (e.g., dynamic positioning of attractants) would also help unravel effective practices to improve the system’s overall performance and efficiency towards more sustainable ICLS designs in the future.

Author Contributions

Conceptualization, F.D.d.S., C.B., I.A. and P.C.d.F.C.; Methodology, F.D.d.S., C.B. and L.P.A.; Formal Analysis, F.D.d.S., C.B., M.C. and L.P.A.; Investigation, F.D.d.S., L.P.A., F.M.P.; Data Curation, F.D.d.S.; Writing—Original Draft Preparation, F.D.d.S. and P.A.d.A.N.; Writing—Review & Editing, P.A.d.A.N. and C.B.; Visualization, F.D.d.S. and C.B.; Supervision, I.A. and P.C.d.F.C.; Funding Acquisition, F.D.d.S., C.B., and P.C.d.F.C. All authors have read and agreed to the published version of the manuscript.

Funding

This research was funded by the Brazilian National Council for Scientific and Technological Development (CNPq) and the Coordination for Development of Higher Education Personnel (CAPES) through MSc and PhD scholarships.

Acknowledgments

The authors are grateful to the Garcia de Garcia family and farm staff at Agropecuária Cerro Coroado (Fazenda do Espinilho) for their cooperation during the study. We also thank the Brazilian National Council for Scientific and Technological Development (CNPq) and the Coordination for Development of Higher Education Personnel (CAPES) for the MSc and PhD scholarships.

Conflicts of Interest

The authors declare no conflict of interest.

References

  1. United Nations, Department of Economic and Social Affairs, Population Division. World Population Prospects 2019: Estimates and Projection Variants. 2019. Available online: https://population.un.org/wpp2019/ (accessed on 21 December 2019).
  2. Connor, D.J.; Mínguez, M.I. Evolution not revolution of farming systems will best feed and green the world. Glob. Food Secur. 2012, 1, 106–113. [Google Scholar] [CrossRef] [Green Version]
  3. Tilman, D.; Cassman, K.G.; Matson, P.A.; Naylor, R.; Polasky, S. Agricultural sustainability and intensive production practices. Nature 2002, 418, 671–677. [Google Scholar] [CrossRef] [PubMed]
  4. Spiegal, S.; Kleinman, P.J.; Endale, D.M.; Bryant, R.B.; Dell, C.; Goslee, S.; Meinen, R.J.; Flynn, K.C.; Baker, J.M.; Browning, D.M.; et al. Manuresheds: Advancing nutrient recycling in US agriculture. Agric. Syst. 2020, 182, 102813. [Google Scholar] [CrossRef]
  5. Lemaire, G.; Franzluebbers, A.J.; Carvalho, P.C.F.; Dedieu, B. Integrated crop–livestock systems: Strategies to achieve synergy between agricultural production and environmental quality. Agric. Ecosyst. Environ. 2014, 190, 4–8. [Google Scholar] [CrossRef]
  6. Herrero, M.; Thornton, P.K.; Notenbaert, A.M.; Wood, S.; Msangi, S.; Freeman, H.A.; Bossio, D.; Dixon, J.; Peters, M.; van de Steeg, J.; et al. Smart investments in sustainable food production: Revisiting mixed crop-livestock systems. Science 2010, 327, 822–825. [Google Scholar] [CrossRef] [Green Version]
  7. De Moraes, A.; Carvalho, P.C.F.; Anghinoni, I.; Lustosa, S.B.C.; Costa, S.E.V.G.A.; Kunrath, T.R. Integrated crop–livestock systems in the Brazilian subtropics. Eur. J. Agron. 2014, 57, 4–9. [Google Scholar] [CrossRef]
  8. Carvalho, P.C.F.; Peterson, C.A.; Nunes, P.A.A.; Martins, A.P.; de Souza Filho, W.; Bertolazi, V.T.; Kunrath, T.R.; de Moraes, A.; Anghinoni, I. Animal production and soil characteristics from integrated crop-livestock systems: Toward sustainable intensification. J. Anim. Sci. 2018, 96, 3513–3525. [Google Scholar] [CrossRef]
  9. Ryschawy, J.; Choisis, N.; Choisis, J.P.; Joannon, A.; Gibon, A. Mixed crop-livestock systems: An economic and environmental-friendly way of farming? Animal 2012, 6, 1722–1730. [Google Scholar] [CrossRef] [Green Version]
  10. Martins, A.P.; Anghinoni, I.; Costa, S.E.V.G.A.; Carlos, F.S.; Nichel, G.H.; Silva, R.A.P.; Carvalho, P.C.F. Amelioration of soil acidity and soybean yield after surface lime reapplication to a long-term no-till integrated crop-livestock system under varying grazing intensities. Soil Tillage Res. 2014, 144, 141–149. [Google Scholar] [CrossRef]
  11. Bonaudo, T.; Bendahan, A.B.; Sabatier, R.; Ryschawy, J.; Bellon, S.; Leger, F.; Magda, D.; Tichit, M. Agroecological principles for the redesign of integrated crop–livestock systems. Eur. J. Agron. 2014, 57, 43–51. [Google Scholar] [CrossRef]
  12. Schuster, M.Z.; Pelissari, A.; de Moraes, A.; Harrison, S.K.; Sulc, R.M.; Lustosa, S.B.; Anghinoni, I.; Carvalho, P.C.F. Grazing intensities affect weed seedling emergence and the seed bank in an integrated crop–livestock system. Agric. Ecosyst. Environ. 2016, 232, 232–239. [Google Scholar] [CrossRef]
  13. Devendra, C.; Thomas, D. Smallholder farming systems in Asia. Agric. Syst. 2002, 71, 17–25. [Google Scholar] [CrossRef]
  14. Haynes, R.J.; Williams, P.H. Nutrient cycling and soil fertility in the grazed pasture system. Adv. Agron. 1993, 49, 119–199. [Google Scholar]
  15. Whitehead, D.C. Nutrient Elements in Grassland; CABI Publishing: Wallingford, UK, 2000. [Google Scholar]
  16. Haynes, R.; Williams, P. Influence of stock camping behaviour on the soil microbiological and biochemical properties of grazed pastoral soils. Biol. Fertil. Soils 1999, 28, 253–258. [Google Scholar] [CrossRef]
  17. Schjoerring, J.K.; Cakmak, I.; White, P.J. Plant nutrition and soil fertility: Synergies for acquiring global green growth and sustainable development. Plant Soil 2019, 434, 1–6. [Google Scholar] [CrossRef] [Green Version]
  18. Bailey, D.W.; Welling, G.R.; Miller, E.T. Cattle use of foothills rangeland near dehydrated molasses supplement. J. Range Manag. 2001, 54, 338–347. [Google Scholar] [CrossRef]
  19. Tate, K.W.; Atwill, E.R.; Mcdougald, N.K.; George, M.R. Spatial and temporal patterns of cattle feces deposition on rangeland. J. Range Manag. 2003, 56, 432–438. [Google Scholar] [CrossRef]
  20. Peterson, P.R.; Gerrish, J.R. Grazing systems and spatial distribution of nutrients in pastures: Livestock management considerations. In Nutrient Cycling in Forage Systems; Roberts, C.A., Ed.; PPI/FAR: Columbia, MO, USA, 1996; pp. 203–212. [Google Scholar]
  21. Schnyder, H.; Locher, F.; Auwerswald, K. Nutrient redistribution by grazing cattle drives patterns of topsoil N and P stocks in a low-input pasture ecosystem. Nutr. Cycl. Agroecosyst. 2010, 88, 183–195. [Google Scholar] [CrossRef] [Green Version]
  22. Da Silva, F.D.; Amado, T.J.C.; Bredemeier, C.; Bremm, C.; Anghinoni, I.; Carvalho, P.C.F. Pasture grazing intensity and presence or absence of cattle dung input and its relationships to soybean nutrition and yield in integrated crop–livestock systems under no-till. Eur. J. Agron. 2014, 57, 84–91. [Google Scholar] [CrossRef]
  23. Coughenour, M.B. Spatial components of plant–herbivore interactions in pastoral, ranching, and native ungulate ecosystems. J. Range Manag. 1991, 44, 530–542. [Google Scholar] [CrossRef] [Green Version]
  24. Waldrip, H.M.; Pagliari, P.H.; He, Z. Animal Manure: Production, Characteristics, Environmental Concerns and Management; ASA Special Publication 67; ASA and SSSA: Madison, WI, USA, 2020; p. 430. [Google Scholar]
  25. Baggio, C.; Carvalho, P.C.F.; Silva, J.L.S.; Anghinoni, I.; Lopes, M.L.T.; Thurow, J.M. Displacement patterns and herbage capture by steers in Italian ryegrass and black oat pastures managed under different heights in integrated crop-livestock system. Rev. Bras. Zootec. 2009, 38, 215–222. [Google Scholar] [CrossRef] [Green Version]
  26. de Souza Filho, W.; Nunes, P.A.A.; Barro, R.S.; Kunrath, T.R.; de Almeida, G.M.; Genro, T.C.M.; Bayer, C.; Carvalho, P.C.F. Mitigation of enteric methane emissions through pasture management in integrated crop-livestock systems: Trade-offs between animal performance and environmental impacts. J. Clean. Prod. 2019, 213, 968–975. [Google Scholar] [CrossRef]
  27. Martins, A.P.; Cecagno, D.; Borin, J.B.M.; Arnuti, F.; Lochmann, S.H.; Anghinoni, I.; Bissani, C.A.; Bayer, C.; Carvalho, P.C.F. Long-, medium- and short-term dynamics of soil acidity in an integrated crop–livestock system under different grazing intensities. Nutr. Cycl. Agroecosyst. 2016, 104, 67–77. [Google Scholar] [CrossRef]
  28. INMET-National Institute of Meteorology. Monitoramento das Estações Automáticas. 2010. Available online: http://www.inmet.gov.br (accessed on 2 December 2019).
  29. Soil Survey Staff. Soil Taxonomy: A Basic System of Soil Classification for Making and Interpreting Soil Surveys; USDA Natural Resource Conservation Service Agriculture Handbook; USDA: Washington, DC, USA, 1999; p. 871. [Google Scholar]
  30. Barthram, G.T. Experimental techniques—The HFRO sward stick. Biennial Hill Farming Research Organisation (1984–85). In Hill Farming Research Organisation; Allcock, M.M., Ed.; Penicuik: Midlothian, UK, 1986; pp. 29–30. [Google Scholar]
  31. Mott, G.O.; Lucas, H.L. The design, conduct and interpretation of grazing trials on cultivated and improved pastures. In Proceedings of the VI International Grassland Congress, State College, PA, USA, 17–23 August 1952; pp. 1380–1385. [Google Scholar]
  32. Braz, S.P.; Nascimento, D., Jr.; Cantarutti, R.B.; Regazzi, A.J.; Martins, C.E.; Fonseca, D.M.; Barbosa, R.A. Quantitative aspects of nutrients recycling in the feces of bovines grazing a pasture of Brachiaria decumbens in the Zona da Mata region of Minas Gerais. Rev. Bras. Zootec. 2002, 31, 858–865. [Google Scholar] [CrossRef]
  33. Petersen, R.G.; Lucas, H.L.; Woodhouse, W.W., Jr. The distribution of excreta by freely grazing cattle and its effects on pasture fertility: I. Excretal distribution. Agron. J. 1956, 48, 440–443. [Google Scholar] [CrossRef]
  34. SAS Institute. The SAS System for Windows, Version 9.2; SAS Institute Inc.: Cary, NC, USA, 2008. [Google Scholar]
  35. Hirata, M.; Sugimoto, Y.; Ueno, M. Use of a mathematical model to evaluate the effects of dung from grazing animals on pasture production and utilization and animal production. Jpn. J. Grassl. Sci. 1991, 37, 303–323. [Google Scholar] [CrossRef]
  36. Auerswald, K.; Mayer, F.; Schnyder, H. Coupling of spatial and temporal pattern of cattle excreta patches on a low intensity pasture. Nutr. Cycl. Agroecosyst. 2010, 88, 275–288. [Google Scholar] [CrossRef] [Green Version]
  37. Longley, P.A.; Maguire, D.J.; Goodchild, M.F.; Rhind, D.W. Sistemas e Ciência da Informação Geográfica, 3rd ed.; Bookman: Porto Alegre, Brasil, 2013. [Google Scholar]
  38. Yamamoto, J.K.; Landim, P.M.B. Geoestatística: Conceitos e Aplicações; Oficina de Textos: São Paulo, Brasil, 2013. [Google Scholar]
  39. Thiessen, A.H.; Alter, J.C. Climatological Data for July 1911: District No. 10, Great Basin. Mon. Weather Rev. 1911, 31, 1082–1089. [Google Scholar]
  40. Goovaerts, P. Geostatistical approaches for incorporating elevation into the spatial interpolation of rainfall. J. Hydrol. 2000, 228, 113–129. [Google Scholar] [CrossRef]
  41. Journel, A.G.; Huibregts, C.H.J. Mining Geostatistics; Academic Press: London, UK, 1978. [Google Scholar]
  42. Isaaks, E.H.; Srivastava, R.M. An Introduction to Applied Geostatistics; Oxford University Press: New York, NY, USA, 1989. [Google Scholar]
  43. Cressie, N.A.C. Statistics for Spatial Data; John Wiley and Sons Inc.: New York, NY, USA, 1993. [Google Scholar]
  44. Sadler, E.J.; Busscher, W.J.; Bauer, P.J.; Karlen, D.L. Spatial scale requirements for precision farming: A case study in the southeastern USA. Agron. J. 1998, 90, 191–197. [Google Scholar] [CrossRef] [Green Version]
  45. Robertson, G.P. GS+: Geostatistics for the Environmental Sciences—GS+ User’s Guide; Gamma Design Soffware: Plainwell, MI, USA, 2008. [Google Scholar]
  46. Landim, P.M.P. Análise Estatística de Dados Geológicos; Fundação Editora da UNESP: São Paulo, Brasil, 1998. [Google Scholar]
  47. Braz, S.P.; Nascimento, J.R.D.; Cantarutti, R.B.; Martins, C.E.; Fonseca, D.M.; Barbosa, R.A. Characterization of bovine feces spatial distribution in a Brachiaria decumbens pasture. Rev. Bras. Zootec. 2003, 32, 787–794. [Google Scholar] [CrossRef] [Green Version]
  48. Penning, P.D. Animal-based techniques for estimating herbage intake. In Herbage Intake Handbook; Penning, P.D., Ed.; The British Grassland Society: Reading, UK, 2004; pp. 53–94. [Google Scholar]
  49. During, C.; Weeda, W.C. Some effects of cattle dung on soil properties, pasture production, and nutrient uptake. N. Z. J. Agric. Res. 1973, 16, 423–430. [Google Scholar] [CrossRef]
  50. Medica, D.L.; Hanaway, M.J.; Ralston, S.L.; Sukhdeo, M.V.K. Grazing behavior of horses on pasture: Predisposition to strongylid infection? J. Equine Vet. Sci. 1996, 16, 421–427. [Google Scholar] [CrossRef]
  51. Vieira, S.R.; Hatfield, J.L.; Nielsen, D.R.; Biggar, J.W. Geostatistical theory and applications to variability of some agronomical properties. Hilgardia 1983, 51, 1–75. [Google Scholar] [CrossRef] [Green Version]
  52. Machado, L.O.; Lana, A.M.Q.; Lana, R.M.Q.; Guimarães, E.C.; Ferreira, C.V. Spatial variability of soil chemical attributes in areas managed under conventional tillage. Rev. Bras. Ciências Solo 2007, 31, 591–599. [Google Scholar] [CrossRef] [Green Version]
  53. Dubeux, J.C.B., Jr.; Sollenberger, L.E.; Gaston, L.A.; Vendramini, J.M.B.; Interrante, S.M.; Stewart, R.L., Jr. Animal behavior and soil nutrient redistribution in continuously stocked pensacola bahiagrass pastures managed at different intensities. Crop Sci. 2009, 49, 1503–1510. [Google Scholar] [CrossRef]
  54. Dubeux, J.C.B., Jr.; Sollenberger, L.E.; Vendramini, J.M.B.; Interrante, S.M.; Lira, M.A., Jr. Stocking method, animal behavior, and soil nutrient redistribution: How are they linked? Crop Sci. 2014, 54, 2341–2350. [Google Scholar] [CrossRef]
  55. Franzluebbers, A.J.; Stuedemann, J.A.; Schomber, H.H. Spatial distribution of soil carbon and nitrogen pools under grazed tall fescue. Soil Sci. Soc. Am. J. 2000, 64, 635–639. [Google Scholar] [CrossRef] [Green Version]
  56. Hirata, M.; Sugimoto, Y.; Ueno, M. Distributions of dung paths and ungrazed areas in Bahiagrass (Paspalum notatum Flügge) pasture. Jpn. J. Grassl. Sci. 1987, 33, 128–139. [Google Scholar]
  57. Nunes, P.A.A.; Bredemeier, C.; Bremm, C.; Caetano, L.A.M.; de Almeida, G.M.; de Souza Filho, W.; Anghinoni, I.; Carvalho, P.C.F. Grazing intensity determines pasture spatial heterogeneity and productivity in an integrated crop-livestock system. Grassl. Sci. 2019, 65, 49–59. [Google Scholar] [CrossRef]
  58. Kunrath, T.R.; Nunes, P.A.A.; de Souza Filho, W.; Cadenazzi, M.; Bremm, C.; Martins, A.P.; Carvalho, P.C.F. Sward height determines pasture production and animal performance in a long-term soybean-beef cattle integrated system. Agric. Syst. 2020, 177, 102716. [Google Scholar] [CrossRef]
  59. Chávez, L.F.; Escobar, L.F.; Anghinoni, I.; Carvalho, P.C.F.; Meurer, E.J. Diversidade metabólica e atividade microbiana no solo em sistema de integração lavoura-pecuária sob intensidades de pastejo. Pesqui. Agropecuária Bras. 2011, 46, 1254–1261. [Google Scholar]
  60. Assmann, J.M.; Anghinoni, I.; Martins, A.P.; Costa, S.E.V.G.A.; Cecagno, D.; Carlos, F.S.; Carvalho, P.C.F. Soil carbon and nitrogen stocks and fractions in a long-term integrated crop-livestock system under no-tillage in southern Brazil. Agric. Ecosyst. Environ. 2014, 190, 52–59. [Google Scholar] [CrossRef]
Figure 1. The location of the experimental area (left) and an aerial view of the paddocks (right) used for the description of the spatiotemporal patterns of dung deposition in the winter stocking period of an integrated soybean-beef cattle system in southern Brazil. Paddock dimensions and the target sward heights (0.1, 0.2, 0.3 and 0.4 m) assigned to them are shown in the aerial view. The pastures consisted of a mixture of black oat (Avena strigosa Schreb.) and Italian ryegrass (Lolium multiflorum Lam.) grazed by steers under continuous stocking method.
Agronomy 10 01423 g001
Figure 2. Cumulative spatial distribution of dung patches at different grazing intensities. Sward heights of (a) 0.1 m, (b) 0.2 m, (c) 0.3 m and (d) 0.4 m on mixed black oat (Avena strigosa Schreb.) and Italian ryegrass (Lolium multiflorum Lam.) pastures at the end of the stocking period of an integrated soybean-beef cattle system in southern Brazil. The smaller/darker the polygons, the higher the dung density. Arrows indicate watering and salt feeding sites as well as paddock gates.
Agronomy 10 01423 g002
Figure 3. Spatiotemporal distribution of cattle dung patches in the paddock managed under light grazing intensity (sward height of 0.4 m) as a representation of dung distribution over different sampling dates in 2010.
Agronomy 10 01423 g003
Figure 4. Overall semivariograms of the areas of Thiessen polygons around dung patches in paddocks grazed at different intensities by steers. Grazing intensities were given by the sward heights of (a) 0.1 m, (b) 0.2 m, (c) 0.3 m and (d) 0.4 m on mixed black oat (Avena strigosa Schreb.) and Italian ryegrass (Lolium multiflorum Lam.) pastures at the end of the stocking period of an integrated soybean-beef cattle system in southern Brazil.
Agronomy 10 01423 g004
Table 1. The average number of animals (beef steers) per paddock at each dung sampling date in 2010 for the different grazing intensities (sward heights of 0.1, 0.2, 0.3 and 0.4 m) on mixed black oat (Avena strigosa Schreb.) and Italian ryegrass (Lolium multiflorum Lam.) pastures in the stocking period of an integrated soybean-beef cattle system in southern Brazil.
Sward Height (m)SamplingSampling DateNumber of Animals
0.1128 July 7
214 August 6.4
327 August 4.1
419 September 3
509 October 3
628 October 3
0.2102 August 6
214 August 4
328 August 3.3
420 September 3
510 October 3
629 October 3
0.3129 July 5
210 August 3.8
331 August 3
425 September 3
512 October 3
601 November 3
0.4126 July 4
209 August 3.6
326 August 3
418 September 3
511 October 3
631 October 3
Table 2. Number of dung patches per animal per day at different grazing intensities (sward heights of 0.10, 0.20, 0.30 and 0.40 m) on mixed black oat (Avena strigosa Schreb.) and Italian ryegrass (Lolium multiflorum Lam.) pastures in the stocking period of an integrated soybean-beef cattle system in southern Brazil.
Sward Height (m)VariableSampling DateTotalMean
123456
0.1Dung patches per animal per day5611868 7
Total7468106015793604393535590
0.2Dung patches per animal per day99128510 9
Total14834195715463185663903651
0.3Dung patches per animal per day12410866 8
Total13265246265833013743734622
0.4Dung patches per animal per day689764 7
Total4623804695273772522467411
Table 3. Adjusted theoretical models of the areas of Thiessen polygons around dung patches in each sampling date in 2010 in paddocks managed at different grazing intensities (sward heights of 0.1, 0.2, 0.3 and 0.4 m) on mixed black oat (Avena strigosa Schreb.) and Italian ryegrass (Lolium multiflorum Lam.) pastures in the stocking period of an integrated soybean-beef cattle system in southern Brazil.
Sward Height (m)Sampling DateModelCo Co + C1 DSD §Range (m)
0.1028 July Exponential0.1167.60.99919.1
14 August Spherical14.4135.70.89443.6
27 August Spherical0.1178.10.99925.1
19 September Exponential21.7180.80.88017.3
09 October Exponential1.0794.30.99925.9
28 October Exponential78.0674.30.88440.8
OverallExponential1.25.30.68851.5
0.2002 August Spherical41.4151.90.72544.0
14 August Spherical1.01197.00.99955.2
28 August Spherical81.0424.00.80955.5
20 September Exponential16.1311.80.94810.7
10 October Exponential226.01495.00.85135.4
29 October Spherical16.0457.20.96529.5
OverallSpherical2.27.10.68739.6
0.3029 July Gaussian6.0278.60.97623.1
10 August Exponential21.01233.00.98230.0
31 August Gaussian62.01649.00.96229.4
25 September Exponential74.01311.00.94350.3
12 October Gaussian140.05075.00.97620.5
01 November Spherical10.04762.00.99879.4
OverallSpherical0.0126.40.99955.7
0.4026 July Gaussian100.066,300.00.99846.5
09 August Gaussian10.014,420.00.99947.0
26 August Gaussian10.019,550.00.99937.6
18 September Gaussian10.012,980.00.99939.2
11 October Spherical10.015,930.00.99990.1
31 October Gaussian100.048,680.00.99858.6
OverallGaussian1.0556.90.99995.6
Co: nugget effect. Co + C1: sill. § DSD: degree of spatial dependence (C1/Co + C1).

