Article

Comparative Study of Three Low-Tech Soilless Systems for the Cultivation of Geranium (Pelargonium zonale): A Commercial Quality Assessment

1
Edmund Mach Foundation, Technology Transfer Centre, via E. Mach 1, 38098 San Michele (TN), Italy
2
Research Centre in Urban Environment for Agriculture and Biodiversity (ResCUE-AB), Department of Agricultural and Food Sciences (DISTAL), Alma Mater Studiorum University of Bologna, Viale Fanin, 44, 40127 Bologna, Italy
3
Zamboni Stefano Farm, via Trento 13, 38049 Vigolo Vattaro, Italy
*
Author to whom correspondence should be addressed.
Agronomy 2020, 10(9), 1430; https://doi.org/10.3390/agronomy10091430
Submission received: 25 August 2020 / Revised: 16 September 2020 / Accepted: 18 September 2020 / Published: 20 September 2020
(This article belongs to the Special Issue Soilless Culture, Growing Media and Horticultural Plants)

Abstract

:
The study evaluated the feasibility of simplified hydroponics for the growth of rooted cuttings of geranium (Pelargonium zonale) for commercial purposes in local farms in Northern Italy. Tested systems included a control where soilless system on substrate (peat) (T-1), usually adopted by local farmers, was compared against an open-cycle drip system on substrate (peat) (T-2), and a Nutrient Film Technique system (T-3). For commercial features, assessed parameters included flowering degree (flowering timing, numbers of inflorescences plant−1, and number of flowers inflorescence−1), numbers of leaves plant−1, number of branches plant−1, final height of plant, and the aesthetic-commercial assessment index. Assessed parameters also included fresh and dry weight, SPAD Index, the water consumption, and the water use efficiency (WUE). The soilless systems typology significantly affected rooted cuttings growth, commercial features, and WUE. The adoption of an open-cycle drip system (T-2) resulted in a significant improvement of all the crop commercial characteristics as compared with other treatments, making plants more attractive for the market. The water consumption was higher in T-2 as compared with T-1 and T-3, but it allowed for the highest fresh weight, and therefore also the highest WUE. The results indicate that the typology of soilless system significantly enhances the commercial characteristics of geranium.

1. Introduction

The global gardening pots market size was valued at USD 1.7 billion in 2018. A growing interest in gardening is expected to remain a favorable factor for industry growth [1]. In Italy, the cultivation of cut flowers and potted ornamentals in both greenhouses and open field accounts for a relevant share of the market. In 2017, out of the 2.5 billion euros associated with the national floricultural and ornamental crop sector, about 1.15 billion euros are associated with flower production and potted plants. The Italian cut flowers and potted ornamental sector accounts for 27,000 companies, 100,000 workers, and almost 29,000 ha of farmland. When considering only figures for the ornamental seedling production, 2000 farms for a total area of 1500 ha are also found in Italy [2].
Ornamental plants are typically characterized by a fast growth rate and a large consumption of both nutrients and water, which should be of elevated quality given the limited salt tolerance of these plant species [3]. Furthermore, farmers generally tend to overwater these crops, with the consequence that ornamental plants generally present low water use efficiency (WUE) values. Accordingly, despite the existing variability among ornamental species in terms of water and fertilizer requirements [4], the sector generally accounts for high environmental impact due to the losses of both water and fertilizers [3]. In this scenario, the increasing awareness of environmental pollution caused by agriculture, the scarcity of resources such as water, the need to reduce the production costs, and the growing demand for healthy foods are forcing operators to move towards more sustainable cropping techniques. In greenhouse cultivation, the adoption of soilless culture, coupled with techniques such as fertigation, drip irrigation, integrated plant protection, and climate control, can provide a high-quality product with efficient use of resources, e.g., water, while also increasing the potential yield [5,6,7] as well as decreasing nutrient losses [8]. Soilless culture can be defined as “any method of growing plants without the use of soil as a rooting medium, in which the inorganic nutrients absorbed by the roots are supplied via the irrigation water” [9]. The soilless systems are classified according to the presence and type of substrate, to the irrigation system, and to the nutrient solution (NS) management, namely the reuse or not of the leaching fraction [9], which results, respectively, in the so-called “closed” or “open” loop systems. In open-loop systems, an excessive amount of NS (120–150% of actual water requirements) is supplied to avoid salt accumulation in the substrate, and the leaching fraction is not reused and commonly released into the environment. In closed soilless systems, on the other hand, water supply is generally higher (150–170% of daily water requirements), but the leaching fraction is reused after being disinfected [10]. Accordingly, water and fertilizer saving (which has both environmental and economic benefits), are the main advantages of closed systems. However, closed systems require more complicated NS management that ultimately results in higher equipment and management costs. Primarily, the higher risks of pest outbreak (mainly root diseases) require the disinfection of the leached fraction. Moreover, controlling nutrients and non-essential ions in the recirculating NS becomes more difficult, especially in the case of saline waters or high concentration of non-essential or scarcely absorbed ions (e.g., Na+ and Cl) [10]. Overall, it is acknowledged that closed systems show a better WUE, at the expenses of possible yield decay in response to salt build-up in the root zone as compared to open systems [5,11,12,13,14,15,16]. Classification of soilless systems may also be done according to those that feature the presence of a solid inorganic or organic medium, which offers support to the plants and systems without substrate (water based soilless systems), where the bare roots of plants lie directly in the NS [9]. Different features characterize the two groups of systems. Soilless systems on substrate are surely the most popular systems for cut flowers and pot ornamentals [17]. Water-based soilless systems are, on the other hand, associated with reduced environmental impact and costs related to the substrate disposal. However, in water-based soilless systems, the resilience to stresses (e.g., drought) is affected by the absence of a buffer offered by the substrate, and a considerably higher risk of outbreak of root-borne diseases may also be experienced [18].
In soilless systems, fertilization is performed administering a NS containing macro- and micro-nutrients, generally through different types of irrigation systems (drip irrigation, sub-irrigation, or overhead system). Such fertigation can be continuous or discontinuous.
Based on these assumptions, the current research comparatively assessed three low-tech soilless systems for the cultivation of geranium (Pelargonium zonale), targeting the identification of the system that would allow for optimal commercial production and improvement of WUE.

2. Materials and Methods

2.1. Location

The experiment was conducted in a greenhouse covered with polyethylene within a commercial farm located in Vigolo Vattaro, Province of Trento, Northern Italy, 46°00′ N, 11°19′ E, at an altitude of 725 m a.s.l. Plants were grown under natural light conditions. The local climate, according to Köppen’s classification, is Cfb type [19], which is a mesothermic climate, with the absence of a dry season and cool summer with temperature during the hottest month falling below 22 °C. The experiment was conducted from 25 March 2017 to 2 June 2017.

2.2. Treatments and Experimental Design

Three low-tech soilless systems were compared:
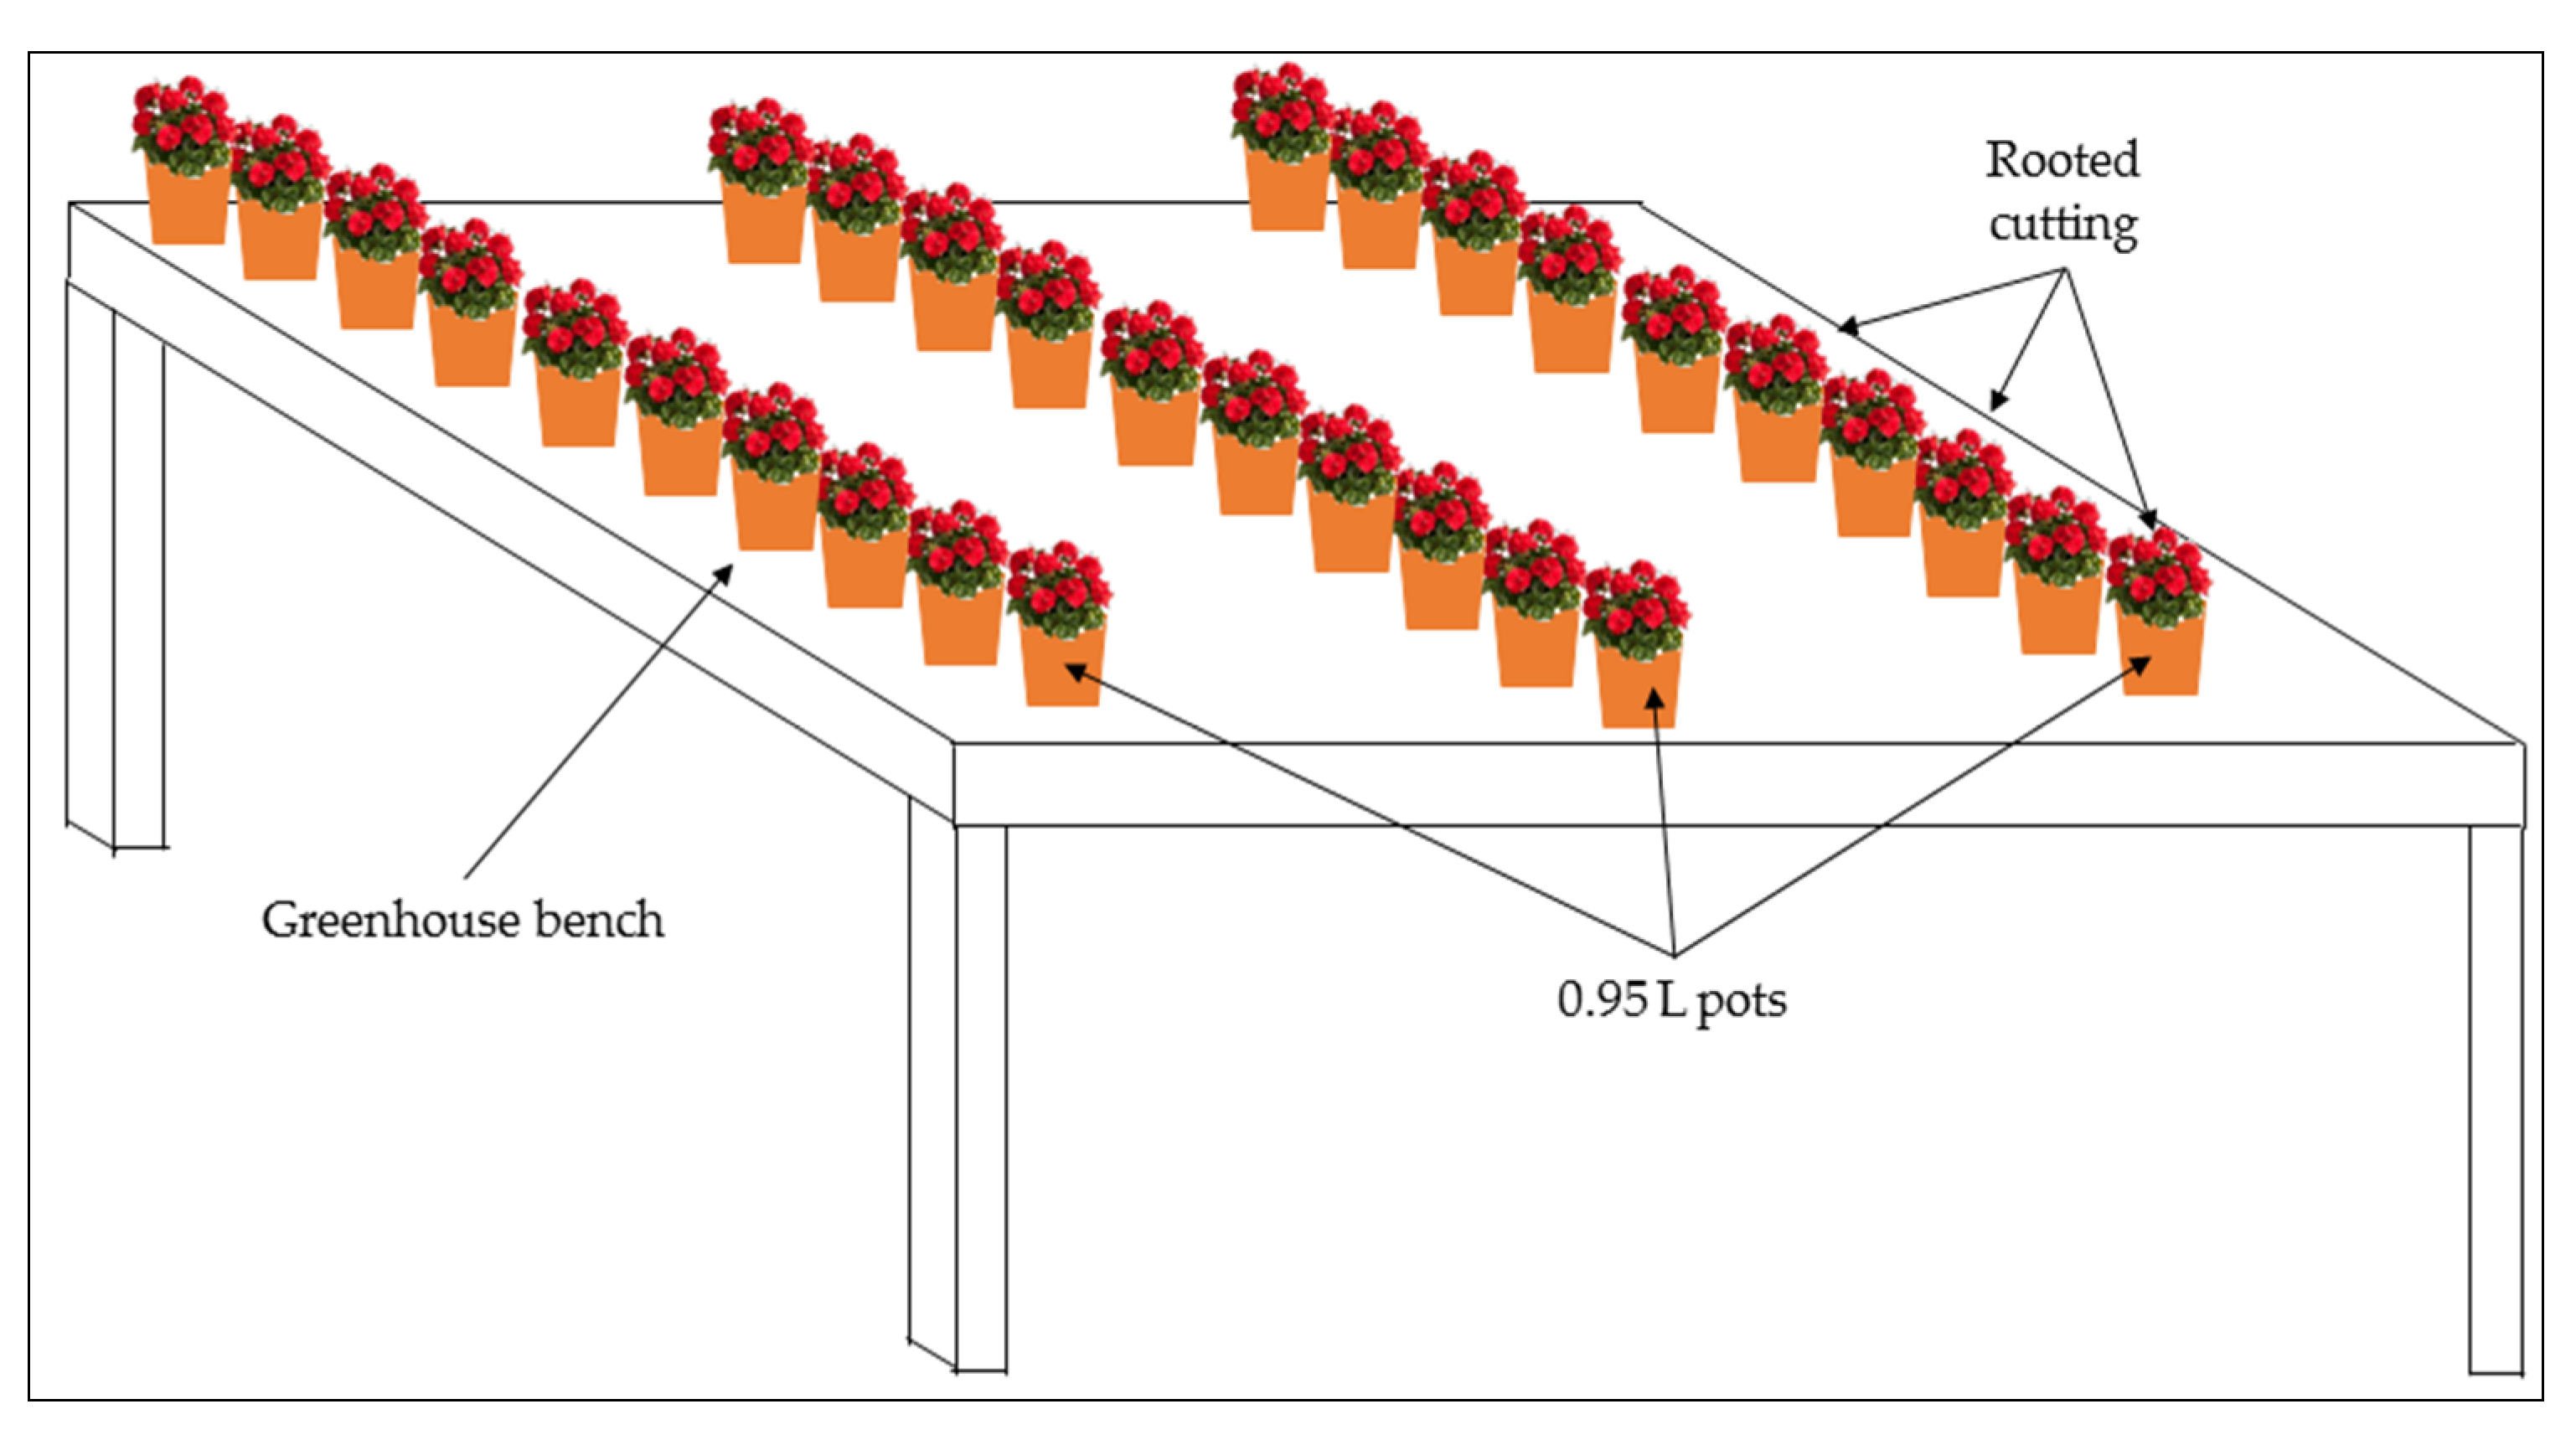
  • T-1 (farm system with substrate, Figure 1): 30 rooted cuttings were grown on 0.95 L pot (Ø1 9 cm, Ø2 13 cm, h 10.8 cm), each featuring eight bottom holes, filled with a mixture of two different peats with a 1:1 volume ratio mixture (Peat A: Geotec srl, Adria, Italy, dry bulk density = 0.15 g·cm−3, total porosity = 92%; Peat B: Tercomposti S.p.A., Calvisano, Italy, dry bulk density = 0.10 g·cm−3, total porosity = 95%). The 30 pots were placed on a greenhouse bench, arranged in 3 rows with 10 pots each. Plants were manually watered using a 15 L watering can, as usually done in the local farms, daily supplying 100% of water evapotranspiration. The leaching fraction of water was tending to 0%. The rooted cuttings were fertilized only three times in total with granular fertilizer solubilized in water to have each time a concentration of 2.08 g·L−1.
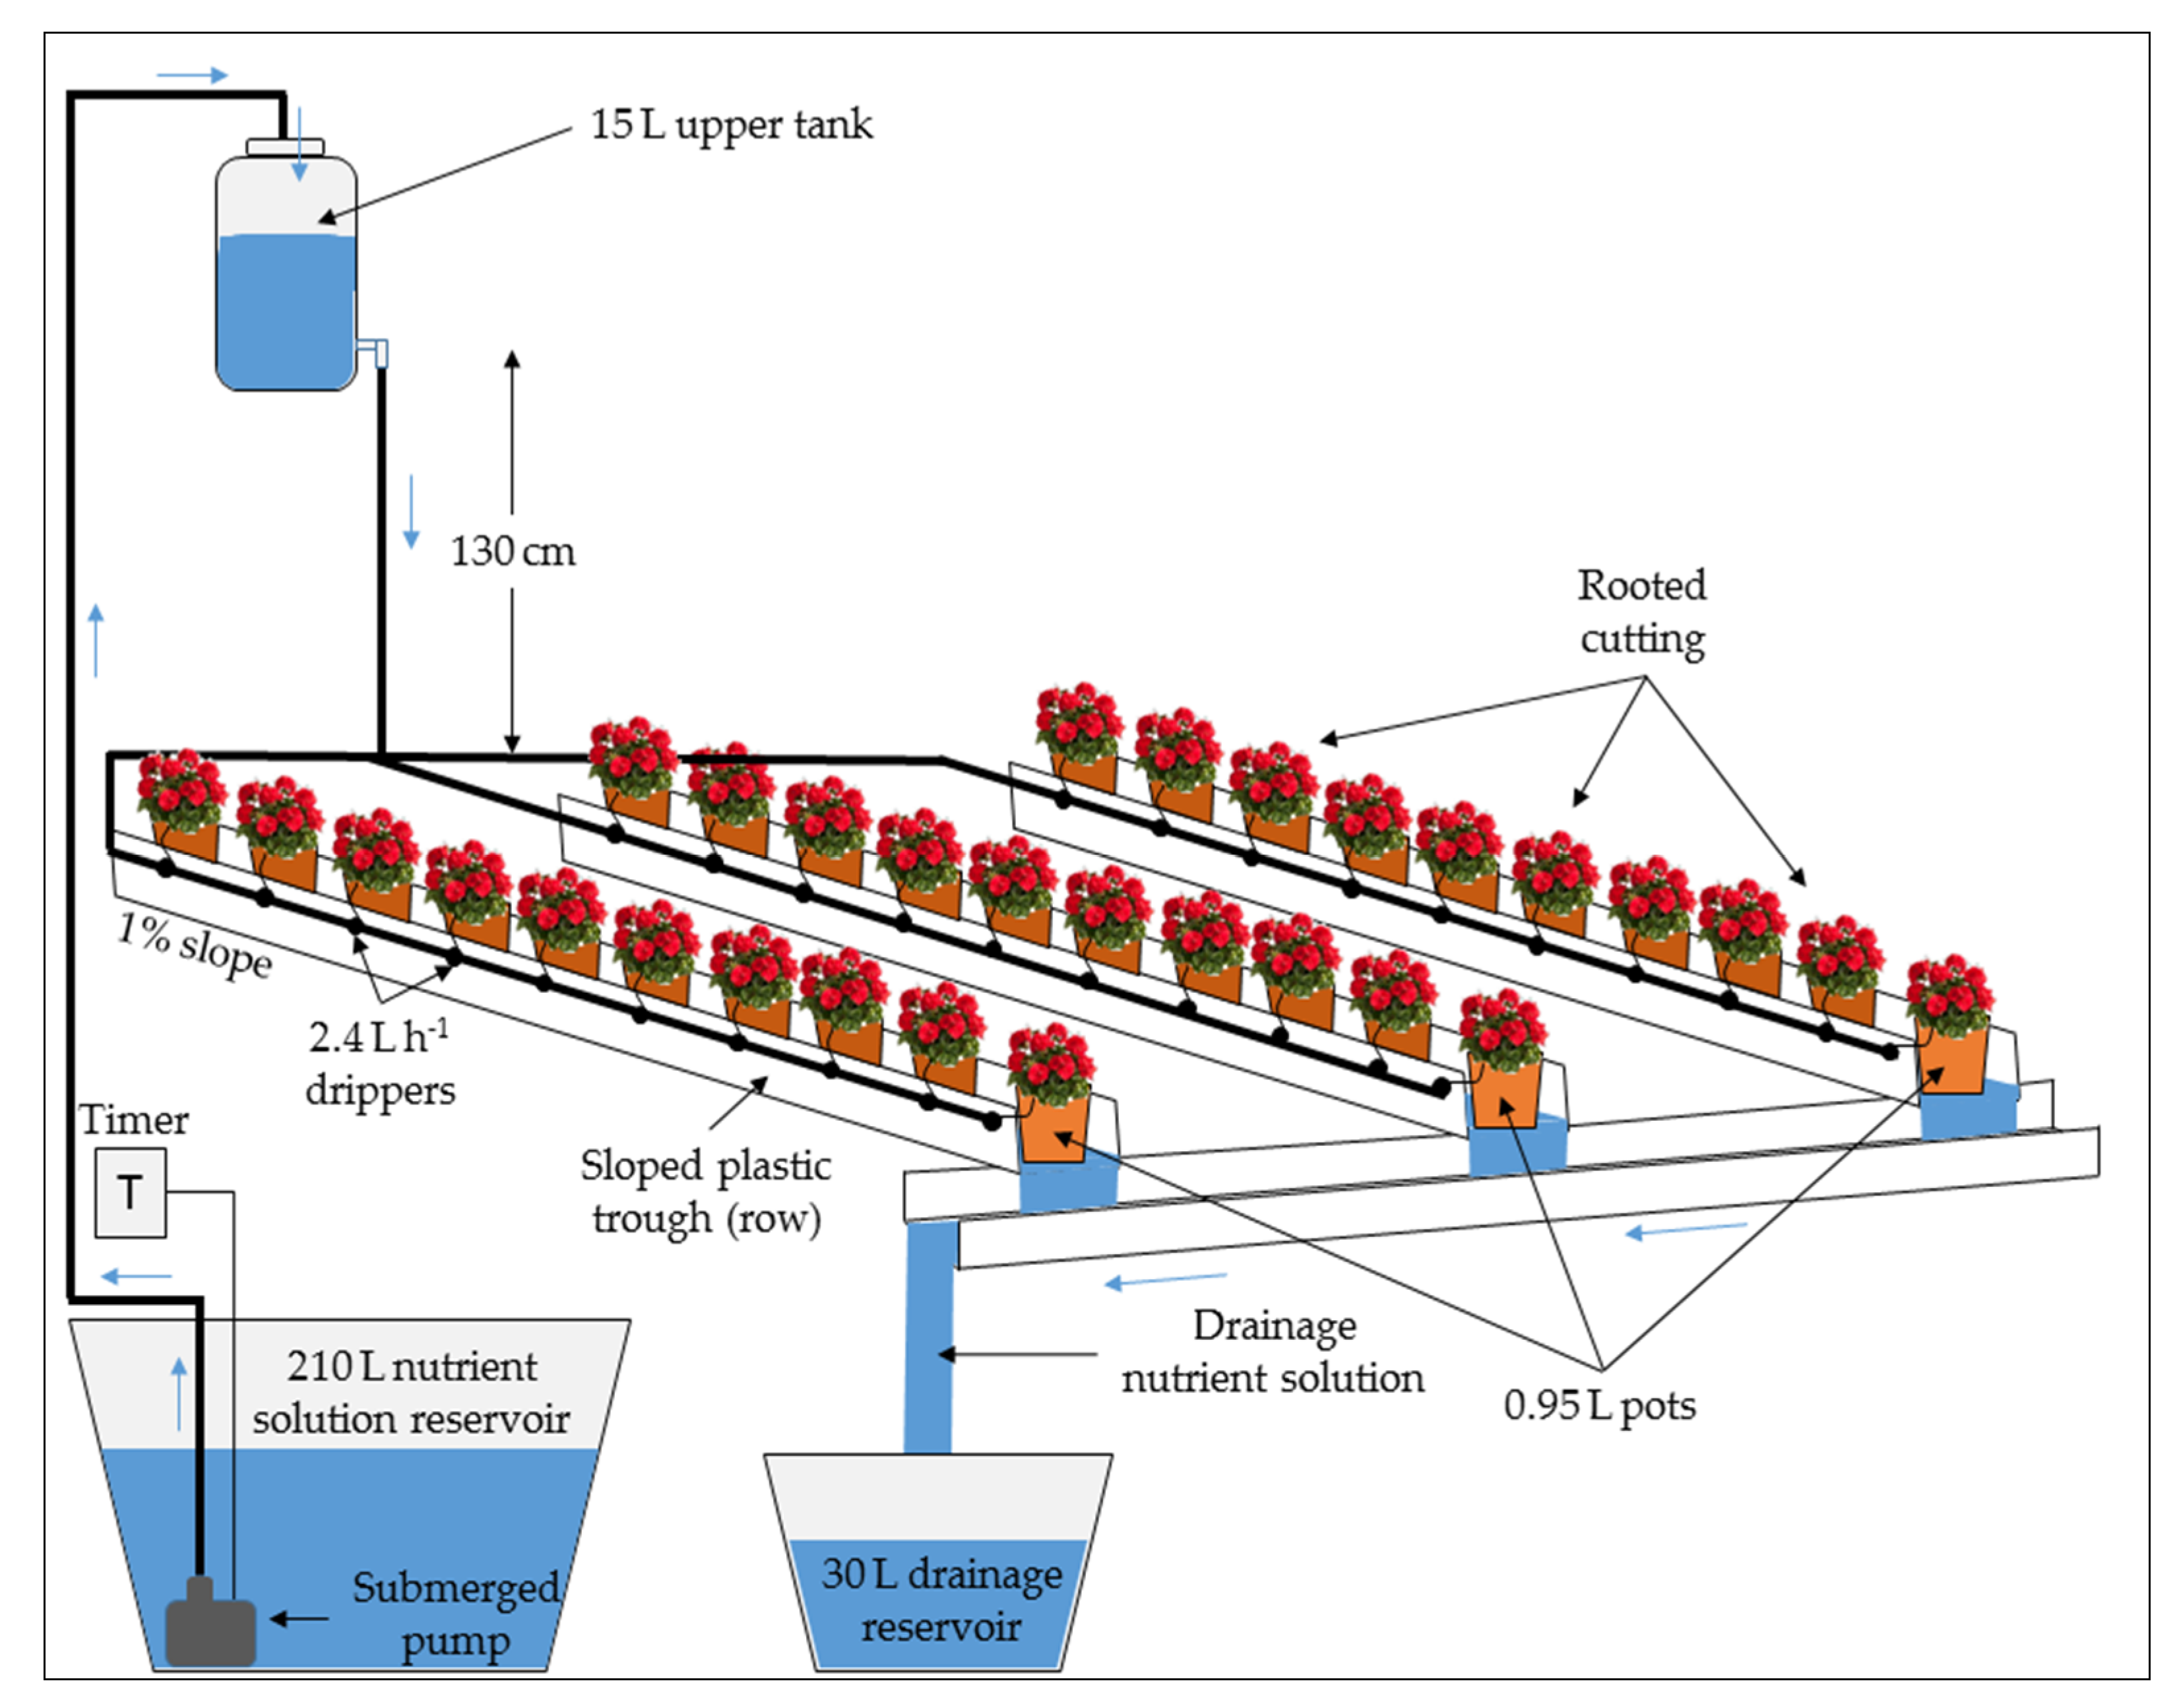
  • T-2 (open-cycle drip system with substrate, Figure 2): 30 rooted cuttings were grown on 0.95 L pot (Ø1 9 cm, Ø2 13 cm, h 10.8 cm), with eight bottom holes, filled with a mixture of two different peats with a 1:1 volume ratio mixture (Peat A: Geotec srl, Adria, Italy, dry bulk density = 0.15 g·cm−3, total porosity = 92%; Peat B: Tercomposti S.p.A., Calvisano, Italy, dry bulk density = 0.10 g·cm−3, total porosity = 95%). The 30 pots were arranged in three rows with 10 pots each. Rows consisted of three plastic troughs measuring 1.50 m in length, 12 cm in width, and 6 cm in depth with a rectangular section and displaying a slope of about 1% to allow collecting the drained NS. The pots were placed inside the plastic troughs. The rooted cuttings were watered only with the NS by the drip irrigation system, daily supplying 130% of daily water requirement (leaching fraction of about 30%). The system was further integrated with a 210 L·NS reservoir tank located at the bottom of the plastic troughs, a submerged pump (Comet Elegance, Germany) with a flow rate of 10 L·min−1 and a pressure of 0.5 bar, a 15 L upper tank located at 130 cm high to receive the pumped NS, a drip irrigation system equipped with non-self-compensating emitters (2.4 L·h−1 nominal flow rate, one for each pot), and a 30 L reservoir tank for collecting the drainage. The leaching fraction was not reused, and T-2 was managed as an open system. Given that from the upper tank to the drippers the NS descended only by gravity, the actual flow rate of the drippers (0.66 L·h−1, as measured before the experiment started) was lower than their nominal flow rate. Accordingly, the correct amount of NS to be introduced in the system was determined through a programmable electronic timer that activated the pump.
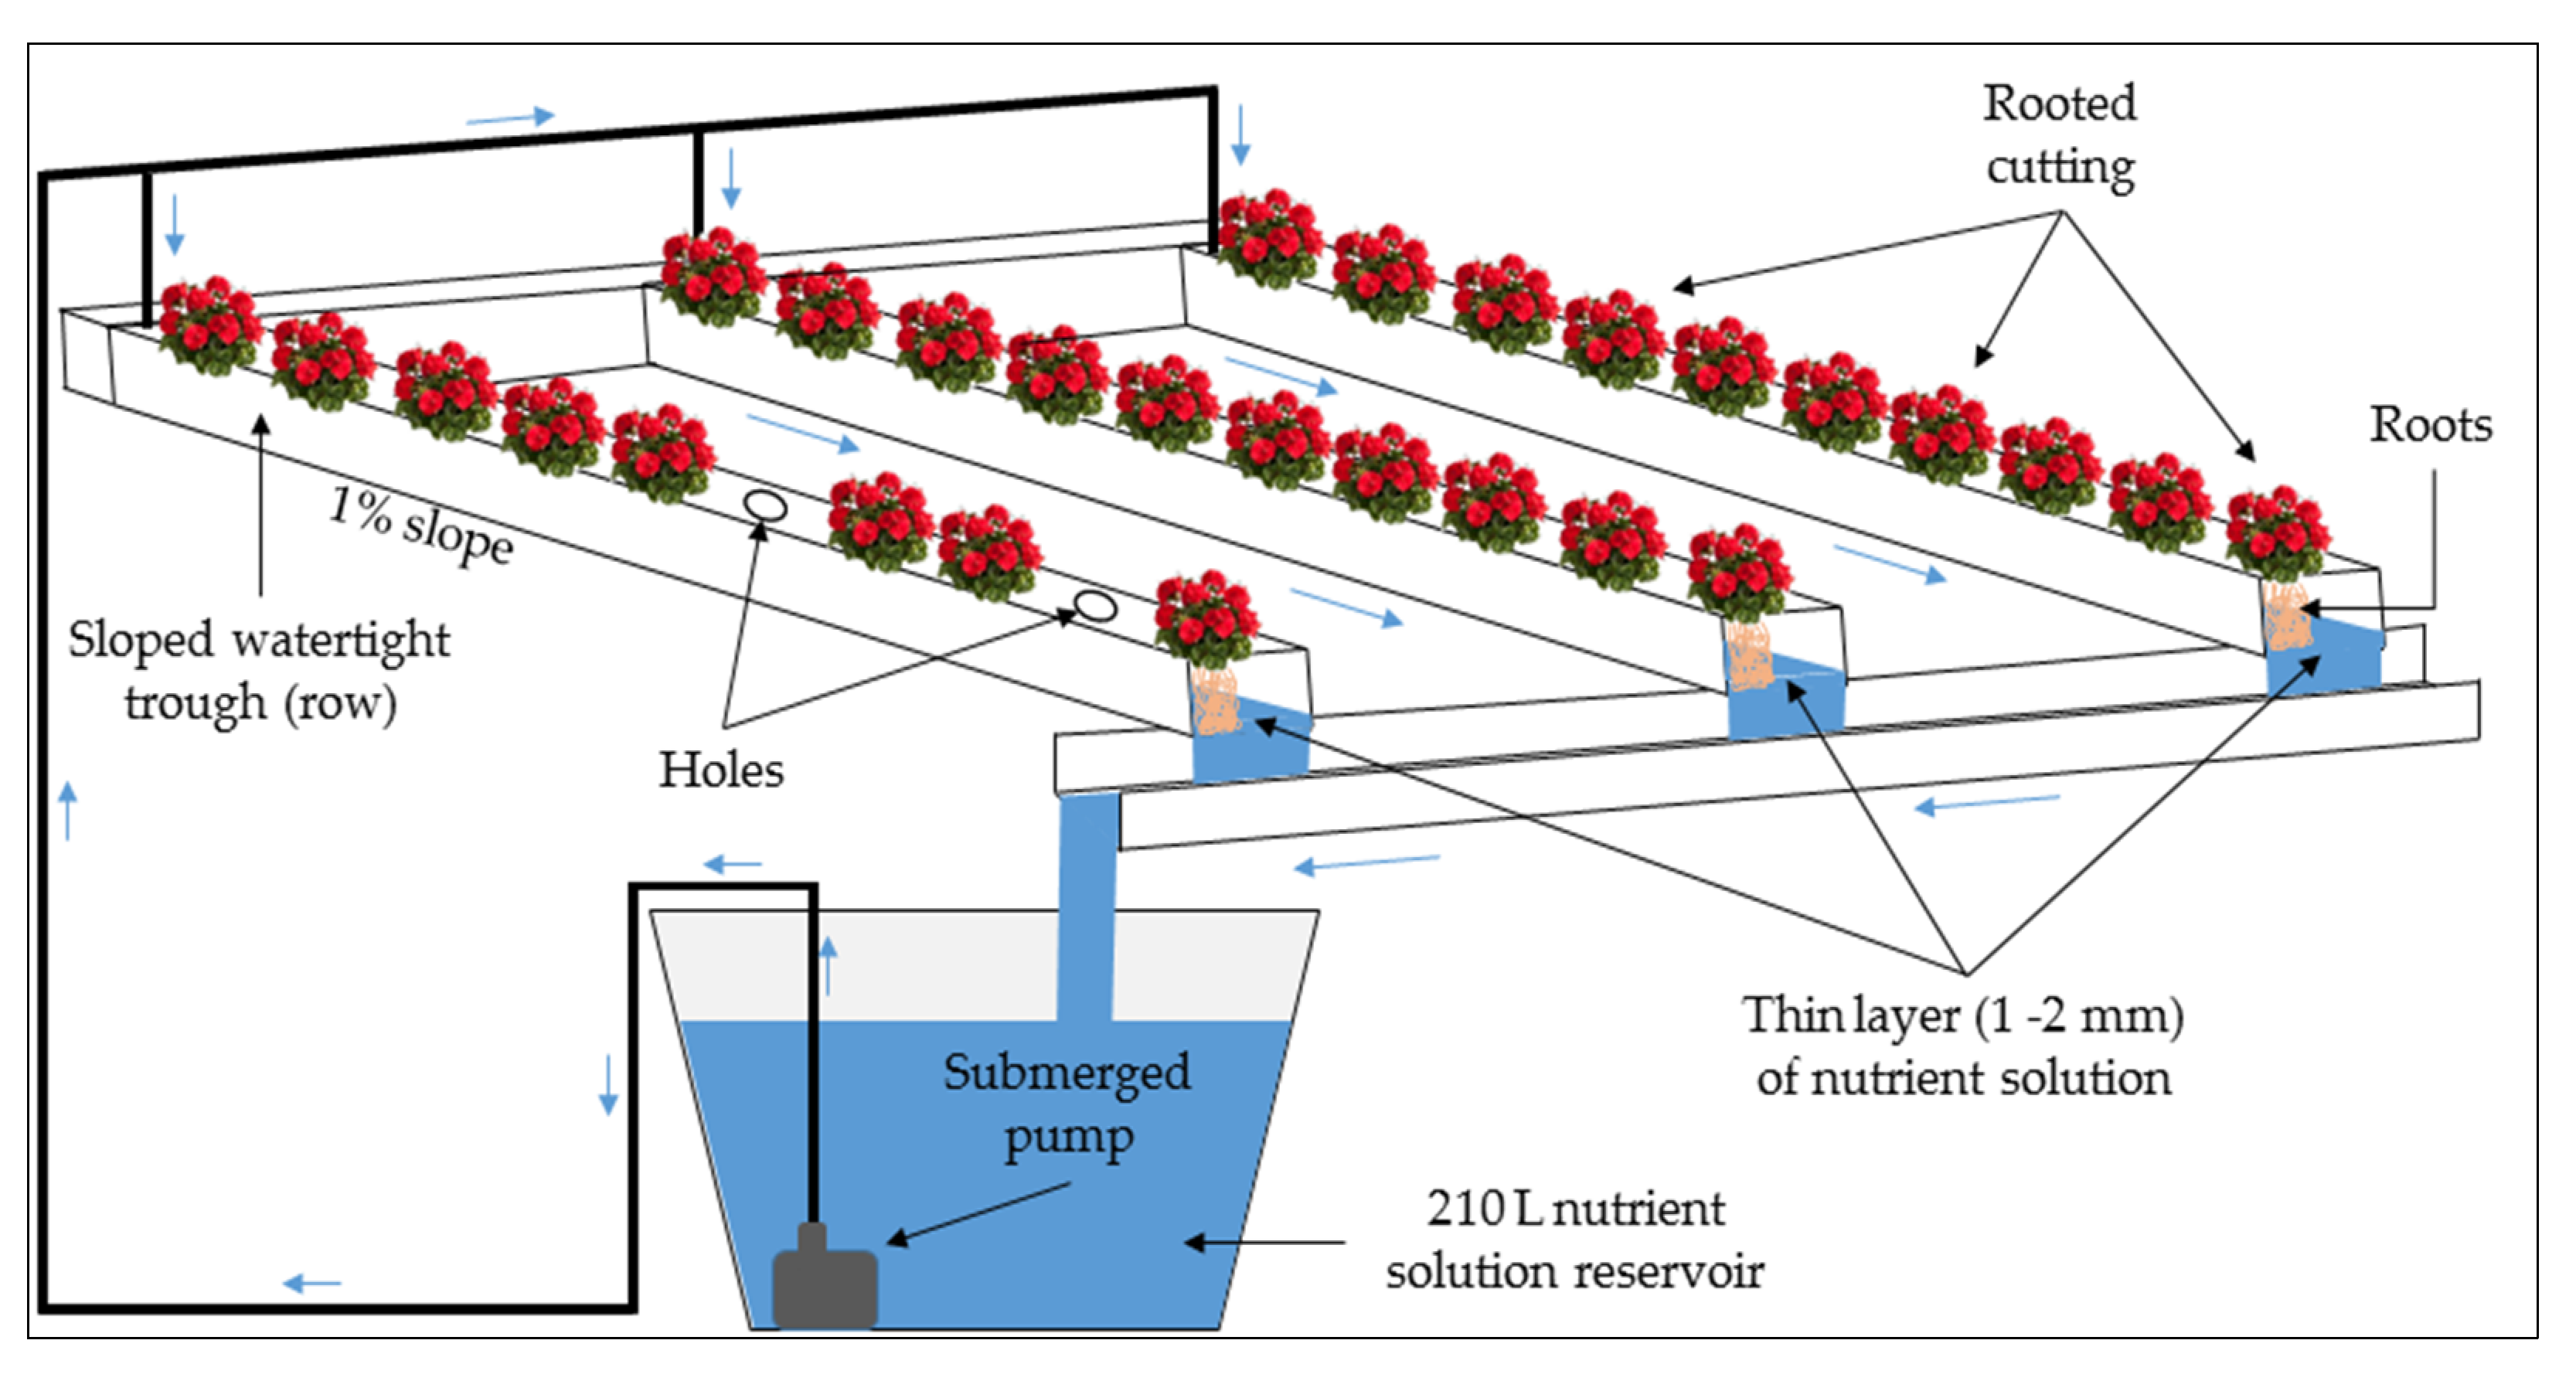
  • T-3 (Nutrient Film Technique system, Figure 3): the system adopted the Nutrient Film Technique (NFT) and featured a closed soilless system with a thin layer of around 1–2 mm of NS flowing through sloped watertight troughs that hosted the plant roots. Thirty rooted cuttings were arranged in 3 rows consisting of 3 plastic troughs measuring 1.50 m in length, 12 cm in width, and 6 cm in depth with a rectangular section and a slope of about 1%. The plastic covers featured holes, where the rooted cuttings were placed. T-3 was also composed of a 210 L·NS reservoir located at the bottom of the plastic troughs and a submerged adjustable flow pump (Newa Jet, Italy) that pumped the NS in the plastic troughs.
In each of the three treatments, all 90 rooted cuttings were arranged in rows with 10 plants each, with 15 cm between rooted cuttings and 42 cm between rows, resulting in a planting density of about 16 plants m−2, following common commercial practices. Three replicate plots for each treatment (rows), composed of ten rooted cuttings each (n = 30), were arranged in a randomized complete block design.

2.3. Plant Material and Crop Management

At the beginning of the trial, rooted cuttings were selected to have uniform plant material (4 cm height and 3 leaves) among the 90 individual plants used for the experimentation. T-1 (control) was managed following traditional practices from local farmers. It was irrigated only with water once every 2 days from the 1st to the 7th week, and once a day from 8th to 10th week, by hand. T-1 was fertilized only three times (discontinuous fertigation, on 4 April, 22 April, and 12 May), with a granular fertilizer (Manna Lin A, Mannafert V., Bolzano, Italy). Granular fertilizer was solubilized in water to have a 2.08 g·L−1 concentration for a total amount of 50.50 g applied. Manna Lin A is composed of 7% N-NO3, 13% N-NH4, 5% P2O5, 10% K2O, 2% MgO, 0.025% B, 0.005% Cu, 0.06% Fe, 0.025% Mn, 0.0025% Mo, and 0.02% Zn. The microelements were supplied as chelates.
Unlike T-1, in T-2 and T-3, a continuous fertigation was adopted, using the same NS. The composition of macronutrients of full strength NS was: 10.00 mM NO3, 1.00 mM NH4+, 2.00 mM H2PO4, 5.01 mM K+, 4.00 mM Ca2+, 1.50 mM Mg2+, and 3.53 mM SO42−. A mixed fertilizer for micronutrients was used, with the following full strength NS: 20.00 µM Fe3+, 0.63 µM Cu2+, 4.29 µM Zn2+, 13.88 µM B3+, 19.66 µM Mn2+, and 0.42 µM Mo6+. For all fertigation treatments, NS was prepared using fresh water (pH = 8.00, EC = 359 µS·cm−1 at 20 °C). The final EC of full strength NS ranged between 1829 and 1963 µS·cm−1 and pH ranged between 5.5 and 6.2. During the first week, in T-2 and T-3, a lower strength NS for macronutrients was used (T-2 top-fertilized by watering can) (EC = 1021 µS·cm−1, pH = 5.5, 5.4 mM NO3, 0.50 mM NH4+, 1.0 mM H2PO4, 2.5 mM K+, 2.0 mM Ca2+, 0.97 mM Mg2+, and 0.75 mM SO42−) to allow the roots to adapt to the new growing environment before using the full strength NS. The EC of leaching fraction was measured every week in both T-2 and T-3 treatment.
T-2 fertigation scheduling took into account the leaching fraction measurement, having drainage around 30% per day as a target. It changed during the crop cycle and ranged from 1 irrigation every 3–5 days at the beginning to 2 irrigations per day at the end of the trial. The NS volume provided for all pots ranged from 3.6 L during the 2nd week to 78.9 L during the 10th week, corresponding to the flowering stage. In T-3, the NS was continuously supplied from sunrise to sunset, by submerged adjustable flow pump with a measured flow rate for every plastic trough of 1.83 L·min−1.
Inside the greenhouse, temperature and relative humidity were monitored every 15 min by GEMINI data logger Tinytag Plus 2. The greenhouse temperature ranged between 12 and 33 °C, and day/night humidity from 30% to 85%, respectively.

2.4. Sampling and Analysis

In the first week, EC, pH, the drained volume of T-2, volume of leftover NS in the 210 L reservoir tank of T-3, its EC and pH were daily measured after the sunset. During the trial, on 22 April and on 13 May, 100 L of fresh NS each were added to the T-2 and T-3 reservoir tanks. EC, pH, and total volume were measured again after the additions. From the 2nd to 10th week, all these parameters were measured weekly. EC was measured by Adwa AD31 Waterproof EC/TDS Tester and pH was measured by Artiglass IP67 pocket pH Tester. All testers were weekly calibrated.
Progressive and final plant heights, determined as the distance from the surface of the medium to the top of the plant, for all 90 rooted cuttings were measured. To evaluate the flowering timing and its quality, the starting date of appearance of inflorescences and their numbers per plant, together with dates of beginning and full flowering, were recorded in ten plants per replicate. Furthermore, in three plants per replicate, weekly counts of the number of fully-grown leaves was performed, as well as counts of the number of flowers of the first inflorescence and number of branches.
The estimation of leaf chlorophyll concentration was performed at the end of the trial through a non-destructive measurement with SPAD-502 (Konica-Minolta, Tokyo, Japan). Measures were taken on the leaf nearby the oldest inflorescence from 10 plants per replicate. The Minolta SPAD meter (Soil Plant Analysis Development) used indirectly measures chlorophyll content in a non-destructive manner. SPAD values were determined by measuring the ratio of light transmitted through the leaf at a red wavelength (650 nm) and an infrared wavelength (940 nm).
At the end of the experiment, all 90 plants were divided into leaves (leaves with petioles), trunks, roots, and inflorescences. Plant organs were weighed for the fresh and dry weight determinations after drying in a ventilated oven at 105 °C for 48 h.
Furthermore, at the end of the experiments, an aesthetic-commercial assessment of 10 plants per replicate was performed. For each rooted cutting, three parameters (vegetative growth, foliage compactness, and general aspect) were evaluated by assigning a score from 1 to 5, with the score 3 being the threshold value for marketability. Whenever at least one of the three parameters received a score below 3, the rooted cutting was evaluated as not marketable. The aesthetic-commercial assessment was performed by the local farmer in a randomized way without being aware of the specific treatments.

2.5. Statistical Analysis

For phenological data regarding the flowering degree (appearance of inflorescences, flowering start, and full flowering) and fully-grown leaves, no statistical analysis was applied, but only kinetic behaviors in relation to the treatment were shown. Analysis of variance (ANOVA) was used to determine the effect of the growing system used on the number of inflorescences plant−1, number of flowers inflorescence−1, final height of the plant, number of branches plant−1, SPAD index, water contents of organs, aesthetic commercial assessments, fresh weight, total water consumption, and water use efficiency. All data were statistically processed using Systat software package (Systat Software 9.0, San Jose, CA, USA).

3. Results

3.1. Climate and Nutrient Solution Monitoring during the Experiment

During the experiment, inside the greenhouse, a data logger was used to measure temperature and humidity every fifteen minutes. Maximum air temperature ranged between 14.7 and 39.0 °C, with an average of 32.2 °C. Minimum air temperature ranged between 8.2 and 20.7 °C, with an average of 12.1 °C. The average daily temperature was 18.7 °C. The daily maximum relative humidity ranged between a minimum of 50.0% and a maximum of 93.3%, with an average of 83.9%. The daily minimum relative humidity ranged between a minimum of 16.5% and a maximum of 85.6%, with an average of 31.7%. The average daily humidity was 65.3%. During the experiment, the mean value of daily global radiation, outside the greenhouse, was 15.87 MJ·m−2·day−1 in April and 20.25 MJ·m−2·day−1 in May.
A NS was applied only in T-2 and T-3 treatments, with periodical control of both EC and pH. During the first week, in which a lower strength NS (EC = 1021 µS·cm−1 and pH = 5.5) was used, EC of the leaching fraction ranged between 1026 and 1040 µS·cm−1, while the pH ranged between 5.5 and 5.8. From the second week, when a full strength NS (EC ranged 1829–1963 µS·cm−1 and pH ranged 5.5–6.2) was used, EC of leaching fraction ranged between 2171 and 3923 µS·cm−1, while the pH ranged between 5.8 and 6.5.

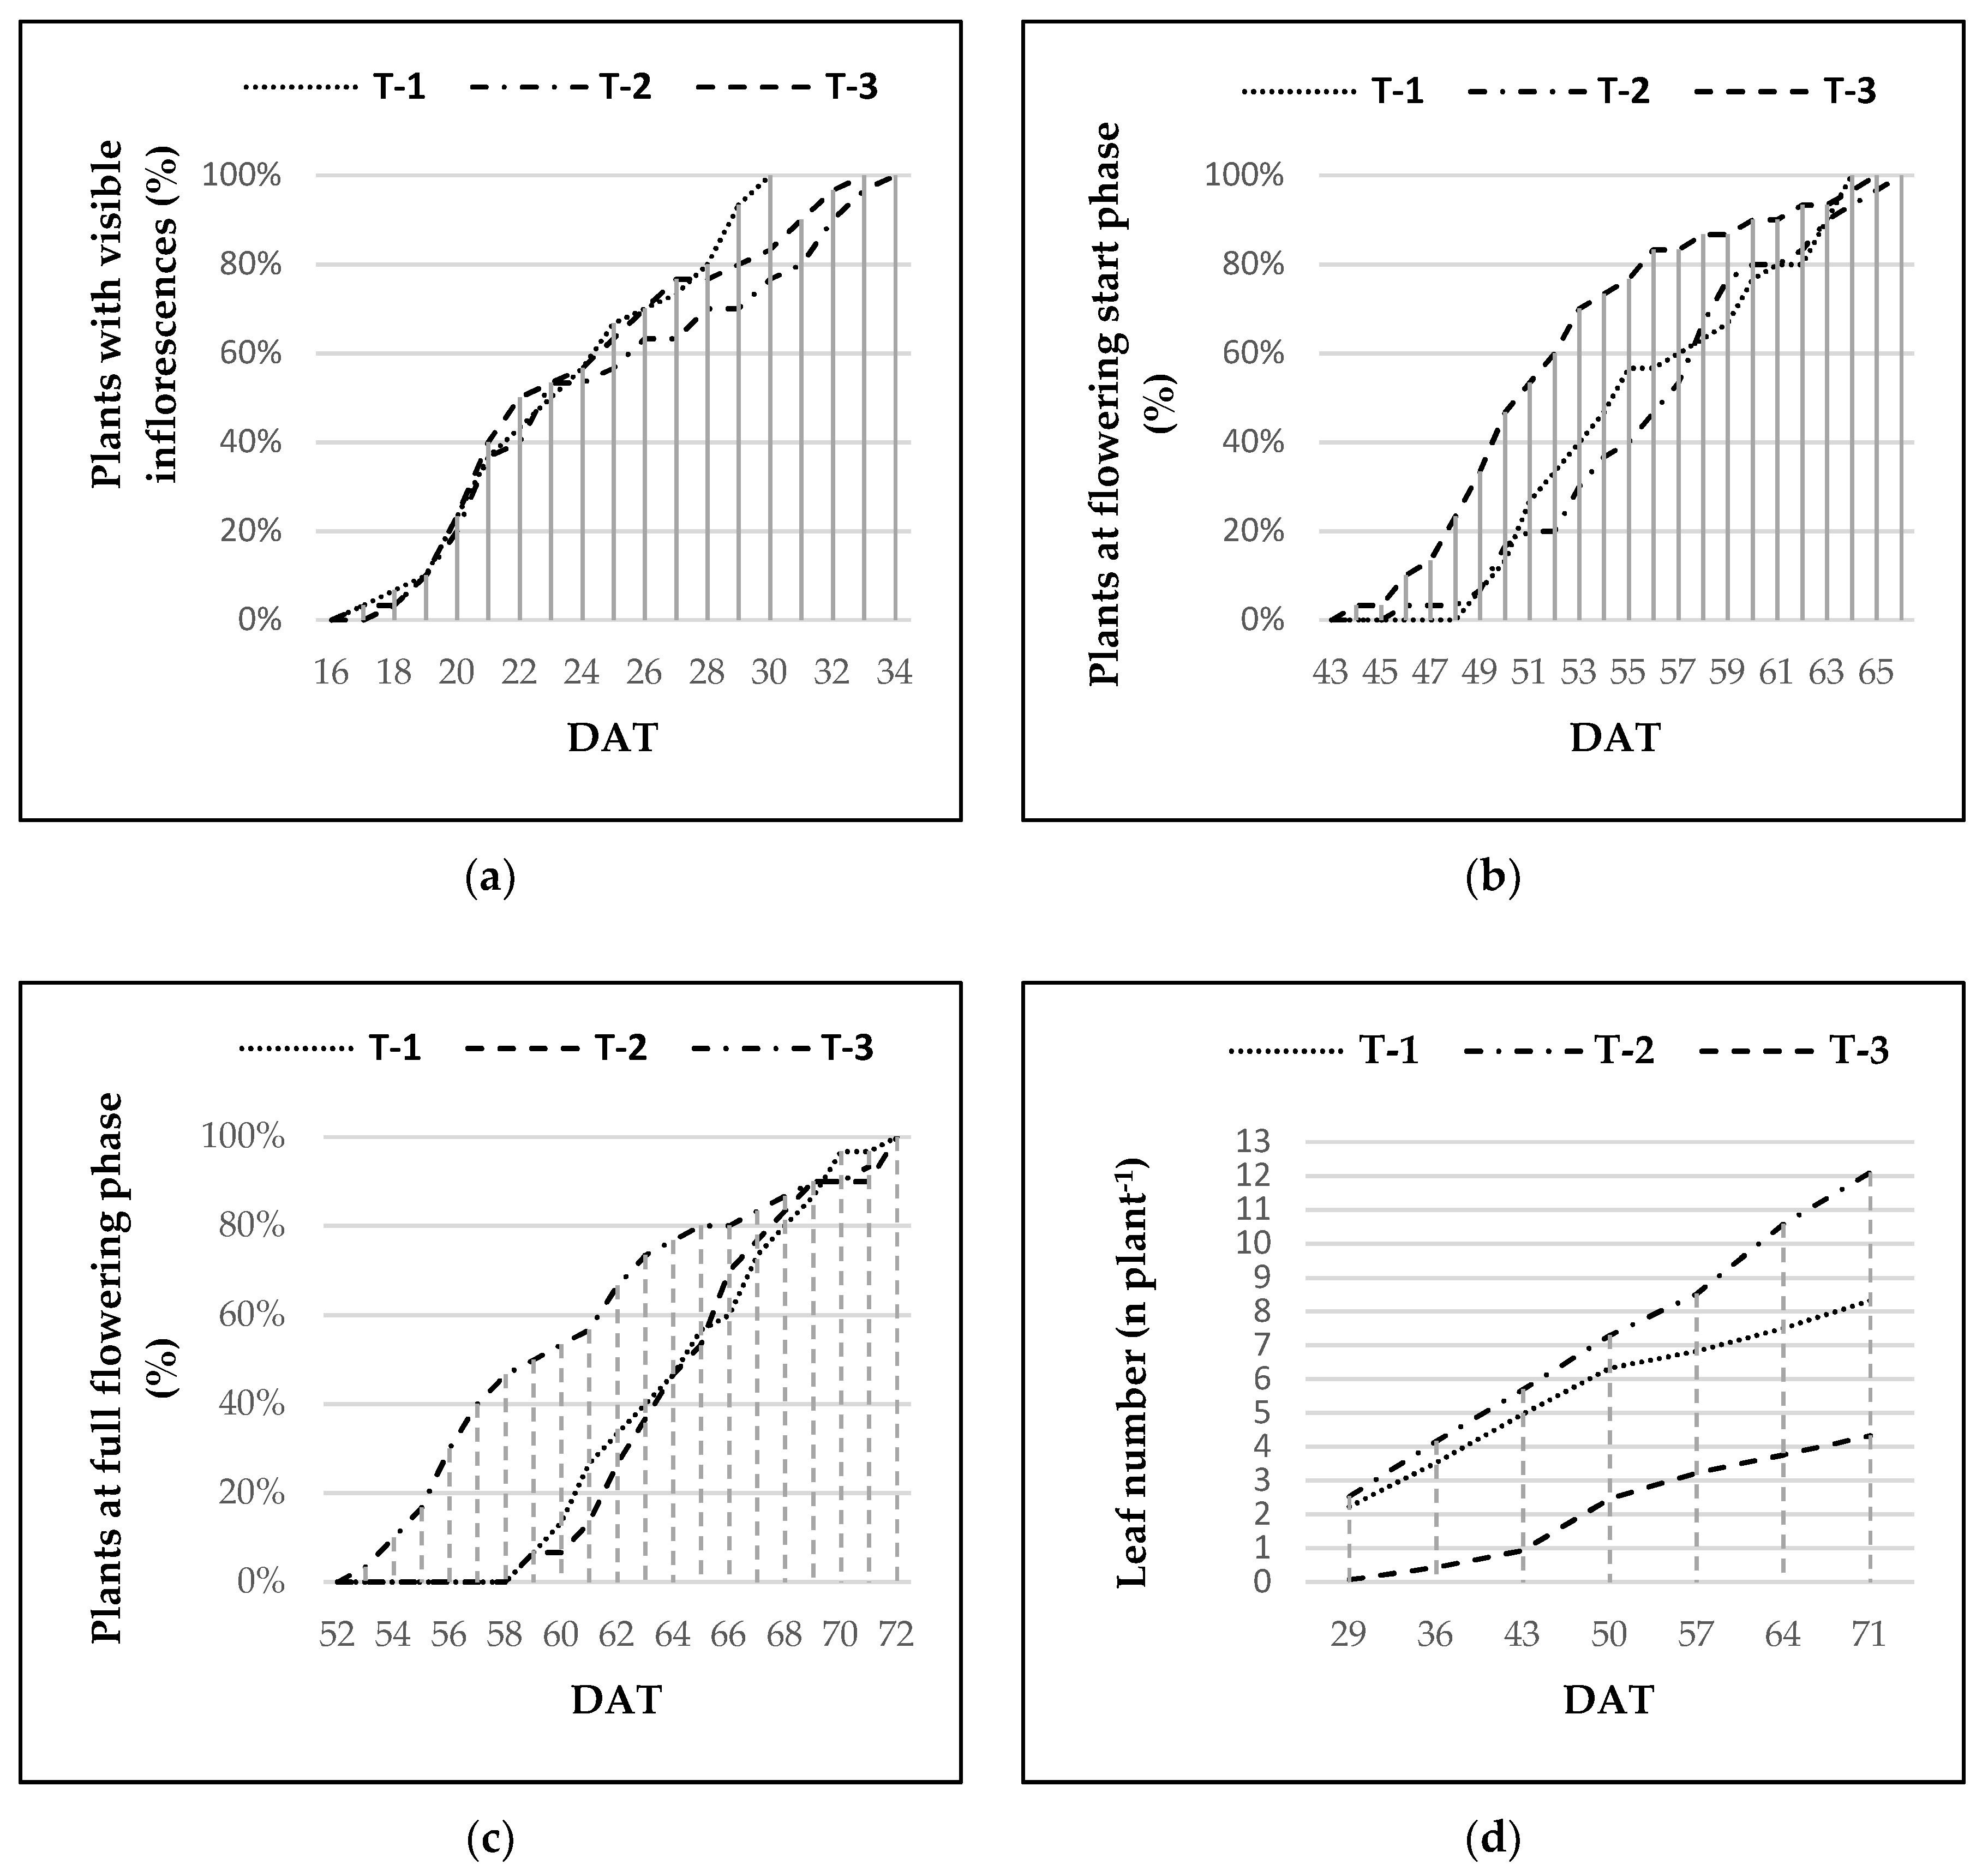
3.2. Date of the Appearance of Inflorescences

The starting date of appearance of inflorescences was not affected by the soilless systems (16–17 days after transplanting) (Figure 4a). Concurrently, T-2 and T-3 showed a more extended period (3–4 days) to conclude this phase as compared to T-1 (Figure 4a).

3.3. Date of Flowering Start

The three soilless systems affected the date when the flowering started. As compared with T-1, flowering started six and four days earlier, respectively, in T-3 and T-2 (Figure 4b). Flowering was concluded between 64 and 66 days in all treatments, independently from the growing system.

3.4. Date of Full Flowering

There were no differences between T-1 and T-2 treatments in terms of date of starting of the full flowering phase (58 days after transplanting) and flowering duration (14 days) (Figure 4c). Conversely, full flowering was anticipated by about six days and lasted five days longer under the T-3 treatment (Figure 4c).

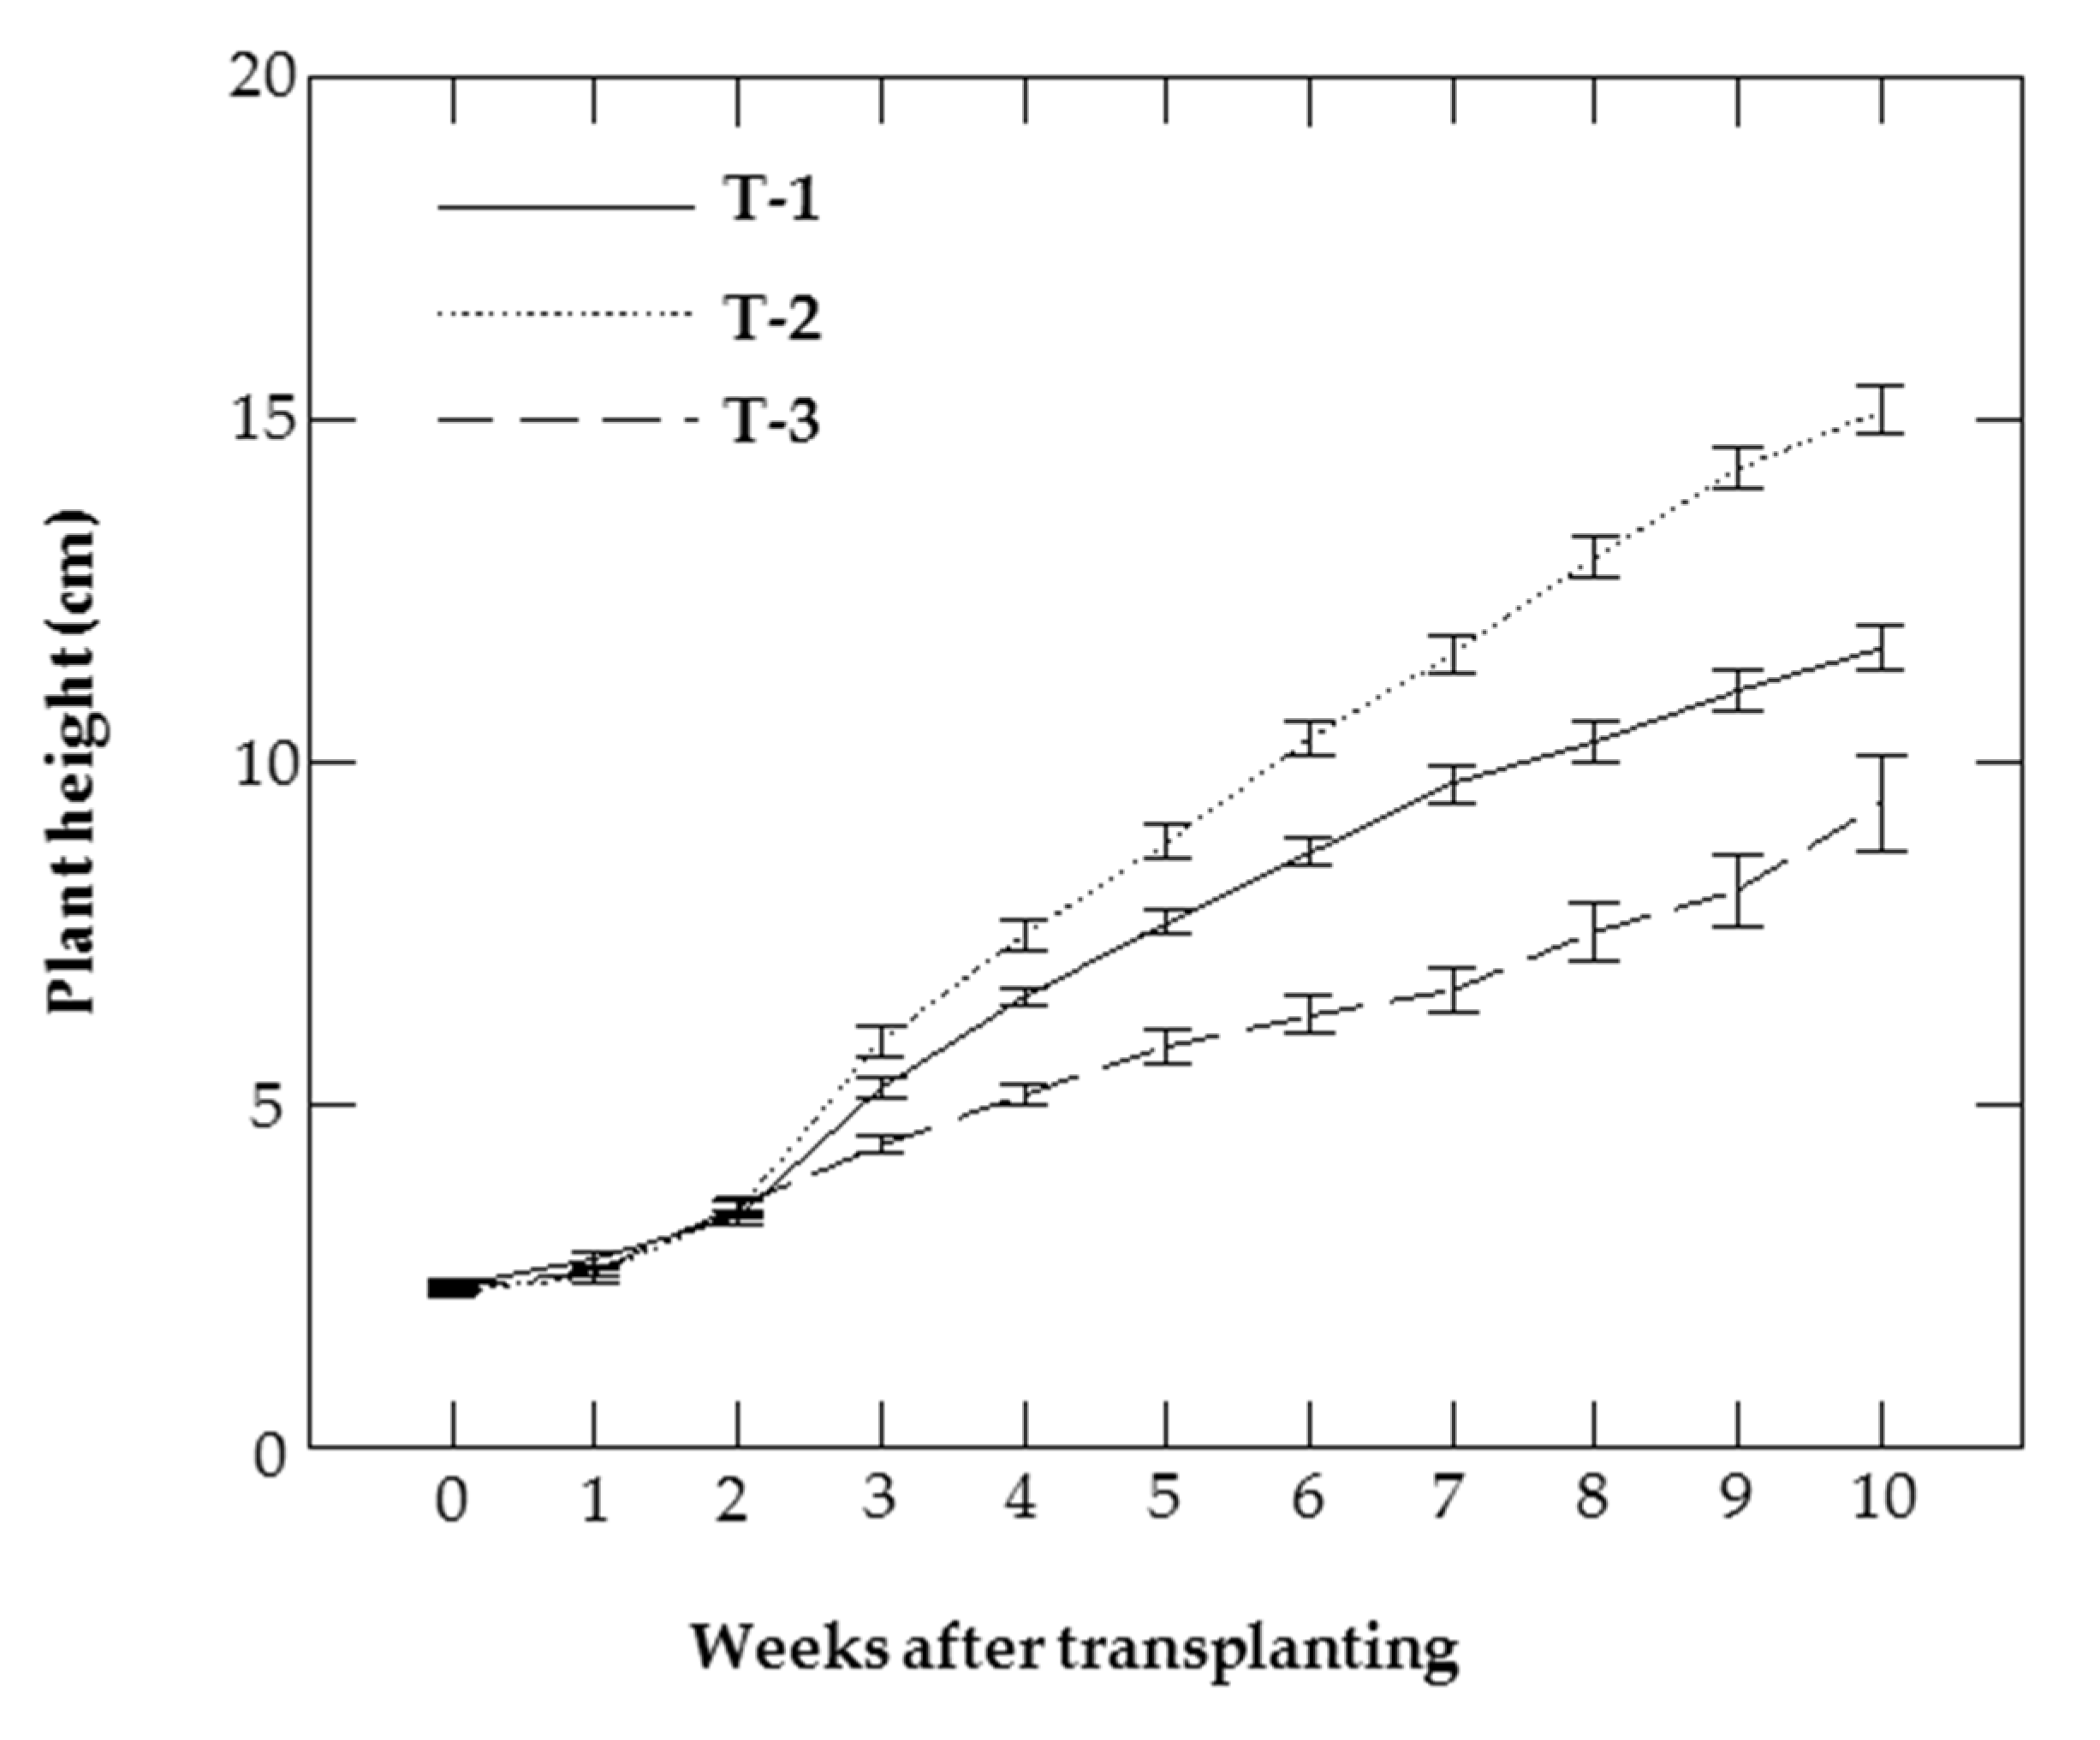
3.5. Biometrical Parameters

All biometrical parameters were significantly affected by treatments (Table 1), with highest values always associated with T-2 and lowest values found in plants grown under T-3. The plants’ height was also affected by treatment (Table 1 and Figure 5): at the final assessment, T-2 had higher values than T-1, which in turn was significantly higher than T-3.

3.6. Number of Leaves

The three soilless systems affected the number of fully-grown leaves, which was the highest in T-2 (Figure 4d). In general, T-1 and T-2 treatments resulted in a different crop kinetic behavior as compared to T-3.

3.7. Leaf Chlorophyll

Leaf greenness of plants (SPAD values) was affected by treatment. Higher SPAD values were detected in rooted cuttings grown in T-3 treatment as compared with plants grown in T-1 and T-2 (Table 2).

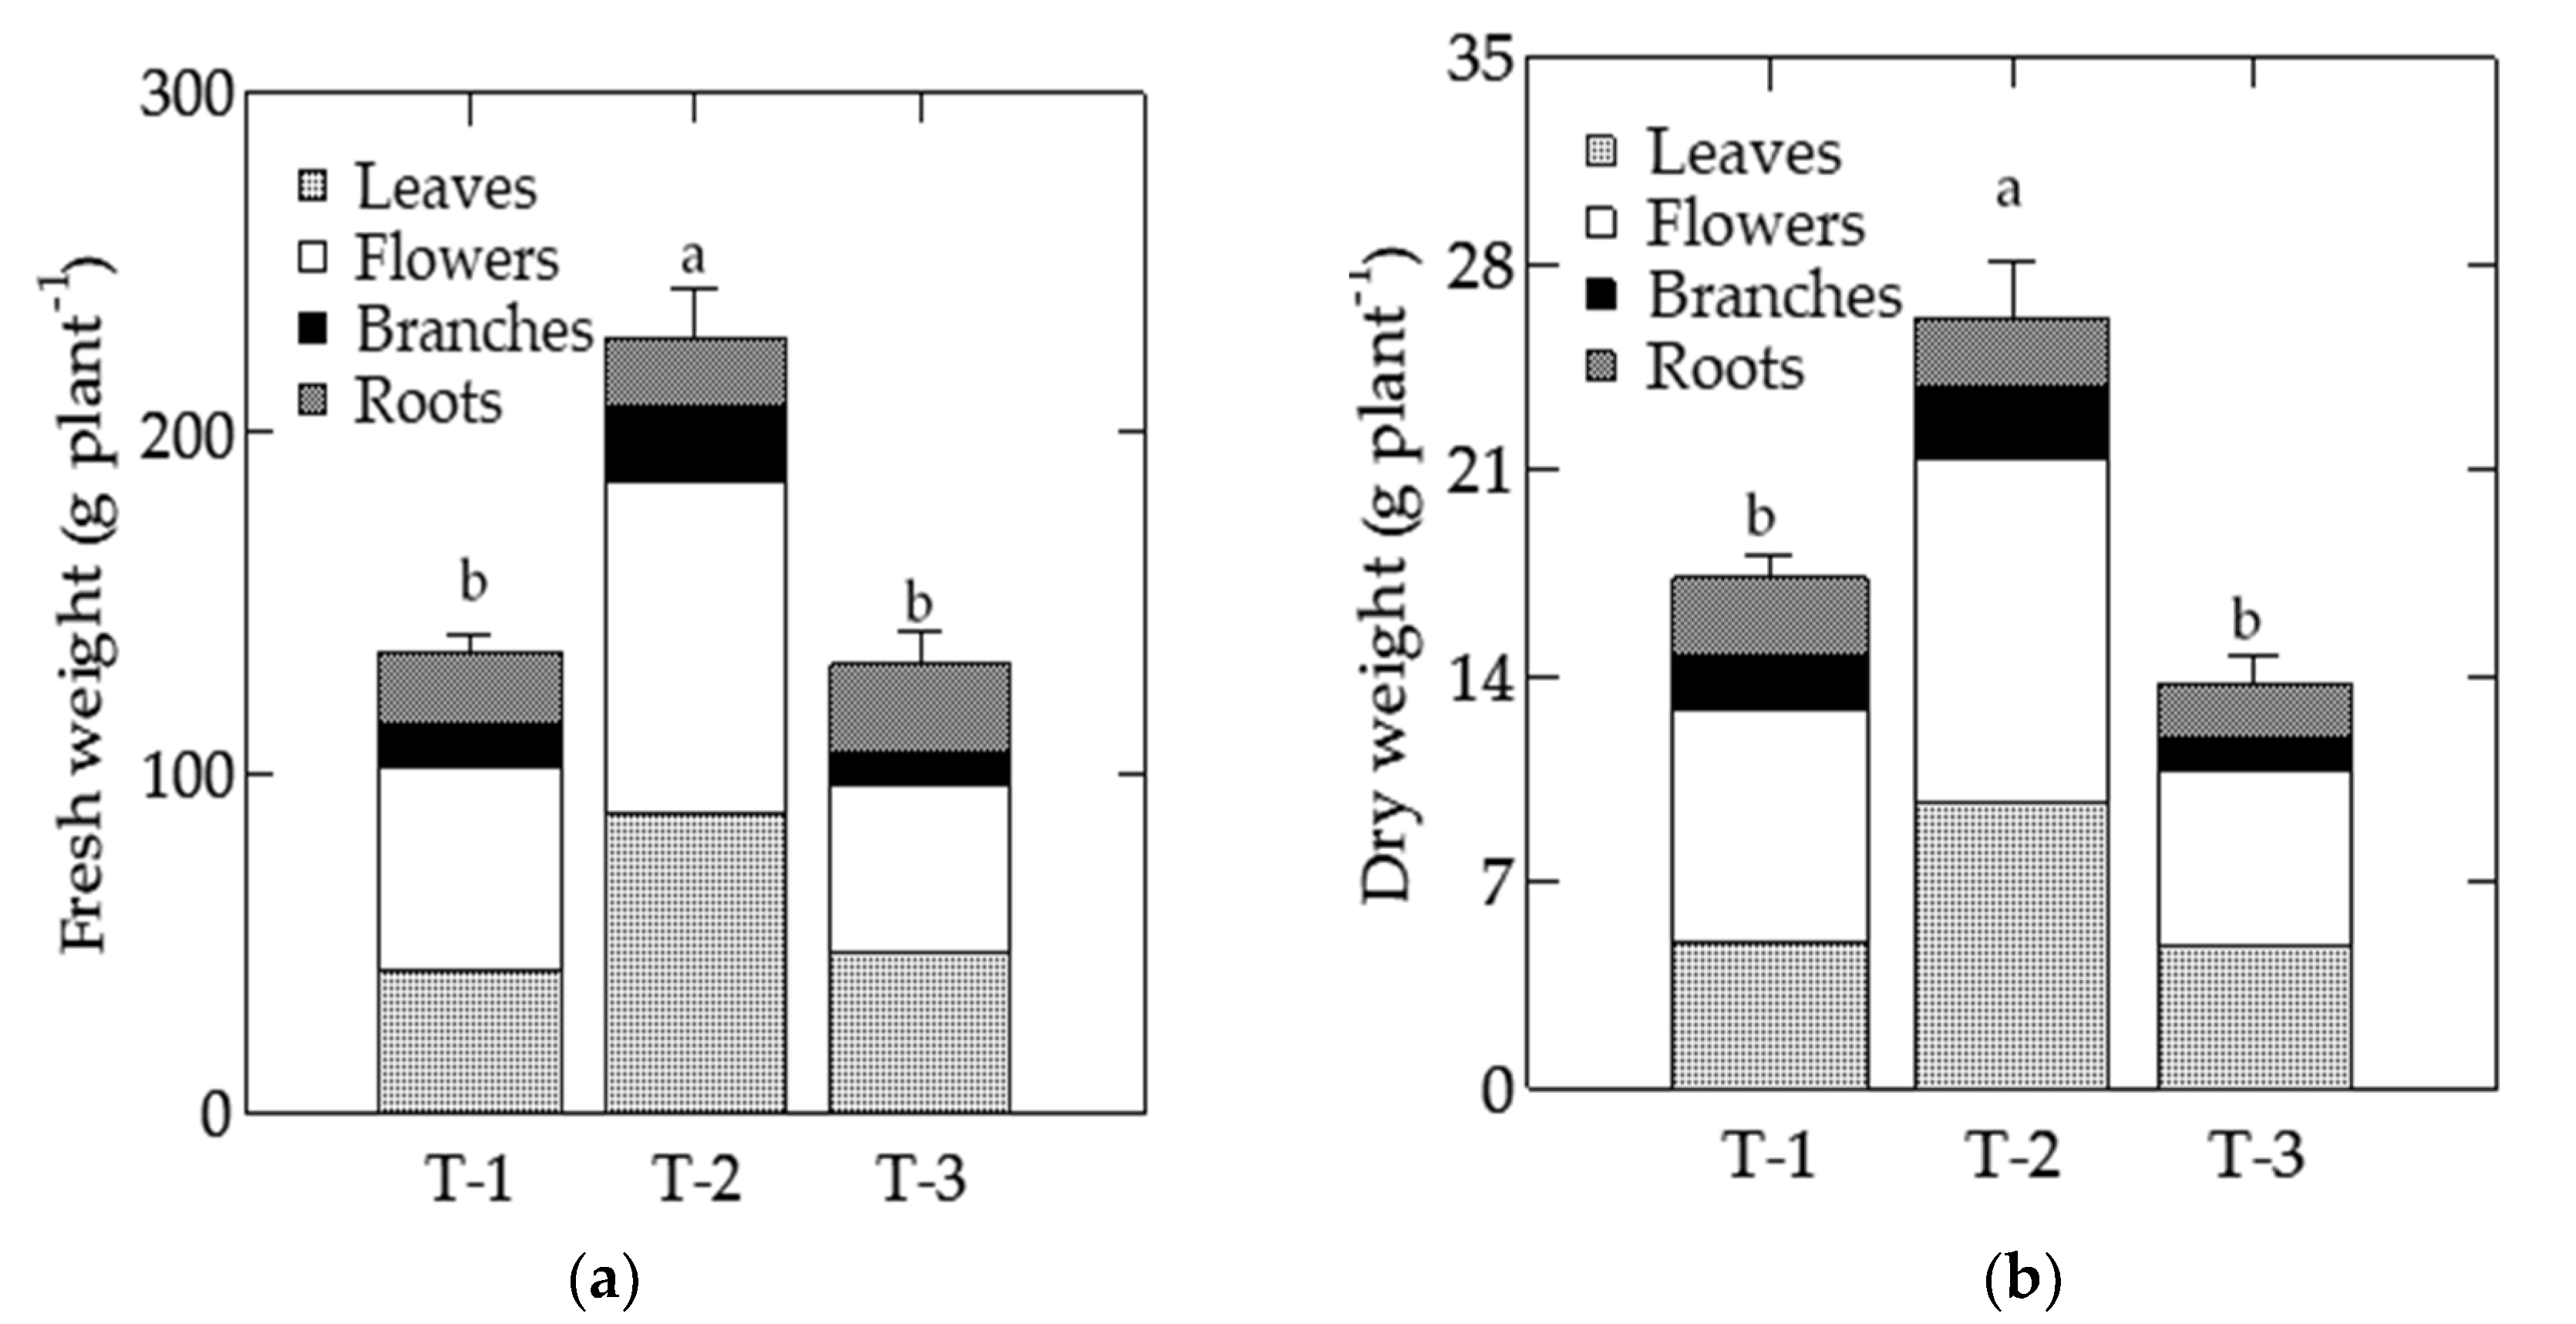
3.8. Fresh and Dry Weight

The three soilless systems affected both fresh (Figure 6a) and dry (Figure 6b) weight, which were the highest in T-2 and the lowest in T-3 and T-1. Leaves, flowers, and branches fresh weights had similar behavior of total biomass, presenting highest values in T-2 as compared with T-1 and T-3, while the fresh weight of roots was not affected by treatment (Figure 6a). Among dry weights (Figure 6b), different behaviors were found across organs. Plants grown under T-2 presented the highest leaf and flower dry biomass as compared to T-1 and T-3. On the other hand, higher dry biomass of both branches and roots was associated with T-1 and T-2 as compared with T-3.
Treatment affected the water contents of different organs (Table 3): in particular, T-3 showed higher values than T-1, except for flowers where the difference was not significant. T-1 always presented the lowest levels, while T-2 had an intermediate behavior, with high values for both flowers and branches and low value for roots. It is interesting to note that roots of T-3 plants showed the highest values of water contents.

3.9. Aesthetic-Commercial Assessment

T-3 always had the lowest values for all investigated parameters. T-2 showed the best scores in all the parameters evaluated, except for the vegetative growth, in which T-1 had the highest score as the absolute value, even if statistical analysis did not detect any significant difference as compared to T-2 (Table 4).

3.10. Water Consumption and WUE

The comparison of the three treatments revealed significant differences as regards the biomass produced, the water consumption (leaching fraction included), and the related WUE values (Table 5). In particular, T-2 differed from the other two for its most considerable vegetative development. Total water consumption revealed significantly different values among the three treatments: T-2 showed the highest values, T-3 the intermediate ones, and T-1 the lowest ones. The calculated values of WUE, therefore, showed the highest values in T-2, and the lowest ones in T-3.

4. Discussion

The adoption of different soilless cultivation systems significantly affected the growth (including flowering, fresh weight, and dry weight) and the commercial characteristics (number of inflorescences per plant, number of flower per inflorescence, number of branches per plant, and number of leaves) of geranium grown in a greenhouse, in Northern Italy. As also reported by Rouphael and Colla [20], the optimal concentration of fertilizer solutions for greenhouse crops may be affected by irrigation method, because it influences the accumulation of nutrients in the growing medium, which in turn affects the nutrient uptake by plants. For example, Cardarelli [21] reported that, when averaged over NS concentration, the number of geranium flowers per plant was significantly (27%) higher with sub-irrigation than with drip-irrigation.
The growth of rooted cuttings of geranium continues until full bloom, when they are ready for sale. Given the characteristics of the market in the area where the trial was conducted, where farmers generally supply local retailers, a gradual flowering could help producers. However, T-1 and T-2 showed no differences (Figure 4), displaying both a 14-day flowering window (from 23 May to 5 June). T-3, on the other hand, showed a much more scalar flowering (20 days, from 17 May to 5 June) and earlier than T-1 and T-2 (Figure 4). Despite this, T-3 did not develop adequate commercial characteristics for the market. Furthermore, some of the rooted cuttings of T-3 treatments highlighted a delayed growth demonstrating stress conditions, which may have caused the observed flowering pattern. In fact, according to Riga [22], stress conditions in geranium can influence the flowering timing, anticipating the opening of the flowers.
The application of different cultivation systems, to which three different fertigation managements are associated, significantly affected all the plant commercial features. T-2 showed the highest number of inflorescences (13.67 inflorescences plant−1), followed by T-1 and T-3, where 10.63 and 6.00 inflorescences plant−1 were observed, respectively (Table 1). T-2 showed significant differences from both T-1 and T-3, and T-1 from T-3. T-2 also showed the highest number of flowers per inflorescence (143.11 flowers inflorescence−1), followed by T-1 and T-3, where values of 96.33 and 64.67 flowers inflorescence−1 were observed, respectively. No significant differences were observed by comparing T-1 and T-3 (Table 1). Regarding the vegetative behavior (number of fully grown leaves at the end of the experiment, number of branches plant−1, and final height of plants), as well as considered commercial characteristics, T-2 always showed the highest values, demonstrating a better efficiency of this treatment, as also confirmed by fresh and dry weight results (Figure 6a,b). Overall, T-1 and T-2 developed adequate leaf mass for marketing, whereas T-3 showed insufficient development. Cardarelli [21], reported that the net assimilation of CO2 of geranium was significantly affected by the irrigation systems with the highest values recorded with the drip-irrigation. The mean value of the number of fully-grown leaves (Figure 4d), at the end of the experiment, was 12.10 in T-2, followed by 8.33 in T-1 and 4.33 in T-3. Concerning the number of branches plant−1, T-2 developed 8.33 branches plant−1, followed by T-1 and T-3, where 5.33 and 2.78 branches plant−1 were observed, respectively (Table 1). T-2 showed significant differences from both T-1 and T-3, and T-1 from T-3. The final height of plants was 15.13 cm in T-2, followed by T-1 with a value of 11.66 cm and T-3 with a value of 9.41 cm. T-2 showed significant differences from both T-1 and T-3, and T-1 from T-3. Moreover, regarding the growth trend, as reported in Figure 5, it is possible to see that, only two weeks after transplanting, treatment significantly modified the rate of growth until the final assessment. During the first two weeks, plants had a similar trend due to low temperatures registered, which strongly depressed growth.
Regarding the SPAD values, T-1 had the lowest values (47.16) and differed from both T-2 and T-3, with values of 54.88 and 65.63, respectively, which in turn were significantly different (Table 2) [23]. These behaviors reflected management of fertilization: in fact, when only three fertilizer supplies were provided (T-1), the lowest values were recorded, while, for other treatments (T-2 and T-3), in which the concentration of nutrient (nitrogen in particular) was constantly kept, SPAD values were always high. T-3 presumably had too elevated SPAD values, confirmed by the worst performances, while T-2 reached good SPAD levels, suggested to have more equilibrated leaf greenness [23]. Previously, in geranium, SPAD values were linearly correlated with total chlorophyll in fresh tissue. For example, in geranium “Ringo Deep Scarlet”, there the following correlation was observe: SPAD = 14.96 + 37.30 *chlorophyll content (mg·g−1 of dried tissue), r2 = 0.95 and p < 0.001 [24]. In this experiment, the high SPAD values of T-2 and T-3 are attributable to the high nutrient concentration of NS provided. This is confirmed by EC values of leaching fraction, always showing higher values compared to EC of NS applied. EC values of leaching fraction fluctuated between 2171 and 3923 µS·cm−1. The fact that the percentage of leaching fraction has always been sufficient (around 30%) [25] and that no particularly high temperatures were experienced during the experiment may have resulted in the use of a too concentrated NS, thus suggesting that the use of a less concentrated NS should be recommended. This was also confirmed by the fact that, during the first week, when a lower concentration of the NS was used, the EC of the leaching fraction did not increase as compared to the EC of NS supplied.
The visual assessment (aesthetic-commercial assessment) confirmed that the rooted cuttings of T-2 reached the best score, except for vegetative growth, and developed the best characteristics for the market (Table 4). Only one rooted cutting of T-2 treatment scored 2, and therefore was considered unmarketable because of an excessive asymmetry of the shape of the canopy. In T-3 treatments, 50% of the plants reached a MV score below 3, mainly since they showed a reduced growth. All of these plants also showed roots darkening. In particular, seven plants scored below 3 in one of the three parameters, six plants in two parameters, and two plants in all parameters. The roots darkening and the stunted growth could be due to the reuse of the non-sterilized leaching fraction, favoring the spread of root pathogens to the whole system. Indeed, spreading of root-borne diseases may occur, thus sterilization of the solution must be provided to avoid pathogens outbreak [9].
The application of different cultivation systems, each featuring a different fertigation management, also affected both water consumption and WUE (Table 5). Water consumption was highest in T-2 (10.11 L·plant−1), followed by T-3 and T-1 with 8.68 and 7.50 L·plant−1, respectively. T-2 showed significant differences from both T-1 and T-3, and T-1 from T-3. Despite these results, T-2 showed the highest value of WUE (21.85 g·L−1), followed by T-1 and T-3 with 17.63 and 13.07 g·L−1, respectively. No significant differences were observed by comparing T-2 and T-1 (Table 5). It should be considered, however, that, when converting the T-2 treatment into a closed system, the values could significantly improve [26,27,28]. In this case, the consumption of the NS could be lower (thanks to recycling of the drained solution), if compared with the other two treatments [28].
However, it is important to underline that in this scenario (closed system) the changing relationships between the nutrients in the drained solution need to be carefully considered, since they constitute an aspect that could influence the development of the rooted cuttings. Closed systems show a better water use efficiency, despite a slightly lower yield due to salt build-up in the root zone as a consequence of degradation of NS quality compared to the open systems [5,11,12,13,14,15,16]. In some cases, according to Savvas et al. [9], “switching over to closed cultivation systems does not seem to restrict crop yield or product quality”. Given that in the context considered the farms often integrate their income with other crops, the drained fraction can also be used in open-air crops [29].

5. Conclusions

The experiment shows that the adoption of simplified soilless technology may allow enhancing the commercial characteristics of geranium, making it more attractive for the market and ultimately improving water and nutrient management. In particular, the adoption of a cultivation system with continuous fertigation on the substrate (peat) with drip irrigation can enable to obtain more attractive plants for the market. Moreover, this strategy improves water use efficiency, which could also be further improved with the adoption of a closed system. Modernization in the cultivation system and fertigation management may help to improve the commercial features of geranium even without using high technologies currently still not economically sustainable for most of the often family-run farms operating in the cut flowers and pot ornamentals sector in Trento province.

Author Contributions

Conceptualization, L.B. and F.Z.; methodology, L.B.; validation, L.B., F.Z., D.P., N.M. and F.O.; formal analysis, L.B. and D.P.; investigation, L.B. and F.Z.; resources, L.B. and F.Z.; data curation, L.B., F.Z., and D.P.; writing—original draft preparation, L.B.; writing—review and editing, D.P., N.M., F.O., and G.G.; visualization, L.B., D.P., N.M., F.O., and G.G.; supervision, D.P., N.M., F.O., and G.G.; project administration, L.B.; and funding acquisition, L.B. and F.Z. All authors have read and agreed to the published version of the manuscript.

Funding

This research received no external funding.

Acknowledgments

We thank the Zamboni Stefano farm located in Vigolo Vattaro (Northern Italy) for providing the infrastructure and equipment to carry out the experiments. We also thank Maria Vender for her contribution to the revision of the English version of the article.

Conflicts of Interest

The authors declare no conflict of interest.

References

  1. Size, E.O.M. Share & Trends Analysis Report by Application (Cleaning & Home, Medical, Food & Beverages, Spa & Relaxation), By Product, By Sales Channel, And Segment Forecasts, 2019–2025. In Market Analysis Report; Grand View Research: San Francisco, CA, USA, 2020; 978-1. [Google Scholar]
  2. MiPAAF. Available online: https://www.politicheagricole.it/flex/cm/pages/ServeBLOB.php/L/IT/IDPagina/10906 (accessed on 9 February 2017).
  3. Pardossi, A.; Incrocci, L.; Incrocci, G.; Tognoni, F. What limits and how to improve water use efficiency in outdoor container cultivation of ornamental nursery stocks. Acta Hortic. 2009, 843, 73–80. [Google Scholar] [CrossRef]
  4. Pardossi, A.; Marzialetti, P. La concimazione delle piante in contenitore. In Uso Razionale delle Risorse nel Forovivaismo: L’acqua; ARSIA: Florence, Italy, 2004; pp. 183–192. [Google Scholar]
  5. Pardossi, A.; Tognoni, F.; Incrocci, L. Mediterranean greenhouse technology. Chron. Hortic. 2004, 44, 28–34. [Google Scholar]
  6. Meric, M.K.; Tuzel, I.H.; Tuzel, Y.; Oztekin, G.B. Effects of nutrition system and irrigation programs on tomato in soilless culture. Agric. Water Manag. 2011, 99, 19–25. [Google Scholar] [CrossRef]
  7. Fernández, J.A.; Orsini, F.; Baeza, E.; Oztekin, G.B.; Muñoz, P.; Contreras, J.; Montero, J.I. Current trends in protected cultivation in Mediterranean climates. Eur. J. Hortic. Sci. 2018, 83, 294–305. [Google Scholar] [CrossRef]
  8. Van Os, E.A.; Gieling, T.H.; Lieth, J.H. Technical equipment in soilless production systems. In Soilless Culture: Theory and Practice; Raviv, M., Lieth, J.H., Eds.; Elsevier Publications: London, UK, 2008; pp. 157–207. [Google Scholar]
  9. Savvas, D.; Gianquinto, G.; Tüzel, Y.; Gruda, N. Soilless culture. In Good Agricultural Practices Principles for Greenhouse Vegetable Production in the Mediterranean Region; FAO Paper, AGP series n° 217; FAO: Rome, Italy, 2013; pp. 303–354. [Google Scholar]
  10. Incrocci, L.; Leonardi, C.I. Sistemi di coltivazione fuori suolo a ciclo chiuso. In Proceedings of the La produzione in Serra dopo l’Era del Bromuro di Metile International Workshop, Comiso, Italy, 1–3 April 2004. [Google Scholar]
  11. Hardgrave, M.R. Recirculation system for greenhouse vegetables. Acta Hortic. 1993, 342, 85–92. [Google Scholar] [CrossRef]
  12. Van Os, E.A. Closed growing system for more efficient and environmental friendly production. Acta Hortic. 1994, 361, 194–200. [Google Scholar] [CrossRef]
  13. Böhme, M. Influence of Closed Systems on the Development of Cucumber. Proceedings of the ISOSC Proceedings, Berlin, Germany, January 1996. pp. 75–87. Available online: https://www.library.wur.nl/WebQuery/titel/898177 (accessed on 20 September 2020).
  14. Tüzel, I.H.; Tüzel, Y.; Gül, A.; Meric, M.K.; Yavuz, Ö.; Eltez, R.Z. Comparison of open and closed systems on yield, water and nutrient consumption and their environmental impact. Acta Hortic. 2000, 554, 221–228. [Google Scholar] [CrossRef]
  15. Giuffrida, F.; Lipari, V.; Leonardi, C. A simplified management of closed soilless cultivation systems. Acta Hortic. 2003, 614, 155–160. [Google Scholar] [CrossRef]
  16. Lopez, J.; Perez, J.S.; Trejo, S.L.; Urrestarazu, M. Mineral nutrition and productivity of hydroponically grown tomatoes in relation to nutrient solution recycling. Acta Hortic. 2003, 609, 219–223. [Google Scholar] [CrossRef]
  17. Malorgio, F. Le colture fuori suolo per le produzioni floricole in serra. In Uso Razionale Delle Risorse nel Florovivaismo: L’acqua; ARSIA: Florence, Italy, 2004; pp. 49–57. [Google Scholar]
  18. Wortman, S.E. Crop physiological response to nutrient solution electrical conductivity and pH in an ebb-and-flow hydroponic system. Sci. Hortic. 2015, 194, 34–42. [Google Scholar] [CrossRef]
  19. Eccel, E.; Cordano, E. Progetto Indiclima: Elaborazione di indici climatici per il Trentino: Relazione finale. 2015. Fondazione Edmind Mach, San Michele all’Adige, Italy. Available online: http://www.hdl.handle.net/10449/34308 (accessed on 19 September 2020).
  20. Rouphael, Y.; Colla, G. The influence of drip-irrigation or subirrigation on zucchini squash grown in closed-loop substrate culture with high and low nutrient solution concentrations. HortScience. 2009, 44, 306–311. [Google Scholar] [CrossRef] [Green Version]
  21. Cardarelli, M.; Rouphael, Y.; Salerno, A.; Rea, E.; Colla, G. Fertilizer concentration and irrigation method affects growth and flowering of two bedding plants. Acta Hortic. 2012, 937, 689–696. [Google Scholar] [CrossRef]
  22. Riga, P. Avoiding the use of plant growth regulator in geranium production by application of a cyclic deficit irrigation strategy. JAH 2012, 14, 7–12. [Google Scholar] [CrossRef]
  23. Wang, Y.; Dunn, B.L.; Arnall, D.B.; Mao, P. Use of an active canopy sensor and SPAD chlorophyll meter to quantify geranium nitrogen satus. HortScience. 2012, 47, 45–50. [Google Scholar] [CrossRef] [Green Version]
  24. Smith, B.R.; Fisher, P.R.; Argo, W.R. Water-soluble fertilizer concentration and pH of a peat-based medium affect growth, nutrient uptake, and chlorosis of container-grown seed geraniums (Pelargonium x hortorum L.H.Bail). J. Plant. Nutr. 2004, 27, 497–524. [Google Scholar] [CrossRef]
  25. Enzo, M.; Gianquinto, G.; Lazzarin, R.; Pimpini, F.; Sambo, P. Principi Tecnico-Agronomici Della Fertirrigazione e del Fuori Suolo; Veneto Agricoltura, ARSAFA: Legnaro (PD), Italy, 2001; pp. 160–181. [Google Scholar]
  26. Voogt, W.; Sonneveld, C. Nutrient management in closed growing system for greenhouse production. In Plant Production in Closed Ecosystems; Goto, E., Kurata, K., Hayashi, M., Sase, S., Eds.; Kluwer Academic Publishers: Dordrecht, The Netherlands, 1997; pp. 83–102. [Google Scholar]
  27. Van Os, E.A. Closed soilless growing systems: A sustainable solution for Dutch greenhouse horticulture. Water Sci. Technol. 1999, 39, 105–112. [Google Scholar] [CrossRef]
  28. Rouphael, Y.; Colla, G.; Battistelli, A.; Moscatello, S.; Rea, E. Yield, water requirement, nutrient uptake and fruit quality of zucchini squash grown in soil and soilless culture. J. Hort. Sci. Biotech. 2004, 79, 423–430. [Google Scholar] [CrossRef]
  29. Van Os, E.A.; Ruijs, M.N.A.; van Weel, P.A. Closed business system for less pollution from greenhouses. Acta Hortic. 1991, 294, 49–57. [Google Scholar] [CrossRef]
Figure 1. T1, farm system with substrate. Schematic representation of the growing system used.
Agronomy 10 01430 g001
Figure 2. T-2, open-cycle drip system with substrate. Schematic representation of the growing system used.
Agronomy 10 01430 g002
Figure 3. T-3, Nutrient Film Technique system. Schematic representation of the growing system used.
Agronomy 10 01430 g003
Figure 4. Effect of growing systems on Pelargonium zonale: (a) plants with inflorescences just visible; (b) plants at flowering start phase; (c) plants at full flowering phase; and (d) leaf number. T-1, farm system with substrate; T-2, open-cycle drip system with substrate; T-3, Nutrient Film Technique; DAT, Days After Transplanting.
Agronomy 10 01430 g004
Figure 5. Height of Pelargonium zonale plant during growing period in response to the growing system used. Mean values ± standard error. T-1, farm system with substrate; T-2, open-cycle drip system with substrate; T-3, Nutrient Film Technique.
Agronomy 10 01430 g005
Figure 6. Effect of growing system used on Pelargonium zonale. (a) Plan fresh weight (g plant−1) in relation to growing system and relative partitioning into different organs. Means values ± standard error for total biomass. (b) Plan dry weight (g plant−1) in relation to growing system and relative partitioning into different organs. Mean values ± standard error for total biomass. T-1, farm system with substrate; T-2, open-cycle drip system with substrate; T-3, Nutrient Film Technique.
Agronomy 10 01430 g006
Table 1. Mean Pelargonium zonale biometrical responses to growing systems. Within-columns mean values followed by different letters are significantly different by Tukey test.
TreatmentInflorescences
(n·Plant−1)
Flowers
(n·Inflorescence−1)
Branches
(n·Plant−1)
Plant Height (cm)
T-110.63 b96.33 b5.33 b11.66 b
T-213.67 a143.11 a8.33 a15.13 a
T-36.00 c64.67 b2.78 c9.41 c
Mean************
With significance (***) for p ≤ 0.001. T-1, farm system with substrate; T-2, open-cycle drip system with substrate; T-3, Nutrient Film Technique.
Table 2. SPAD values of Pelargonium zonale in response to the growing system used. Within-columns mean values followed by different letters are significantly different by Tukey test.
TreatmentSPAD Value
T-147.16 c
T-254.88 b
T-365.63 a
Mean***
With significance at p ≤ 0.001 (***). T-1, farm system with substrate; T-2, open-cycle drip system with substrate; T-3, Nutrient Film Technique.
Table 3. Water contents (%) of Pelargonium zonale organs in response to the growing system used. Within-columns mean values followed by different letters are significantly different by Tukey test.
TreatmentLeaves (%)Flowers (%)Branches (%)Roots (%)
T-188.28 b86.90 b84.76 b87.55 b
T-289.06 ab87.76 a89.46 a87.93 b
T-389.68 a87.58 ab89.26 a93.22 a
Mean**********
n.s., not significant; * significance for p ≤ 0.050 and p ≥ 0.010; *** significance for p < 0.001. T-1, farm system with substrate; T-2, open-cycle drip system with substrate; T-3, Nutrient Film Technique.
Table 4. Aesthetic-commercial assessment of Pelargonium zonale in response to the growing system used. Within-columns mean values followed by different letters are significantly different by Tukey test.
TreatmentMVVegetative GrowthFoliage CompactnessGeneral Aspect
T-14.02 a4.17 a3.80 b4.10 a
T-24.27 a4.13 a4.53 a4.13 a
T-33.30 b2.98 b3.67 b3.28 b
Mean************
With significance for p < 0.001 (***). MV is the arithmetic mean among vegetative growth, foliage compactness, and general aspect values. T-1, farm system with substrate; T-2, open-cycle drip system with substrate; T-3, Nutrient Film Technique.
Table 5. Total biomass (fresh weight), total water consumption and WUE of Pelargonium zonale in response to the growing system used. Within-columns mean values followed by different letters are significantly different by Tukey test.
TreatmentPlant FW (g·Plant−1)TWC (L·Plant−1)WUE (g·FW·L−1·H2O)
T-1132.22 b7.50 c17.63 a
T-2220.95 a10.11 a21.85 a
T-3113.34 b8.68 b13.07 b
Mean*********
With significance for p < 0.001 (***). T-1, farm system with substrate; T-2, open-cycle drip system with substrate; T-3, Nutrient Film Technique; FW, Fresh Weight; TWC, Total Water Consumption; WUE, Water Use Efficiency.

