Illustration: Youssef Khalil
1. Beijing
Population: 21.5 million
GDP per capita: US$23,800
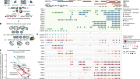
Share 2019: 2,846.4
Change in adjusted Share 2015–19: +40.8%
Count 2019: 6,018

Sources: Nature Index, opendatanetwork.com, sina.com, Wikipedia. Data analysis: Bo Wu. Infographic: Tanner Maxwell.
Despite substantial progress towards clearing them, Beijing’s notoriously polluted skies remain one of its biggest public policy and scientific challenges. Between 2005 and 2018 the city’s reliance on coal burned for power fell from 30 million tonnes to only 4 million tonnes. Beijing’s largest source of energy is now solar, contributing more than 30% in 2017. Beijing is home to the Chinese Academy of Sciences, which leads the index in Share, including in the Earth and environmental sciences.

Illustration: Youssef Khalil
2. New York
Population: 20.3 million
GDP per capita: US$71,000
Share 2019: 2,066.4
Change in adjusted Share 2015–19: −10.3%
Count 2019: 4,894

Sources: Nature Index, opendatanetwork.com, sina.com, Wikipedia. Data analysis: Bo Wu. Infographic: Tanner Maxwell.
The New York metropolitan area, home to more than 5.5 million foreign-born residents, is a global winner in the competition to attract and retain human capital, a key factor in its number one ranking for competitiveness by Kearney. However the city’s top position is threatened by negative trends in liveability, foreign direct investment, entrepreneurship, private investment and a general decline in doing business. The New York metropolitan area’s top institution in the Nature Index, Yale University in New Haven, Connecticut, ranks 9th globally in the life sciences.

Illustration: Youssef Khalil
3. Boston
Population: 4.9 million
GDP per capita: US$78,500
Share 2019: 1,909.8
Change in adjusted Share 2015–19: −5.5%
Count 2019: 4,325

Sources: Nature Index, opendatanetwork.com, sina.com, Wikipedia. Data analysis: Bo Wu. Infographic: Tanner Maxwell.
Boston’s strategy for innovation districts focuses on mixed-use areas that geographically integrate academic institutions, start-up incubators and mass transit. The Boston Waterfront Innovation District, established in 2010, revitalized roughly 4 square kilometres of industrial facilities, boasting more than 200 new companies and 4,000 new jobs within three years. In nearby Cambridge, the Massachusetts Institute of Technology (MIT), ranked 6th in the index, anchors Kendall Square, which according to MIT, is home to the greatest concentration of biotechnology companies in the world.

Illustration: Youssef Khalil
4. San Francisco-San Jose
Population: 8.7 million
GDP per capita: US$131,000
Share 2019: 1,692.5
Change in adjusted Share 2015–19: −10.7%
Count 2019: 3,979

Sources: Nature Index, opendatanetwork.com, sina.com, Wikipedia. Data analysis: Bo Wu. Infographic: Tanner Maxwell.
San Francisco, home to Silicon Valley, brought the world integrated circuits, synthetic insulin and mail-order genetic tests, among other innovations. Highly rated by its citizens for job creation, cultural activities and citizen engagement, the downsides of its success in high- technology industries include income inequality and a lack of affordable housing. Stanford University ranks 5th globally for Share in the Nature Index and 1st in the city across all four natural sciences fields, while Alphabet, Google’s parent company, had the area’s fastest rising adjusted Share 2015–19.

Illustration: Youssef Khalil
5. Shanghai
Population: 24.2 million
GDP per capita: US$22,800
Share 2019: 1,480.5
Change in adjusted Share 2015–19: +38.6%
Count 2019: 3,227

Sources: Nature Index, opendatanetwork.com, sina.com, Wikipedia. Data analysis: Bo Wu. Infographic: Tanner Maxwell.
Of the top 10 cities in the 2019 Global Power Cities Index ranking from Japan’s Mori Memorial Foundation, 5 are in the US, while Tokyo is the highest ranked in Asia. Shanghai, at 18th, is 7th in Asia , also preceded by Seoul (5th), Hong Kong (10th), Singapore (11th), Beijing (13th), and Osaka (17th). The Shanghai municipal government announced in 2017 that it would seek to attract foreign R&D centres by providing policy and financial support, simplified exit and entry procedures and customs clearance. In 2017, Shanghai boasted 416 foreign R&D centres, one-quarter of the total in China.

Sources: Nature Index, opendatanetwork.com, sina.com, Wikipedia. Data analysis: Bo Wu. Infographic: Tanner Maxwell.
 The top cities for research in the Nature Index
 Beijing, the seat of science capital
 New York and Boston maintain their lead
 Science cities seek new connections