
Abstract
In this paper, we have proposed a hybrid bio-inspired algorithm which takes the merits of whale optimization algorithm (WOA) and adaptive particle swarm optimization (APSO). The proposed algorithm is referred as the hybrid WOA_APSO algorithm. We utilize a convolutional neural network (CNN) for classification purposes. Extensive experiments are performed to evaluate the performance of the proposed model. Here, pre-processing and segmentation are performed on 120 lung CT images for obtaining the segmented tumored and non-tumored region nodule. The statistical, texture, geometrical and structural features are extracted from the processed image using different techniques. The optimized feature selection plays a crucial role in determining the accuracy of the classification algorithm. The novel variant of whale optimization algorithm and adaptive particle swarm optimization, hybrid bio-inspired WOA_APSO, is proposed for selecting optimized features. The feature selection grouping is applied by embedding linear discriminant analysis which helps in determining the reduced dimensions of subsets. Twofold performance comparisons are done. First, we compare the performance against the different classification techniques such as support vector machine, artificial neural network (ANN) and CNN. Second, the computational cost of the hybrid WOA_APSO is compared with the standard WOA and APSO algorithms. The experimental result reveals that the proposed algorithm is capable of automatic lung tumor detection and it outperforms the other state-of-the-art methods on standard quality measures such as accuracy (97.18%), sensitivity (97%) and specificity (98.66%). The results reported in this paper are encouraging; hence, these results will motivate other researchers to explore more in this direction.
1 Introduction
According to WHO statistics, the estimated worldwide death of people from cancer is 9.6 million in 2018. However, it is observed that 30–50% of people can be prevented from cancer by providing preventive measures and treatment at an early stage of cancer. Lung cancer is also referred to as lung carcinoma characterized by uncontrollable cell growth in tissues which generally have been categorized as small cell and non-small cell carcinoma on the basis of cellular structure [1]. On the basis of tumor lymph node location and tumor size, there are four stages of lung cancer from I to IV [2, 3].
Computed tomography (CT) imaging is considered the finest way of analyzing and visualizing the abnormalities present due to less distortion [4]. Image pre-processing consisting of normalization and enhancement is usually performed to improve the quality of the image and reduce the distortion. There are different types of filters applied for image enhancement techniques in spatial and frequency domain [5]. The wiener filter minimizes the noise using a low pass filter and performs deconvolution using high pass filter (Inverse filtering) on lung CT image obtained from the Lung Image Database Consortium [6]. The segmentation is the most challenging task in medical imaging for appropriately extracting the features from the segmented tumor nodule region. There are various segmentation techniques [7] such as Watershed transform edge-based segmentation, Region-based segmentation [8] and Thresholding [9]. The global thresholding and morphological post-processing operation are performed for detecting the tumored region from surrounding and segmenting the lung region nodule. The different statistical features, textural features, shape and geometrical-based features are extracted from the segmented region [10]. The number of features is prominently more in neuroimaging, so the technique used for feature extraction is Gray-Level Co-occurrence Matrix (GLCM), Gray-Level Run-Length Matrix (GLRLM), Histogram features, Gray-Level Dependence Matrix (GLDM) and Local Binary Pattern (LBP) [11, 12]. These sets of extracted features provide significant information from medical imaging which helps in evaluating the pattern and decision-making process. To reduce the dimensional features space of different modalities of the image, the hybrid WOA_APSO feature selection algorithm is proposed, which removes the redundant features [13, 14]. The feature selection technique optimizes the selection of extracted features and provides more dominant information. The extracted feature selection is grouped using a linear discriminant algorithm [15,16,17,18] for selecting the more dependent and relevant features on class values to improve the performance of classification. The subset of the best feature is selected to reduce the dimensionality of problem space and to maximize the performance of the learning algorithm (Fig. 1).

i Tumored lung CT image ii Non-tumored lung CT image
Classification is the most critical aspect in determining the performance parameters, i.e., accuracy, sensitivity and specificity of the model that helps in the process of prognosis of lung cancer done by the experts. The comparative classification analysis is performed by considering techniques such as artificial neural network, support vector machine and convolutional neural network [19, 20]. Support vector machine uses the multiclass model learning technique to determine the prediction of medical imaging. The support vector machine (SVM) considers a linear function hypothetical space in higher dimension features which are instructed using a learning bias originated from statistical learning theory [21]. The artificial neural network represents a multilayer network consisting of three different layers with the backpropagation algorithm [22, 23]. Deep learning [24] is a promising field and provides enhanced performance in various medical imaging applications [24, 25]. The fully connected convolutional neural network consisting of a mesh connection of neurons comprises activation function and backpropagation for adjustment of weights [26, 27]. The presented state-of-art outperforms for the fully connected convolutional neural network in computer-aided diagnosis of lung cancer imaging by showing better performance.
1.1 Motivation and contributions
Metaheuristic hybridization is the recent trend in the field of optimization, achieved by combining one metaheuristic algorithm with a complementing metaheuristic algorithm. The novel variant of whale optimization algorithm and adaptive particle swarm optimization, hybrid bio-inspired WOA_APSO, is proposed for selecting optimized features. Hybrid WOA_APSO is implemented for the selection of the optimized features subset. The whale optimization algorithm is a recently developed metaheuristic algorithm with many good properties like few parameters, covers a broader area in the search space, and exploration of the search space is made efficient by using randomly selected search agents in place of the best search agent so far. Further, APSO uses additional adaptive parameters—adaptive factor fa and perturbation factor Ga to improve the convergence speed of the algorithm and to achieve a balance between exploitation and exploration of the search space [28,29,30,31,32]. Thus, WOA_APSO performs better than other common algorithms in terms of convergence speed and balancing between exploration and exploitation [28, 29, 33]. So, the hybridization of WOA and APSO is proposed and is explained in detail in the paper.
The key contribution of this paper is highlighted as follows:
-
Firstly, we propose an intelligent lung tumor segmentation algorithm for the detection of tumor and treatment of cancer patients.
-
Secondly, we show the hybridization of two metaheuristic algorithms, namely, whale optimization algorithm (WOA) and adaptive particle swarm optimization (APSO). The proposed algorithm is referred as the hybrid WOA_APSO algorithm. Hybrid WOA_APSO is implemented for the selection of the optimized features subset. Here, feature selection grouping is performed by embedding linear discriminant analysis. Our proposed model utilizes a CNN for classification purposes.
-
Thirdly, extensive computer simulations are performed to determine the effectiveness of the proposed model. We reported a twofold performance comparison. First, the performance of the proposed model is tested against different state-of-the-art classification techniques and evaluated accuracy, sensitivity and specificity. Secondly, the performance of the proposed algorithm is compared with the standard WOA and APSO algorithms based on the computational cost of convergence to the optimal results.
1.2 Organization
The remainder of the paper is organized as follows: Sect. 2 presents the related work; the proposed model is comprehensively discussed in Sect. 3; Sect. 4 represents the experimental results and computational performance measures; the conclusion and future avenue of the proposed work is given in Sect. 5.
2 Related work
Cancer is the deadly disease worldwide whose detection at an early stage provides preventive measures and treatment to increase the survival rate of patients. The research in medical imaging is growing rapidly to recognize the pattern of disease showing the development of computationally intelligent systems. Data visualization for medical image analysis is one of the most promising fields in the development of a robust expert system using artificial intelligence [34, 35], computer vision [36] and pattern recognition application [37,38,39]. The computer-aided medical diagnosis is the most challenging task in the interpretation of the decision-making process by a radiologist for extracting the abnormalities in the image [40, 41]. The related research work and findings are presented in this section.
Uzelaltinbulat et al. [42] presented a lung tumor segmentation technique using Otsu thresholding and morphological operations. Kumar et al. [43] proposed a hybrid of the 2D Otsu method and modified artificial bee colony method for the segmentation of the lung CT image. The performance is computed by evaluating the correlation values. Joon et al. [44] showed the segmentation of cancerous and non-cancerous lung region nodule using k-mean clustering and fuzzy c-mean technique. The structural and texture extracted features are used in the classification performed by the support vector machine. Prabukumar et al. [45] proposed a hybrid segmentation technique comprising Fuzzy C-means (FCM) and region growing algorithm to segment the nodule. The statistical, texture and geometrical features are extracted from the segmented nodule, and the optimized features are selected using a cuckoo search algorithm. The optimal features are considered for evaluating the classification using a support vector machine while obtaining the overall accuracy of 98.5%. Mittal et al. [46] proposed a methodology for multilevel image thresholding for segmentation and introduced the exponential kbest gravitational search technique.
Shankar et al. [47] stated a methodology for Alzheimer detection in which various features are extracted using gray-level run-length matrix, histogram features, gray-level occurrence matrix, the local binary pattern features and scale-invariant transform. The feature selection is performed using the gray wolf optimization algorithm to attain the optimized features for performing the classification. The convolutional neural network classification technique is used to achieve the accuracy, sensitivity and specificity as 96.23%, 94% and 96%. Vijh et al. [48] proposed an approach for developing the computer-aided lung tumor segmentation system. The whale optimization algorithm is used for feature selection and support vector machine for classification. The performance of methodology is compared using different SVM kernels. However, the RBF support vector kernel provided the accuracy, sensitivity and specificity of 95%, 100% and 92%.
Reddy et al. [49] presented algorithm consists of parallel thresholding, feature extraction and fuzzy neural network for identifying the lung tumor on CT imaging evaluating the accuracy of 96.5%. Zhang et al. [50] stated a novel approach for computer-aided diagnosis for lung tumor detection by implementing a multiscale mask region-based convolutional neural network on PET imaging. The performance computed by estimating recall, precision and F-value as 1, 0.90 and 0.95. Uçar et al. [51] presented the methodology for automatic detection of lung nodules using deep learning convolutional neural network architecture with Laplacian of gaussian filter model obtaining the accuracy of 72.97%. Naqi et al. [52] proposed a novel hybrid approach consisting of 3D neighborhood connectivity, active contour model (ACM) and geometric properties for 3D nodule candidate detection. The comparative analysis of classification is performed using Naïve Bayes, KNN, SVM and AdaBoost to evaluate the model effectiveness. Table 1 presents a summary of the existing works.
3 Proposed methodology
This section sheds light on the proposed methodology. The simulated phases implemented in the proposed methodology of computer-aided automatic diagnosis system for the detection of lung tumor as shown in Fig. 2 are (1) Image Acquisition and Normalization, (2) Image pre-processing, (3) Image segmentation, (4) Mathematical morphological operations, (5) Feature extraction, (6) Feature selection with grouping and (7) Classification.

Flow process of proposed methodology
-
1.
120 samples of lung CT images are obtained from the NCI Lung Cancer Database Consortium [62]. After the acquisition of lung CT images, the normalization is performed on tumored and non-tumored CT images which are available in the cancer imaging archive.
-
2.
Image pre-processing is considered an important phase in clinical research application of neuroimaging for improving the quality. Image enhancement is achieved by applying a Wiener filter for denoising the image with a minimum mean square error. The Wiener filtering is the statistical approach for reducing the blurring and smoothing effect in the image. \( F\left[ n \right] \) represents the outcome of the Wiener filter as depicted in Eq. (1).
$$ F\left[ n \right] = \sum \limits_{k = 0}^{n} a_{k} w\left[ {n - i} \right] $$(1) -
3.
Image segmentation is the process of partitioning the image in multiple regions consisting of a different set of the pixel. The global thresholding technique is projected to partition the image depending upon the intensity of the gray-level pixels for threshold T. The segmented image acquired from global thresholding can be represented as H(x, y) and using Eq. (2). Here, \( t\left( {x,y} \right) \) is the pixel value of the image.
$$ H\left( {x, \, y} \right) \, = \left\{ {\begin{array}{*{20}c} 1 & {{\text{if}}\,\, t\left( {x,y} \right) > T} \\ 0 & {{\text{if}} \,\, t\left( {x,y} \right) \le T} \\ \end{array} } \right. $$(2) -
4.
Mathematical morphological operations are estimated by applying the certain structuring element at all possible location for smoothing the region of interest. The mathematical operations are performed where D is binary image and F is the structuring element as depicted in Eqs. (3), (4), (5) and (6), respectively.
$$ {\text{Erosion}}:D\,\,{ \ominus }\,\,F = \left\{ {A | \left( F \right)_{A} \,\, \subseteq \,\, D} \right\} $$(3)$$ {\text{Dilation}}: \, D \oplus F \, = \left\{ {A| \left( F \right)_{A} \,\, \cap\,\, D \ne \emptyset } \right\} $$(4)$$ {\text{Opening}}: D\,\, {\ominus}\,\, F = D\,\, {\ominus}\,\, F \oplus DF $$(5)$$ {\text{Closing}}: D\,\, {\ominus}\,\, F = D {\oplus} F {\oplus} F $$(6) -
5.
Feature extraction is the most important phase in obtaining the pattern information of the segmented nodule. In the proposed methodology, the total 60 different geometrical, statistical, texture and structure features are extracted from each segmented nodule. The techniques used for extraction are Gray-level co-occurrence matrix (GLCM), Gray-level run-length matrix (GLRLM), Histogram-oriented gradient features (HOG), Gray-level dependence matrix (GLDM) and Local binary pattern (LBP). GLCM is referred to as a second-order statistics method which considers the spatial relationship between a couple of pixels. GLRLM helps in obtaining higher-order statistical features consisting of a set of continuous pixels having similar gray levels [63]. GLDM extracts the features by computing a gray-level absolute difference method between two pixels separated by specific displacement [64]. Histogram-oriented gradient extracts feature by focusing on the structure of the image and uses the feature descriptor for counting the occurrence of gradient orientation in localized portion [65]. LBP considers the shaping-based LBP operator for the lung CT image which threshold the neighboring pixels based on the value of current pixels [66]. Table 2 shows the name of the features extracted from the segmented tumored and non-tumored lung images for the analysis.
Table 2 Extracted features -
6.
Nature inspired metaheuristic optimization algorithms mimic a physical or biological phenomenon for solving real-world optimization problems. The novel hybrid algorithm comprising whale optimization algorithm and adaptive particle swarm optimization (WOA_APSO) is proposed for the selection of the optimized dimension of features and for providing effective results.
-
6.1
Mathematical formulation of the hybrid WOA_APSO optimization algorithm
Initially, the hybrid of WOA_APSO algorithm begins with a random solution. However, search agents modify their position with respect to specific agent behavior. The objective function \( {\text{Fit}}_{\text{ob}} \) used for each iteration is outlined in Eq. (7) and also 2D Matlab plot is depicted in Fig. 3
$$ {\text{Fit}}_{\text{ob}} = E*\left( {1 + \beta } \right)/ {\text{RF}} $$(7)$$ {\text{RF}} = m/S $$(8)Fig. 3 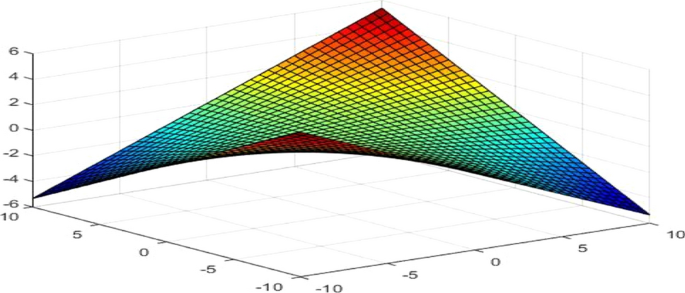
2D Matlab plot for F(x, y) = E * (1 + β)/RF

where E calculates the overall error, β is constant having value 0.5, m represents no of selected features, S is the no swarms. The parameters and the values used in hybrid bio-inspired algorithm are represented in Table 3.
The hunting functionality is performed with the help of the best search agent chasing the position of prey to encircle. This behavior can be mathematically represented using Eqs. (9) and (10), respectively.
L and P are the coefficient vectors, i is the latest ongoing iteration, \( \overrightarrow {Y } \) shows the position vector and \( Y^{*} \) represents the position vector of the best solution acquired. However, the coefficient vector is shown in Eqs. (11) and (12).
where b is linearly decreasing from 2 to 0 and r is random vector [0, 1].
The bubble net phase formulation for a spiral updating position to mimic the helix-shaped movement of humpback whales and prey is shown using Eq. (13).
The humpback whales revolve around the prey within a spiral-shaped and shrinking circle simultaneously. The prey updates their location by using Eqs. (14), (15) and (16).
Here, \( R_{\text{best}} \) represents the local best search
Here, fa represents Adaptive factor and \( G_{\text{best}} \) global best location
In the exploration phase, the coefficient vector P is used for searching the prey, and it can be shown through Eq. (17).

Time Complexity The proposed hybrid bio-inspired algorithm has two inner loops for population ‘n’ and one outer loop for iteration ‘t’ where n = 20 and t = 35. The extreme case complexity of hybrid WOA_APSO can be O(n2). However, when the population size is large, the time complexity of the algorithm can be represented as follows: T(n) = 2n + s + nlog(n)·t = O(nlog (n)·t).
-
6.2
Feature selection grouping is performed using linear discriminant analysis for reducing the dimensions and selecting the best-optimized subsets which enhance the classification performance effectively.
-
7.
Convolutional neural network is a deep learning classification technique for training and testing the learning network [67, 68]. The neural network comprises three densely connected layers consisting of activation function connecting one neuron to another neuron as depicted in Fig. 4. The backpropagation algorithm is used for updating the weights and deltas with a learning rate of 0.001. The testing is performed on different parameters to identify the best combination for determining the robustness of the experiment. The various parameter are as follows: Layer neurons: [5, 10] [10, 15], [15, 20]; Activation function: relu, softmax; Validation split: 0.1, 0.2, 0.3; Batch size: 1, 2, 3; Learning rate: 0.1, 0.01, 0.001; and Epochs: 10, 20, 40, 60, 80, 100, 200. Table 4 represents the parameters and values used for the CNN.
Fig. 4 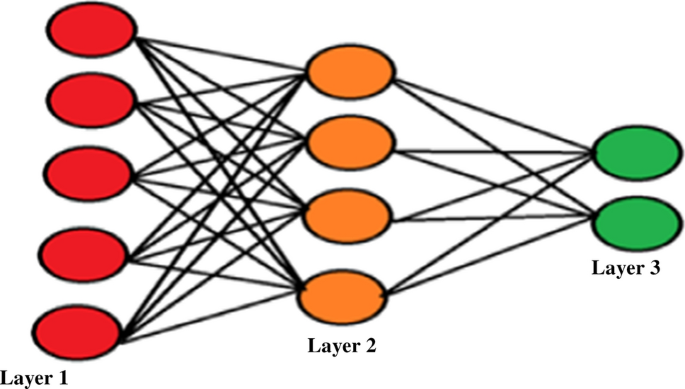
Fully connected convolutional neural network
Table 4 Parameter and values used in convolutional neural network

4 Experiment result and analysis
The 120 lung CT tumored and non-tumored images were acquired from the lung cancer database consortium for evaluation of experimental results. The optimized features that are taken as input for classification are segregated in 7:3 ratio for training and testing purpose.
The optimized threshold value achieved from the WOA_APSO algorithm is compared with the whale optimization algorithm (WOA) and adaptive particle swarm optimization (APSO). The achieved threshold value of WOA_APSO, WOA and APSO is 1.16, 2.09 and 1.9. So, the proposed bio-inspired hybrid WOA_APSO algorithm is giving precise informational optimized features subsets (Tables 5, 6).
The performance measures of intelligent lung tumor diagnosis systems are acquired by comparing the different classification algorithms. The evaluation analysis parameters used for determining the effectiveness of the model are accuracy, sensitivity and specificity shown in Eqs. (18), (19) and (20), respectively.
where TP depicts the total number of correctly segmented images of true positives which are classified properly, FN depicts a total number of correctly segmented images of true negatives which are not classified properly, FPR is the number of incorrect segmented images which are classified properly.
The time complexity of the proposed algorithm (Algorithm 1) is presented in Sect. 3. The computational time of the proposed algorithm against the standard WOA and APSO is reported in Table 7. Table 7 reveals that the proposed algorithm takes less time to converge as compared to the other two existing algorithms.
4.1 Result and discussion
Figure 1 shows the sample of considered CT tumored and non-tumored lung images taken from the cancer imaging archives. The segmented image result analysis of the proposed algorithm at each successive for efficient detection of the nodule is shown in Figs. 5 and 6, respectively. Table 5 contains the optimized and discriminant set of grouped features obtained by applying the proposed hybrid whale optimization algorithm and adaptive particle swarm optimization (WOA_APSO) grouped by applying linear discriminant analysis (LDA). The comparative performance analysis of different classification techniques is shown in Table 6. Figure 7 depicts that a convolutional neural network provides better accuracy, sensitivity and specificity in comparison to support vector machine and artificial neural network. The achieved accuracy, sensitivity and specificity are 97.18, 97 and 98.66.

The sample result analysis on lung tumored image for detection of nodule

The sample result analysis on lung non-tumored image for detection of nodule

Comparative performance analysis
5 Conclusion and future work
In this paper, we have presented a novel approach for early detection, diagnosis and prediction to improve the treatment of patients and take preventative measures. Here, we implemented a hybrid WOA_APSO algorithm (see Algorithm 1). Image pre-processing and segmentation technique is applied for partitioning and segmenting the tumor region. The different features are extracted to gather the statistics information analysis which assists in the decision-making process. The proposed state-of-art method provides a better consolidated optimized dimension of features selection grouping approach by implementing a hybrid WOA_APSO algorithm embedding LDA. The convolutional neural network classification technique outperforms by providing an accuracy of 97.5% in comparison to support vector machine and artificial neural network. The methodology demonstrates the effectiveness and promising results for clinical application as compared to existing algorithms. The proposed method limits the working for 3-dimensional medical imaging. In the future, the work can be extended by using different modalities of medical imaging, and other metaheuristic techniques can be incorporated for enhancing the system performance.
References
Sluimer I, Schilham A, Prokop M, Van Ginneken B (2006) Computer analysis of computed tomography scans of the lung: a survey. IEEE Trans Med Imaging 25(4):385–405
Sivakumar S, Chandrasekar C (2013) Lung nodule detection using fuzzy clustering and support vector machines. Int J Eng Technol 5(1):179–185
Dimililer K, Ever YK, Ugur B (2016) ILTDS intelligent lung tumor detection system on CT images. In: The international symposium on intelligent systems technologies and applications. Springer, Cham, pp 225–235
Makaju S, Prasad PWC, Alsadoon A, Singh AK, Elchouemi A (2018) Lung cancer detection using CT scan images. Procedia Comput Sci 125:107–114
Bari M, Ahmed A, Naveed S (2019) Lungs cancer detection using digital image processing techniques: a review. Mehran Univ Res J Eng Technol 38(2):351–360
Perumal S, Velmurugan T (2018) Preprocessing by contrast enhancement techniques for medical images. Int J Pure Appl Math 118(18):3681–3688
Srimani PK, Mahesh S (2013) A Comparative study of different segmentation techniques for brain tumour detection. Int J Emerg Technol Comput Appl Sci 2(4):192–197
Mesanovic N, Grgic M, Huseinagic H, Males M, Skejic E, Smajlovic M (2011) Automatic CT image segmentation of the lungs with region growing algorithm. In: 18th international conference on systems, signals and image processing-IWSSIP, pp 395–400
John J, Mini MG (2016) Multilevel thresholding based segmentation and feature extraction for pulmonary nodule detection. Procedia Technol 24:957–963
Novitasari DCR, Lubab A, Sawiji A, Asyhar AH (2019) Application of feature extraction for breast cancer using one order statistic, GLCM, GLRLM, and GLDM. Adv Sci Technol Eng Syst J 4(4):115–120
Bala R (2017) Survey on texture feature extraction methods. Int J Eng Sci 3:10375
Zu C, Wang Y, Zhou L, Wang L, Zhang D (2018) Multi-modality feature selection with adaptive similarity learning for classification of Alzheimer’s disease. In: 2018 IEEE 15th international symposium on biomedical imaging (ISBI 2018). IEEE, pp 1542–1545
Mirjalili S, Lewis A (2016) The whale optimization algorithm. Adv Eng Softw 95:51–67
Zhan ZH, Zhang J, Li Y, Chung HSH (2009) Adaptive particle swarm optimization. IEEE Trans Syst Man Cybern Part B (Cybern) 39(6):1362–1381
Sharma A, Paliwal KK, Imoto S, Miyano S (2014) A feature selection method using improved regularized linear discriminant analysis. Mach Vis Appl 25(3):775–786
Balakrishnama S, Ganapathiraju A (1998) Linear discriminant analysis-a brief tutorial. Inst Signal Inf Process 18:1–8
Anter AM, Hassenian AE (2018) Normalized multiple features fusion based on PCA and multiple classifiers voting in CT liver tumor recognition. In: Hassanien AE, Oliva DA (eds) Advances in soft computing and machine learning in image processing. Springer, Cham, pp 113–129
Vijh S, Gaur D (2017) Secured biometric template matching by using linear discriminant analysis. In: International conference on health information science. Springer, Cham, pp 194–203
De Bruijne M (2016) Machine learning approaches in medical image analysis: from detection to diagnosis. Elsevier, Amsterdam
Jindal A, Aujla GS, Kumar N, Chaudhary R, Obaidat MS, You I (2018) SeDaTiVe: SDN-enabled deep learning architecture for network traffic control in vehicular cyber-physical systems. IEEE Netw 32(6):66–73
Nalepa J, Kawulok M (2019) Selecting training sets for support vector machines: a review. Artif Intell Rev 52(2):857–900
Bertolaccini L, Solli P, Pardolesi A, Pasini A (2017) An overview of the use of artificial neural networks in lung cancer research. J Thorac Dis 9(4):924
Ganesan N, Venkatesh K, Rama MA, Palani AM (2010) Application of neural networks in diagnosing cancer disease using demographic data. Int J Comput Appl 1(26):76–85
Singh A, Aujla GS, Garg S, Kaddoum G, Singh G (2019) Deep learning-based SDN model for internet of things: an incremental tensor train approach. IEEE Internet Things J 7(7):6302–6311
Shen D, Wu G, Suk HI (2017) Deep learning in medical image analysis. Annu Rev Biomed Eng 19:221–248
Suzuki K (2017) Overview of deep learning in medical imaging. Radiol Phys Technol 10(3):257–273
Anwar SM, Majid M, Qayyum A, Awais M, Alnowami M, Khan MK (2018) Medical image analysis using convolutional neural networks: a review. J Med Syst 42(11):226
Pandey HM, Chaudhary A, Mehrotra D (2014) A comparative review of approaches to prevent premature convergence in GA. Appl Soft Comput 24:1047–1077
Pandey HM, Chaudhary A, Mehrotra D (2016) Grammar induction using bit masking oriented genetic algorithm and comparative analysis. Appl Soft Comput 38:453–468
Pandey H (2017) Performance review of harmony search, differential evolution and particle swarm optimization. In: IOP conference series: materials science and engineering, vol 225. IOP Publishing
Pandey HM (2016) Performance evaluation of selection methods of genetic algorithm and network security concerns. Phys Procedia 78:13–18
Dhiman G, Soni M, Pandey HM et al (2020) A novel hybrid hypervolume indicator and reference vector adaptation strategies based evolutionary algorithm for many-objective optimization. Eng Comput. https://doi.org/10.1007/s00366-020-00986-0
Pandey HM (2020) Secure medical data transmission using a fusion of bit mask oriented genetic algorithm, encryption and steganography. Future Gener Comput Syst 111:213–225
Jindal A, Aujla GS, Kumar N, Prodan R, Obaidat MS (2018) DRUMS: demand response management in a smart city using deep learning and SVR. In: 2018 IEEE global communications conference (GLOBECOM). IEEE, pp 1–6
Gulati A, Aujla GS, Chaudhary R, Kumar N, Obaidat MS (2018) Deep learning-based content centric data dissemination scheme for Internet of Vehicles. In: 2018 IEEE international conference on communications (ICC). IEEE, pp 1–6
Aujla GS, Jindal A, Chaudhary R, Kumar N, Vashist S, Sharma N, Obaidat MS (2019) DLRS: deep learning-based recommender system for smart healthcare ecosystem. In; ICC 2019–2019 IEEE international conference on communications (ICC). IEEE, pp 1–6
Teramoto A, Fujita H, Yamamuro O, Tamaki T (2016) Automated detection of pulmonary nodules in PET/CT images: ensemble false-positive reduction using a convolutional neural network technique. Med Phys 43(6Part1):2821–2827
Gore JC (2020) Artificial intelligence in medical imaging. Magn Reson Imaging 68:A1–A4, ISSN 0730–725X. https://doi.org/10.1016/j.mri.2019.12.006
Jiang J, Trundle P, Ren J (2010) Medical image analysis with artificial neural networks. Comput Med Imaging Graph 34(8):617–631
Chen CH (2015) Handbook of pattern recognition and computer vision. World Scientific, Singapore
Bi WL, Hosny A, Schabath MB, Giger ML, Birkbak NJ, Mehrtash A, Allison T, Arnaout O, Abbosh C, Dunn IF, Mak RH (2019) Artificial intelligence in cancer imaging: clinical challenges and applications. CA Cancer J Clin 69(2):127–157
Uzelaltinbulat S, Ugur B (2017) Lung tumor segmentation algorithm. Procedia Comput Sci 120:140–147
Kumar S, Sharma TK, Pant M, Ray AK (2012) Adaptive artificial bee colony for segmentation of CT lung images. Int J Comput Appl iRAFIT 5:1–5
Joon P, Bajaj SB, Jatain A (2019) Segmentation and detection of lung cancer using image processing and clustering techniques. In: Saeed K, Chaki N, Pati B, Bakshi S, Mohapatra DP (eds) Progress in advanced computing and intelligent engineering. Springer, Singapore, pp 13–23
Prabukumar M, Agilandeeswari L, Ganesan K (2019) An intelligent lung cancer diagnosis system using cuckoo search optimization and support vector machine classifier. J Ambient Intell Hum Comput 10(1):267–293
Mittal H, Saraswat M (2018) An optimum multi-level image thresholding segmentation using non-local means 2D histogram and exponential Kbest gravitational search algorithm. Eng Appl Artif Intell 71:226–235
Shankar K, Lakshmanaprabu SK, Khanna A, Tanwar S, Rodrigues JJ, Roy NR (2019) Alzheimer detection using Group Grey Wolf Optimization based features with convolutional classifier. Comput Electr Eng 77:230–243
Vijh S, Gaur D, Kumar S (2019) An intelligent lung tumor diagnosis system using whale optimization algorithm and support vector machine. Int J Syst Assur Eng Manag 11:1–11
Reddy UJ, Reddy BRVR, Reddy BE (2019) Recognition of lung cancer using machine learning mechanisms with fuzzy neural networks. Trait Signal 36(1):87–91
Zhang R, Cheng C, Zhao X, Li X (2019) Multiscale mask R-CNN–based lung tumor detection using PET Imaging. Mol Imaging 18:1536012119863531
Uçar M, Uçar E (2019) Computer-aided detection of lung nodules in chest X-rays using deep convolutional neural networks. Sakarya Univ J Comput Inf Sci 2(1):41–52
Naqi SM, Sharif M, Lali IU (2019) A 3D nodule candidate detection method supported by hybrid features to reduce false positives in lung nodule detection. Multimed Tools Appl 78(18):26287–26311
Manikandan T, Bharathi N (2016) Lung cancer detection using fuzzy auto-seed cluster means morphological segmentation and SVM classifier. J Med Syst 40(7):181
Kavitha P, Ayyappan G (2018) Lung cancer detection at early stage by using SVM classifier techniques. Int J Pure Appl Math 119(12):3171–3180
Kumar V, Sachdeva J, Gupta I, Khandelwal N, Ahuja CK (2011) Classification of brain tumors using PCA-ANN. In: 2011 world congress on information and communication technologies. IEEE, pp 1079–1083
El Abbadi NK, Kadhim NE (2017) Brain cancer classification based on features and artificial neural network. Brain 6(1):123–134
Nibali A, He Z, Wollersheim D (2017) Pulmonary nodule classification with deep residual networks. Int J Comput Assist Radiol Surg 12(10):1799–1808
Ali I, Hart GR, Gunabushanam G, Liang Y, Muhammad W, Nartowt B, Kane M, Ma X, Deng J (2018) Lung nodule detection via deep reinforcement learning. Front Oncol 8:108
Duarte MA, Pereira WC, Alvarenga AV (2019) Calculating texture features from mammograms and evaluating their performance in classifying clusters of microcalcifications. In: Mediterranean conference on medical and biological engineering and computing. Springer, Cham, pp 322–332
Esteva A, Kuprel B, Novoa RA, Ko J, Swetter SM, Blau HM, Thrun S (2017) Dermatologist-level classification of skin cancer with deep neural networks. Nature 542(7639):115–118
Vijh S, Sharma S, Gaurav P (2020) Brain tumor segmentation using OTSU embedded adaptive particle swarm optimization method and convolutional neural network. In: Hemanth J, Bhatia M, Geman O (eds) Data visualization and knowledge engineering. Springer, Cham, pp 171–194
https://wiki.cancerimagingarchive.net/display/Public/LIDC-IDRI
Preetha K, Jayanthi SK (2018) GLCM and GLRLM based feature extraction technique in mammogram images. Int J Eng Technol 7(2.21):266–270
Ahmadi N, Akbarizadeh G (2018) Iris tissue recognition based on GLDM feature extraction and hybrid MLPNN-ICA classifier. Neural Comput Appl 32:1–15
Dalal N, Triggs B (2005) Histograms of oriented gradients for human detection. In: 2005 IEEE computer society conference on computer vision and pattern recognition (CVPR’05), vol 1. IEEE, pp 886–893
Dornaika F, Moujahid A, El Merabet Y, Ruichek Y (2017) A comparative study of image segmentation algorithms and descriptors for building detection. In: Samui P, Roy SS, Balas VE (eds) Handbook of neural computation. Academic Press, Cambridge, pp 591–606
Anthimopoulos M, Christodoulidis S, Ebner L, Christe A, Mougiakakou S (2016) Lung pattern classification for interstitial lung diseases using a deep convolutional neural network. IEEE Trans Med Imaging 35(5):1207–1212
Ker J, Wang L, Rao J, Lim T (2018) Deep learning applications in medical image analysis. IEEE Access 6:9375–9389
Author information
Authors and Affiliations
Corresponding author
Ethics declarations
Conflict of interest
The authors declare that they have no conflict of interest.
Additional information
Publisher's Note
Springer Nature remains neutral with regard to jurisdictional claims in published maps and institutional affiliations.
Rights and permissions
Open Access This article is licensed under a Creative Commons Attribution 4.0 International License, which permits use, sharing, adaptation, distribution and reproduction in any medium or format, as long as you give appropriate credit to the original author(s) and the source, provide a link to the Creative Commons licence, and indicate if changes were made. The images or other third party material in this article are included in the article's Creative Commons licence, unless indicated otherwise in a credit line to the material. If material is not included in the article's Creative Commons licence and your intended use is not permitted by statutory regulation or exceeds the permitted use, you will need to obtain permission directly from the copyright holder. To view a copy of this licence, visit http://creativecommons.org/licenses/by/4.0/.
About this article

Cite this article
Vijh, S., Gaurav, P. & Pandey, H.M. Hybrid bio-inspired algorithm and convolutional neural network for automatic lung tumor detection. Neural Comput & Applic 35, 23711–23724 (2023). https://doi.org/10.1007/s00521-020-05362-z
Received:
Accepted:
Published:
Issue Date:
DOI: https://doi.org/10.1007/s00521-020-05362-z