

Abstract
In situ quantum cascade laser (QCL) absorption spectroscopy is used to investigate the effect of admixed water in a pulsed CO2 glow discharge on the vibrational excitation of CO2 and CO and the conversion of CO2. Time-resolved transmittance spectra of the non-equilibrium CO2 plasma are measured with a 100 μs time resolution. A custom fitting routine is used to extract the time evolution of the gas temperature, rotational temperature and vibrational temperatures of CO2 and CO, while the CO2 conversion is determined from measured CO2 and CO number densities. Rotational Raman scattering is additionally performed in the centre of the reactor to verify measured rotational and vibrational temperatures from line-of-sight absorption spectroscopy. The plasma is operated at 6.7 mbar, with up to 10% water admixed, and is pulsed with a 5–10 ms on-off cycle, with a current of 50 mA supplied during the plasma on-time. Vibrational temperatures and CO2 conversion are not significantly affected by water admixtures below 0.5%. However, the asymmetric stretch temperature of CO2 (T3) shows considerable quenching upon admixing 10% water vapour, with the maximum elevation above the rotational temperature (Trot) decreasing from 580 ± 86 K to 230 ± 63 K. For the vibrational temperature of CO (TCO), a similar trend is measured. However, the slopes of T3 and TCO within the first few hundred μs after the start of the plasma remain unchanged, even when admixing 10% water vapour, suggesting equal excitation of the vibrational modes through e–V and V–V interactions. The conversion decreases by almost a factor of 4 when admixing 10% water. We argue that vibrational quenching of CO2 by water can explain part of the decrease. Changes in electron density and temperature and reactions between CO and OH can also play a role.
Export citation and abstract BibTeX RIS
1. Introduction
To reduce global anthropogenic carbon emissions, renewable energy sources such as solar and wind energy are being implemented on an ever growing scale. As a result, the contribution from these intermittent energy sources into the energy mix increases quickly, requiring an efficient energy storage method. One possible method of energy storage with a high volumetric and gravimetric energy density is in the form of value-added hydrocarbons [1]. These (liquid) hydrocarbons can be synthesised using the Fischer–Tropsch process from syngas, i.e. a mixture of CO and H2 [2, 3].
Syngas can be produced from a combination of low-cost and abundant CO2 and H2O, although other (higher cost) methods that use H2 [4, 5] or CH4 [6–8] are also available. Low-cost syngas production could potentially be achieved by combined conversion of CO2 and H2O, or by separate dissociation of both molecules and combining their products. Even in the latter case, small amounts of water would still be present when using the proposed industrial waste gas streams, where water (vapour) is a common impurity. Both for separate and combined conversion, vibrational excitation of CO2 can help to efficiently dissociate the CO2 to form CO without generating excess heat [9, 10]. This can be achieved in the reactive environment of a non-equilibrium plasma to selectively deposit energy into the vibrational modes of CO2 [9, 11–14]. However, it has been suggested that water quenches CO2 vibrational states significantly, potentially leading to a lower CO2 conversion [15–19].
The effect of water on the conversion of CO2 has been studied in various discharges, including (packed bed) dielectric-barrier discharges (DBD) [13, 20], surface discharges [21], corona discharges [22], surface-wave microwave discharges [12, 23], nanosecond repetitively pulsed discharges (NRP) [24] and transversely excited atmospheric (TEA) CO2 laser discharges [25]. In most cases, the CO2 conversion drops significantly upon addition of water vapour, with the exception being the work of Chen et al [23], where a slight increase in the conversion was measured upon adding 10% water. To the authors knowledge however, no direct measurements on the quenching of vibrational temperatures of CO2 by H2O are available, while these vibrational temperatures can be relevant to understand CO2 dissociation in the presence of water vapour [12]. Furthermore, measuring these vibrational temperatures can help to validate results from kinetic modelling of combined conversion of CO2 and H2O. It can also help to set requirements on the water content that can be tolerated in the (industrial) gas stream that is used for CO2 conversion.
Recently, we published work where a set of three quantum cascade lasers (QCLs) was used to measure in situ CO2 and CO absorption spectra in a pulsed CO2–N2 glow discharge [26]. The uniformity of the positive column of the glow discharge [27] was exploited to extract rotational and vibrational temperatures, as well as the gas temperature from the line broadening. These parameters were determined with high accuracy and sensitivity by measuring the absorption spectrum in three small frequency intervals (about 1 cm−1 each). Although conversion and energy efficiency in a glow discharge are typically limited [1], a glow discharge is a well-known source of vibrational non-equilibrium (both for continuous [28–30] and pulsed discharges [31–33]) and it is easily accessible with various optical diagnostics. Hence, this discharge is particularly well suited for studying vibrational excitation of CO2 and to verify related reaction rates in numerical models.
In this study, we again employ in situ QCL absorption spectroscopy to measure time resolved rotational and CO2 and CO vibrational temperatures, as well as the gas temperature in a pulsed CO2 glow discharge. We admix up to 10% water to study the suggested vibrational quenching of CO2 by water vapour [15, 16]. Since absorption spectroscopy is a line-of-sight technique, we additionally support these measurements with spatially resolved rotational Raman scattering measurements in the centre of the reactor. This allows verification of the absorption spectroscopy measurements, using spatially resolved rotational temperatures and CO2 vibrational excitation from the apparent rotational degeneracy [27, 34, 35].
2. Experimental methods
The experimental setup is schematically depicted in figure 1 and is described in more detail in our previous work [26]. Hence, this section only highlights some important features and relevant changes in the setup. The reader is referred to the previous work for a more extensive description of the QCL absorption spectroscopy setup and data processing procedures, as well as a description of the measured transitions.
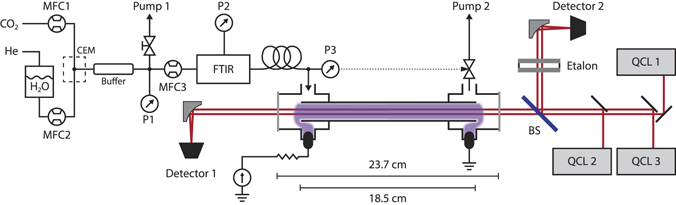
Figure 1. A schematic representation of the laser setup and the gas and water supply system. Three colinear quantum cascade lasers were combined into a single beam using gold mirrors. This beam was split by a beamsplitter (BS), with part of the beam being used for frequency calibration using an etalon, while the other part was used for absorption spectroscopy on a pulsed glow discharge. Water was added to a CO2 stream from a He-pressurised container, using a CEM and a combination of a liquid and gas mass flow controller. A flow of 7.4 sccm of this mixture was sampled and travelled through the reactor, where a plasma was ignited using a power supply operating in constant current mode.
Download figure:
Standard image High-resolution image2.1. Plasma setup
A CO2 flow was controlled by mass flow controller MFC1 (Bronkhorst F-201CV, 750 sccm N2 calibrated), which was combined with a controlled flow of water from a He-pressurised vessel containing distilled water using MFC2 (Bronkhorst μ-Flow L01, 0.25 g h−1) by a controlled evaporative mixer (CEM) at 120 °C. This gas stream then went through a 250 mL buffer volume, where a reduced pressure below 200 mbar was maintained and monitored by pressure gauge P1, to allow water up to 10% to be added without water condensation within the gas feed system. A flow of 7.4 sccm of this gas stream was sampled using MFC3 (Bronkhorst F-201CV, 100 sccm N2 calibrated), with the remainder leaving the system through pump 1. Using this configuration, relatively large CO2 and H2O flows could be used to help maintain a good gas feed stability, while a low flow and pressure could be maintained in the plasma reactor.
The sampled gas stream flowed from MFC3 through a Bruker multipass cell with a length of 25 cm, which was placed in the sample compartment of a Bruker Vertex 80v Fourier-transform infrared (FTIR) spectrometer, to allow the molar fraction of the dosed water to be monitored. The internals of the FTIR spectrometer were pumped down to 2 mbar, while a small N2 flow was supplied to purge as much water from the FTIR spectrometer as possible. The pressure in the multipass cell was monitored using a Pfeiffer CMR 263 pressure gauge (P2). The gas stream subsequently travelled to the plasma reactor through a gas line of a few meters. This gas line prevents products created in the plasma reactor to diffuse into the FTIR multipass cell. The pressure inside the reactor is maintained at 6.7 mbar. A current of 50 mA is supplied during the plasma on-time of a sequence of pulses with a 5 ms–10 ms on–off cycle [26].
The time evolution of the current and applied voltage over the reactor, as well as the instantaneous power are measured for all water admixtures and can be found in supplementary figure S1 (https://stacks.iop.org/PSST/29/095017/mmedia). Supplementary table S1 lists the energy input per cycle, derived from the instantaneous power, for all water admixtures.
2.2. Quantum cascade laser system
A set of three colinear distributed feedback quantum cascade lasers (QCLs) were used to measure the transmittance of the plasma over three different frequency intervals. QCL 1 was used to measure the  band between 2252.30 and 2253.51 cm−1. QCL 2 and QCL 3 were used to measure the CO (vCO) → (vCO + 1) band in the 2211.64–2212.85 cm−1 and 2179.20–2180.11 cm−1 intervals. These lasers were current-driven in the intermittent scanning mode [36], allowing the scan rate of the QCLs to be sufficiently slow to avoid rapid passage effects [37–40]. A fraction of the laser emission was split off using a 95/5 beamsplitter to allow for frequency calibration using an etalon (free spectral range 0.01617 cm−1).
The master clock for the experiment was generated by the QCL controller (Neoplas Q-MACS Basic MC) at an interval of 1.5 ms, with the plasma clock phase shifted by a time td by a set of two pulse delay generators (Stanford Research Systems DG535). An additional time shift with respect to the master clock of 0 μs, 40 μs and 75 μs was introduced for QCL 1, 2 and 3, respectively, to prevent time overlap in their emission. Hence, for each plasma cycle, spectra are collected at 10 time points t = 1.5 ⋅ i + td (in ms), with 0 < i < 10, significantly reducing the acquisition time with respect to previous work [26]. By adjusting td stepwise from td = 0 ms up to 1.4 ms, a time resolution of 100 μs is achieved within a single period of an infinite sequence of plasma pulses. A schematic representation of the timing scheme is depicted in figure 2.

Figure 2. A timing diagram showing the trigger of the QCLs and the pulse that is supplied to the plasma power supply. The plasma is triggered with a 5 ms on-time and a 10 ms off-time, whereas the QCLs are triggered at a 1.5 ms interval, where a pulse delay generator was used to shift the QCL trigger by a time td with respect to the start of the plasma cycle. Note that for every QCL trigger, QCL 1, 2 and 3 are subsequently fired with a time delay of a few tens of μs in between to prevent a time overlap in the emission of the QCLs (not included in this diagram).
Download figure:
Standard image High-resolution imageAn example of the measured transmittance, 500 μs after starting the plasma, is shown in figure 3 for water admixtures ranging from 0% to 10%. Figure 3(a) includes only CO2 transitions, while figure 3(b) only includes CO transitions. The absorption spectra of all three QCLs were analysed using a single custom least-squares fitting algorithm. This algorithm is based on data from the HITEMP database [41, 42] for CO2 and a HITRAN-like dataset by Li et al for CO [43]. 1393 CO2 transitions and 29 CO transitions are used to perform a least-squares fit of the transmittance of the measured spectral regions.
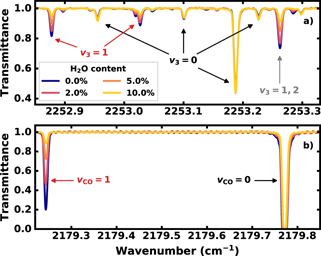
Figure 3. (a) Measured transmittance between 2252.85 and 2253.33 cm−1 containing transitions for CO2, and (b) between 2179.22 and 2179.85 cm−1 containing transitions for CO. Both for a few water admixtures ranging from 0% (blue) to 10% (yellow). Some fringes in panel (b) are present due to interference within the laser packaging. The lower state vibrational quanta (v3 and vCO) of the respective transitions are indicated as black and red annotations. The grey annotation is related to overlapping transitions of CO2 from v3 = 1 and v3 = 2. The full line assignment can be found in [26].
Download figure:
Standard image High-resolution imageThe fit algorithm calculates the transmittance for a dual slab system, with one 18.5 cm long slab representing the non-equilibrium plasma column and a second 5.2 cm long slab representing the regions between the plasma column and the reactor windows. For the latter, a constant time-invariant temperature of 400 K is assumed, which can affect the measured temperatures. However, transitions with high rotational and/or vibrational quanta are mainly measured, which are relatively weak at 400 K. The effect of this assumption on measured temperatures is thus only small and is included in the statistical errors of the respective parameters. The fitting algorithm was validated against a previously published non-equilibrium spectrum measured by Dang et al using tunable diode laser absorption spectroscopy [29] and time evolutions of vibrational temperatures measured by Klarenaar et al using Fourier-transform infrared spectroscopy [32], showing excellent agreement with previous work [26].
The measured spectra contain contributions from transitions up to v3 = 4 → 5 and vCO = 1 → 2 for CO2 and CO, respectively. Tgas represents the gas temperature and was extracted from the Doppler line broadening, assuming a constant pressure broadening contribution at 6.7 mbar during the plasma cycle. Trot describes the rotational state distribution, while T12 describes the combined temperature of the symmetric stretch and bending vibrational modes of CO2, both assuming a Boltzmann distribution. The CO2 asymmetric stretch vibrational temperature T3 and the CO vibrational temperature TCO were used to calculate vibrational populations using a Treanor distribution, due to fast vibration–vibration (V–V) interactions in these respective modes [29, 44]. While the Treanor temperatures T3 and TCO are expressed in K, they are strictly apparent vibrational temperatures [45, 46]. However, it has become common to refer to these parameters as vibrational temperatures and we will follow this convention [29, 32, 47–49]. It is also important to note that the Treanor and Boltzmann distributions produce almost identical absorption strengths for the measured CO2 and CO transitions within the range of temperatures measured. Despite some of the saturated CO transitions in figure 3(b), the fit algorithm can still accurately determine TCO, since the line strength of these saturated transitions is related to the width of the line. This does require an accurate measurement of Doppler and pressure line broadening however, which can be done thanks to the narrow bandwidth of the QCLs and the non-saturated transitions in figure 3. The typical statistical error for TCO is 12% (determined using a reduced chi-squared analysis), despite the presence of some saturated transitions [26].
The absolute number densities  and nCO for CO2 and CO were determined from their respective contributions to the measured spectra. The initial values of the fit were set to 600 K for Tgas, Trot, T12, T3 and TCO, while the initial conditions for
  and nCO were set to 4 × 10²² m−3.
2.3. Experimental procedure
Time-resolved absorption spectra were taken according to the following procedure. Every measurement series was started with the reactor pumped down to below at least 1 × 10⁻¹ mbar. All three QCLs were subsequently configured and their emission was started. A background measurement was taken to obtain the QCL emission without any absorption by the plasma. The CO2 flow was started by setting MFC1 to the appropriate setpoint, which varied between 50 and 100 sccm depending on the desired water vapour admixture. The pressure P1 was then increased to the desired value, followed by setting the flow of MFC2 to admix the desired water vapour. The pressure setpoint in the reactor (P3) was subsequently increased to 6.7 mbar. Once the pressure inside the reactor (measured by P3) reached the pressure setpoint, the system was given an additional 10 min to fully stabilise. Hereafter, 4 FTIR absorption spectra were acquired within 10 min, at 4 different times, to check the dosed water content and its stability.
An absorption spectrum was collected for the given CO2/H2O mix, initially without starting the plasma to check the CO2 content in the reactor. The plasma was subsequently started and the current during the plasma on-time was set to 50 mA. The plasma was given a few minutes to stabilise, after which the (automatic) acquisition of the QCL absorption spectra was started using custom software, collecting 150 absorption spectra during both the plasma on-time and off-time over about 6 min. Once the QCL acquisition finished, the scope traces for the applied voltage and current were acquired as well on the oscilloscope. Once this was completed, the plasma was turned off and the QCL emission was stopped. The system was now purged for 5 min with pure CO2 at 6.7 mbar, followed by pumping down the system to at least below 1 × 10⁻¹ mbar, to remove as much water as possible, before starting the next acquisition series.
Care has been taken to prevent water to accumulate inside the system over time. This was checked by repeating the measurements without water admixed after all other measurements were completed. The results were almost identical to the pure CO2 measurements before the water admixing experiments.
2.4. Rotational Raman scattering
In addition to absorption spectroscopy, rotational Raman scattering was used to perform spatially resolved measurements. These measurements were performed using the same gas feed system and plasma setup described above, although 23 cm long extensions were attached to either end of the reactor to reduce the laser energy density at the windows. Since the laser scattering setup is described in detail in previous work [33], this section only provides a brief overview of this setup. Rotational Raman spectroscopy serves as a validation for the line-integrated absorption spectroscopy measurements. While spatially resolved measurements in a pulsed CO2 glow discharge have already shown the uniformity of the plasma [27], it should be validated that this also holds for a CO2 plasma with water admixed. Measurements were performed in the centre of the plasma at 11 strategically determined time points during the plasma cycle and were limited to 0% and 5% water admixture. This is due to acquisition times of up to 45 min per time point for rotational Raman scattering, in contrast to about 2 s for a QCL absorption spectrum.
A frequency-doubled Nd:YAG laser at 532 nm was focused into the centre of the plasma reactor by a set of lenses. Hence, it should be mentioned that the reactor configuration differed from the one depicted in figure 1. Scattered light was collected at 90°, focused into a glass fibre and subsequently collimated. This light passed through a volume Bragg grating, which allowed the strong Rayleigh scattering to be filtered [50]. The collimated beam was then focused onto the 100 μm wide entrance slit of a spectrometer and was spectrally resolved by a 2400 lines/mm grating. It was then detected by a custom intensified camera, for which the spectral sensitivity was determined from the black-body radiation of a W-ribbon lamp.
Both the Stokes and anti-Stokes branches were recorded up to a positive and negative Raman shift of 96 cm−1 and analysed using a custom fitting algorithm. The rotational temperature Trot describes the rotational state distribution, assuming a Boltzmann distribution. The number densities  , nCO and
  , for CO2, CO and O2, respectively, were determined from the contributions of the respective species to the total spectrum. The initial values of the fit were set to Trot = 600 K and
  m−3. The scattering intensity and instrumental broadening (assuming equal Gaussian and Lorentzian contributions) were both calibrated using a rotational Raman spectrum for pure CO2 at room temperature and a pressure of 6.7 mbar.
In the vibrational ground state of CO2, only even rotational levels contribute to the rotational Raman spectrum, whereas odd rotational levels have a degeneracy of zero. If higher vibrational levels are populated however, odd rotational levels can have a non-zero degeneracy [35, 51]. Hence, the rotational Raman spectrum of CO2 is affected by the vibrational temperatures T12 and T3 through the apparent degeneracy of even and odd rotational levels ⟨gJ,e/o⟩ [35]:

with the plus sign corresponding to the degeneracy of even rotational levels and the minus sign corresponding to the degeneracy of odd rotational levels. Furthermore, ⟨gJ,e⟩ + ⟨gJ,o⟩ always equals unity for CO2. The factor zi is related to the vibrational temperature Ti through

with h the Planck constant, c the speed of light and kB the Boltzmann constant. G1,i is the energy spacing between the vibrational ground state and the first vibrationally excited state for vibrational mode i, which is equal to 667.47 cm−1 for the bending mode of CO2 and 2349.16 cm−1 for the asymmetric stretch mode of CO2 [32]. Due to the strong Fermi-resonance between the symmetric stretch and bending modes of CO2, a shared temperature T12 is used, which substitutes the vibrational temperature T2 in the equation above.
By including ⟨gJ,o⟩ as a fitting parameter (with an initial value of 0.25), it is possible to characterise vibrational excitation locally. Since ⟨gJ,o⟩ measures the combined effect of changes in T12 and T3, it is not possible to find values for T12 and T3 independently, but it can be used verify measured vibrational temperatures using line-integrated absorption spectroscopy with a spatially resolved technique. This allows verification of the assumption that the plasma is uniform.
3. Results
3.1. Rotational temperatures
The measured time evolutions of the rotational temperatures are shown in figure 4. Solid lines represent absorption spectroscopy measurements, with the lines colour coded based on the water admixture, ranging from blue for 0% water admixture to yellow for 10% water admixture. Rotational temperatures measured using rotational Raman scattering at 0% and 5% water admixture are included as scatter points (including a 2σ fitting error) at a few time points, using the same colour coding of the corresponding solid lines. The grey shaded time interval represents the on-time of the plasma, between t = 0 ms and t = 5 ms.

Figure 4. Time evolution of the rotational temperature Trot for different water admixtures, ranging from blue for no water to yellow for 10% water admixture. Solid lines indicate results from QCL absorption spectroscopy measurements, while measured rotational temperatures using rotational Raman scattering at various times are included as scatter points in the same colours as the related QCL measurements.
Download figure:
Standard image High-resolution imageThe measured rotational temperature Trot starts at 370 ± 19 K for a pure CO2 plasma at t = 0 ms. This is due to the residual heat that is left over from previous pulses. The rotational temperature then increases during the on-time of a pure CO2 plasma to Trot = 840 ± 42 K at t = 5 ms, followed by an exponential decrease before starting the next plasma cycle. This measured evolution of the rotational temperature corresponds well with previous measurements on the same discharge [26, 27, 32]. A similar increase in the measured rotational temperatures is observed upon admixing water, reaching a maximum temperature of 810 ± 41 K, which is well within the statistical error of results for pure CO2. Despite differences in reactor design for rotational Raman spectroscopy with respect to absorption spectroscopy measurements (due to the extensions mounted to either end of the reactor for rotational Raman scattering), the rotational temperatures measured using rotational Raman spectroscopy and QCL absorption spectroscopy agree well when taking into account their statistical (fitting) error.
For the absorption spectroscopy results, some small sawtooth features are visible with a period of 1.5 ms, especially near the end of the plasma off-time. These features are related to long-term drift of either the plasma or QCL in combination with the triggering scheme (see also figure 2). The effect of these features on the measured rotational temperature is included in the statistical error estimation of 5%.
3.2. Gas temperatures
The gas temperature Tgas is generally assumed equal to the rotational temperature Trot due to the high translation–rotation (T–R) interaction rates [52, 53]. To verify this assumption, the gas temperature Tgas can be determined from the Doppler broadening width of the absorption line. The absorption cross section is a convolution of the Gaussian-shaped Doppler broadening contribution and the Lorentzian-shaped pressure broadening contribution. Hence, if the pressure broadening is known, the gas temperature Tgas can be extracted from the absorption line profile. To determine the spectral profile of the absorption profile though, the instrumental broadening needs to be sufficiently small. It was verified experimentally that the instrumental broadening of each QCL is negligible by measuring the gas temperature Tgas from a pure CO2 absorption spectrum at room temperature.
At the conditions presented in this work, the typical Doppler broadening full-width at half-maximum (FWHM) is around 0.004 cm−1 for CO2 at Tgas = 600 K and exceeds the pressure broadening FWHM by about one order of magnitude. However, the tail of the Lorentzian pressure broadening contribution can become significant, especially for highly saturated lines (such as those of CO). Hence, the error in the measured gas temperature Tgas depends for a significant part on the error in pressure broadening constants. Only a few pressure broadening constants are available, such as the self broadening coefficients for CO2 and CO [41, 42] and for broadening of CO by CO2 [43]. To our knowledge though, no database is available that includes broadening of CO2 and CO by water. Hence, we estimated the statistical error for Tgas to be 10% as a result of experimental uncertainties and the uncertainties in the pressure broadening component.
Figure 5 shows the time evolution of the measured gas temperature Tgas. Generally, Tgas is slightly elevated with respect to Trot, with Tgas = 410 ± 41 K just before turning on the plasma and Tgas = 845 ± 85 K at t = 5 ms without water admixture. Measurements on Tgas and Trot show good agreement when considering their related errors. Similarly to the time evolution of Trot, no significant changes in Tgas were observed due to the addition of water.
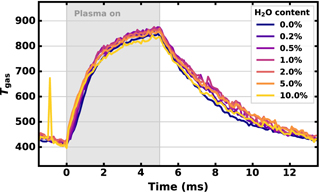
Figure 5. Time evolution of the gas temperature Tgas for different water admixtures, ranging from blue for no water to yellow for 10% water admixture. The spike in Tgas at t = −900 μs is the result of the fit procedure stopping at a local instead of the global minimum.
Download figure:
Standard image High-resolution image3.3. Vibrational temperatures
Figure 6 shows the time evolution of the vibrational temperatures of CO2 and CO, during the plasma on-time and the cooldown phase, for water admixtures from 0% (blue lines) up to 10% (yellow lines). The related statistical error for vibrational temperature T12 is determined to be 9% on average from a reduced chi-squared analysis. Figure 6(a) shows the time evolution of T12, where the admixture of water vapour causes a slight reduction in T12, especially towards the end of the plasma on-time. To visualise the degree of non-equilibrium, the elevation of T12 above Trot is included in figure 6(d). This shows that the elevation of T12 during the plasma on-time almost completely disappears upon admixing 10% water vapour. This is in line with high rate constants reported for vibrational relaxation of the bending mode upon admixture of water, which exceeds those of a pure CO2 mixture by over three orders of magnitude [18, 54]. It should be noted though that these changes in elevation of T12 are only just above the statistical error for T12 − Trot of 40 K at the beginning of the plasma on-time, while the statistical error increases to 100 K towards the end of the plasma on-time. Hence, it is difficult to differentiate between subsequent water admixture conditions. In the cooldown phase, T12 − Trot initially goes to zero, before increasing again towards the end of the cooldown phase. This is attributed to the fact that T12 is determined from transitions with high rotational quantum number J and thus the sensitivity for T12 is reduced significantly at low rotational temperature. Furthermore, the regions outside the positive column are assumed to have a constant temperature in the fit algorithm. While this assumption affects Trot and T12 only very marginally, its effect becomes more significant at lower (rotational) temperatures and thus mainly affects Trot and T12 at the beginning of the plasma on-time and the end of the cooldown phase.

Figure 6. (a) Time evolution of the combined temperature of the symmetric stretch and bending mode T12 of CO2, (b) the vibrational temperature of the asymmetric stretch T3 of CO2 and (c) the vibrational temperature of CO TCO. The elevation of these vibrational temperatures above the rotational temperature Trot is depicted in panels (d)–(f), respectively. Colours indicate the water content, ranging from blue for no water addition to yellow for 10% water admixture.
Download figure:
Standard image High-resolution imageThe time evolution of the asymmetric stretch vibrational temperature T3 of CO2 is depicted in figure 6(b), with the statistical error for T3 being 8% on average. Here, a fast increase of T3 is visible upon starting the plasma, with a maximum of 1060 ± 85 K being reached at t = 700 μs. T3 subsequently decreases slightly, followed by a relatively constant temperature at the end of the plasma on-time. When admixing water, T3 is mainly affected in the first few milliseconds after turning on the plasma, while the temperature near the end of the plasma on-time is only slightly affected. After the plasma is turned off, a similar exponential temperature decrease is observed for all water admixtures. Towards the end of the cooldown phase, the statistical error of measured T3 values increases due to a lower population of v3 > 0 levels, with almost all of the sensitivity being lost below T3 = 500 K with only very minor changes to the measured CO2 spectrum as a function of T3. Hence, this method does not produce reliable results for T3 < 500 K, which is demonstrated by the time evolution of T3 in figure 6(b), which shows occasional underestimations of T3 near the (low temperature) end of the cooldown phase.
The relatively constant T3 in the last 3 ms of the plasma on-time suggests that excited asymmetric stretch levels show only a minor effective relaxation. However, the relatively high T3 towards the end of the plasma on-time is mainly caused by the simultaneous increase in Trot. Hence, it is more illustrative to visualise the non-equilibrium with respect to Trot, as depicted in figure 6(e). Here, a fast increase in T3 − Trot in the first few hundred μs is observed, with a slope that does not change upon admixing water. Since this initial slope is mostly affected by e–V and V–V interaction rates, this seems to imply that the electron density does not change significantly during this part of the plasma on-time, despite the electronegativity of water (vapour) which is generally considered to reduce electron density [1, 25]. Alternatively, changes in e–V and V–V interaction rates could be compensated by a simultaneous change in both electron density and temperature. Upon admixing water, the maximum value for T3 − Trot is reached much sooner with respect to pure CO2 and the maximum vibrational non-equilibrium T3 − Trot is much lower. For pure CO2, T3 − Trot reaches a maximum of 580 ± 86 K at t = 500 μs, while the maximum of 230 ± 63 K is reached at t = 200 μs for an admixture of 10% water vapour. This change is indicative of a significant increase in vibrational relaxation rates upon admixing water, which has been linked to fast V–V relaxation towards the bending mode of CO2 via the bending mode of H2O, with a typical quenching rate of around 1 × 10⁻¹² cm3 molecule−1 s−1 at T = 300 K. This exceeds quenching due to CO2 molecules by about two orders of magnitude [17–19]. Additionally, atomic oxygen and molecular hydrogen can contribute to efficient quenching of the CO2 asymmetric stretch, due to their relatively high typical quenching rates of about 2 × 10⁻¹³ cm3 molecule−1 s−1 and 4 × 10⁻¹² cm3 molecule−1 s−1 at T = 300 K, respectively [55, 56]. However, the molar fraction of atomic oxygen is not expected to increase upon admixing water since it is typically consumed in the formation of hydrogen containing reactive oxygen species [57], while typical yields for the formation of molecular hydrogen from admixed water are only around a few percent [12, 24]. Hence, the quenching of the asymmetric stretch mode of CO2 by atomic oxygen and molecular hydrogen with respect to the quenching by water vapour is expected to be only marginal. Furthermore, since V–T relaxation also increases significantly with increasing rotational temperature [32], the non-equilibrium decreases further towards the end of the plasma on-time, with T3 − Trot showing only very minor changes towards t = 5 ms for each individual water admixture. Once the plasma is turned off, equilibrium conditions are reached within about 200 μs.
Finally, figure 6(c) shows the time evolution of the CO vibrational temperature TCO, with its relative elevation above Trot in figure 6(f). The statistical error for TCO is determined to be 12% on average. The measured trends of TCO are very similar to those of T3, with an initial fast rise of TCO in the first few hundred μs. Due to the increase in V–T relaxation rates as a result of the increase in Trot during the plasma on-time, a maximum is reached for TCO, followed by a slight decrease towards a steady-state temperature. Once the plasma is turned off, TCO goes down exponentially and quickly equilibrates with the rotational temperature. Similar to T3, the sensitivity to TCO is lost at temperatures below 400 K due to the low contribution of transitions from excited CO vibrational levels in the measured spectral regions. Upon addition of water, the initial fast rise of TCO − Trot does not change, again indicative of a relatively constant excitation of the vibrational mode through e–V and V–V excitation. However, an increase in vibrational relaxation due to the presence of water results in reaching a lower maximum for TCO − Trot and sooner after starting the plasma, suggesting efficient vibrational quenching of CO by water. Indeed, the vibrational bending mode (ν2) of water is suggested as a possible loss channel for this CO vibrational excitation [54, 58]. Since energy exchange between the asymmetric stretch vibrational mode of CO2 and CO is relatively easy [26, 54, 59], this quenching of the CO vibrational mode can indirectly also affect the asymmetric stretch vibrational excitation of CO2.
3.4. Apparent odd fraction
In addition to the vibrational temperatures measured using line-of-sight QCL absorption spectroscopy, a few spatially resolved rotational Raman spectroscopy measurements in the centre of the reactor were performed at 0% and 5% water admixture, respectively, to verify the spatial uniformity of the plasma. While the measured rotational temperatures using rotational Raman scattering were already presented in figure 4, these measurements also yield information on vibrational excitation through the apparent odd fraction ⟨gJ,o⟩ (equation (1)).
Figure 7(a) shows the measured apparent odd fraction ⟨gJ,o⟩ at a few times during the plasma cycle, which increases both due to vibrational non-equilibrium and due to overall heating of the plasma. This figure shows that the measured apparent odd fractions for 0% water admixture exceed those for 5% water admixture during the plasma on-time, which subsequently equalise in the cooldown phase.

Figure 7. (a) Measured time evolution of the apparent degeneracy of odd rotational levels ⟨gJ,o⟩ using rotational Raman scattering, with dashed lines serving as a 'guide to the eye'. The plot includes the time evolution of this apparent degeneracy for pure CO2 and for 5% water admixture. (b) The difference between the measured apparent degeneracy of odd rotational levels and its value at thermal conditions  , where the dashed grey line represents full thermalisation. This difference in apparent odd degeneracy with respect to thermal conditions is also calculated from time evolutions of T12 and T3 using QCL absorption spectroscopy and is included as solid lines.
Download figure:
Standard image High-resolution imageTo distinguish between vibrational non-equilibrium and heating of the plasma, figure 7(b) shows the difference between the measured odd fraction ⟨gJ,o⟩ and the calculated odd fraction at thermal conditions  , assuming T12 and T3 equal Trot. Here, a value for
  above zero indicates that T12 and/or T3 are elevated above Trot, while this equals zero for thermal equilibrium conditions. Additionally, the time evolution of the apparent odd fraction from line-of-sight absorption spectroscopy measurements is included as solid lines for 0% and 5% water admixture, respectively.
The data presented in figure 7(b) shows a good agreement between line-of-sight QCL measurements and spatially resolved rotational Raman spectroscopy measurements in the centre of the reactor. A slight disagreement is observed in the cooldown phase, where  from absorption spectroscopy is above zero. This corresponds to the measured elevation of T12 above Trot (as depicted in figure 6(d)) and is caused by the assumed time invariant temperature in the cold regions outside the plasma column. This leads to a slight underestimation of Trot, especially when Trot in the plasma column is relatively low. Since ⟨gJ,o⟩ is quite sensitive to changes in especially Trot and T12, this slight underestimation of Trot can manifests itself as an overestimation of ⟨gJ,o⟩. It should be stressed though that this does not affect the measured apparent odd fractions during the relatively hot plasma on-time, where the effect of the assumed time invariant temperature in the regions outside the plasma column is negligible.
The good agreement between the measured apparent odd fractions and the rotational temperature evolution presented in figure 4 with a spatially resolved and line-of-sight technique confirms the absence of large spatial temperature gradients within the positive column of the plasma.
3.5. CO2 conversion
In addition to rotational and vibrational temperatures from relative differences in transition line strengths, the number densities  and nCO of CO2 and CO, respectively, can be determined from the absolute line strengths obtained using absorption spectroscopy. The fraction of converted CO2 molecules αabs can be expressed as:

where [CO] and [CO2] express the amount of moles of CO and CO2, respectively. The indexes i and f refer to the initial (before the plasma) and final (after the plasma) number densities, such that ![${\left[\mathrm{C}\mathrm{O}\right]}_{\mathrm{f}}={\left[{\mathrm{C}\mathrm{O}}_{2}\right]}_{\mathrm{i}}-{\left[{\mathrm{C}\mathrm{O}}_{2}\right]}_{\mathrm{f}}$](https://content.cld.iop.org/journals/0963-0252/29/9/095017/revision3/psstabad54ieqn12.gif) . We assume here that there is no significant loss of carbon by carbon deposition on surfaces or through formation of hydrocarbons. Under the additional assumption that the dissociation reaction stoichiometry is fixed (e.g. 2CO2 → 2CO + O2), equation (3) can be expressed in terms of the measured number densities nCO and
. We assume here that there is no significant loss of carbon by carbon deposition on surfaces or through formation of hydrocarbons. Under the additional assumption that the dissociation reaction stoichiometry is fixed (e.g. 2CO2 → 2CO + O2), equation (3) can be expressed in terms of the measured number densities nCO and  , such that
  , taking into account the expansion as a result of the dissociation reaction. The effective conversion αeff expresses the fraction of the total gas that is converted to CO and is related to the absolute conversion through

where  is the initial molar fraction of CO2. The energy efficiency η is now related to the effective conversion αeff by

with ΔHR the reaction enthalpy for CO2 dissociation of 2.9 eV per molecule. Emolec is the average energy input per molecule and is calculated from the average energy input P in W and the flow rate of the gas mixture through the reactor F in slm and can be expressed as

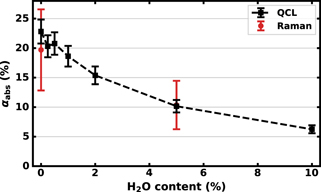
The change in absolute conversion αabs as a function of the water admixture is depicted in figure 8, including results from both QCL absorption measurements in black and rotational Raman spectroscopy in red. A good agreement is found between the absorption spectroscopy measurements and rotational Raman scattering measurements, although the statistical errors associated to the conversion αabs for rotational Raman spectroscopy measurements are high due to the low CO scattering cross section.
Figure 8. Measured absolute CO2 conversion αabs for various admixtures of water vapour. Conversions measured with QCL absorption spectroscopy are depicted in black, while the red points depict conversions calculated from measured CO2 and CO number densities with rotational Raman spectroscopy. The statistical error for rotational Raman measurements originates mainly from a high statistical error in the number density of CO due to its low scattering cross section.
Download figure:
Standard image High-resolution image
Without admixing any water vapour, the conversion αabs measured using absorption spectroscopy is 23 ± 2%, while the conversion does not change significantly upon admixing up to 0.5% of water vapour, with the conversion αabs = 21 ± 2%. However, when increasing the water vapour admixture above 1%, the conversion quickly decreases by almost a factor of 4 to αabs = 6.2 ± 0.7% upon admixing 10% water. The related energy efficiencies range from 1.3 ± 0.1% without water to 0.33 ± 0.04% for a 10% water admixture and show a very similar trend as the conversion αabs due to the relatively small changes in  . For completeness, a plot of the energy efficiency as a function of the water vapour content is included in supplementary figure S2.
The decrease of the conversion could be partially related to the reduction in vibrational excitation depicted in figure 6. Morillo-Candas et al [60] have recently shown however that most of the conversion occurs through direct electron impact (up to 80%) in a very similar reactor (although their discharge current was 40 mA instead of 50 mA). This does not strictly exclude the vibrational excitation from affecting the direct electron impact dissociation rate though, since a higher vibrational excitation can lead to a reduction in the energy barrier to overcome for CO2 dissociation, allowing a larger fraction of the electrons to have sufficient energy available for dissociation [61]. The large reduction in conversion upon water admixing can also be related to other effects, which can include a reduction in electron density by electron attachment to atomic oxygen [1, 21] or by OH and CO reacting to form CO2 [1, 25]. However, the initial slope in the measured vibrational temperatures (figure 6) does not change when admixing water, which seems to suggest that the (initial) e–V and V–V interaction rates do not change significantly. This can be either due to a constant electron density, or due to a simultaneous increase in the electron temperature that compensates the suggested decrease in electron density. Further measurements on electron density and temperature are required to attribute the drop in conversion due to water to the electron density and temperature and/or reactions involving OH.
4. Conclusions
The effect of admixed water vapour on the time evolution of the rotational temperature and CO and CO2 vibrational temperatures has been measured in a pulsed CO2 glow discharge. This was done using line-of-sight narrow linewidth QCL absorption spectroscopy on transitions up to v3 = 4 → 5 and vCO = 1 → 2 and with a 100 μs time resolution. The CO2 conversion was additionally determined from measured CO2 and CO number densities. These measurements are supported by spatially resolved rotational Raman spectroscopy measurements that underpin the uniformity of the plasma.
The rotational temperature during the discharge showed an increase from Trot = 370 ± 19 K before starting the plasma to Trot = 840 ± 42 K just before the end of the plasma on-time and was not significantly affected by the admixture of water vapour. Measured gas temperatures showed a similar trend to the rotational temperature and agree both qualitatively and quantitatively.
The suggested strong quenching of the CO2 vibrational population by water is confirmed by direct measurement of the CO2 vibrational temperatures. This is demonstrated by the strong drop in maximum elevation of T3 above Trot from T3 − Trot = 580 ± 86 K without water vapour to 230 ± 63 K with 10% water vapour admixed. Hence, care should be taken to eliminate water vapour from the gas feed to prevent undesired quenching of the CO2 vibrational modes.
The time evolution of T3 in the initial few hundred microseconds of the plasma on-time did not change upon admixing water, while the T3 peak decreased and was reached at an earlier time. This suggests a change in vibrational relaxation upon admixing up to 10% water vapour, while the vibrational excitation rate (during the initial part of the plasma on-time) through e–V and V–V interactions is constant. A similar trend was measured for TCO, although TCO is generally higher than T3.
The CO2 conversion was only marginally affected by small water admixture of up to 0.5%, while it dropped by almost a factor of 4 upon admixing 10% water. The reduction in vibrational excitation can explain part of this drop in conversion, while changes in electron density and temperature and reactions between CO and OH can also play a role. Further measurements or computational modelling of the electron density and temperature, as well as the OH density, are required to identify the mechanism(s) that reduce the conversion of CO2. The results reported in the present paper can be used to benchmark these models.
Acknowledgments
The authors would like to thank Maik Budde for his help in setting up the system to admix water, Bart Klarenaar and Xavier Cabuzel for their help with setting up the rotational Raman scattering setup and Olivier Guaitella for supplying the reactor that was used in this work. This project has received funding from the Netherlands Organization for Scientific Research (NWO), under reference FOM E3201M. L.M. Martini acknowledges the financial support from the Netherlands Organization for Scientific Research (NWO, research program HTSM, project No. 15352).