Microbial Physiology Governs the Oceanic Distribution of Dissolved Organic Carbon in a Scenario of Equal Degradability
 Andrea Mentges1*
  Curtis Deutsch2,3
  Christoph Feenders4
  Sinikka T. Lennartz1
  Bernd Blasius4,5
  Thorsten Dittmar1,5*
- 1Marine Geochemistry, Institute for Chemistry and Biology of the Marine Environment, University of Oldenburg, Oldenburg, Germany
- 2School of Oceanography, University of Washington, Seattle, WA, United States
- 3Department of Biology, University of Washington, Seattle, WA, United States
- 4Mathematical Modeling, Institute for Chemistry and Biology of the Marine Environment, University of Oldenburg, Oldenburg, Germany
- 5Helmholtz Institute for Functional Marine Biodiversity, University of Oldenburg, Oldenburg, Germany
Dissolved organic carbon (DOC) forms one of the largest active organic carbon reservoirs on Earth and reaches average radiocarbon ages of several thousand years. Many previous large scale DOC models assume different lability classes (labile to refractory) with prescribed, globally constant decay rates. In contrast, we assume that all DOC compounds are equally degradable by a heterotrophic microbial community. Based on this central assumption, we simulate DOC concentrations using a simple biogeochemical box model. Parameterized correctly, the simple model of neutral DOC uptake produced a recalcitrant carbon pool of 33 mmolC/m3, throughout the entire virtual ocean. The spatial distribution of DOC in the model was independent of the distribution of DOC sources from primary production and particle degradation. Instead, DOC concentrations were primarily driven by spatial gradients in microbial physiology, e.g., mortality rate or growth efficiency. Applying such a gradient, we find DOC concentrations of ~70 mmolC/m3 at the surface and ~35 mmolC/m3 in the deep ocean. Introducing model variations, such as seasonally-varying supply rates or temperature-dependent DOC uptake did not significantly alter model results. DOC spatial patterns are thus not necessarily shaped by the co-cycling of separate reactivity fractions, but can also arise from gradients in physiological parameters determining DOC uptake. We conclude that neutral DOC uptake can lead to realistic large-scale patterns of DOC concentration in the ocean.
1. Introduction
Dissolved organic carbon (DOC) forms one of the largest active organic carbon reservoirs on Earth, holding more than 600 Pg of carbon (Hansell et al., 2009). Changes to the balance of DOC production and decomposition processes would alter its oceanic inventory, and thus influence the atmospheric CO2 concentrations (Hedges, 2002). DOC is mainly formed by primary producers in the euphotic layer. While most of the freshly produced DOC compounds are decomposed by microbes on a time scale of hours to days (i.e., labile DOC, Hansell, 2013), some DOC compounds resist degradation and accumulate in the ocean (Williams and Druffel, 1987). These recalcitrant DOC compounds can reach radiocarbon ages of more than 10,000 years (Follett et al., 2014), which indicates that they persist over several ocean mixing cycles of ~300–1,400 years each (Khatiwala et al., 2012). The reason for this recalcitrance of DOC compounds has not yet been identified. Mostly, it is assumed, that the stable DOC compounds have specific structural features that make them intrinsically resistant to microbial uptake. This notion is supported by the observation that the radiocarbon age of DOC correlates with the structural features of DOC compounds, such as size and polarity (Loh et al., 2004; Benner and Amon, 2015; Walker et al., 2016). This view has been challenged by the introduction of the “dilution hypothesis” (Jannasch, 1967, 1994; Arrieta et al., 2015). The dilution hypothesis states that DOC is not structurally recalcitrant, but microbial uptake of DOC is limited by the low concentration of the individual compounds. This is supported by the observation, that recalcitrant DOC is taken up by bacteria if concentrated (Arrieta et al., 2015). Recently, it was demonstrated that concentration-limited uptake can explain the amount and longevity of DOC in the ocean (Mentges et al., 2019).
DOC in the ocean shows a characteristic vertical profile: high concentrations of ~55–80 mmolC/m3 near the sunlit surface in low latitudes, which rapidly decline at 100–200 m to relatively uniform concentrations of ~34–45 mmolC/m3 in the deep sea (Hansell et al., 2009; Hansell, 2013). The ubiquitously observed decline with depth is, together with latitudinal and seasonal changes, among the strongest marine gradients in DOC concentration. To describe the spatial distribution of dissolved organic matter (DOM, i.e., dissolved organic carbon, nitrogen, and phosphorus), various mathematical models have been developed. The distribution of DOM in the ocean is commonly reproduced by modeling three separate reactivity fractions (Hansell, 2013): (i) labile DOM, which is produced in the surface layer, where it fuels microbial growth, (ii) semi-labile DOM, which persists long enough to be exported to deeper waters, but is short-lived enough to show variations during one ocean mixing cycle, and (iii) refractory DOM, which is unavailable to microbial degradation in the deep sea and thus forms the “background” DOM concentration (e.g., Ogura, 1972; Anderson and Williams, 1999; Hopkinson et al., 2002; Luo et al., 2010; Keller and Hood, 2011).
The implementation of distinct DOM reactivity fractions reflects the prevalent assumption that DOM stability is governed by structural differences among compounds. Modeling studies assuming concentration-dependent uptake of DOM without assuming reactivity differences are rare (Wilson and Arndt, 2017; Wang et al., 2018; Mentges et al., 2019). DOM degradation is often modeled by assuming fixed decomposition rates, i.e., without including an explicit microbial population (e.g., Roussenov et al., 2006; Hansell et al., 2009, 2012; Letscher et al., 2015; Mostovaya et al., 2016). Such models describe the distribution of DOM very well, however they do not elucidate the mechanisms driving DOM decomposition. Mechanistic DOM models, which consider an explicit microbial population, also typically include several reactivity fractions (Anderson and Pondaven, 2003; Blackford et al., 2004; Moore et al., 2004; Grégoire et al., 2008; Luo et al., 2010) or a lability gradient (Pahlow and Vézina, 2003). Alternatively, low degradation rates of DOC can also be explained by nutrient limitation of microbes due to competition with phytoplankton near the ocean surface (Thingstad et al., 1997), e.g., in the phosphorus-limited Mediterranean (Zweifel et al., 1993). Such mechanistic models are rarely used in global scale applications (but see the model by Hasumi and Nagata, 2014, which includes microbes, bioavailable and refractory DOC).
Here, we model the spatial distribution of DOC under the central assumption of neutral uptake, i.e., equal degradability of all compounds. Thus, we assume that all DOC compounds are available for microbial uptake and neglect any reactivity differences among compounds. The rate of microbial uptake depends exclusively on the concentration of the substrate compounds, not on their structure. Our model describes only heterotrophic decomposition of DOC. Abiotic processes, such as photodegradation, are intentionally excluded, to isolate the influence of neutral heterotrophic decomposition on the spatial distribution of oceanic DOC. The model is composed of a biogeochemical model, describing the decomposition of DOC by microbes based on a model by Mentges et al. (2019), coupled to a 7 box ocean model adapted from Toggweiler (1999). Due to its simplicity, the box model allows for efficient testing of a variety of model modifications. Modeled DOC is produced mainly in the euphotic zone and exported to greater depths via deep-sea circulation. Additionally, DOC is produced to a small degree from sinking particles in the deep ocean, as well as microbially via release and lysis (Smith et al., 1992; Follett et al., 2014).
We test the influence of three model modifications on the spatial distribution of DOC in the Atlantic Ocean. First, we introduce a seasonal pattern of the DOC supply rate in the surface boxes, to reflect the effect of varying light intensity on DOC release by phytoplankton. Second, we couple microbial DOC uptake to seawater temperature, to account for the temperature-dependence of metabolic rates (Fukunaga and Russell, 1990; Nedwell and Rutter, 1994). Third, we introduce a vertical gradient in model parameters, to reflect the change in environmental conditions with water depth, e.g., nutrient availability, which affect microbial communities, and thus DOC production and remineralization (Roshan and DeVries, 2017).
We aim to find out whether neutral uptake can lead to a realistic spatial pattern of DOC concentration. Specifically, we ask: (i) what shapes the spatial distribution of DOC under a neutral uptake assumption: the local equilibrium of the biogeochemical interaction between DOC and microbes, the spatial distribution of DOC supply rates, or mixing of water masses? (ii) how do seasonal supply and temperature-dependent DOC uptake affect the spatial distribution of DOC? and (iii) how important are spatial differences in the physiological properties of the DOC degrading microbial community (e.g., growth efficiency, mortality)?
The aim of this study is not to prove or disprove the existence of structurally-recalcitrant molecules, which exist in the ocean for example in the form of black carbon (Preston and Schmidt, 2006; Dittmar and Paeng, 2009). The simulations were designed to test whether neutral uptake, i.e., equal degradability of all compounds, can resolve the observed spatial patterns of DOC concentration. We use a simple, computationally efficient model to test whether these scenarios reproduce observed DOC gradients, such as the latitudinal gradient and the decline of DOC concentration with depth.
2. Methods
To predict spatial concentration patterns of DOC and microbial biomass, we coupled a biogeochemical model to a simple spatially-resolved physical box model of the Atlantic Ocean.
2.1. The Biogeochemical Model
2.1.1. Derivation From the Network Model
The biogeochemical model is a simplified version of the DOC-microbe-network model (hereafter network model, Mentges et al., 2019). The network model describes the decomposition of DOC by assuming a network of m groups of degrading microbes and n DOC compound groups, where each group of microbes degrades and releases a unique suite of compounds. The biogeochemical model used here does not resolve the individual microbes Bi and compounds Dj. Instead, it describes their summed concentrations and (Figure 1A). It approximates the complex interactions in the network by assuming the interaction of average compounds with average microbes, i.e., the individual uptake- and release profiles of microbes are replaced by averaging across all microbial groups (for a detailed derivation of the biogeochemical model see Supplementary Equations 1–6). Thus, the simplified biogeochemical model predicts the total concentration of DOC D and the total microbial carbon concentration B through the following ordinary differential equations:
where n is the total number of different DOC compounds. A subset of nU compounds out of n is on average available to each individual microbe. Collectively, microbes can degrade all DOC compounds. DOC uptake is described by an approximation of the Michaelis-Menten kinetic for low DOC concentrations, with the maximum uptake rate ρ and the half-saturation constant κ. From the DOC uptake, a fraction η is fixed into microbial biomass. The fraction β(1−η) of uptake is released back to the DOC pool. The remaining fraction of carbon (1−β)(1−η) is respired, i.e., permanently transferred to the dissolved inorganic carbon pool I. DOC is supplied from non-microbial sources at a constant rate s, e.g., from primary production or particle dissolution. Lysis of microbes proportional to the mortality rate μ is assumed to contribute to the formation of DOC. Together, the carbon-based state variables (B, D, I) form a mass conserving carbon pool. The inorganic carbon concentration can thus be inferred from the two main state variables B and D, therefore I is not shown in the results. The parameters of the biogeochemical model were chosen according to the default parameterization of the network model (Mentges et al., 2019), i.e., n = 100, nU = 3, η = 0.2, β(1−η) = 0.14, ρ = 1 d−1, κ = 10 mmolC/m3, and μ = 0.02 d−1.
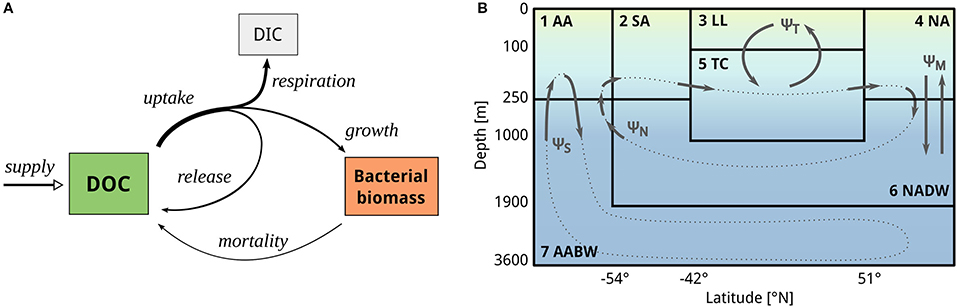
Figure 1. Scheme of the two model compartments. (A) The simplified DOC-microbe-interaction model, based on Mentges et al. (2019), predicts the concentration of DOC, the carbon concentration of microbial biomass, and the concentration of inorganic carbon (not shown in results). Microbes take up DOC, partially convert it to inorganic carbon, partially release it back to the DOC pool, and fix the remaining carbon into microbial biomass. DOC is supplied at a fixed rate from primary production. This simplified DOC-microbe-interaction model is coupled to (B) a seven box model, adapted from Toggweiler (1999). The box model comprises four surface boxes (AA, Antarctic surface water; SA, Sub-Antarctic surface water; LL, Low-latitude surface water, NA, North Atlantic surface water) and three deep boxes (TC, Thermocline; NADW, North Atlantic deep water; AABW, Antarctic Bottom Water). DOC and microbial biomass are transported from one box to another along four circulation pathways based on the overturning circulation: deep convective mixing in the North Atlantic ΨM, the ventilation of the thermocline ΨT, and the thermohaline deep circulation in the northern and southern hemispheres ΨN, ΨS (dotted lines), approximating the formation rates of NADW and AABW, respectively. The rate of DOC supply from primary production is specific to each box. Note that the axes are non-linearly scaled for illustration purposes.
The simplifications applied to the original network model largely conserve its behavior. The simplified biogeochemical model reproduces the long-term dynamics of the original network model; and the two models agree closely in their sensitivity to parameter variations (for a comparison see Supplementary Figures 1–3, note that deviations in the time of equilibration can occur between the network and the simplified model, see Supplementary Figure 1). Therefore, the simplified geochemical model can be considered an appropriate and computationally efficient approximation of the original network model.
2.1.2. Local Equilibria of the Biogeochemical Model
The equilibrium points of the biogeochemical model (Equations 3–4) represent the local long-term carbon concentrations reached in a single, uncoupled box (i.e., in a scenario without circulation, for the derivation and detailed interpretation see Supplementary Material).
The equilibrium biomass concentration B* (Equation 3) is constrained by mortality and respiration, while it is proportional to parameters that promote microbial growth, i.e., the supply rate of DOC s and the microbial growth efficiency η (note that there is another non-zero equilibrium state in the model for s = 0, i.e., if no DOC is supplied, microbes go extinct and leave behind residual DOC, see Supplementary Figure 4).
The equilibrium DOC concentration D* (Equation 4, see also Mentges et al., 2019) essentially reproduces results from the well-known resource competition theory of Tilman: Analogous to the R* value, that gives “the levels to which each competitor can reduce a single limiting resource” (Tilman, 2007), the D* value represents the minimum DOC concentration that can be reached by biological degradation. It is determined by three ratios: The ratio of the mortality rate to the growth efficiency (i.e., the ratio of carbon loss to carbon gain), the ratio of the half-saturation constant to the uptake rate (i.e., microbial affinity, Reay et al., 1999), and the ratio of the total diversity of compounds to the number of compounds that are taken up per microbial unit (i.e., the inverse fraction of DOC compounds that are taken up by an average bacterium). This equilibrium is stable (see Supplementary Material for the stability analysis), indicating that, after small perturbations, the system will return to the steady-state.
2.2. The Physical Box Model
The biogeochemical model was coupled to an ocean box model, adapted from a study by Toggweiler (1999). The box model connects seven distinct water masses (“boxes”) through four conceptually separate flows representing the overturning circulation. Therefore, it is computationally very efficient and can be used to simulate very long time scales of 10,000 years or longer (Matsumoto et al., 2008). The box model we use here comprises four surface boxes, which cover distinct latitudinal ranges, and three deeper boxes of different depth (Table 1). It predicts the carbon concentration of DOC and microbes per cubic meter of sea water. The box model was parameterized to reflect the processes in the global ocean (e.g., volume of the global ocean). Carbon is transported along four circulation pathways, based on a simplified version of the Atlantic overturning circulation: wind-driven ventilation of the thermocline from the low-latitude surface ΨT, deep convective mixing (2-way vertical exchange) in the North Atlantic ΨM, and the buoyancy-driven deep ocean circulation from the North ΨN and from the South ΨS (Figure 1B). The circulation is implemented using a matrix defining the transported water volumes per day between boxes (for the circulation matrix Ψ see Supplementary Table 1). The biogeochemical model equations are thus extended by a specific circulation term for each box (see Supplementary Equations 7–9, for box volumes and residence times see Supplementary Table 2). Further, each box receives a tailored amount of DOC supply from primary production (see below, section 2.3). All other biological and chemical parameters are equal across the boxes by default.
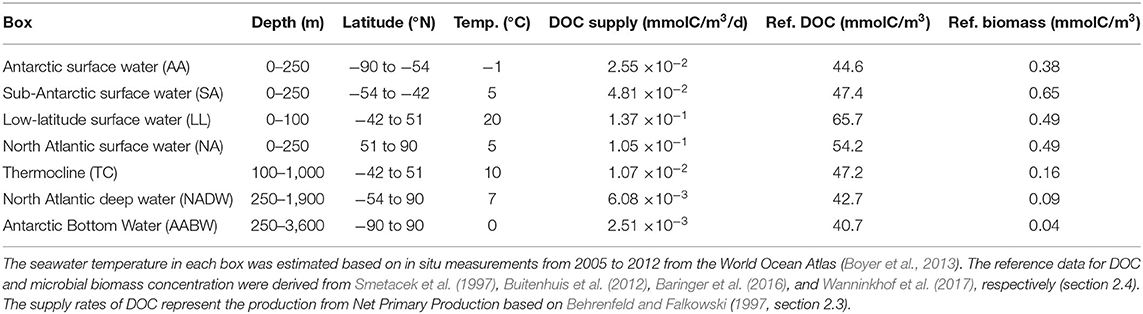
Table 1. Properties of the seven boxes from the box model.
2.3. DOC Supply Rate
We assume a constant supply of DOC, i.e., DOC is produced continuously from non-heterotrophic sources, such as primary production and particle dissolution. For each box x, we estimated the supply rate of DOC sx (Table 1). The supply rate in the surface boxes was derived based on approximations of net primary production (NPP) of the year 2016 from the ocean productivity website of the Oregon State University (Behrenfeld and Falkowski, 1997, www.science.oregonstate.edu/ocean.productivity/). The global NPP data were averaged over a longitudinal range from −40°N to 0° and the latitudinal ranges of the surface boxes, yielding NPP of ~190, 360, 410, 790 mgC/m2/d for the Antarctic, Sub-Antarctic, low latitude and North Atlantic box, respectively. From these NPP values we estimated DOC production in the surface boxes, applying a factor of 0.4 for the production of DOC (Williams, 2000). The supply rates of DOC in the deep boxes (i.e., supply of DOC in the deep from sinking particles, this carbon flux contributes to balancing DOC degradation in equilibrium) were chosen such that the equilibrium value of microbial biomass corresponds to the reference microbial biomass concentrations (i.e., field observations for comparison, see Table 1). We chose to optimize the supply to reflect microbial biomass concentrations in the deep sea rather than exactly matching published estimates of total DOC production rates, because we consider measurements of microbial biomass concentration better constrained, as there are direct measurements available for microbial biomass. To reproduce natural microbial biomass concentrations in the deep ocean, our model requires double the currently estimated deep DOC supply. The total DOC supply in the boxes sums up to a global rate of ~50 PgC/y, thus to about twice the published estimates (25 PgC/y, Hansell, 2013), this is possibly because part of DOC is so quickly taken up after release that is not recovered in many incubation experiments. Similarly, Arístegui et al. (2009) reported that their estimated microbial carbon demand in the deep sea was roughly twice as high as current estimates of DOC supply. The authors state that estimates of DOC supply based on sediment traps might severely underestimate the true supply (Herndl and Reinthaler, 2013), and that previous estimates often neglect the influence of migrant metazoans and suspended particles in the deep ocean carbon budget. The magnitude of supply rates in the model exclusively affects bacterial biomass concentrations, while equilibrium DOC concentrations are independent of the DOC supply rate (for sensitivity of the model to the rate of supply, see Supplementary Figure 7).
2.4. Reference Data for DOC and Microbial Biomass
Reference DOC concentrations for each box (i.e., field observations for comparison to model results, see Table 3 and Figures 3A,B) were extracted from the CLIVAR Repeat Section A16N and A16S cruises in the Atlantic Ocean (Baringer et al., 2016; Wanninkhof et al., 2017). Sample depth was approximated from sea water pressure using the Gibbs Sea Water Oceanographic toolbox (McDougall and Barker, 2011). The DOC values were averaged over the latitudinal ranges of the boxes (Table 1). Reference microbial carbon concentrations for each box (see Supplementary Table 4) were compiled from Buitenhuis et al. (2012) for latitudes North of 5°S and Smetacek et al. (1997) for Southern latitudes. Sample values were averaged over >30 samples for Antarctic and Sub-Antarctic surface boxes, and >1,000 samples for the other boxes, respectively.
2.5. Modifications to the Box Model
We applied three modifications to the box model, to test whether they increase the agreement of model results with field observations. Hence, we adapted the model to include seasonal DOC supply, temperature-dependent DOC uptake, and depth-dependent physiology. To study the individual effect of the three modifications, they were applied to the model separately (for a simultaneous application of the modifications, see Supplementary Figure 5, Supplementary Table 5).
2.5.1. Seasonal Supply
The natural rate of DOC supply from primary production varies seasonally with the light intensity, availability of nutrients and other factors. To partly reproduce this temporal variability in a model modification, a seasonal pattern was imposed on the DOC supply rates at the surface. The seasonal pattern is based on the monthly averages of NPP, yielding elevated DOC supply rates from December to January in the (Sub-) Antarctic, and highest supply rates from June to August in the North Atlantic (Figure 2A). To get a smooth transition between individual time points, we interpolated between monthly averages. The supply rates in the deep boxes were assumed to be constant throughout the seasons.
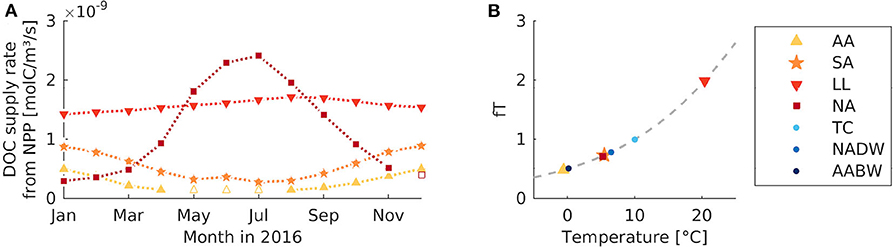
Figure 2. Modifications to the model including seasonal supply or temperature dependent uptake. (A) Monthly DOC supply rate in the four surface boxes, estimated based on NPP data from Behrenfeld and Falkowski (1997, section 2.3). Open symbols indicate interpolated values. (B) Temperature response factor for microbial uptake as a function of box temperature (AA, Antarctic surface water; SA, Sub-Antarctic surface water; LL, Low-latitude surface water; NA, North Atlantic surface water; TC, Thermocline; NADW, North Atlantic deep water; AABW, Antarctic Bottom Water). The gray dashed line indicates the response function as defined by Blackford et al. (2004).
2.5.2. Temperature-Dependent DOC Uptake
The metabolic rates of microbes are known to be strongly temperature-dependent; for example the microbial uptake rate for organic substrates generally increases with temperature (Fukunaga and Russell, 1990; Nedwell and Rutter, 1994). The temperature-dependence of microbial production shows strong vertical gradients, which has been suggested to be related to the vertical gradient in DOC recalcitrance (Lønborg et al., 2016). In the standard model, water temperature does not influence the microbial degradation of DOC. Therefore, we accounted for this in a model modification, by multiplying the uptake rate with a temperature response factor ft. The temperature response factor is defined as (Blackford et al., 2004). It depends on the temperature tx in the local box x (estimated based on in situ measurements from 2005 to 2012 from the World Ocean Atlas, Boyer et al., 2013, see Table 1), the reference temperature (, Blackford et al., 2004), and the Q10 temperature coefficient, which measures how fast the rate changes with temperature (Q10 = 2 for heterotrophic microbes, Blackford et al., 2004).
At box temperatures between −1 and 20° C (Table 1), ft equals 0.48, 0.73, 1.99, 0.71 for the surface boxes (AA, SA, LL, NA), and 1.00, 0.78, 0.51 for the deeper boxes (TC, NADW, AABW), respectively (Figure 2B). At a temperature response factor of ft <1 the microbial uptake rate is decreased with respect to the default simulation. In comparison to the default model set-up, the uptake rate is thus increased in the low-latitude box, remains unchanged in the thermocline box, and is decreased in all other boxes.
2.5.3. Depth-Dependent Physiology
Environmental conditions at the sea surface differ from the deep sea, e.g., light, supply of organic matter, nutrient availability, temperature, and pressure. As a consequence, several biogeochemical parameters show considerable changes with depth. Microbial growth efficiency η is lower near the surface compared to the deep sea, due to the relation between maintenance metabolism and water temperature (Rivkin and Legendre, 2001; Hall et al., 2008). The rate of microbial mortality μ (i.e., lysis or spontaneous death) is higher near the surface, due to the influence of a higher ratio of virus-like particles to heterotrophic microbes (Arístegui et al., 2009), increased temperature (Servais et al., 1985), and a higher per capita rate of grazing (higher activity of, e.g., flagellates; Arístegui et al., 2009). The diversity of DOM compounds n, i.e., the number of metabolically different DOC compounds, is also higher near the surface. Molecular richness, i.e., the number of molecular formulas identified in DOM, has been shown to be stable throughout the ocean (Mentges et al., 2017). However, in the context of the model, diversity measures that are related to the substrates' concentration and structural diversity are more relevant, because DOC diversity in our model is defined as the number compound units that are structurally similar with respect to microbial uptake. Abundance-based and functional DOM diversity are higher near the ocean surface (Mentges et al., 2017). The number of DOC substrates utilized by an average microbe nU in contrast, is lower near the surface, as surface communities are known to be more specialized (Carlson et al., 2004). Compared to surface microbes, pressure-adapted deep sea microbes are able to utilize additional compounds due to high ectoenzymatic activity (Tamburini et al., 2002) and higher abundance of transporters targeting aromatic compounds (Bergauer et al., 2018). Together, n and nU define the relative substrate specificity (n/nU): For a high relative substrate specificity, few substrates can be taken up in relation to the total DOC diversity. As n is higher and nU is lower, it follows that the relative substrate specificity is higher near the surface. This relative substrate specificity has been suggested to crucially determine long-term DOC concentrations (Mentges et al., 2019).
To represent these physiological depth gradients in the model, we altered the respective model parameters in the surface boxes compared to the deep boxes. In separate simulations, physiological parameters were multiplied by either a factor of 0.5 or 2 in the surface boxes, depending on whether they are increasing or decreasing with depth (Table 2). In the deeper boxes, all parameters were kept at their default values. We do not wish to imply that this doubling or halving of the parameter value is an accurate description of its natural vertical profile. We designed this model modification to test the general influence of a directional change of these parameter with depth on the distribution of DOC concentrations in the model. The resulting four simulations were very similar to each other with respect to the DOC concentration (see Supplementary Table 6), therefore they are considered interchangeable and results are presented and discussed together.
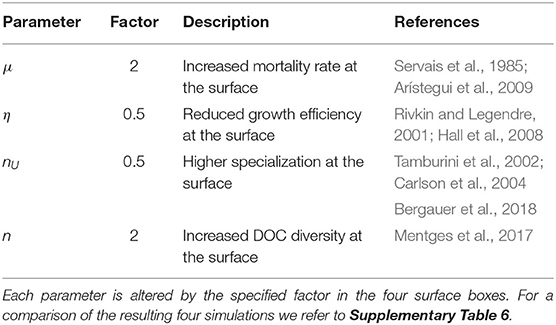
Table 2. Depth-dependent physiology.
2.6. Computational Details
The differential equations were solved numerically in MATLAB (Version 2015b, The MathWorks, Inc., Natick, Massachusetts, United States), using the stiff differential equation solver ode15s with the following options: absolute error tolerance of 1 × 10⁻¹⁸, relative error tolerance of 1 × 10⁻¹³, and all state variables were defined as non-negative. The time-step was chosen by the solver. To ensure equilibration of the system, all simulations were run for at least 1,000 simulation years.
3. Results
3.1. Default Box Model
The DOC concentrations in the default box model run were practically constant across all boxes (33.63–34.53 mmolC/m3, Figure 3C, Table 3, at DOC turnover times of 2, 1, 0.4, 0.6 years in the four surface boxes and 6, 10, and 24 years in the deep boxes, see Supplementary Table 3). The microbial biomass concentrations varied between 0.04–2.00 mmolC/m3. Highest biomass concentrations were found in the low-latitude box (ranging from −42 to 51 ° N), while lowest concentrations were found in the Antarctic bottom water (Figure 3D). The results of the default run closely match the local equilibria of the uncoupled boxes (i.e., B* and D*, Equations 3–4, see Table 3).
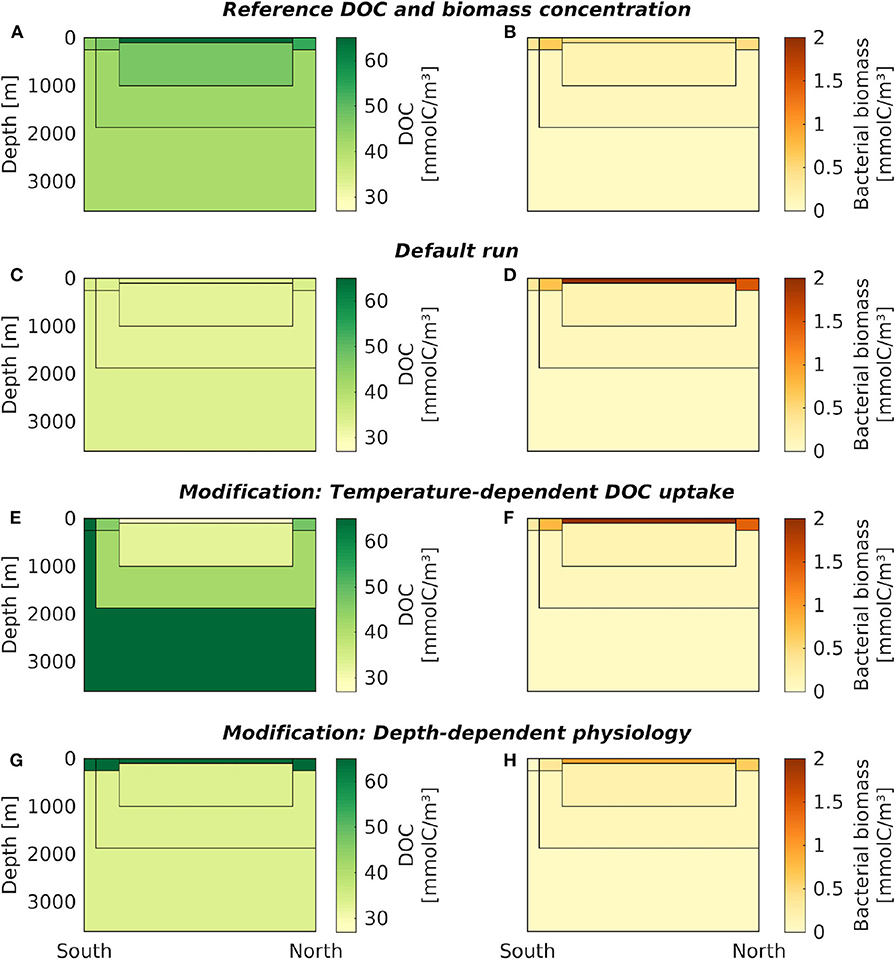
Figure 3. Carbon concentrations from the default box model and its modifications. DOC (left column) and microbial biomass (right column) concentrations are shown in the seven oceanic boxes, for: (A,B) the reference data, (C,D) the default box model run, (E,F) a model modification with temperature-dependent DOC uptake, and (G,H) a model modification with depth-dependent physiological parameters. For exact DOC concentrations at the end of each simulation, see Table 3, and Supplementary Table 4 for microbial biomass, respectively. The results of the model modification with seasonal supply are shown over time in Figure 4; averaged over one year they closely match the default model run shown in (A,B).
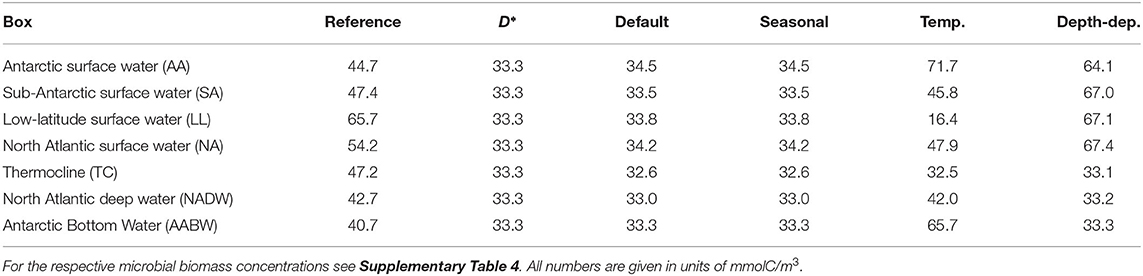
Table 3. DOC concentration from reference data, the equilibrium prediction by the biogeochemical model (D*), and from four box model simulations: the default set-up, a model modification with seasonal supply, a model modification with temperature-dependent uptake rate, and a model modification with depth-dependent physiological parameters.
3.2. Modification: Seasonal Supply
The seasonal variability led to yearly oscillations of microbial biomass and DOC concentrations (Figure 4). The microbial biomass varied by a factor of <1.5 over the seasons. The strongest seasonal variation in DOC concentrations was found in the North Atlantic surface water (28–40 mmolC/m3). The seasonal variation exceeded the spatial variation of DOC among the boxes. The time-averaged DOC and microbial biomass were close to the concentrations found in the default model simulation (Table 3).
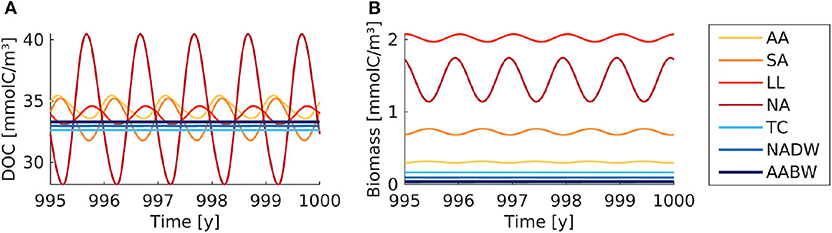
Figure 4. Box model modification with seasonal supply. (A) DOC and (B) microbial biomass concentration are shown over simulation time. The supply rate is interpolated between monthly average values. The colored lines indicate the concentrations in the seven boxes (AA, Antarctic surface water; SA, Sub-Antarctic surface water; LL, Low-latitude surface water; NA, North Atlantic surface water; TC, Thermocline; NADW, North Atlantic deep water; AABW, Antarctic Bottom Water).
3.3. Modification: Temperature-Dependence
The introduction of temperature-dependent DOC uptake produced spatially variable DOC concentrations, ranging from 16 to 72 mmolC/m3 in the boxes (Figure 3E). In this model modification, simulated DOC concentrations increase with sea water depth. The DOC concentration in the simulated Antarctic bottom water was about four times higher than in the low-latitude surface water (~66 mmolC/m3, Table 3). The total DOC concentration was higher than in the default simulation, because the local temperature in most boxes was lower than the reference temperature, hence decreasing the microbial uptake rate. While the spatial distribution of DOC was affected by the temperature-dependence, the microbial biomass remained largely unchanged from the default simulation (Figure 3F). Microbial biomass levels are independent from the rate of DOC uptake, as the biomass equilibrium B* of the biogeochemical model does not include the uptake rate ρ (Equation 3; for DOC turnover times see Supplementary Table 3).
3.4. Modification: Depth-Dependent Physiology
To account for variations of microbial traits due to, e.g., pressure, nutrient concentration, or food web structure, we altered model parameters in the surface boxes. This modification yielded a vertical gradient in DOC concentrations: high DOC concentrations near the surface (64–67 mmolC/m3) and low DOC concentrations in the deeper boxes (~33 mmolC/m3, Figure 3G). Microbial biomass concentrations were highest in the low-latitude surface box (0.94 mmolC/m3), declining toward the poles and with depth (Figure 3H). Lowest microbial biomass concentrations were found in the Antarctic bottom water (0.04 mmolC/m3, see Supplementary Table 4).
4. Discussion
4.1. Default Box Model
Although we assumed neutral uptake and lability of DOC, a recalcitrant carbon pool emerged from the default simulation, which was present throughout the virtual ocean. The size of this pool is similar to the ubiquitously observed deep-ocean background concentration of DOC (Hansell et al., 2009; Hansell, 2013). It corresponds to the equilibrium DOC level (D*) reached when the uptake of diverse DOC compounds balances microbial mortality (Mentges et al., 2019). This simulation result does not imply that structurally-recalcitrant DOC compounds (such as black carbon, Preston and Schmidt, 2006; Dittmar and Paeng, 2009) do not exist. Instead, it demonstrates that the major features of the observed global DOC distribution can be reproduced assuming neutral uptake, i.e., neglecting reactivity differences among compounds.
The default simulation includes a spatially-variable distribution of DOC supply rates as an environmental gradient. The rates of DOC supply decline from the surface to the deep sea. Such a decline of DOC production rates is often assumed to cause the ubiquitously observed decline in DOC concentrations with depth, e.g., new primary production has been reported to drive Atlantic DOC distributions (Romera-Castillo et al., 2016). However, in our default simulation, the DOC concentrations do not decline toward the deep, but are uniform throughout the virtual ocean. Thus, for the present model formulation, we do not see an impact of the DOC supply rate on the spatial distribution of DOC concentrations (as can be seen in the D*, Equation 4, which does not include a supply term). Microbial biomass concentrations, in contrast, are strongly influenced by the DOC supply rate (Equation 3).
DOC concentrations are independent of the rate of DOC supply in our model, because the individual boxes reach their local equilibrium, and this equilibrium concentration D* is independent of the DOC supply rate s (Equation 4, for the sensitivity of DOC and microbial biomass in the seven boxes to the supply rate see Supplementary Figure 7). The time scale of mixing in the box model is long enough to allow for equilibration of the biogeochemical processes within individual boxes. The turnover time of water in the boxes ranges between 4 and 516 years, exceeding the average time scale of DOC turnover in all boxes (Supplementary Table 3). Only very small deviations of DOC concentration from the equilibrium (Table 3) occur due to the influence of the overturning circulation. Increasing the circulation rate introduces deviations from equilibrium (<10 mmolC/m3, see Supplementary Figure 8).
In our model, the rate of DOC supply s does not affect the long-term DOC concentration D*. This lack of direct dependency might seem counter-intuitive at first, but is a common characteristic in resource(DOC)-consumer(microbe)-models like the one presented here: The model quickly reaches equilibrium in all boxes, and this equilibrium concentration is independent from the supply rate as shown in our equilibrium analysis (section 2.1.2). Consequently, these results are in agreement with models with a similar basic consumer-resource-structure: Pahlow and Vézina (2003) found that the long-term accumulation of DOM in the ocean is controlled by characteristics of microbial DOM utilization, while phytoplankton-associated terms have little influence. Also, Wilson and Arndt (2017) showed that assuming dilution-limited DOC degradation, deep ocean DOC concentrations in a 2-box-model were independent of the amount of DOC production. In another model study by Tian et al. (2000), the rate of primary production did affect DOC concentrations. However, their model differs in two aspects from ours: (1) they include a lower threshold of microbial DOC uptake (κ, for the sensitivity of model results to this parameter see Supplementary Figures 2, 3), which could explain why additional algal-derived DOC did not lead to an increase of the microbial population, and (2) their model structure differs as predation exerts an additional top-down effect on microbes, which is connected to primary production. Our results thus suggest that if the control of bacteria and archaea on DOC is purely bottom-up, equilibrium DOC concentration is independent from supply.
Here, we focused our efforts on the modeling of DOC and microbial biomass concentrations using a computationally efficient spatially-resolved simulation model. Another valuable constraint on DOC cycling is represented by the radiocarbon age, which is included in the original network model (Mentges et al., 2019). The network model reproduced the characteristic age spectrum of DOC by assuming that only a limited subset of DOC compounds are supplied by phytoplankton. This distinction cannot be made in the present, simplified biogeochemical model, which groups all DOC compounds into a single pool. Accordingly, the turnover time of DOC in the simplified model is much lower than observed radiocarbon ages of DOC (see Supplementary Table 3; Follett et al., 2014). Thus, the methodological approach outlined here could be extended in future efforts to integrate neutral DOC uptake in a simulation model comprising radiocarbon age, as another important step toward understanding the millennial scale stability of DOC in the world's oceans. It is known that specific DOM compound classes have higher radiocarbon ages than others and some compounds classes are preferentially decomposed in incubation experiments (e.g., Benner and Amon, 2015). This has been interpreted as evidence for a mechanistic link between molecular structure and long-term reactivity of DOC (e.g., Walker et al., 2016). As an alternative or additional explanation, Mentges et al. (2019) proposed that the distance from production in the network of microbe-DOM-interactions determine radiocarbon age and long-term turnover.
4.2. Modification: Seasonal Supply
To mimic the seasonal variability of primary production, we introduced monthly changing supply rates in a model modification. This did not increase the plausibility of model results. DOC concentrations in the North Atlantic box drop in the beginning of the year below the observed range of DOC concentrations (~28 mmolC/m3 in the box, vs. ~34 mmolC/m3 observed, Hansell, 2013). The microbial community cannot fully equilibrate and adapt to the extreme supply rates in summer and winter months, due the high frequency of the seasonal supply, i.e., the time-scale of the forcing fluctuations is shorter than the time-scale needed for biogeochemical equilibration. Therefore, the seasonal variation of microbial biomass is lower than the seasonal variation of the supply rate (factor of about 1.5 vs. 4, whereas for slower variation of the supply biomass varies proportionally, see Supplementary Figure 6). The spatial variations among boxes were smaller than the seasonal variations within boxes. The time-averaged DOC concentrations were the same as in the default run, showing no considerable variations with latitude or depth. Therefore, the model modification failed to reproduce the oceanic range of DOC concentrations.
In our model, spatial patterns of DOC do not result from a temporal variability of primary production. This independence of seasonal DOC supply from DOC concentration is in agreement with observations on seasonal and interannual time scales. Church et al. (2002) report a weak correlation of DOC and primary production rate on interannual time scales (R2 = 0.16) at station ALOHA in the subtropical gyre of the North Pacific. They rather attribute changes in DOC concentration to the community composition, which agrees with our findings that the DOC concentration is most sensitive to parameters describing microbial DOC uptake. Similarly, Hansell and Carlson (1998) report a weak correlation of DOC and primary production (R2 = 0.15, correlation calculated based on the published data) on seasonal time scales in the Sargasso Sea. Seasonal accumulation of semi-labile DOC can also result from a competition for nutrients of microbes and phytoplankton (Thingstad et al., 1997), which is not resolved by our microbe-DOC-model.
4.3. Modification: Temperature-Dependence
To simulate the effect of temperature on the microbial metabolic rates, we introduced a temperature-dependent DOC uptake rate in a model modification. Such a temperature-dependence of metabolic rates has been suggested as a possible cause for DOC gradients in the North Atlantic (Bendtsen et al., 2002). In contrast, in our model, the introduction of temperature-dependent microbial DOC uptake did not increase the plausibility of the model results. Although this model modification reproduced the naturally observed range of DOC concentrations (30–70 mmolC/m3, Table 3), the spatial distribution deviated strongly from observed oceanic distribution patterns of DOC: In the surface ocean, highest concentrations of DOC are typically observed in the tropics and subtropics, decreasing toward the poles (Roshan and DeVries, 2017), whereas in the modified model simulation, DOC concentration increased from the low latitudes toward the poles. Moreover, DOC concentrations in the model increase with depth, in contrast to observations (Hansell et al., 2009; Hansell, 2013).
The implemented temperature dependency increases the uptake rate with increasing temperature. Our equilibrium analysis (Equation 4) shows that an increased uptake rate results in a lower DOC equilibrium concentration. As temperature, and hence the increase in uptake rate, is highest in the tropical surface oceans, our model produces low DOC concentrations in tropical surface boxes. While uptake rates might strongly depend on temperature for a single organism or a local community (Blackford et al., 2004), the maximum uptake rate of the locally best adapted community on a global scale might not necessarily have the same dependency. Thomas et al. (2012) showed that while optimum temperatures did vary on a latitudinal gradient for the locally best adapted phytoplankton strain, the actual maximum growth rate for each optimum temperature did not differ strongly. Given that also other environmental conditions influence the growth of microbes, our results suggest that factors other than the temperature-dependence of the uptake rate are more relevant to the global distribution of DOC. Also, we assume a temperature-dependence of DOC uptake alone, while assuming that microbial mortality and lysis are independent of sea water temperature. We tested how a temperature-dependent mortality term would affect model results (see Supplementary Figure 9) and found that the results were similar to the default simulation if the same Q10 temperature coefficient is assumed for uptake and mortality, as in this case the effects cancel each other out. The effect of temperature on the spatial distribution of DOC thus critically depends on whether there is a difference in the temperature-dependence of microbial uptake compared to mortality.
4.4. Modification: Depth-Dependent Physiology
A central assumption of our model is the total neutrality of DOC and microbes. We thus assume for example that all microbes show an equally high degradation capacity, mortality, and overall uptake rate. While preserving this neutrality within a community, we varied the physiological properties among communities in a model modification, i.e., between the surface and the bathypelagic.
Compared to the other box model simulations, this modification reproduced the observed DOC concentrations best. Assuming one of the proposed physiological gradients between the surface and the deep sea, i.e., lower growth efficiency, higher relative substrate specificity, or higher microbial mortality at the surface, increased the plausibility of the model results: The overall oceanic DOC range was similar to observed values (30–68 mmolC/m3 for modeled DOC, 30–80 mmolC/m3 for oceanic DOC, Roshan and DeVries, 2017).
In this modification, two distinct DOC equilibrium values D* exist. In the deep boxes, all model parameters are unchanged to the standard model, therefore, the equilibrium remains at 33 mmolC/m3). In the surface boxes, the equilibrium DOC is doubled (as either the numerator of Equation 4 is multiplied by 2 or the denominator by 0.5, depending on the parameter changed, see Table 2), corresponding to 66 mmolC/m3.
The model modification produced distinct DOC concentrations between surface and deeper water boxes. Thus, based on known gradients of microbe physiology and neglecting reactivity differences in DOC, the natural gradient of oceanic DOC was reproduced. Here we only use two distinct values for the surface and the deep sea boxes. Therefore, the variation among the surface boxes and among deep water boxes are small. This could likely be further improved by using a finer distinction of physiological parameters among the boxes.
4.5. Conclusions
We modeled the oceanic distribution of DOC and microbial biomass using a simple spatially-resolved biogeochemical box model. The central assumption of the model is neutral DOC uptake, i.e., that all DOC compounds are easily degradable by a heterotrophic microbial population. Spatial variability is incorporated into the model in the form of varying DOC supply rates (i.e., total production of DOC from primary production and dissolution of particles). This simple model of neutral DOC uptake produced a recalcitrant carbon pool of 33 mmolC/m3, which was present throughout the entire virtual ocean. The spatial distribution of DOC and microbes in the model was determined by the local equilibrium of biogeochemical processes, whereas it was independent of the circulation pathways of sea water and the rate of DOC supply. We find that a spatial gradient in DOC supply rate alone did not produce realistic patterns of DOC concentration. The plausibility of model results was not enhanced by seasonally-varying supply or temperature-dependent DOC uptake rates. Instead, the spatial distribution of DOC in the model is primarily controlled by physiological characteristics of DOC degrading microbes. Therefore, the best agreement with observations was reached when spatially heterogeneous physiological parameters were assumed, i.e., higher mortality for surface microbes reflecting higher grazing pressure, a higher relative substrate-specificity, or lower growth efficiency of surface microbes. Our model suggests that oceanic DOC concentrations decrease with depth, because the physiology of the microbes changes, e.g., due to temperature, pressure, and grazing intensity, or due to the decline of molecular diversity of DOC with depth. We conclude that neutral DOC uptake can lead to realistic spatial patterns of DOC concentration, if vertical gradients of physiological parameters of the microbial community or DOC diversity are accounted for.
Data Availability Statement
The computer code to generate the data presented in this study can be found in online repositories. The names of the repository/repositories and accession number(s) can be found below: github.com/andreamentges/DOC-microbe-boxmodel.
Author Contributions
TD and CD conceived the study. AM and CD implemented the model. AM wrote the first draft of the manuscript. SL wrote sections of the manuscript. All authors contributed to the article and approved the submitted version.
Funding
This work was funded by the Ministry of Science and Culture of Lower Saxony (Niedersächsisches Ministerium für Wissenschaft und Kultur) within the research training program Interdisciplinary approach to functional biodiversity research and the German Academic Exchange Service (DAAD) through a post-graduate scholarship. CD was supported by a grant from the Gordon and Betty Moore Foundation (GBMF#3775).
Conflict of Interest
The authors declare that the research was conducted in the absence of any commercial or financial relationships that could be construed as a potential conflict of interest.
The reviewer CF declared a past co-authorship with one of the authors CD to the handling editor.
Acknowledgments
We thank Helmut Hillebrand for his valuable contribution to model interpretation. This study includes results that were presented first in a doctoral thesis (Mentges, 2018).
Supplementary Material
The Supplementary Material for this article can be found online at: https://www.frontiersin.org/articles/10.3389/fmars.2020.549784/full#supplementary-material
References
Anderson, T. R., and Pondaven, P. (2003). Non-redfield carbon and nitrogen cycling in the Sargasso sea: pelagic imbalances and export flux. Deep-Sea Res. I Oceanogr. Res. Pap. 50, 573–591. doi: 10.1016/S0967-0637(03)00034-7
Anderson, T. R., and Williams, P. J. (1999). A one-dimensional model of dissolved organic carbon cycling in the water column incorporating combined biological-photochemical decomposition. Glob. Biogeochem. Cycles 13, 337–349. doi: 10.1029/1999GB900013
Arístegui, J., Gasol, J. M., Duarte, C. M., and Herndl, G. J. (2009). Microbial oceanography of the dark ocean's pelagic realm. Limnol. Oceanogr. 54, 1501–1529. doi: 10.4319/lo.2009.54.5.1501
Arrieta, J. M., Mayol, E., Hansman, R. L., Herndl, G. J., Dittmar, T., and Duarte, C. M. (2015). Dilution limits dissolved organic carbon utilization in the deep ocean. Science 348, 331–333. doi: 10.1126/science.1258955
Baringer, M., Bullister, J., Feely, R., Wanninkhof, R., Millero, F., Hansell, D., et al. (2016). Carbon Dioxide, Hydrographic, and Chemical Data Obtained During the R/V Ronald H. Brown Cruise in the Atlantic Ocean on GO-SHIP/CLIVAR Repeat Hydrography Section A16N (Aug. 03–Oct. 01, 2013). Data set. Asheville, NC: NOAA National Centers for Environmental Information.
Behrenfeld, M. J., and Falkowski, P. G. (1997). Photosynthetic rates derived from satellite-based chlorophyll concentration. Limnol. Oceanogr. 42, 1–20. doi: 10.4319/lo.1997.42.1.0001
Bendtsen, J., Lundsgaard, C., Middelboe, M., and Archer, D. (2002). Influence of bacterial uptake on deep-ocean dissolved organic carbon. Glob. Biogeochem. Cycles 16, 12–74. doi: 10.1029/2002GB001947
Benner, R., and Amon, R. M. W. (2015). The size-reactivity continuum of major bioelements in the ocean. Annu. Rev. Mar. Sci. 7, 185–205. doi: 10.1146/annurev-marine-010213-135126
Bergauer, K., Fernandez-Guerra, A., Garcia, J. A. L., Sprenger, R. R., Stepanauskas, R., Pachiadaki, M. G., et al. (2018). Organic matter processing by microbial communities throughout the Atlantic water column as revealed by metaproteomics. Proc. Natl. Acad. Sci. U.S.A. 115, E400–E408. doi: 10.1073/pnas.1708779115
Blackford, J. C., Allen, J. I., and Gilbert, F. J. (2004). Ecosystem dynamics at six contrasting sites: a generic modelling study. J. Mar. Syst. 52, 191–215. doi: 10.1016/j.jmarsys.2004.02.004
Boyer, T., Antonov, J. I., Baranova, O. K., Coleman, C., Garcia, H. E., Grodsky, A., et al. (2013). World Ocean Database 2013, NOAA Atlas NESDIS 72, Version 2. Data set. Asheville, NC: NOAA National Centers for Environmental Information.
Buitenhuis, E. T., Li, W. K. W., Lomas, M. W., Karl, D. M., Landry, M. R., and Jacquet, S. (2012). Picoheterotroph (Bacteria and Archaea) biomass distribution in the global ocean. Earth Syst. Sci. Data 4, 101–106. doi: 10.5194/essd-4-101-2012
Carlson, C. A., Giovannoni, S. J., Hansell, D. A., Goldberg, S. J., Parsons, R., and Vergin, K. (2004). Interactions among dissolved organic carbon, microbial processes, and community structure in the mesopelagic zone of the northwestern Sargasso sea. Limnol. Oceanogr. 49, 1073–1083. doi: 10.4319/lo.2004.49.4.1073
Church, M. J., Ducklow, H. W., and Karl, D. M. (2002). Multiyear increases in dissolved organic matter inventories at station ALOHA in the North Pacific subtropical gyre. Limnol. Oceanogr. 47, 1–10. doi: 10.4319/lo.2002.47.1.0001
Dittmar, T., and Paeng, J. (2009). A heat-induced molecular signature in marine dissolved organic matter. Nat. Geosci. 2, 175–179. doi: 10.1038/ngeo440
Follett, C. L., Repeta, D. J., Rothman, D. H., Xu, L., and Santinelli, C. (2014). Hidden cycle of dissolved organic carbon in the deep ocean. Proc. Natl. Acad. Sci. U.S.A. 111, 16706–16711. doi: 10.1073/pnas.1407445111
Fukunaga, N., and Russell, N. J. (1990). Membrane lipid composition and glucose uptake in two psychrotolerant bacteria from Antarctica. J. Gen. Microbiol. 136, 1669–1673. doi: 10.1099/00221287-136-9-1669
Grégoire, M., Raick, C., and Soetaert, K. (2008). Numerical modeling of the central Black Sea ecosystem functioning during the eutrophication phase. Prog. Oceanogr. 76, 286–333. doi: 10.1016/j.pocean.2008.01.002
Hall, E. K., Neuhauser, C., and Cotner, J. B. (2008). Toward a mechanistic understanding of how natural bacterial communities respond to changes in temperature in aquatic ecosystems. ISME J. 2, 471–481. doi: 10.1038/ismej.2008.9
Hansell, D. A. (2013). Recalcitrant dissolved organic carbon fractions. Annu. Rev. Mar. Sci. 5, 421–445. doi: 10.1146/annurev-marine-120710-100757
Hansell, D. A., and Carlson, C. A. (1998). Net community production of dissolved organic carbon. Glob. Biogeochem. Cycles 12, 443–453. doi: 10.1029/98GB01928
Hansell, D. A., Carlson, C. A., Repeta, D. J., and Schlitzer, R. (2009). Dissolved organic matter in the ocean: a controversy stimulates new insights. Oceanography 22, 202–211. doi: 10.5670/oceanog.2009.109
Hansell, D. A., Carlson, C. A., and Schlitzer, R. (2012). Net removal of major marine dissolved organic carbon fractions in the subsurface ocean. Glob. Biogeochem. Cycles 26:GB1016. doi: 10.1029/2011GB004069
Hasumi, H., and Nagata, T. (2014). Modeling the global cycle of marine dissolved organic matter and its influence on marine productivity. Ecol. Modell. 288, 9–24. doi: 10.1016/j.ecolmodel.2014.05.009
Hedges, J. I. (2002). “Why dissolved organics matter,” in Biogeochemistry of Marine Dissolved Organic Matter, Chapter 1, eds D. A. Hansell and C. A. Carlson (New York, NY: Academic Press), 1–33. doi: 10.1016/B978-012323841-2/50003-8
Herndl, G. J., and Reinthaler, T. (2013). Microbial control of the dark end of the biological pump. Nat. Geosci. 6, 718–724. doi: 10.1038/ngeo1921
Hopkinson, C. S., Vallino, J. J., and Nolin, A. (2002). Decomposition of dissolved organic matter from the continental margin. Deep-Sea Res. II 49, 4461–4478. doi: 10.1016/S0967-0645(02)00125-X
Jannasch, H. W. (1967). Growth of marine bacteria at limiting concentrations of organic carbon in seawater. Limnol. Oceanogr. 12, 264–271. doi: 10.4319/lo.1967.12.2.0264
Jannasch, H. W. (1994). The microbial turnover of carbon in the deep-sea environment. Glob. Planet. Change 9, 289–295. doi: 10.1016/0921-8181(94)90022-1
Keller, D. P., and Hood, R. R. (2011). Modeling the seasonal autochthonous sources of dissolved organic carbon and nitrogen in the upper Chesapeake Bay. Ecol. Modell. 222, 1139–1162. doi: 10.1016/j.ecolmodel.2010.12.014
Khatiwala, S., Primeau, F., and Holzer, M. (2012). Ventilation of the deep ocean constrained with tracer observations and implications for radiocarbon estimates of ideal mean age. Earth Planet. Sci. Lett. 325–326, 116–125. doi: 10.1016/j.epsl.2012.01.038
Letscher, R. T., Moore, J. K., Teng, Y. C., and Primeau, F. (2015). Variable C:N:P stoichiometry of dissolved organic matter cycling in the Community Earth System Model. Biogeosciences 12, 209–221. doi: 10.5194/bg-12-209-2015
Loh, A. N., Bauer, J. E., and Druffel, E. R. M. (2004). Variable ageing and storage of dissolved organic matter. Nature 430, 877–881. doi: 10.1038/nature02780
Lønborg, C., Cuevas, L. A., Reinthaler, T., Herndl, G. J., Gasol, J. M., Morán, X. A. G., et al. (2016). Depth dependent relationships between temperature and ocean heterotrophic prokaryotic production. Front. Mar. Sci. 3, 1–9. doi: 10.3389/fmars.2016.00090
Luo, Y. W., Friedrichs, M. A. M., Doney, S. C., Church, M. J., and Ducklow, H. W. (2010). Oceanic heterotrophic bacterial nutrition by semilabile DOM as revealed by data assimilative modeling. Aquat. Microb. Ecol. 60, 273–287. doi: 10.3354/ame01427
Matsumoto, K., Tokos, K. S., Price, A. R., and Cox, S. J. (2008). First description of the Minnesota Earth System Model for Ocean biogeochemistry (MESMO 1.0). Geosci. Model Dev. 1, 1–15. doi: 10.5194/gmd-1-1-2008
McDougall, T. J., and Barker, P. M. (2011). Getting Started With TEOS-10 and the Gibbs Seawater (GSW) Oceanographic Toolbox. Manual. Sydney, NSW: SCOR/IAPSO.
Mentges, A. (2018). Predicting dissolved organic carbon concentrations and molecular diversity in the ocean using mathematical model simulations (Ph.D. thesis), University of Oldenburg, Oldenburg, Germany.
Mentges, A., Feenders, C., Deutsch, C., Blasius, B., and Dittmar, T. (2019). Long-term stability of marine dissolved organic carbon emerges from a neutral network of compounds and microbes. Sci. Rep. 9, 1–13. doi: 10.1038/s41598-019-54290-z
Mentges, A., Feenders, C., Seibt, M., Blasius, B., and Dittmar, T. (2017). Functional molecular diversity of marine dissolved organic matter is reduced during degradation. Front. Mar. Sci. 4:194. doi: 10.3389/fmars.2017.00194
Moore, J. K., Doney, S. C., and Lindsay, K. (2004). Upper ocean ecosystem dynamics and iron cycling in a global three-dimensional model. Glob. Biogeochem. Cycles 18, 1–21. doi: 10.1029/2004GB002220
Mostovaya, A., Koehler, B., Guillemette, F., Brunberg, A. K., and Tranvik, L. J. (2016). Effects of compositional changes on reactivity continuum and decomposition kinetics of lake dissolved organic matter. J. Geophys. Res. Biogeosci. 121, 1733–1746. doi: 10.1002/2016JG003359
Nedwell, D. B., and Rutter, M. (1994). Influence of temperature on growth rate and competition between two psychrotolerant Antarctic bacteria: low temperature diminishes affinity for substrate uptake. Appl. Environ. Microbiol. 60, 1984–1992. doi: 10.1128/AEM.60.6.1984-1992.1994
Ogura, N. (1972). Rate and extent of decomposition of dissolved organic matter in surface seawater. Mar. Biol. 13, 89–93. doi: 10.1007/BF00366559
Pahlow, M., and Vézina, A. F. (2003). Adaptive model of DOM dynamics in the surface ocean. J. Mar. Res. 61, 127–146. doi: 10.1357/002224003321586435
Preston, C. M., and Schmidt, M. W. I. (2006). Black (pyrogenic) carbon: a synthesis of current knowledge and uncertainties with special consideration of boreal regions. Biogeosciences 3, 397–420. doi: 10.5194/bg-3-397-2006
Reay, D. S., Nedwell, D. B., Priddle, J., and Ellis-Evans, J. C. (1999). Temperature dependence of inorganic nitrogen uptake: reduced affinity for nitrate at suboptimal temperatures in both algae and bacteria. Appl. Environ. Microbiol. 65, 2577–2584. doi: 10.1128/AEM.65.6.2577-2584.1999
Rivkin, R. B., and Legendre, L. (2001). Biogenic carbon cycling in the upper ocean: effects of microbial respiration. Science 291, 2398–2401. doi: 10.1126/science.291.5512.2398
Romera-Castillo, C., Letscher, R. T., and Hansell, D. A. (2016). New nutrients exert fundamental control on dissolved organic carbon accumulation in the surface Atlantic Ocean. Proc. Natl. Acad. Sci. U.S.A. 113, 10497–10502. doi: 10.1073/pnas.1605344113
Roshan, S., and DeVries, T. (2017). Efficient dissolved organic carbon production and export in the oligotrophic ocean. Nat. Commun. 8:2036. doi: 10.1038/s41467-017-02227-3
Roussenov, V., Williams, R. G., Mahaffey, C., and Wolff, G. A. (2006). Does the transport of dissolved organic nutrients affect export production in the Atlantic Ocean? Glob. Biogeochem. Cycles 20, 1–14. doi: 10.1029/2005GB002510
Servais, P., Billen, G., and Rego, J. V. (1985). Rate of bacterial mortality in aquatic environments. Appl. Environ. Microbiol. 49, 1448–1454. doi: 10.1128/AEM.49.6.1448-1454.1985
Smetacek, V., de Baar, H. J. W., Bathmann, U., Lochte, K., and Rutgers van der Loeff, M. M. (1997). Bacterial Standing Stock and Biomass Measured on Water Bottle Samples During Polarstern Cruise ANT-X/6. Data set. Bremen: PANGAEA.
Smith, D. C., Simon, M., Alldredge, A. L., and Azam, F. (1992). Intense hydrolytic enzyme activity on marine aggregates and implications for rapid particle dissolution. Nature 359, 139–142. doi: 10.1038/246170a0
Tamburini, C., Garcin, J., Ragot, M., and Bianchi, A. (2002). Biopolymer hydrolysis and bacterial production under ambient hydrostatic pressure through a 2000 m water column in the NW Mediterranean. Deep-Sea Res. II Top. Stud. Oceanogr. 49, 2109–2123. doi: 10.1016/S0967-0645(02)00030-9
Thingstad, T. F., Hagström, Å., and Rassoulzadegan, F. (1997). Accumulation of degradable DOC in surface waters: is it caused by a malfunctioning microbial loop? Limnol. Oceanogr. 42, 398–404. doi: 10.4319/lo.1997.42.2.0398
Thomas, M. K., Kremer, C. T., Klausmeier, C. A., and Litchman, E. (2012). A global pattern of thermal adaptation in marine phytoplankton. Science 338, 1085–1088. doi: 10.1126/science.1224836
Tian, R. C., Vézina, A., Legendre, L., Ingram, R. G., Klein, B., Packard, T., et al. (2000). Effects of pelagic food-web interactions and nutrient remineralization on the biogeochemical cycling of carbon: a modeling approach. Deep-Sea Res. II Top. Stud. Oceanogr. 47, 637–662. doi: 10.1016/S0967-0645(99)00121-6
Tilman, D. (2007). Resource competition and plant traits: a response to Craine et al. 2005. J. Ecol. 95, 231–234. doi: 10.1111/j.1365-2745.2007.01201.x
Toggweiler, J. R. (1999). Variation of atmospheric CO2 by ventilation of the ocean's deepest water. Paleoceanography 14, 571–588. doi: 10.1029/1999PA900033
Walker, B. D., Beaupré, S. R., Guilderson, T. P., McCarthy, M. D., and Druffel, E. R. M. (2016). Pacific carbon cycling constrained by organic matter size, age and composition relationships. Nat. Geosci. 9, 888–891. doi: 10.1038/ngeo2830
Wang, N., Luo, Y. W., Polimene, L., Zhang, R., Zheng, Q., Cai, R., et al. (2018). Contribution of structural recalcitrance to the formation of the deep oceanic dissolved organic carbon reservoir. Environ. Microbiol. Rep. 10, 711–717. doi: 10.1111/1758-2229.12697
Wanninkhof, R., Barbero, L., Baringer, M., Bullister, J., Feely, R., Millero, F., et al. (2017). Carbon Dioxide, Hydrographic, and Chemical Data Obtained During NOAA Ship Ronald H. Brown Cruise in the South Atlantic Ocean on GO-SHIP/CLIVAR Repeat Hydrography Section A16S from 2013–12-23 to 2014–02-04 (NCEI Accession 0167410). Data set. Asheville, NC: NOAA National Centers for Environmental Information.
Williams, P. J. L. B. (2000). “Heterotrophic bacteria and the dynamics of dissolved organic material,” in Microbial Ecology of the Oceans, ed D. L. Kirchman (Wiley), 153–200.
Williams, P. M., and Druffel, E. R. M. (1987). Radiocarbon in dissolved organic matter in the central North Pacific Ocean. Nature 330, 246–248. doi: 10.1016/j.cognition.2008.05.007
Wilson, J. D., and Arndt, S. (2017). Modeling radiocarbon constraints on the dilution of dissolved organic carbon in the deep ocean. Glob. Biogeochem. Cycles 31, 1–12. doi: 10.1002/2016GB005520
Keywords: DOC, DOM, recalcitrance, stability, reactivity, box model, microbial degradation, marine
Citation: Mentges A, Deutsch C, Feenders C, Lennartz ST, Blasius B and Dittmar T (2020) Microbial Physiology Governs the Oceanic Distribution of Dissolved Organic Carbon in a Scenario of Equal Degradability. Front. Mar. Sci. 7:549784. doi: 10.3389/fmars.2020.549784
Received: 07 April 2020; Accepted: 12 August 2020;
Published: 17 September 2020.
Edited by:
Carol Robinson, University of East Anglia, United KingdomReviewed by:
Colin Andrew Stedmon, Technical University of Denmark, DenmarkChristopher Lewis Follett, Massachusetts Institute of Technology, United States
Hugh Ducklow, Columbia University, United States
Copyright © 2020 Mentges, Deutsch, Feenders, Lennartz, Blasius and Dittmar. This is an open-access article distributed under the terms of the Creative Commons Attribution License (CC BY). The use, distribution or reproduction in other forums is permitted, provided the original author(s) and the copyright owner(s) are credited and that the original publication in this journal is cited, in accordance with accepted academic practice. No use, distribution or reproduction is permitted which does not comply with these terms.
*Correspondence: Andrea Mentges, andrea.mentges@uol.de; Thorsten Dittmar, thorsten.dittmar@uol.de