Surface Exposure Dating and Geophysical Tomography of the Royal Arches Meadow Rock Avalanche, Yosemite Valley, California
 Marcus Pacheco
 Alain M. Plattner2*
 - 1Earth & Environmental Sciences, California State University, Fresno, Fresno, CA, United States
- 2Geological Sciences, The University of Alabama, Tuscaloosa, AL, United States
- 3National Park Service, Yosemite National Park, El Portal, CA, United States
- 4Earth Science and Engineering, Imperial College London, London, United Kingdom
Since the retreat of glaciers after the Last Glacial Maximum, rock avalanches have occurred intermittently in Yosemite Valley, California. We investigated the distal portion of the oldest of these, the Royal Arches Meadow rock avalanche, which has been partially buried by sediment aggradation. Cosmogenic 10Be exposure ages of boulders within the deposit indicate that the rock avalanche occurred at 16.1 ± 0.3 ka, immediately after deglaciation and thus prior to most aggradation. The interface between the rock avalanche deposit and the underlying glaciofluvial sediments therefore provides an elevation marker of the valley floor at the time of deposition. To identify the elevation of this interface, we collected eight Ground Penetrating Radar (GPR) and five Electrical Resistivity Tomography (ERT) profiles across the rock avalanche. Both methods are sensitive to contrasts between the granitic avalanche deposit and the underlying sediments. By constraining ERT inversions with GPR interfaces that are continuous across the profiles, we identified a single interface, interpreted as the basal contact of the rock avalanche, that separates resistive material from conductive material underneath. The elevation of this approximately horizontal interface is between 1,206 and 1,209 m, roughly 10 m below the modern ground surface, indicating ≈ 10 m of sediment aggradation since deglaciation. Based on topographic expression and depth to this contact, we determined a minimum volume estimate of between 8.1 × 10⁵ m3 and 9.7 × 10⁵ m3, nearly three times larger than what would be estimated from surface expression alone. Our findings allow reconstruction of the sedimentation history of Yosemite Valley, inform hazard and risk assessment, and confirm that geophysical methods are valuable tools for three-dimensional investigations of rock avalanches, particularly those buried by younger sediments.
1. Introduction
Rock avalanches - streams of rapidly moving rock debris resulting from catastrophic failure of bedrock slopes - are among the most powerful geologic forces on earth, rapidly eroding extremely large masses of rock and causing dramatic and long-lasting landscape changes (e.g., Evans et al., 2006; Hovius and Stark, 2006; Korup et al., 2007; Hewitt et al., 2008; Hermanns and Longva, 2012). As a result of their large volumes and associated long runout distances, rock avalanches are also the source of some of the world's most destructive natural disasters, posing significant hazard and risk in mountainous environments (Evans et al., 2006).
Determining rock avalanche volumes is a key aspect of evaluating their hazard, as accurate volumes are needed to establish robust volume-frequency relationships (e.g., Evans, 2006) and are critical components of empirical equations governing rock avalanche mobility (e.g., Corominas, 1996; Dade and Huppert, 1998). Rock avalanche volumes are usually determined by field investigations or remote sensing methods, though in both cases accurate volumes can be elusive due to the inherent difficulty in establishing accurate deposit extents and thicknesses, post-event erosion of the deposit, cover by more recent debris, or a lack of sufficiently high resolution remote sensing data (Hutchinson, 2006; Hewitt et al., 2008). This situation is exacerbated in cases where rock avalanche deposits are partially buried by sediment aggradation, with an unknown but potentially substantial portion of the deposit volume hidden from view. Older rock avalanches may be particularly susceptible to this condition, in some cases prohibiting volume estimation entirely (e.g., Cordes et al., 2013; McColl, 2020). Partial burial can lead to an underestimation of volume, and thus inaccurate conclusions about frequency, runout, and overall hazard.
The need for determining accurate volumes for partially buried deposits has spurred application of geophysical methods to studies of talus deposits and rock avalanches. Previous studies in the Alps (Sass and Wollny, 2001; Otto and Sass, 2006; Sass, 2006; Socco et al., 2010), and in Yosemite Valley (Brody et al., 2015), showed the potential of geophysical methods, including electrical resistivity tomography, ground penetrating radar, and seismic refraction, for identifying basal contacts, deposit thickness, and associated stratigraphy. Near-surface geophysical investigations are well-suited for rock avalanches that possess a strong contrast in physical properties (e.g., electrical resistivity or dielectric permittivity) compared to the underlying substrate or, if applicable, overlying deposits. Weak contrasts, on the other hand, increase ambiguity, requiring additional information, for example from boreholes, to uniquely pinpoint contacts.
Here we use integrated geophysical imaging methods to investigate the basal contact, thickness distribution, and volume of the Royal Arches Meadow rock avalanche, a ≈ 16 ka, partially-buried rock avalanche deposit in Yosemite Valley. Our age determination is based on terrestrial cosmogenic 10Be exposure dating of boulders on the surface of the rock avalanche (section 2). Ground penetrating radar profiles across the rock avalanche deposit revealed multiple interfaces and hence not a unique candidate for the basal contact (section 3.3). However, integrating our ground penetrating radar results with electrical resistivity tomography ultimately allows us to identify the rock avalanche base (section 3.4).
1.1. Physical Setting
Yosemite Valley is located in Yosemite National Park in the central Sierra Nevada mountain range of California, USA (Figure 1A). Yosemite Valley is approximately 12 km long and 1–2 km wide, with steep (including vertical to overhanging) cliffs nearly 1 km tall. These cliffs and associated waterfalls offer iconic scenery that draws more than 4 million visitors annually. The walls of Yosemite Valley are composed of late Cretaceous granitic rocks of the Sierra Nevada batholith (Bateman, 1992), primarily granites, granodiorites, and minor diorite. The cliffs in eastern Yosemite Valley, including those adjacent to the Royal Arches Meadow rock avalanche, are comprised of ≈ 88 Ma Half Dome Granodiorite (Peck, 2002).
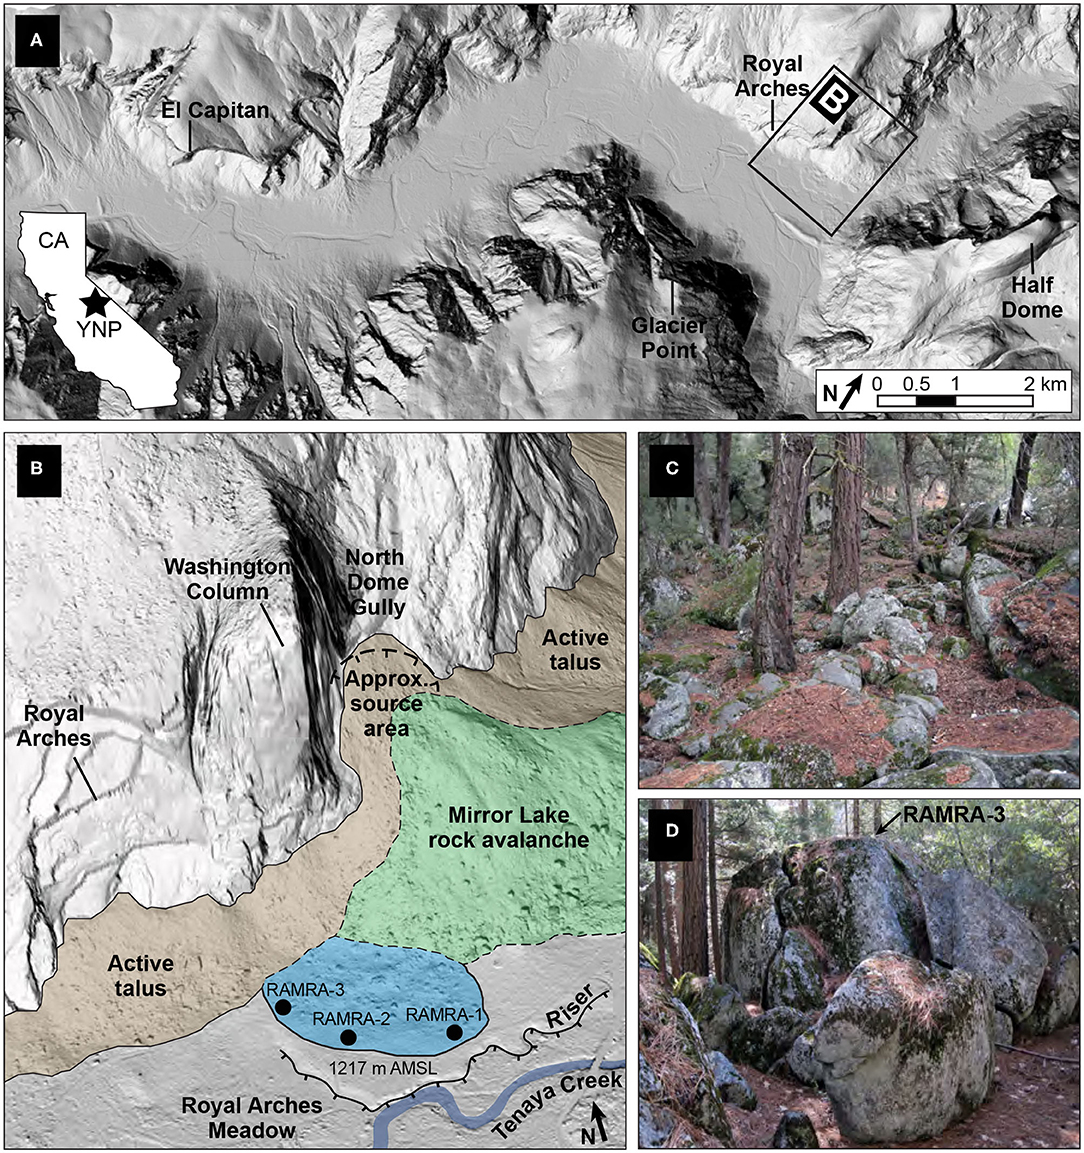
Figure 1. Location and geologic setting of the Royal Arches Meadow rock avalanche. (A) Location of Royal Arches Meadow rock avalanche in eastern Yosemite Valley, Yosemite National Park (YNP), California (CA). (B) Oblique topographic hillshade, derived from 1 m filtered lidar data, showing the Royal Arches Meadow rock avalanche (blue), overlapping Mirror Lake rock avalanche (green), and active talus (brown), and terrace riser adjacent to Tenaya Creek. Black circles mark samples collected for cosmogenic 10Be exposure dating. The width of the Royal Arches Meadow rock avalanche deposit is approximately 315 m. Extent of oblique view shown as box marked “B” in (A). (C) Photograph showing bouldery topography typical of the exposed surface of the rock avalanche. (D) Photograph of a 3 m-tall boulder on the western margin of the rock avalanche sampled for cosmogenic 10Be exposure dating (sample RAMRA-3).
Yosemite Valley was initially carved by river incision, but was subsequently deepened and widened by hundreds of meters during multiple Pleistocene glaciations (Matthes, 1930; Huber, 1987), mostly recently during the Last Glacial Maximum (LGM). Although the timing of LGM glacier retreat from Yosemite Valley is not precisely known (Wahrhaftig et al., 2019), results from elsewhere in the Sierra Nevada suggest that LGM deglaciation occurred between 18 and 16 ka (e.g., Rood et al., 2011; Phillips, 2017). Glacier retreat left behind a relatively flat valley floor comprised of glacial outwash, lacustrine and deltaic deposits, and fluvial silts, sands, and gravels (e.g., Matthes, 1930; Huber, 1987), with several meters of sediment aggradation of the valley floor in the Holocene (e.g., Cordes et al., 2013; Brody et al., 2015).
Rock slope failures, primarily in the form of rockfalls and rockslides, occur frequently from the glacially-steepened walls of Yosemite Valley (Stock et al., 2013). Sheeting (exfoliation) joints in the otherwise massive granite often form rockfall detachment surfaces (e.g., Stock et al., 2012). Smaller rockfalls of hundreds to thousands of cubic meters in volume occur on an annual basis in Yosemite Valley; larger failures up to tens of thousands of cubic meters in volume occur less frequently, but have been documented in the past 150 years (Wieczorek et al., 2000; Zimmer et al., 2012; Stock et al., 2013; Guerin et al., 2020). These events typically have modest runout distances, with deposition limited to the active talus slopes flanking the base of cliffs.
Yosemite Valley preserves several extremely large boulder deposits up to several million cubic meters in volume, considered to be rock avalanches resulting from catastrophic failure of the valley walls (Matthes, 1930; Wieczorek et al., 1999; Wieczorek, 2002; Stock and Uhrhammer, 2010). These deposits extend far beyond the base of active talus slopes onto the valley floor, where they manifest as laterally extensive, low-angle fields of angular boulders. At least six rock avalanche deposits have been identified in Yosemite Valley, all of which have occurred since LGM deglaciation. As the floor of Yosemite Valley is wide and flat, with low stream power to modify rock avalanche deposits, and erosion rates of the granitic boulders in the deposits are slow (on the order of tenths of a millimeter per year; Wahrhaftig et al., 2019), these rock avalanche deposits tend to be exceptionally well-preserved. A potentially confounding preservation factor is that some of the older deposits appear to be partially buried by more recent sediment aggradation (e.g., Cordes et al., 2013) including younger talus deposits and other rock avalanches.
1.2. Royal Arches Meadow Rock Avalanche
The Royal Arches Meadow rock avalanche is located in eastern Yosemite Valley, at an elevation of 1,217 m above mean sea level (AMSL), between a 420 m-tall rock tower named Washington Column to the north and Royal Arches Meadow and Tenaya Creek to the south (Figure 1A). The portion of the rock avalanche deposit proximal to the cliffs to the north is buried beneath debris from the more recent Mirror Lake rock avalanche (Wieczorek et al., 1999; Wieczorek, 2002), as well as aprons of active talus (Figure 1B). The distal portion of the deposit extending beyond this overlapping debris is therefore the primary focus of this study. This deposit has a lobate morphology, suggesting that it was topographically unconstrained as it spread out across the valley floor. The maximum length of the distal portion of the deposit is approximately 270 m, and the maximum width is approximately 315 m. Contrasting with the relatively steep (30°–35°) repose angles of the active talus slopes, the distal portion of the rock avalanche deposit is nearly flat, sloping only a few degrees to the south. The deposit has a hummocky morphology and a clast-supported surface cover of angular boulders (Figure 1C). Boulders exposed on the surface range from tenths of cubic meters to many hundreds of cubic meters in volume, with the largest boulders projecting up to 5 m above the mean deposit surface (Figure 1D). Finer-grained material between the boulders support dense trees and understory vegetation.
Along the southern margins of the rock avalanche deposit, the distribution of boulders on the surface becomes more dispersed, with many meters to tens of meters separating individual boulders. The intervening surfaces are composed of flat-lying sediments, presumed to be a mix of alluvium and colluvium; the isolated boulders appear to be embedded within these sediments, suggesting partial burial by sediment aggradation. Farther south, the topography is flat and comprises a fluvial terrace at 1,217m AMSL, the edge of which is a 5 m-tall terrace riser formed by lateral erosion of Tenaya Creek (Figure 1B). A cutbank in the terrace riser displays a layered stratigraphy of silts and sands with a capping coarse gravel deposit, interpreted to represent fine sediment deposition within small pro-glacial side channels and ponds followed by coarse sediment deposition resulting from migration of the main Tenaya Creek channel. The cutbank does not reveal angular clasts associated with the rock avalanche, indicating that the rock avalanche does not extend in the subsurface as far south as the terrace riser. Furthermore, the undeformed nature of the layered sediments exposed in the cutbank suggests that they post-date emplacement of the rock avalanche. The local topographic setting prohibits the rock avalanche deposit from acting as a natural dam (the deposit only extends partway across the valley), indicating that sediment aggradation occurred for reasons independent of rock avalanche emplacement.
Although the morphology of the Royal Arches Meadow rock avalanche clearly indicates it was sourced from the north wall of Yosemite Valley in the vicinity of Washington Column, an exact source area is not apparent. A likely explanation for this is that the rock avalanche originated from an edifice that later collapsed, generating the much larger-volume (≈ 11 × 106 m3) Mirror Lake rock avalanche (Figure 1B; Wieczorek et al., 1999; Wieczorek, 2002) and leaving behind a large depression in the valley wall immediately east of Washington Column known as North Dome Gully. We infer that the source area for the Royal Arches Meadow rock avalanche was located on a cliff formerly within the empty space in what is now the North Dome Gully (Figure 1B).
The ratio of the vertical fall height (H) and the horizontal runout length (L) of rock avalanches, the so called “Fahrböschung” (Hsü, 1975), and the arctangent of H/L, the so called “reach angle” (Corominas, 1996) are commonly used as indices of rock avalanche mobility. As the source area of the Royal Arches Meadow rock avalanche is no longer visible, it is not possible to precisely quantify the H and L parameters. However, given the general constraints on the likely source area, we estimate a maximum fall height of approximately 550 m and a maximum runout length of approximately 840 m, suggesting an H/L ratio of 0.65 As with the other rock avalanches in Yosemite Valley (Wieczorek et al., 1999), this relatively low mobility suggests that the Royal Arches Meadow rock avalanche does not display “excess” runout; rather, its large runout distance compared to the active talus is explained primarily by its potential energy (e.g., Dade and Huppert, 1998).
As the proximal portion of the rock avalanche is buried beneath younger talus and rock avalanche debris, we have not attempted to account for that volume. The exposed distal portion of the Royal Arches Meadow rock avalanche has a “bulked” volume (including porosity) of approximately 3.78 × 10⁵ m3, calculated by delineating the area of exposed boulders on the surface (54,186 m2) and measuring the volume within this area that projects above the height of the adjacent, roughly planar, valley floor surface (1,217 m elevation). Importantly, this volume measurement assumes that the base of the rock avalanche is the modern valley floor surface, and that the entire volume of the distal portion is presently exposed. However, as described above, there is evidence that the Royal Arches Meadow rock avalanche is partially buried. Recognition that post-glacial aggradation likely strongly influences the surface expression of the rock avalanche was a primary motivation for integrated geophysical imaging of the deposit.
2. Age of the Royal Arches Meadow Rock Avalanche
The intact deposit of the Royal Arches Meadow rock avalanche on the floor of Yosemite Valley confirms that it must be post-glacial in age, i.e., it was deposited after retreat of the LGM glacier from eastern Yosemite Valley. Several lines of field evidence, including overlapping deposition by the Mirror Lake rock avalanche and indications of substantial post-depositional aggradation of fluvial sediments adjacent to and within the distal portion of the deposit, suggest that it may be among the oldest of the rock avalanches in Yosemite Valley. To date the Royal Arches Meadow rock avalanche directly, we employed terrestrial cosmogenic 10Be exposure dating of boulders on the surface of the deposit.
Terrestrial cosmogenic nuclide exposure dating, which utilizes the accumulation of cosmogenic nuclides in target minerals over time due to exposure to cosmic rays (e.g., Gosse and Phillips, 2001) offers a robust means of directly dating rock avalanche deposits, provided the exposed boulders were sufficiently shielded within the rock slope prior to failure and that they have not experienced substantial post-depositional burial or erosion. Cosmogenic nuclide exposure dating has been used to constrain the timing of rock avalanches in a variety of settings (e.g., Ballantyne and Stone, 2004; Mitchell et al., 2007; Moreiras et al., 2015; Nagelisen et al., 2015; McColl, 2020), and was previously used to obtain ages for two rock avalanches in Yosemite Valley (Stock and Uhrhammer, 2010; Cordes et al., 2013).
We collected three samples for cosmogenic 10Be exposure dating from boulders on the surface of the Royal Arches Meadow rock avalanche deposit. We selected large boulders near the distal edge of the deposit that were solidly wedged against adjacent boulders (demonstrating that the boulders could not have rotated since emplacement), and sampled the tops of these boulders (Figure 1D) to simplify the exposure geometries and topographic shielding, and to minimize the potential for nuclide loss due to wildfire-induced boulder spallation. We did not correct for snow shielding. We assumed a boulder erosion rate of 0.0065 cm /yr (Wahrhaftig et al., 2019), likely a maximum value. Quartz sample preparation and accelerator mass spectrometer measurements were made at the Scottish Universities Environmental Research Center (SUERC) using standard procedures (Xu et al., 2015; Corbett et al., 2016). Model exposure ages were calculated using the CRONUS-Earth online calculator (Balco et al., 2008). The choice of reference production rate, scaling scheme, and erosion rate changes the ages by a maximum of 7.5 %, or approximately 1,200 years, which does not significantly affect our conclusions.
Results from the three samples are nearly identical (Table 1), yielding an error-weighted mean exposure age of 16.1 ± 0.3 ka (1σ), with a reduced chi-squared value of 0.4 and p-value of 0.96. This result confirms that the Royal Arches Meadow rock avalanche is Late Pleistocene in age. Given that the Royal Arches Meadow rock avalanche is located close to the inferred LGM terminus position (within 7 km), it is reasonable to assume that deglaciation had occurred there by ≈ 16 ka, and that the rock avalanche occurred immediately thereafter. As such, the Royal Arches Meadow rock avalanche presents an important marker of the elevation of the floor of Yosemite Valley immediately following deglaciation, providing insights into the post-glacial history of the valley. As much of this history involved aggradation of alluvial and colluvial sediments adjacent to, and on top of, the rock avalanche, the relationship between the rock avalanche and the former valley floor has been obscured. We thus turned to geophysical methods to investigate the position and morphology of the basal contact of the rock avalanche deposit.
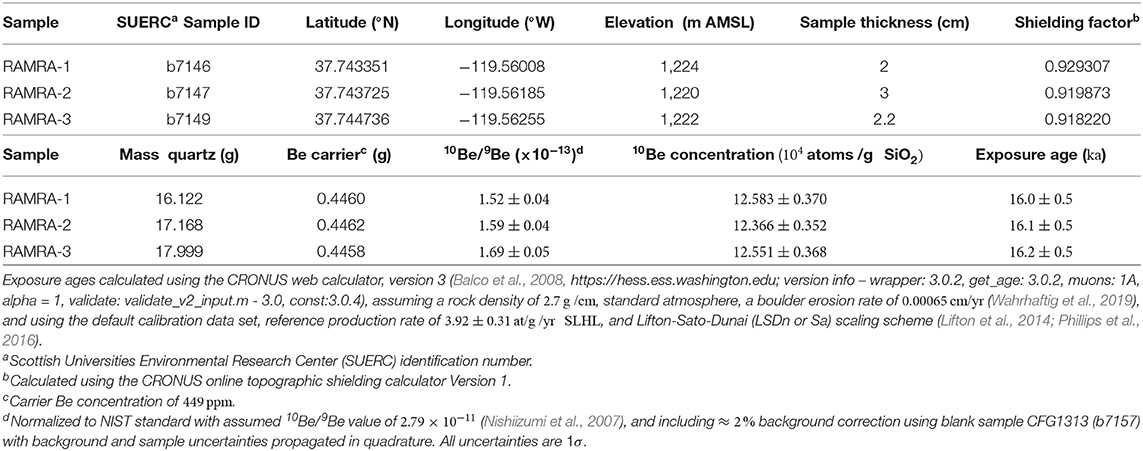
Table 1. Sample data and exposure ages for boulders on the Royal Arches Meadow rock avalanche.
3. Geophysical Investigation
We used a combination of two non-intrusive geophysical methods—Electrical Resistivity Tomography (ERT) and Ground Penetrating Radar (GPR). GPR common-offset profiling consists of keeping transmitter and receiver antennae at a fixed offset and recording traces along a profile line (Jol, 2008). Electromagnetic wavelets emitted by the transmitter antenna at each measurement location get reflected by subsurface contrasts in dielectric permittivity (Neal, 2004) and recorded by the receiver antenna. A variety of factors, including change in lithology, grain size and orientation, and the water table affect dielectric permittivity (Olhoeft, 1998; Neal, 2004). This makes GPR a well-suited technique to investigate the interface between the granitic rock avalanche deposit and the underlying lacustrine, deltaic, and fluvial sediments. To detect structures within the subsurface, signals recorded by the GPR receiver antenna at each position along the profile are plotted next to each other to form a radargram. Since the vertical axis of a radargram shows the time since source wavelet transmission, subsurface radar wave velocity is required to extract depth information. This velocity can be obtained by conducting a “common midpoint,” or a “wide angle reflection and refraction” survey, in which the separation between transmitter and receiver antenna is successively increased (Annan and Davis, 1976; Davis and Annan, 1989).
In ERT surveys, electrical potential differences resulting from current injected into the ground reveal the spatially varying electrical resistivity of the subsurface. Measurements using multiple current- and potential-electrode pairs along a profile allow computer tomographic inversions to create vertical profiles showing the two-dimensional variation of electrical resistivity (e.g., Oldenburg and Li, 1999; Loke et al., 2013). We expected the electrical resistivity of the granitic rock avalanche debris to be an order of magnitude higher than the resistivity of the underlying sediments, posing a strong contrast in the physical parameter to which ERT is sensitive.
Neither of these two methods alone can pinpoint the basal contact of the rock avalanche. While GPR shows the boundaries of various units, it is not well-suited to differentiate between the unit materials. When several interfaces are present, standard GPR processing alone can not conclusively indicate which of these interfaces is the basal contact of the rock avalanche deposit. ERT, on the other hand, is sensitive to the materials of the units, but cannot by itself resolve sharp transitions. Moreover, ERT is typically underdetermined, meaning that different resistivity profiles may fit the data equally well. Additional constraints (regularization) must be provided, typically in the form of imposed smoothness (e.g., Günther et al., 2006; Loke et al., 2013). As a consequence, different regularization constraints may lead to different resistivity profiles (Oldenburg and Li, 1999). A-priori information of subsurface structure can be incorporated into ERT regularization. Here, we follow the approach of Doetsch et al. (2012) by removing smoothing constraints across interfaces obtained from GPR profiles that overlap with our ERT profiles.
3.1. Data Acquisition Strategy
We collected eight GPR and five ERT profiles (Figures 2A,B) crossing exposed parts of the rock avalanche, as well as the adjacent area covered by finer sediments. GPR profiles as well as “Wide Angle Reflection and Refraction” (WARR) data were acquired using a Sensors and Software PulseEKKO Pro (50 MHz) system between September and October 2018. The five ERT transects were collected in March 2018 with an Advanced Geosciences Inc SuperSting R1 system with 28 electrodes and 6 m electrode spacing, using Schlumberger and dipole-dipole electrode arrays. To increase the length of the ERT profiles, we used a roll-along strategy Loke et al. (2013). ERT and GPR profiles overlapped to allow for joint processing and interpretation.
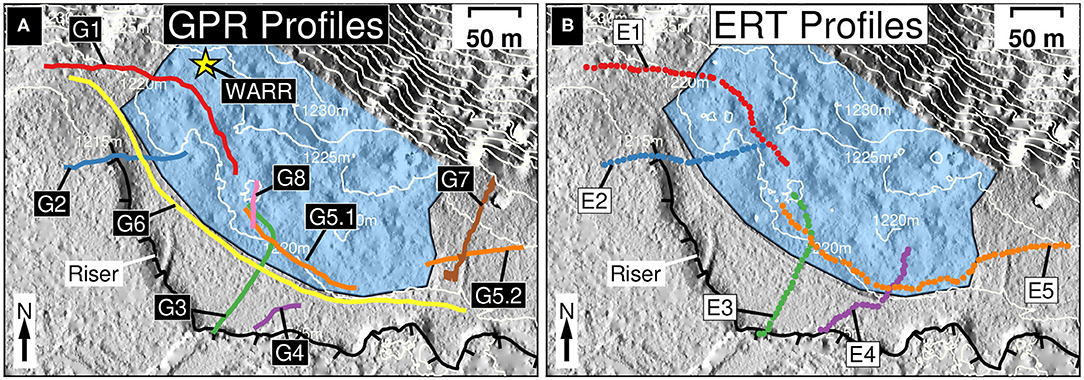
Figure 2. (A) Map view of GPR profiles and WARR location. (B) Map view of ERT profiles. GPR and ERT profiles overlap to allow for joint processing and interpretation.
3.2. Radar Wave Velocity
To determine the subsurface velocity, we collected “Wide Angle Reflection and Refraction” (WARR) data by transmitting and recording signals at increasing transmitter-receiver separation. The resulting radargram (Figure 3C), obtained after minimal processing using GPRPy (Plattner and Pacheco, 2019; Plattner, 2020) shows signals traveling directly from the transmitter to the receiver through air (air wave) and through the ground (ground wave) as straight lines, while signals reflected from horizontal interfaces appear as hyperbolae. The slope of the direct arrivals and the shape of the hyperbolae allow us to determine the subsurface velocity. We used the stacked amplitude procedure implemented in GPRPy to give best estimations for direct waves (Figure 3B) and reflected waves (Figure 3A). As expected, the air wave traveled at the speed of light in air (0.3 ns /m). The ground wave samples only the shallowest part of the subsurface. Its velocity is thus not necessarily representative of the deeper subsurface. The reflected arrivals (hyperbolae), on the other hand, travel down to an interface and hence provide an estimate of the average subsurface velocity between the interface and the surface. We therefore use the velocity obtained from the hyperbolae, 0.11 ± 0.01 m /ns, as subsurface velocity.
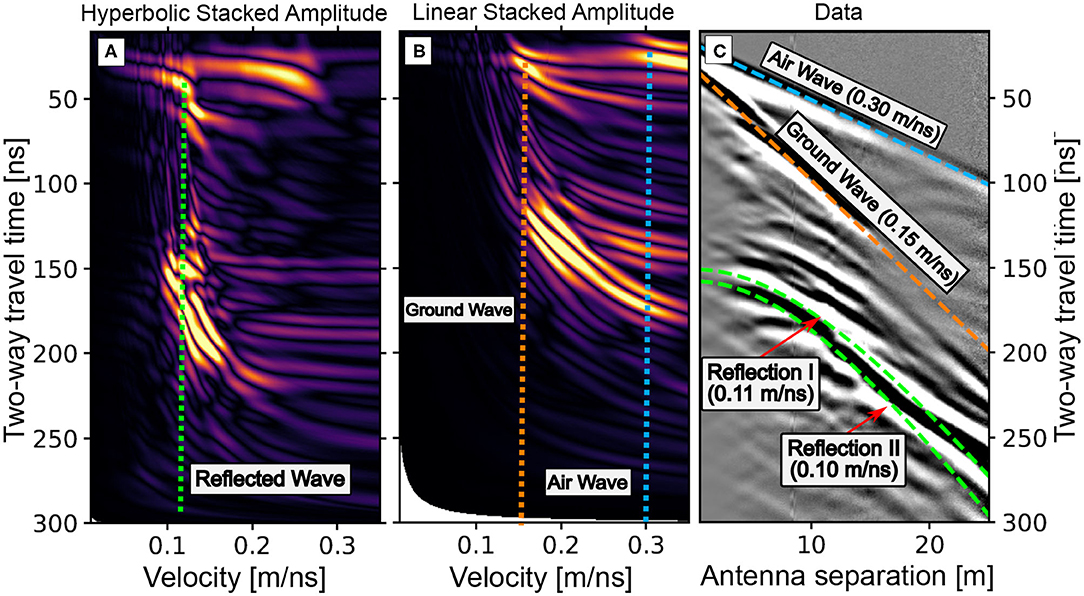
Figure 3. (A) hyperbolic stacked amplitudes for the WARR data in (C). Bright colors indicate velocities and depths (two-way travel time) of interfaces. (B) linear stacked amplitudes for the WARR data in (C). Bright colors indicate velocities for direct waves. (C) WARR data with best-fitting lines and hyperbolae obtained from (A,B).
3.3. GPR Data Processing and Interpretation
Minimal GPR data processing using GPRPy (Plattner and Pacheco, 2019; Plattner, 2020) included a time-zero correction, filter (dewow and mean trace removal), T-power gain, f-k migration (Stolt, 1978) and topographic correction. Processing scripts including the parameters used are provided together with the raw data. For the time-to-depth transformation, we used a homogeneous velocity of 0.11 m /ns obtained from the WARR survey described in section 3.2 (Annan and Davis, 1976; Davis and Annan, 1989).
To identify candidates for the basal contact of the rock avalanche in the processed GPR data, we plotted GPR profiles in 3D (Figure 4) and identified interfaces that are consistent between the profiles and continue underneath the exposed rock avalanche as well as the surrounding area. The largest contributors to uncertainty of depth to a feature in GPR data are uncertainty in velocity, together with resolution caused by the signal wavelength. A velocity of 0.11 ± 0.01 m/ns, as obtained from our WARR survey (section 3.2), leads to a depth uncertainty of ≈ 10 %, hence ±1 m for an object buried at 10 m depth. Vertical resolution is typically limited by 1/4 of the wavelength (Jol, 2008), which, for a 50 MHz antenna and a velocity of 0.11 m/ns is ≈ 0.5 m. We took these uncertainties into account when reporting the following interfaces. We identified three candidates for the basal contact (Figure 4D): A relatively flat interface (parallel to the horizon) “Alpha” of elevation between 1,214 and 1,216 m above mean sea level, a deeper, nearly-horizontal interface “Beta” at an elevation of 1,206 to 1,209 m (Figure 4E), and “Gamma,” which is visible in profiles G2 through G7 at an elevation of ≈ 1.205 m. Between interface Alpha and Beta, we observe scattering that is more prominent than below interface Beta (Figure 4D). The scattered texture close to the southeastern edge of G3, below Beta is an artifact of the migration processing step. The strong parallel lines at the topmost edges of the profiles result from radar waves directly traveling from the transmitter to the receiver (we used unshielded antennae).
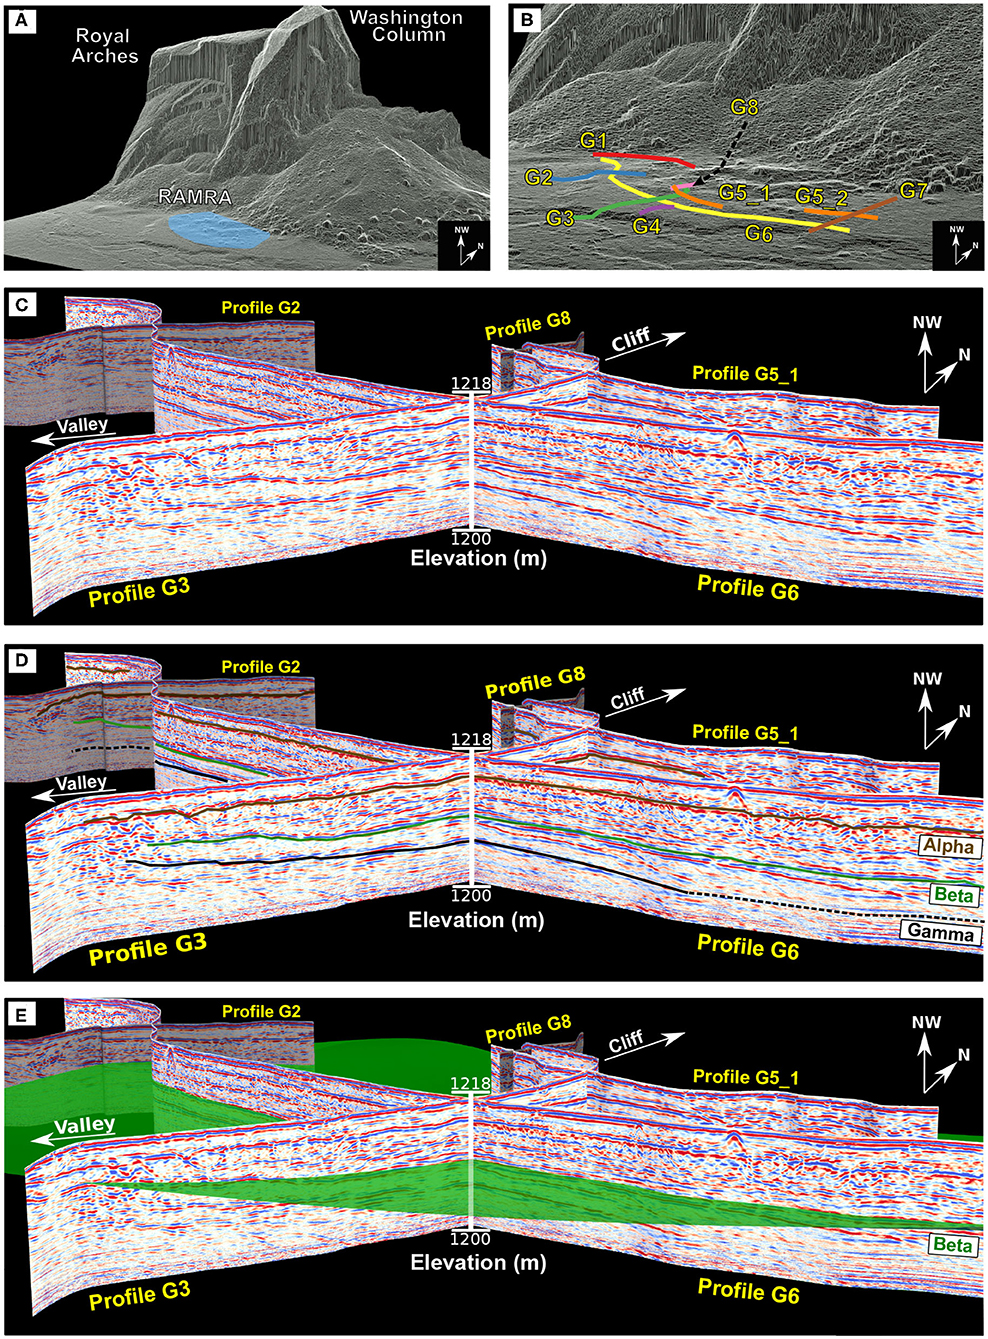
Figure 4. (A) Location of the study area with respect to surrounding cliff faces. Extent of the Royal Arches Meadow rock avalanche (RAMRA) is shown in blue. (B) GPR profile arrangement within study area. (C) Oblique view of GPR profiles looking toward NW, (D) Identified interfaces Alpha, Beta, and Gamma, and (E) Interpolated surface for interface Beta.
3.4. GPR-Constrained ERT Inversion
To identify which of the previously identified candidates might be the basal contact of the rock avalanche, we removed smoothing constraints across interfaces Alpha, Beta, and Gamma in the ERT inversion of the corresponding profiles (Doetsch et al., 2012) using the open-source software BERT Günther et al. (2006), Rücker et al. (2017). This approach does not enforce but allows sharp transitions across the provided interface. We use profile E3 to illustrate the process (Figure 5), but other profiles showed similar patterns. For a granitic debris deposit overlying lacustrine, deltaic, and fluvial sediments, we expected electrically resistive material on top of conductive material. Indeed, inversion of the resistivity data with regular smoothing and no additional a-priori constraints revealed electrically resistive material (>5,000 Ωm) overlying relatively conductive material (<1,000 Ωm), but with a smooth transition (Figure 5A). For interface Alpha, resistive material is still present below the interface (Figure 5B). Interface Beta created a sharp transition between resistive and conductive material (Figure 5C), while interface Gamma lies below the transition of resistive to conductive material for most of the profile (Figure 5D). From our investigations, we were unable to identify the edge of the rock avalanche underneath the terrace riser. In our ERT profiles, we observed resistive material to within 10 m of the edge of the terrace, however, observations at the edge of the terrace riser did not reveal granitic boulders.
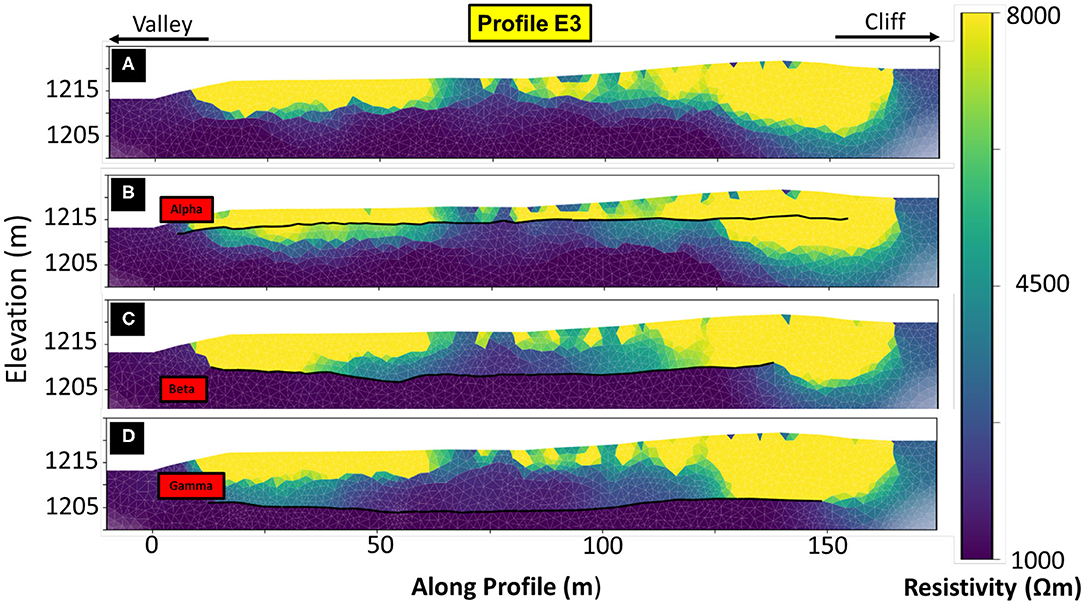
Figure 5. ERT inversion results for profile E3 using smoothness regularization. (A) No additional a-priory information, smoothness applied everywhere. (B) No smoothing across interface Alpha. (C) No smoothing across interface Beta. (D) No smoothing across interface Gamma.
Identifying interfaces Alpha, Beta, and Gamma underneath the rough topography of the exposed rock avalanche was more challenging than underneath the adjacent smooth terrace. Interfaces in GPR profile G5.1 (Figure 6A) are less clear than in profiles G3 and G6 (Figure 4). In profile G5.1, we identified interfaces (Figure 6B) at elevations of ≈ 1,216 m (Alpha), ≈ 1,213 m (unnamed), and ≈ 1,207 m (Beta). Interface Gamma is not visible in this GPR profile. Similar to the GPR-constrained ERT inversion for profile E3 (Figure 5), interface Beta creates the clearest separation between resistive and conductive materials (Figures 6C,D).
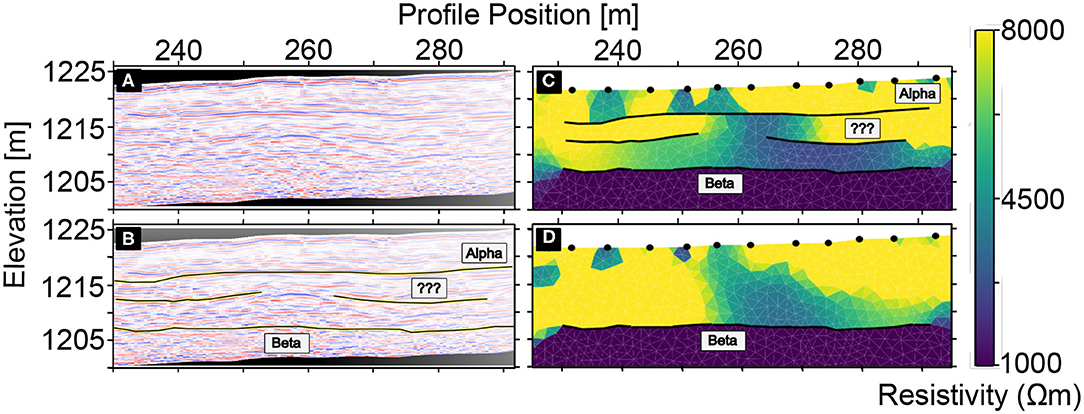
Figure 6. (A) GPR profile G5.1. (B) Profile G5.1 with marked interfaces. (C) GPR-constrained ERT inversion result using all marked interfaces. (D) GPR-constrained ERT inversion result using only interface Beta.
4. Results and Implications
We identified Beta as the interface between the rock avalanche deposit and the underlying sediments, which we interpret as the basal contact of the rock avalanche and thus the floor of Yosemite Valley at the time of the rock avalanche event. Our choice of Beta is based on the following observations: (1) of all three interfaces identified in the GPR data, Beta led to the clearest separation between electrically resistive and conductive material in GPR-constrained ERT inversions (Figures 5, 6); and (2) in the GPR data, Beta separates a unit of visible scattering from a unit with little scattering underneath (Figure 4). We interpret that the scattering of radar waves is a result of randomly oriented clasts within the rock avalanche deposit.
Establishing the basal contact of the rock avalanche at between 1,206 and 1,209 m AMSL allows us to explore important metrics of the deposit and adjacent landscape. As discussed previously, the exposed distal portion of the deposit has a “bulked” volume of ≈ 3.8 × 10⁵ m3, assuming that the basal contact is at the elevation of the present valley floor elevation (1,217m AMSL). Using the newly established deeper basal contact, together with the existing area of the exposed portion of the rock avalanche deposit (recognized as a minimum area), yields a minimum deposit volume of between 8.1 × 10⁵ m3 and 9.7 × 10⁵ m3. This is a two- to three-fold increase compared to the previous volume estimation based solely on the surface expression of boulders. “Debulking” (correcting for an assumed 25% porosity) of the rock avalanche deposit (e.g., Hutchinson, 2006; Stock and Uhrhammer, 2010) leads to a minimum intact rock volume of between 6.1 × 10⁵ m3 and 7.3 × 10⁵ m3. As this is a minimum estimate and does not account for any volume in the proximal portion of the deposit buried underneath more recent talus, the actual volume of rock detached from the cliff was likely significantly larger. Although we were not able to reliably define the edges of the deposit in the subsurface, the lack of rock avalanche debris in the terrace riser adjacent to Tenaya Creek suggests that the total runout distance, though possibly larger than the extent of boulders on the surface, does not scale linearly with the increased volume (i.e., the runout distance is not two to three times longer). This implies that the rock avalanche had lower mobility than indicated by the surface expression of boulders alone.
Establishing the basal contact also allows the rock avalanche deposit to be used as a marker for the position of the floor of eastern Yosemite Valley at 16.1 ± 0.3 ka, immediately after deglaciation. Following emplacement of the rock avalanche, approximately 10 m of glaciofluvial sediment accumulated. As the rock avalanche deposit only extends partway across the valley, it likely did not act as a natural dam; sediment aggradation therefore must have occurred for reasons independent of rock avalanche emplacement. We conclude that the aggradation occurred in the latest Pleistocene as retreating glaciers produced prodigious sediment in the form of glacial outwash. This sediment was transported and deposited in alluvial fans and deltaic deposits in eastern Yosemite Valley, including in the vicinity of the Royal Arches Meadow rock avalanche. After aggradation ceased, Tenaya Creek has incised approximately 5 m into the alluvial sediments, as evidenced by the terrace riser and cutbank. This incision was likely driven by diminished sediment supply following full deglaciation. The geomorphic marker provided by the basal contact of the rock avalanche thus provides an important calibration point in reconstructing the post-glacial landscape evolution of Yosemite Valley.
5. Conclusions
Cosmogenic 10Be exposure dating revealed that the Royal Arches Meadow rock avalanche occurred 16.1 ± 0.3 thousand years ago, shortly after deglaciation of eastern Yosemite Valley. We identified the basal contact of the Royal Arches Meadow rock avalanche at an elevation of between 1,206 and 1,209 m AMSL using a combination of ERT and GPR data. The adjacent terrace has a surface elevation of 1,217 m AMSL, indicating that approximately 10 m of sediment aggradation has occurred in this location since deglaciation. We estimate the volume of the Royal Arches Rock avalanche deposit to be at least between 8.1 × 10⁵ m3 and 9.7 × 10⁵ m3, of which only about a third is exposed on the surface. Integrated geophysical imaging greatly improves our understanding of the full extent and volume of the rock avalanche and serves as an important marker in the post-glacial evolution of the Yosemite Valley landscape.
ERT and GPR were well-suited geophysical methods to determine the basal contact of the Royal Arches Meadow rock avalanche deposit, because the granitic boulders in the deposit presented a strong contrast in electrical conductivity and dielectric permittivity compared to the underlying sediments. Many rock avalanche deposits in other parts of the world likely show similarly strong contrasts in these physical parameters, in particular if the avalanche debris is comprised of largely intact boulders deposited on sediments or soil. Our approach can hence be a general strategy for investigating rock avalanche deposits that are expected to be partly buried.
Data Availability Statement
The geophysical datasets generated and analyzed for this study can be found on https://github.com/NSGeophysics/RAMRA_Data.
Author Contributions
MP collected and processed the geophysical data. AMP collected ERT data, contributed to the geophysical data processing, and served as faculty advisor to MP. GMS characterized the rock avalanche deposit and collected the cosmogenic 10Be samples. DR conducted cosmogenic 10Be chemistry, accelerator mass spectrometry analyses, data reduction, and exposure age calculations. All authors interpreted the data. MP, AMP, and GMS wrote the manuscript, with contributions from DR and CP.
Funding
This material was based upon work supported by the National Science Foundation under Grant Nos. EAR-1550732 and EAR-2022671 to AMP.
Conflict of Interest
The authors declare that the research was conducted in the absence of any commercial or financial relationships that could be construed as a potential conflict of interest.
Acknowledgments
We thank Guohai Jia, Jukya and Ryuya Kimura, Mathieu Richaud, Amalie Larsen, and Jessie Shields for assistance with geophysical field work, and Jessica Jobe for assistance with deposit characterization and sampling for cosmogenic 10Be dating. We appreciate helpful discussions with Elizabeth Haddon, Derek Booth and Brendon Quirk, and thank two reviewers and the editor. We thank the staff of the Scottish Universities Environmental Research Center (SUERC) for support during chemistry and accelerator mass spectrometry analyses. Dedicated to the memory of Jerry DeGraff (1947–2020).
References
Annan, A. P., and Davis, J. L. (1976). Impulse radar sounding in permafrost. Radio Sci. 11, 383–394. doi: 10.1029/RS011i004p00383
Balco, G., Stone, J., Lifton, N., and Dunai, T. (2008). A complete and easily accessible means of calculating surface exposure ages or erosion rates from ↑10Be and ↑26Al measurements. Quat. Geochronol. 3, 174–195. doi: 10.1016/j.quageo.2007.12.001
Ballantyne, C. K., and Stone, J. O. (2004). The Beinn Alligin rock avalanche, NW Scotland: cosmogenic ↑10Be dating, interpretation and significance. Holocene 14, 448–453. doi: 10.1191/0959683604hl720rr
Bateman, P. C. (1992). Plutonism in the Central Part of the Sierra Nevada Batholith, California. U.S. Geological Survey Professional Paper 1483. doi: 10.3133/pp1483
Brody, A. G., Pluhar, C. J., Stock, G. M., and Greenwood, W. J. (2015). Near-surface geophysical imaging of a talus deposit in Yosemite Valley, California. Environ. Eng. Geosci. 21, 111–127. doi: 10.2113/gseegeosci.21.2.111
Corbett, L. B., Bierman, P. R., and Rood, D. H. (2016). An approach for optimizing in situ cosmogenic ↑10Be sample preparation. Quat. Geochron. 33, 24–34. doi: 10.1016/j.quageo.2016.02.001
Cordes, S. E., Stock, G. M., Schwab, B. E., and Glazner, A. F. (2013). Supporting evidence for a 9.6 ± 1 ka rock fall originating from Glacier Point in Yosemite Valley, California. Environ. Eng. Geosci. 19, 345–361. doi: 10.2113/gseegeosci.19.4.345
Corominas, J. (1996). The angle of reach as a mobility index for small and large landslides. Can. Geotech. J. 33, 260–271. doi: 10.1139/t96-005
Dade, W. B., and Huppert, H. E. (1998). Long-runout rockfalls. Geology 26, 803–806. doi: 10.1130/0091-7613(1998)026<0803:LRR>2.3.CO;2
Davis, J. L., and Annan, A. P. (1989). Ground-penetrating radar for high-resolution mapping of soil and rock stratigraphy 1. Geophys. Prospect. 37, 531–551. doi: 10.1111/j.1365-2478.1989.tb02221.x
Doetsch, J., Linde, N., Pessognelli, M., Green, A. G., and Günther, T. (2012). Constraining 3-D electrical resistance tomography with GPR reflection data for improved aquifer characterization. J. Appl. Geophys. 78, 68–76. doi: 10.1016/j.jappgeo.2011.04.008
Evans, S. G. (2006). “Single-event landslides resulting from massive rock slope failure: Characterising their frequency and impact on society,” in Landslides From Massive Rock Slope Failure, eds S. Evans, G. Mugnzza, A. Strom, and R. Hermanns (Heidelberg: Springer), 53–73. doi: 10.1007/978-1-4020-4037-5_2
Evans, S. G., Mugnozza, G. S., Strom, A. L., Hermanns, R. L., Ischuk, A., and Vinnichenko, S. (2006). “Landslides from massive rock slope failure and associated phenomena,” in Landslides from Massive Rock Slope Failure, eds S. Evans, G. Mugnzza, A. Strom, and R. Hermanns (Heidelberg: Springer), 3–52. doi: 10.1007/978-1-4020-4037-5
Gosse, J. C., and Phillips, F. M. (2001). Terrestrial in situ cosmogenic nuclides: theory and application. Quat. Sci. Rev. 20, 1475–1560. doi: 10.1016/S0277-3791(00)00171-2
Guerin, A., Stock, G. M., Radue, M. J., Jaboyedoff, M., Collins, B. D., Matasci, B., et al. (2020). Quantifying 40 years of rockfall activity in Yosemite Valley with historical Structure-from-Motion photogrammetry and terrestrial laser scanning. Geomorphology 356:107069. doi: 10.1016/j.geomorph.2020.107069
Günther, T., Rücker, C., and Spitzer, K. (2006). Three-dimensional modelling and inversion of dc resistivity data incorporating topography-II. inversion. Geophys. J. Int. 166, 506–517. doi: 10.1111/j.1365-246X.2006.03011.x
Hermanns, R. L., and Longva, O. (2012). “Rapid rock-slope failures,” in Landslides: Types, Mechanisms and Modeling, eds J. Clague and D. Stead (Cambridge: Cambridge University Press), 59–70. doi: 10.1017/CBO9780511740367.007
Hewitt, K., Clague, J. J., and Orwin, J. F. (2008). Legacies of catastrophic rock slope failures in mountain landscapes. Earth-Sci. Rev. 87, 1–38. doi: 10.1016/j.earscirev.2007.10.002
Hovius, N., and Stark, C. P. (2006). “Landslide-driven erosion and topographic evolution of active mountain belts,” in Landslides from Massive Rock Slope Failure, eds S. Evans, G. Mugnzza, A. Strom, and R. Hermanns (Dordrecht: Springer), 573–590. doi: 10.1007/978-1-4020-4037-5_30
Hsü, K. (1975). On sturzstroms-catastrophic debris streams generated by rockfalls. Geol. Soc. Am. Bull. 86, 129–140. doi: 10.1130/0016-7606(1975)86<129:CDSSGB>2.0.CO;2
Huber, N. K. (1987). The Geologic Story of Yosemite National Park. U.S. Geological Survey Bulletin 1595.
Hutchinson, J. (2006). “Massive rock slope failure: perspectives and retrospectives on state-of-the-art,” in Landslides from Massive Rock Slope Failure, eds S. Evans, G. Mugnzza, A. Strom, and R. Hermanns (Heidelberg: Springer), 619–662. doi: 10.1007/978-1-4020-4037-5_32
Korup, O., Clague, J. J., Hermanns, R. L., Hewitt, K., Strom, A. L., and Weidinger, J. T. (2007). Giant landslides, topography, and erosion. Earth Planet. Sci. Lett. 261, 578–589. doi: 10.1016/j.epsl.2007.07.025
Lifton, N., Sato, T., and Dunai, T. J. (2014). Scaling in situ cosmogenic nuclide production rates using analytical approximations to atmospheric cosmic-ray fluxes. Earth Planet. Sci. Lett. 386, 149–160. doi: 10.1016/j.epsl.2013.10.052
Loke, M. H., Chambers, J. E., Rucker, D. F., Kuras, O., and Wilkinson, P. B. (2013). Recent developments in the direct-current geoelectrical imaging method. J. Appl. Geophys. 95, 135–156. doi: 10.1016/j.jappgeo.2013.02.017
Matthes, F. E. (1930). Geologic History of the Yosemite Valley. U.S. Geological Survey Professional Paper, 504. doi: 10.3133/pp160
McColl, S. T. (2020). The anomalously old Bush Stream Rock Avalanche and its implications for landslide inventories in dynamic landscapes. Front. Earth Sci. 8:103. doi: 10.3389/feart.2020.00103
Mitchell, W. A., McSaveney, M. J., Zondervan, A., Kim, K., Dunning, S. A., and Taylor, P. J. (2007). The Keylong Serai rock avalanche, NW Indian Himalaya: geomorphology and palaeoseismic implications. Landslides 4, 245–254. doi: 10.1007/s10346-007-0085-0
Moreiras, S. M., Hermanns, R. L., and Fauqué, L. (2015). Cosmogenic dating of rock avalanches constraining quaternary stratigraphy and regional neotectonics in the Argentine Central Andes (32 S). Quat. Sci. Rev. 112, 45–58. doi: 10.1016/j.quascirev.2015.01.016
Nagelisen, J., Moore, J. R., Vockenhuber, C., and Ivy-Ochs, S. (2015). Post-glacial rock avalanches in the Obersee valley, Glarner Alps, Switzerland. Geomorphology 238, 94–111. doi: 10.1016/j.geomorph.2015.02.031
Neal, A. (2004). Ground-penetrating radar and its use in sedimentology: principles, problems and progress. Earth-Sci. Rev. 66, 261–330. doi: 10.1016/j.earscirev.2004.01.004
Nishiizumi, K., Imamura, M., Caffee, M. W., Southon, J. R., Finkel, R., and McAninch, J. (2007). Absolute calibration of ↑10Be AMS standards. Nucl. Instrum. Meth. B 258, 403–413. doi: 10.1016/j.nimb.2007.01.297
Oldenburg, D. W., and Li, Y. (1999). Estimating depth of investigation in DC resistivity and IP surveys. Geophysics 64, 403–416. doi: 10.1190/1.1444545
Olhoeft, G. R. (1998). “Electrical, magnetic and geometric properties that determine ground penetrating radar performance,” in Proc. of GPR'98, 7th Int'l Conference On Ground Penetrating Radar (Lawrence, KS), 177–182.
Otto, J., and Sass, O. (2006). Comparing geophysical methods for talus slope investigations in the Turtmann valley (Swiss Alps). Geomorphology 76, 257–272. doi: 10.1016/j.geomorph.2005.11.008
Peck, D. L. (2002). Geologic Map of the Yosemite Quadrangle, Central Sierra Nevada, California. U.S. Geological Survey Geologic Investigation Series Map I-2751.
Phillips, F. (2017). Glacial chronology of the Sierra Nevada, California, from the Last Glacial Maximum to the Holocene. Cuadernos Invest. Geogr. 527–552. doi: 10.18172/cig.3233
Phillips, F. M., Argento, D. C., Balco, G., Caffee, M. W., Clem, J., Dunai, T. J., et al. (2016). The CRONUS-Earth project: a synthesis. Quat. Geochron. 31, 119–154. doi: 10.1016/j.quageo.2015.09.006
Plattner, A. (2020). GPRPy: Open-source ground penetrating radar processing and visualization software. Lead. Edge 39, 332–337. doi: 10.1190/tle39050332.1
Plattner, A. M., and Pacheco, M. (2019). A Community-Developed Free Ground Penetrating Radar Software. Near-Surface Views, Society of Exploration Geophysicists, 26.
Rood, D. H., Burbank, D. W., and Finkel, R. C. (2011). Chronology of glaciations in the Sierra Nevada, California, from ↑10Be surface exposure dating. Quat. Sci. Rev. 30, 646–661. doi: 10.1016/j.quascirev.2010.12.001
Rücker, C., Günther, T., and Wagner, F. M. (2017). pyGIMLi: An open-source library for modelling and inversion in geophysics. Comput. Geosci. 109, 106–123. doi: 10.1016/j.cageo.2017.07.011
Sass, O. (2006). Determination of the internal structure of alpine talus deposits using different geophysical methods (Lechtaler Alps, Austria). Geomorphology 80, 45–58. doi: 10.1016/j.geomorph.2005.09.006
Sass, O., and Wollny, K. (2001). Investigations regarding Alpine talus slopes using ground-penetrating radar (GPR) in the Bavarian Alps, Germany. Earth Surf. Proc. Land. 26, 1071–1086. doi: 10.1002/esp.254
Socco, L. V., Jongmans, D., Boiero, D., Stocco, S., Maraschini, M., Tokeshi, K., et al. (2010). Geophysical investigation of the Sandalp rock avalanche deposits. J. Appl. Geophys. 70, 277–291. doi: 10.1016/j.jappgeo.2009.12.005
Stock, G. M., Collins, B. D., Santaniello, D. J., Zimmer, V. L., Wieczorek, G. F., and Snyder, J. B. (2013). Historical rock falls in Yosemite National Park, California (1857-2011). U.S. Geol. Survey Data Ser. 746. doi: 10.3133/ds746
Stock, G. M., Martel, S. J., Collins, B. D., and Harp, E. L. (2012). Progressive failure of sheeted rock slopes: the 2009-2010 Rhombus Wall rock falls in Yosemite Valley, California, USA. Earth Surf. Proc. Land. 37, 546–561. doi: 10.1002/esp.3192
Stock, G. M., and Uhrhammer, R. A. (2010). Catastrophic rock avalanche 3600 years BP from El Capitan, Yosemite Valley, California. Earth Surf. Proc. Land. 35, 941–951. doi: 10.1002/esp.1982
Wahrhaftig, C., Stock, G. M., McCracken, R. G., Sasnett, P., and Cyr, A. J. (2019). Extent of the Last Glacial Maximum (Tioga) Glaciation in Yosemite National Park and Vicinity, California. U.S. Geological Survey Scientific Investigations Series Map 3414. doi: 10.3133/sim3414
Wieczorek, G. F. (2002). “Catastrophic rockfalls and rockslides in the Sierra Nevada, USA,” in Catastrophic Landslides: Effects, Occurrence, and Mechanisms, eds S. G. Evans and J. V. De Graff (Geological Society of America Reviews in Engineering Geology), Boulder, CO. 165–190. doi: 10.1130/REG15-p165
Wieczorek, G. F., Morrissey, M. M., Iovine, G., and Godt, J. (1999). Rock-Fall Potential in the Yosemite Valley, California. U.S. Geological Survey Open-File Report 99. doi: 10.3133/ofr99578
Wieczorek, G. F., Snyder, J. B., Waitt, R. B., Morrissey, M. M., Uhrhammer, R. A., Harp, E. L., et al. (2000). Unusual July 10, 1996, rock fall at Happy Isles, Yosemite National Park, California. Geol. Soc. Am. Bull. 112, 75–85. doi: 10.1130/0016-7606(2000)112<75:UJRFAH>2.0.CO;2
Xu, S., Freeman, S. P. H. T., Rood, D. H., and Shanks, R. M. (2015). Decadal ↑10Be, ↑26Al and ↑36Cl QA measurements on the SUERC accelerator mass spectrometer. Nucl. Inst. Methods B 361, 39–42. doi: 10.1016/j.nimb.2015.03.064
Keywords: rock avalanche, Yosemite Valley, cosmogenic nuclide exposure dating, near-surface geophysics, ground penetrating radar, electrical resistivity tomography
Citation: Pacheco M, Plattner AM, Stock GM, Rood DH and Pluhar CJ (2020) Surface Exposure Dating and Geophysical Tomography of the Royal Arches Meadow Rock Avalanche, Yosemite Valley, California. Front. Earth Sci. 8:372. doi: 10.3389/feart.2020.00372
Received: 01 April 2020; Accepted: 10 August 2020;
Published: 17 September 2020.
Edited by:
John Joseph Clague, Simon Fraser University, CanadaReviewed by:
Jeff Moore, The University of Utah, United StatesO. Adrian Pfiffner, University of Bern, Switzerland
Copyright © 2020 Pacheco, Plattner, Stock, Rood and Pluhar. This is an open-access article distributed under the terms of the Creative Commons Attribution License (CC BY). The use, distribution or reproduction in other forums is permitted, provided the original author(s) and the copyright owner(s) are credited and that the original publication in this journal is cited, in accordance with accepted academic practice. No use, distribution or reproduction is permitted which does not comply with these terms.
*Correspondence: Alain M. Plattner, amplattner@ua.edu; Greg M. Stock, greg_stock@nps.gov