A Nation-Wide Framework for Evaluating Freshwater Health in China: Background, Administration, and Indicators


1
Hydraulic Engineering Department, Nanjing Hydraulic Research Institute, Nanjing 210029, China
2
Department of Civil and Environmental Engineering, The University of Auckland, Auckland 1010, New Zealand
*
Author to whom correspondence should be addressed.
Water 2020, 12(9), 2596; https://doi.org/10.3390/w12092596
Submission received: 31 August 2020
/
Revised: 14 September 2020
/
Accepted: 15 September 2020
/
Published: 17 September 2020
(This article belongs to the Special Issue Water Resources Management Models for Policy Assessment)
Abstract
:This study reviewed the existing experience of implementing the nation-wide freshwater health evaluation in China and around the world and proposes a new framework that works in collaboration with the River Chief System (RCS). The institutional context of China with intertwined political and scientific considerations makes it essential to establish a concise and quantitative approach to assess the effectiveness of the RCS as well as local freshwater health conditions that can be easily understood by non-experts for decision-making. To fulfil this objective, we reconstructed the indicator categories based on the best practices in major western countries and the existing regional standards in China. The new indicator framework includes two main aspects: Ecosystem integrity (physical habitat, water quantity, water quality, and aquatic life) and non-ecological performance (social services and water governance). Specifically, the non-ecological attributes of freshwaters are in accordance with the purposes of the RCS and are usually ignored in many countries. The final health grade for a specific water body is determined by a weighted averaging method; this grade is the core element of an evaluation protocol designed to produce reliable data for adaptable water resources governance in China. The research findings in this study will also be integrated into the new national standard to be issued by the Ministry of Water Resources of China in late 2020.
1. Introduction
There has been a longstanding recognition of the need for maintaining and improving the status of freshwater ecosystems across the world. Freshwater resources, mainly consisting of rivers and lakes, are closely related to not only the natural environment but also the human society as well as how human beings are engaged with the environment. The United Nations’ Sustainable Development Goal 6 (SDG6), ‘Clean Water and Sanitation’ [1] sets goals of ensuring global water access and safety by 2030 by investing in adequate infrastructure and protecting and restoring water-related ecosystems. SDG 6 recognizes that water has multiple values and that they are all related, i.e., the success in one may depend on another. For example, a healthy freshwater ecosystem entails not only good water quality (less pollution) and low water stress (reasonable consumption), but also the improved water governance. This worldwide consensus was reached after decades of exploration and efforts made by many countries to find a well-balanced combination of ‘led-by-science’ and ‘led-by-administration’, while this exploration still continues.
The well-known Clean Water Act of 1977 was enacted in response to the dramatic pollution in the 1970s in the USA and is the world’s first comprehensive and systematic environmental law for managing freshwater health [2]. Since the 1990s, researchers have contributed to developing advanced freshwater health frameworks beyond the original non-modern working modes; and the governments of many countries are working with scientists and the public to explore innovative approaches. For example, the European Water Framework Directive 2000 (WFD) was a valuable attempt to establishing a large transboundary cooperation framework, although the outcomes are not satisfactory in some aspects due to the unrealistic timeframe and the lack of functional indicators [3,4]. The flawed performance of the WFD also highlights the importance of a system with consistent administrative supervisions and enforcements; for example, the United Kingdom, even Scotland itself, have their own detailed assessment approaches [5,6,7]. In New Zealand and Australia, officials and scientists have also been aware of the urgency and made remedial efforts to upgrade the existing protocols [8,9].
Understanding the meaning of river (lake) health is another obstacle for countries with goals of sustainable development. Many researchers have been describing and debating the concept of river (lake) health since the 1990s [10,11,12,13,14]. As usefully defined by Meyer [15], a healthy water body can keep its ecological functions while maintaining the needs of the society. The models proposed by Boulton and Lackey [12,16] provided an important point of view that the human use of rivers does not automatically mean that the ecosystem health is being degraded. A healthy river (or lake) should contain both ecological values (ecological integrity and resilience to stress) and human values (social services and benefits). Therefore, ecological integrity is one part of a healthy ecosystem but not the only part; the lack of human values might also be detrimental. Usually, ecological integrity includes the physical, chemical, and biological components [17] and has long been treated as the major (sometimes the only) aspect of freshwater assessments. Obviously, incorporating social indicators is of significance, as detailed by Hanna et al. [18].
In the past decades, the health status of rivers and lakes in China has undergone significant deteriorations due to urban development and the increasing water use. Severe outcomes, e.g., water pollution, hydrologic mutation, the damaged physical structures, and the degenerated ecological diversity and functions, have attracted wide attention from governments and researchers. For example, in the 2000s, the water pollution in Guangdong Province, one of the most prosperous region in China, significantly affected the sustainability of the regional social economy while was rarely contained by local officials [19]. The outbreak of blue-green algae in Wuxi, Jiangsu Province, in 2007 eventually pushed the central government of China to establish a nation-wide system to contain pollution with a consistent protocol [20]. This is the origin of the River Chief System (RCS) known by the public nowadays. Since 2016, China has been fully implementing the RCS to build an efficient and productive framework that involves not only administrative innovations but also refined scientific guidelines to ensure the adequacy of specific evaluations. The principle of the RCS is using a hierarchical administrative structure with well-defined responsibilities and accountabilities to avoid the inaction of officials at different levels. Therefore, evaluating and improving freshwater health in China has become an issue with intertwined political and scientific drivers that make the original working models much less effective than expected. At the moment, China is still lacking a comprehensive evaluation framework due to the vast regional differences and the insufficient administrative experience of managing the massive RCS system. This study is conducted based on the request of the Department of River and Lake Management of the Ministry of Water Resources of China in 2019. As stated, it is essential to clarify the meaning and criteria of river/lake health and propose a systematic approach that fits for the characteristics of the RCS to improve the freshwater health in China.
The objectives of this paper include: (1) Reviewing the relevant research on the RCS comprehensively and providing a clear picture of its working mechanism; (2) comparing the best practices in China and the rest of the world to highlight the key aspects that are ignored and the lessons learnt; (3) analyzing the existing freshwater health indicators adopted by researchers and practitioners to help understand their strengths and weaknesses; and (4) proposing a new evaluation framework for the future implementation within the framework of the RCS in China. The achievement made in this study will be integrated into the new national standard to be issued by the Ministry of Water Resources of China. The specific methods for field sampling and data collection, aggregation, harmonization, and integration are beyond the scope of this paper.
2. Methodology
The literature review in this study is mainly focused on two aspects: The research on the RCS in China, and the research and application of freshwater health indicators both in China and around the world. Regarding the RCS, only published materials in English are reviewed in this paper to reach a wider audience. Nevertheless, a large number of scholars in China have made significant contributions by publishing articles in Chinese, which are recommended to be read extensively, if possible, for a better understanding of the development of the RCS. Regarding freshwater health indicators, the authors have collected most of the systematic and well-structured regional standards/guidelines in China, which are either formal documents or unpublished drafts, by extensive data search and enquiry. Data sources without a clearly defined indicator framework are not included. International frameworks reviewed in this paper are restricted to those that have significant influence across the world and have been well studied and improved. Therefore, the selected frameworks include the European WFD and those applied in major English speaking countries, including the USA, the UK, Australia, New Zealand, and Canada. The practices of other countries or regions are also reviewed but not included. The indicators used by the reviewed materials are further summarized and analyzed later in this paper to produce a new evaluation framework. In regard to data integration, similar categories, sub-categories, or individual indicators that have different names are compared carefully in terms of their definitions, and only the most widely adopted names are kept to avoid confusing readers. For example, the term ‘physical habitats’ is used to replace all the similar terms like ‘forms’ or ‘physical environments’; nitrogen-related indicators, e.g., total nitrogen and dissolved nitrogen, are all replaced by the generic term ‘nitrogen’.
The methodology of this paper is also subjected to limitations. The detailed approaches to determine the characteristic value of each indicator are not addressed so that this paper intends to provide an overview of freshwater health evaluation instead of technical instructions. Furthermore, the practical experience gained in the developed world, as well as the working model of the RCS, might not be suitable for less developed countries or regions, as the tradition and awareness of preserving water resources differ, and their needs for boosting economy are much more urgent. We argue that protecting water resources and ecosystems does not automatically entail the sacrifice of economic development, and it is also inequal to enforce the same level of restrictions to countries of different levels of prosperity. More efforts should be made to facilitate the coordination of global sustainable development under the framework of the UN’s SDG6.
3. River Chief System (RCS) in China
3.1. Recent Literature in English
The implementation of River Chief System has facilitated the effective integrated freshwater management and water protection campaigns in China in the last decade and also attracted extensive research interests both domestically and internationally. Dai [21] introduced the history of the River Chief System and provided a perspective to the water governance in China as well as what role formal laws have played during the transition to the RCS. Huang and Xu [22] argued that the public participation of RCS mainly depends on local government, which, although ensures effective integration of resources, might impede the real public participation and supervision due to the political complexity of water governance in China. Wang et al. [23] stated that, although RCS can improve the work efficiency of water governance in the short-term, more efforts are still needed to the problems of organizational logic and the responsibility dilemma that remain due to the persistence of vertical coordination of the hierarchical system. Liu and Richards [20] summarized the structure of the RCS and the progress of implementation and identified future challenges. Similar to Wang et al. [23], Liu and Richards [20] also pointed out the flaw of the existing RCS regarding trans-regional collaboration and accountability. Liu et al. [24] presented a case study of Foshan in Fujian Province and showed that the RCS could establish a considerably sophisticated and effective management structure. More recently, Wang and Chen [25] argued that the institutional context and motivations are the external conditions influencing the collaborative governance regime and thus the outcomes of the RCS. In general, numerous studies in recent years have noticed and identified the internal flaws of the existing RCS that may influence its sustainability and efficacy in the long-term. Compared with the water governance policies in many other western countries (e.g., USA, UK, Australia, and New Zealand), the political and administrative complexity of China makes it necessary to come up with a more structured and practical approach to management the River/Lake Chiefs at different levels and assess their performances.
3.2. Policy
As summarized by Wang and Chen [25] the institutional context of China contains three major elements: The centralized political authority [26], the party-state hierarchy [27,28], and the cadre responsibility system [29]. This context enables the central government of China to play the role of ‘policy issuer’ while maintaining sufficient authority of enforcement at different administrative levels through a top-down performance assessment structure. Since the full implementation of the RCS in 2016, the central government (mainly the Ministry of Water Resources) has issued multiple instructive documents in regard of the responsibility, accountability, major problems to be addressed, and the principle of assessing the performance of Chiefs [30,31,32]. Meanwhile, the local governments (mainly in provincial level) are responsible for making their own regulations under the prescribed framework due to the absence of national legislation for the RCS. In contrast, many western countries tend to leave water resources management relying on a relatively flat structure by establishing managerial agencies at the level of individual river basins, which is partly due to the lack of central authority. For example, the European WFD provides motivations to initiate waterways monitoring programs as well as directions for its EU member states on data processing and reporting so that their results will be comparable. However, the duties of managing specific river basins, e.g., Rhine River Basin, still belongs to relatively independent organizations like The International Commission for the Protection of the Rhine against Pollution (ICPR), which is co-chaired by ministers from stakeholder countries. This working model is more about cross-border collaboration and coordination and is obviously not suitable for China that needs a well-defined procedure for top-down supervision.
3.3. Assessing the Performance of Chiefs
By the end of 2018, RCS had been established and fully implemented in all the 31 provinces and regions in China with over 300,000 River (Lake) Chiefs being appointed at provincial, municipal, county, and township levels. Thus, as mentioned above, it is necessary to build a comprehensive and effective approach to assess the performance of those River (Lake) Chiefs, and this approach is much different to the assessment of freshwater health itself that is mainly determined by scientific criteria. More considerations are raised due to the political and administrative complexity of the RCS. The transition from ‘rule by men’ to ‘rule by law’ [25] entails not only assessing to what extent the RCS has been established and supervised by the heads in different administrative levels, but also how intertwined scientific and political requirements are satisfied during this implementation process. Therefore, a practical and straightforward assessment approach was urgently needed and have been proposed accordingly based on the existing outlines [33], as summarized in Table 1. This approach was officially released in 2019, and, together with the freshwater health scoring approach to be discussed later in this paper, comply well with the principle of using quantifiable measures for assessments. We also believe this approach can be well applied in other countries after adaption.
4. Integrated Indicator Framework
Evaluating the health status of freshwater also heavily relies on the establishment of a practical and comprehensive scientific framework based on the best practices around the world. In this study, we aim to investigate how ecological and non-ecological indicators are adopted and incorporated in different regions of China and other major western countries with substantial experience. A comprehensive data and literature research are therefore conducted and will be presented in detail in this section.
4.1. Data Sources
Although the River Chief System has already been established across the country, the lack of a nation-wide operational standard forced the local government to resort to their existing experience or routines for implementing assessments; those routines usually show enormous inconsistency and even contradiction sometimes. Currently, only a few standards have been issued officially in provincial or municipal levels, while some other regions still rely on “drafts”, “trial documents”, or informal manuals that are subjected to many limitations. Table 2 summarized the existing regional standards, guidelines, and specifications being used in China [34,35,36,37,38,39,40,41,42,43,44,45,46,47,48]. Furthermore, we also reviewed the frameworks implemented in some major western countries for comparative analysis, such frameworks including the United States (National Aquatic Resources Surveys (NARS)) [49,50,51], New Zealand (Cawthron’s Freshwater biophysical ecosystem Health Framework) [9], Australia (Integrated Ecosystem Condition Assessment) [8], and the United Kingdom (Common Standards Monitoring Guidance for Rivers/Lakes) [5,6]. Some other national or regional frameworks known by the public (e.g., Canadian Aquatic Biomonitoring Network (CABIN), the Murray-Darling Basin Sustainable Rivers Audit of Australia, and the National Environmental Monitoring and Reporting of New Zealand) are also reviewed but are not included in this section as they only focus on limited aspects of freshwater health or are relatively outdated and have been superseded in their own countries. More details can be found in [52,53,54,55] regarding those frameworks. It should also be noted that although the European Water Framework Directive (WFD) streamlines the legislation across Europe and provides guidance to member states on what component indicators are necessary (i.e., biological quality, hydro-morphology, and physicochemical attributes), the implementation is still inconsistent and varies widely from country to country. Therefore, in this study, we only selected the UK guidelines as representatives as they have been widely accepted and well examined. The overseas frameworks included in Table 2 are the best practices in the corresponding countries and have been well revised and modified for better effectiveness.
4.2. Key Components of an Evaluation Framework
After reviewing the documents listed in Table 2, we summarized the core components of a freshwater health framework, as shown in Table 3. The definition of a healthy freshwater ecosystem in New Zealand is stated by the National Policy Statement for Freshwater Management (NPS-FM) [56] as that reflects the importance of physical and chemical as well as biological elements of ecosystems. In the United States, NARS divides the basic indicators into four categories: Biological, physical, chemical, and recreational; the last category is a measurement of the pathogen and pollutant substances that can threaten people’s wellbeing during recreational activities. The UK and Australian guidelines [5,6,7,8] further introduced more indicators in regard to social services; the former concerns more about the direct disturbance to human beings while the latter about the social functions and values provided. In general, biophysical ecosystem health can be represented by a measure of ‘ecological integrity’ [9], but it is only one part of an assessment of the ability of a freshwater ecosystem to support multiple freshwaters values. Even for ecological integrity itself, a well-balanced assessment cannot be achieved by a single biophysical measure because an ecosystem is a complex network of interacting biological communities and their physical environment. Therefore, the core components of a freshwater health framework should include the following sectors: Aquatic life (fauna, flora and microbes), water quality (physio-chemical features and pathogens), water quantity (hydrology), physical habitat (forms), ecological processes, and, as mentioned above, social services and values. Specifically, “ecological processes” are the interactions among aquatic lives and their environment and can be represented by a series of individual indicators in other categories to suggest the status of dynamic biochemical processes [57,58]. The assessment of ecological processes entails advanced knowledge and experience and may be relatively more difficult than other categories.
It should also be noted that, as discussed previously, the unique administrative hierarchy in China make freshwater health a political mission that is directly related to the performance of local officials. Therefore, water governance indicators should also be included in this framework with quantifiable items and practical calculation methods.
4.3. Comparison
Table 4 shows the detailed comparison of indicators used by the standards and guidelines summarized in Table 2. The following issues should be noted:
- For the four overseas frameworks included, only the Australian guideline introduced social service indicators. The recreation indicators used by NARS are actually still biological and physio-chemical indicators or pathogens and could be more reasonably integrated into those corresponding categories.
- Many standards in China (e.g., Jiangsu, Shandong, Fujian, and Suzhou City) suggest referring to other national standards (GB3838-2002: Environmental quality standards for surface water; SL395-2007: Technological regulations for surface water resources quality assessment) for instructing water quality assessment. We also recommend this approach as those two water quality standards have been well examined during practices.
- “Ecological processes” is a relatively abstract and unintuitive concept compared with other categories and is only recommended by New Zealand’s framework. Each ecological process can actually be represented by the values of specific physio-chemical or biological indicators, e.g., nutrient loads and BOD5.
- Zoning indicators include: (1) The classification of water function zones that will be discussed later in this paper; (2) the clarification responsibilities; (2) and (3) the implementation of water quality management in different water function zones.
By comparison, we find that 11 indicators are mentioned over 10 times, including riparian vegetation coverage, dissolved oxygen, eco-water (environmental flow), water mobility and connectivity, riparian naturalness, macroinvertebrate, phosphorous, ammonia or nitrate, heavy metals, flood protection, and zoning indicators. The most significant distinction between Chinese standards and overseas frameworks will be further discussed in the following section.
4.4. Indicators Highlighted
Based on the comparison of detailed indicators shown in Table 4, the major difference between those widely used in China and in major western countries are mainly non-ecological indicators, e.g., social services and water governance indicators. This difference is attributed to the different social cultures and administrative structures between China and western countries. The adoptions of ecosystem-related indicators are generally similar and consistent, as mentioned in the last section. This section discusses the details of those discrepancies as well as how those indicators are adapted in China.
4.4.1. Indicators of Social Services and Values
Current frameworks used by major countries across the world have paid much attention to ecological values when evaluating the health status of rivers, lakes, and wetlands. In contrast, very few countries have made attempts to include human values. The Australian Integrated Ecosystem Condition Assessment (IECA) [8] recommends to include cultural, regulating, and provisioning services in the evaluation process but does not provide detailed indicator sets. The National Aquatic Resource Survey (NARS) of the United States [49,50,51] uses four indicators (Algal toxins, Cyanobacteria, Enterococci, and fish tissue contaminants) to assess the status of recreational functions, but does not pay much attention to the broader concepts of human values. In general, although a few studies have emphasized the importance of social services, more works are still needed to convert the existing research accomplishments of scientists to guide the actions of governments and authorities.
The first systematic attempt to define human services was made by the Millennium Ecosystem Assessment [59]. In this report, ecosystem services are divided into four categories, including cultural ecosystem services, provisioning ecosystem services, regulating ecosystem services, and supporting ecosystem services; the first three categories resemble those prescribed by the Australian IECA guideline. Specifically, cultural ecosystem services include non-material benefits such as recreational activities (e.g., swimming), the aesthetic beauty of rivers, and their spiritual significance among many communities. Provisioning ecosystem services include the products obtained, e.g., drinking water supply, fish, etc. Regulating ecosystem services include the benefits obtained from the regulation such as erosion prevention, pollution reduction, and flood protection. Furthermore, supporting ecosystem services include processes that help the production of other services, such as nutrient cycling and habitat provision, which are closely related to specific water quality indicators. As a recent and representative study, Hanna et al. [18] systematically reviewed 89 relevant studies and summarized the human services provided by rivers. It is found that the most studied and discussed social services are recreation and tourism and water supply that can provide visible monetary benefit. Regarding the categories, provisioning and regulating indicators have been much more studied than the other two categories (cultural and supporting). However, in China, more attention has been paid to flood protection engineering and public satisfaction as those measures can be more easily quantified and related to the performance of officials. Therefore, it is essential to combine the most emphasized indicators both in China and overseas to build a refined social services indicator set.
4.4.2. Indicators of Water Governance
As mentioned previously, one distinct feature of evaluating freshwater health in China is the close connection between science and politics. The establishment of the River Chief System facilitates the clarification of the responsibility and accountability of local government officials, who, however, lack the necessary scientific background and expertise to actively engage with and manage the specialist teams and track their performances. The political structure and hierarchy in China could not grant sufficient authority to any stand-alone managerial committee that supervises the condition of specific water bodies. Therefore, introducing a set of water governance indicators is obviously necessary and may assist the local RCS heads (i.e., Chiefs) to involve with the detailed scientific programs in a practical and concise way.
One of the most typical water governance indicators is the water condition in different water function zones, which enable the RCS heads to gain a general understanding of the spatial-temporal distribution of health status without going through too many details. The definition of water function zones in China is prescribed by the Ministry of Water Resources [60] according to the purpose of water usage, as shown in Table 5. Many existing standards in China (see Table 4) only implicitly prescribed that “water quality status should meet the criteria in different water function zones”. The criteria in Table 5 should be widely used for the classification of main water areas in China and clearly suggest the suitable working objectives of Chiefs in different regions.
Other water governance indicators in Table 4 are also closely related to the operation of the RCS and are rarely used by common guidelines oversea.
4.4.3. Indicators of Ecosystem Resilience
The definition of resilience shows significant ambiguity regarding the restoring capability of an ecosystem and usually to some extent overlaps with some other individual indicators that can be more explicitly measured or quantified. Resilience is a measure of persistence; ecological resilience measures the magnitude of disturbance that a system can absorb before it undergoes changes in structure and function [61]. As stated by Davies et al. [54], ecosystems incorporate the properties of the living and non-living components with “emergent properties”, e.g., diversity and resilience. Those properties are more like attributes of the system rather than its components and cannot be directly observed or measured intuitively. A typical ecosystem health monitoring may examine components and processes that are sensitive to disturbances over a range of spatial-temporal scales [13]. Those disturbances might include losses of native flora and fauna, and the invasion of alien species may further complicate the conditions. For example, Scotland’s Environment Protection Agency (EPA) uses the condition of peatland and the number of a few alien species (e.g., grey squirrel and American mink) to determine the recovery capacity of an ecosystem. Another approach is to monitor the products of ecological processes operating over a range of scales [62], e.g., dissolved oxygen and chemical oxygen demand (COD), which are also key components of water quality monitoring. Although being of scientific significance, using resilience indicators needs balanced scientific judgement and may unnecessarily complicate the evaluating process. The tradeoff between science and administration is one of the core components of the RCS, and thus the formal application of resilience indicators might not be suitable but can provide supplementary information for experts.
4.4.4. Eco-Water (Environmental Flow)
Eco-water, or environmental flow, is another key indicator to measure the level of satisfaction of water quantity needed for maintaining the basic ecosystem functions and processes. A large number of studies has been published in recent two decades regarding this topic. Tharme [63] provided a comprehensive review of the concept of environmental flow as well as the existing environmental flow methodologies around the world. The methodologies can usually be divided into four categories: Hydrological, hydraulic rating, habitat simulation, and holistic methodologies. Specifically, hydrological methodologies that rely on arbitrary low flow indices are the most widely applied and easy-to-use category. Kuriqi et al. [64,65] provided new insights into the interaction between hydropower energy yields and environmental flow, as well as the needs for maintaining the balance of the ecosystem. Although the European WFD does not use the term “environmental flow” explicitly, the required biological status can only be achieved when the necessary hydrological regimes are maintained [66]. The UK also has set environmental standards for water abstraction limits and appropriate water release from reservoirs. Poff and Zimerman [67] reviewed the relevant publications in the last decades and emphasized that the risk of ecological deterioration may increase with increasing magnitude of flow alteration. Many studies [68,69,70] have also paid attention to the significance of environmental flow for water governance.
In China, most of the regional standards and guidelines reviewed in this study adopt eco-water/environmental flow methods to evaluate the health status of local rivers and lakes (see Table 4). Considering the difficulty of introducing complex methodologies within the framework of the RCS, a certain level of simplification is required. Currently, the standard issued by the Ministry of Water Resources of China [71] provides a simplified scoring method, based on the ratio of the minimum daily averaged discharge to the multi-year average discharge in the corresponding period. The final score is determined by calculating the lowest score in the periods of October to March and April to September, respectively. This approach, with the further involvement of aquatic life indicators, may reflect the local ecosystem-related hydrological conditions and is thus recommended to be carried on to the new framework.
5. Discussion
5.1. Lessons Learnt
5.1.1. Well-Defined Objectives and Motivations
A strong policy driver from authorities may provide the purpose for, and clear direction on, setting well-defined and descriptive objectives for regional water governance and specific monitoring and reporting activities. This driver is essential for maintaining the long-term sustainability and consistency of the existing framework. For example, the European Union’s WFD has stated that the objectives are protecting and enhancing the health of aquatic ecosystems while successfully maintaining social and economic systems [72]. As requested, all European Union member states should achieve at least ‘good ecological status’ for all ‘natural’ water bodies by 2015 and at the latest by 2027. Although being too strict regarding the timeframe, the WFD’s objectives have facilitated the comprehensive implementation of freshwater surveys and thus successfully obtained a large dataset for scientific judgement and further policy adjustment. In the USA, the objective of the Clean Water Act is restoring and maintaining the chemical, physical, and biological integrity of the waters, and thus the aims of the National Aquatic Resource Survey (NARS) is to provide robust data to help the corresponding assessments. In China, as defined by the central government, the main objectives of water governance at the current phase include mitigating human disturbance to water bodies (e.g., illegal mining, occupation, disposing, and constriction), enhancing local and regional regulations, and improving the public satisfaction and people’s living quality. Therefore, the RCS was established accordingly to build a hierarchical administrative structure with clear responsibility and accountability. In general, the detailed approach for implementation should fit for the high-level goals set by authorities.
5.1.2. Comprehensive and Practical Indicator Metrics
Using a wide range of indicator metrics ensures that all essential aspects of ecosystem health are addressed. For those well-accepted frameworks outside China, biological (aquatic life) indicators are the core components that also reflect the need to measure the combined response to multiple pressures in a catchment. Those indicators are usually assessed in addition to water quality and habitat indicators and sometimes water quantity and ecosystem processes. As a result, the status of ecological integrity can be accurately assessed, but social values are rarely mentioned. In contrast, the previous practices in China overemphasized the importance of administration and management while not treating different aspects of an ecosystem as a dynamic entity.
Furthermore, during the establishment and implementation of the RCS in China in recent years, we found that the most complained part of the initial RCS framework is that the poorly trained local RCS heads had to be held accountable for what they did not fully understand. Overstretching the scientific aspect does not automatically lead to a better outcome.
5.1.3. A Standard Data Acquisition and Analysis Protocol
A standardized data approach ensures the consistency of evaluation results, which is crucial to the nation-wide implementation of the RCS. Some overseas frameworks (e.g., NARS and CABIN) are based on standardized approaches including field survey design, data collection and processing, and reporting. Some other frameworks (e.g., European WFD and the UN’s SDG 6) integrate data from different methods and make comparisons by data harmonization. In New Zealand and Australia, scientists have also been making efforts to establish standardized measurement protocols, but more works are still required on determining how to incorporate different components of river health into assessment programs in terms of network design and reporting [9]. Therefore, we intend to propose a functional and standardized protocol that is suitable for the RCS in China, which will be discussed in detail in the next section.
5.1.4. Adaptability
An adaptable framework is capable of adjusting or “upgrading” itself through a structured and iterative process that supports robust decision-making in the face of uncertainty. This feature is especially crucial for a country with typical hierarchical administrative structures that might cause unintended delay during decision-making. As a national standard, the indicator framework proposed in this study (see following sections) that is about to be officially issued this year will be reviewed and revised as a routine of two years.
5.2. A New Evaluation Protocol
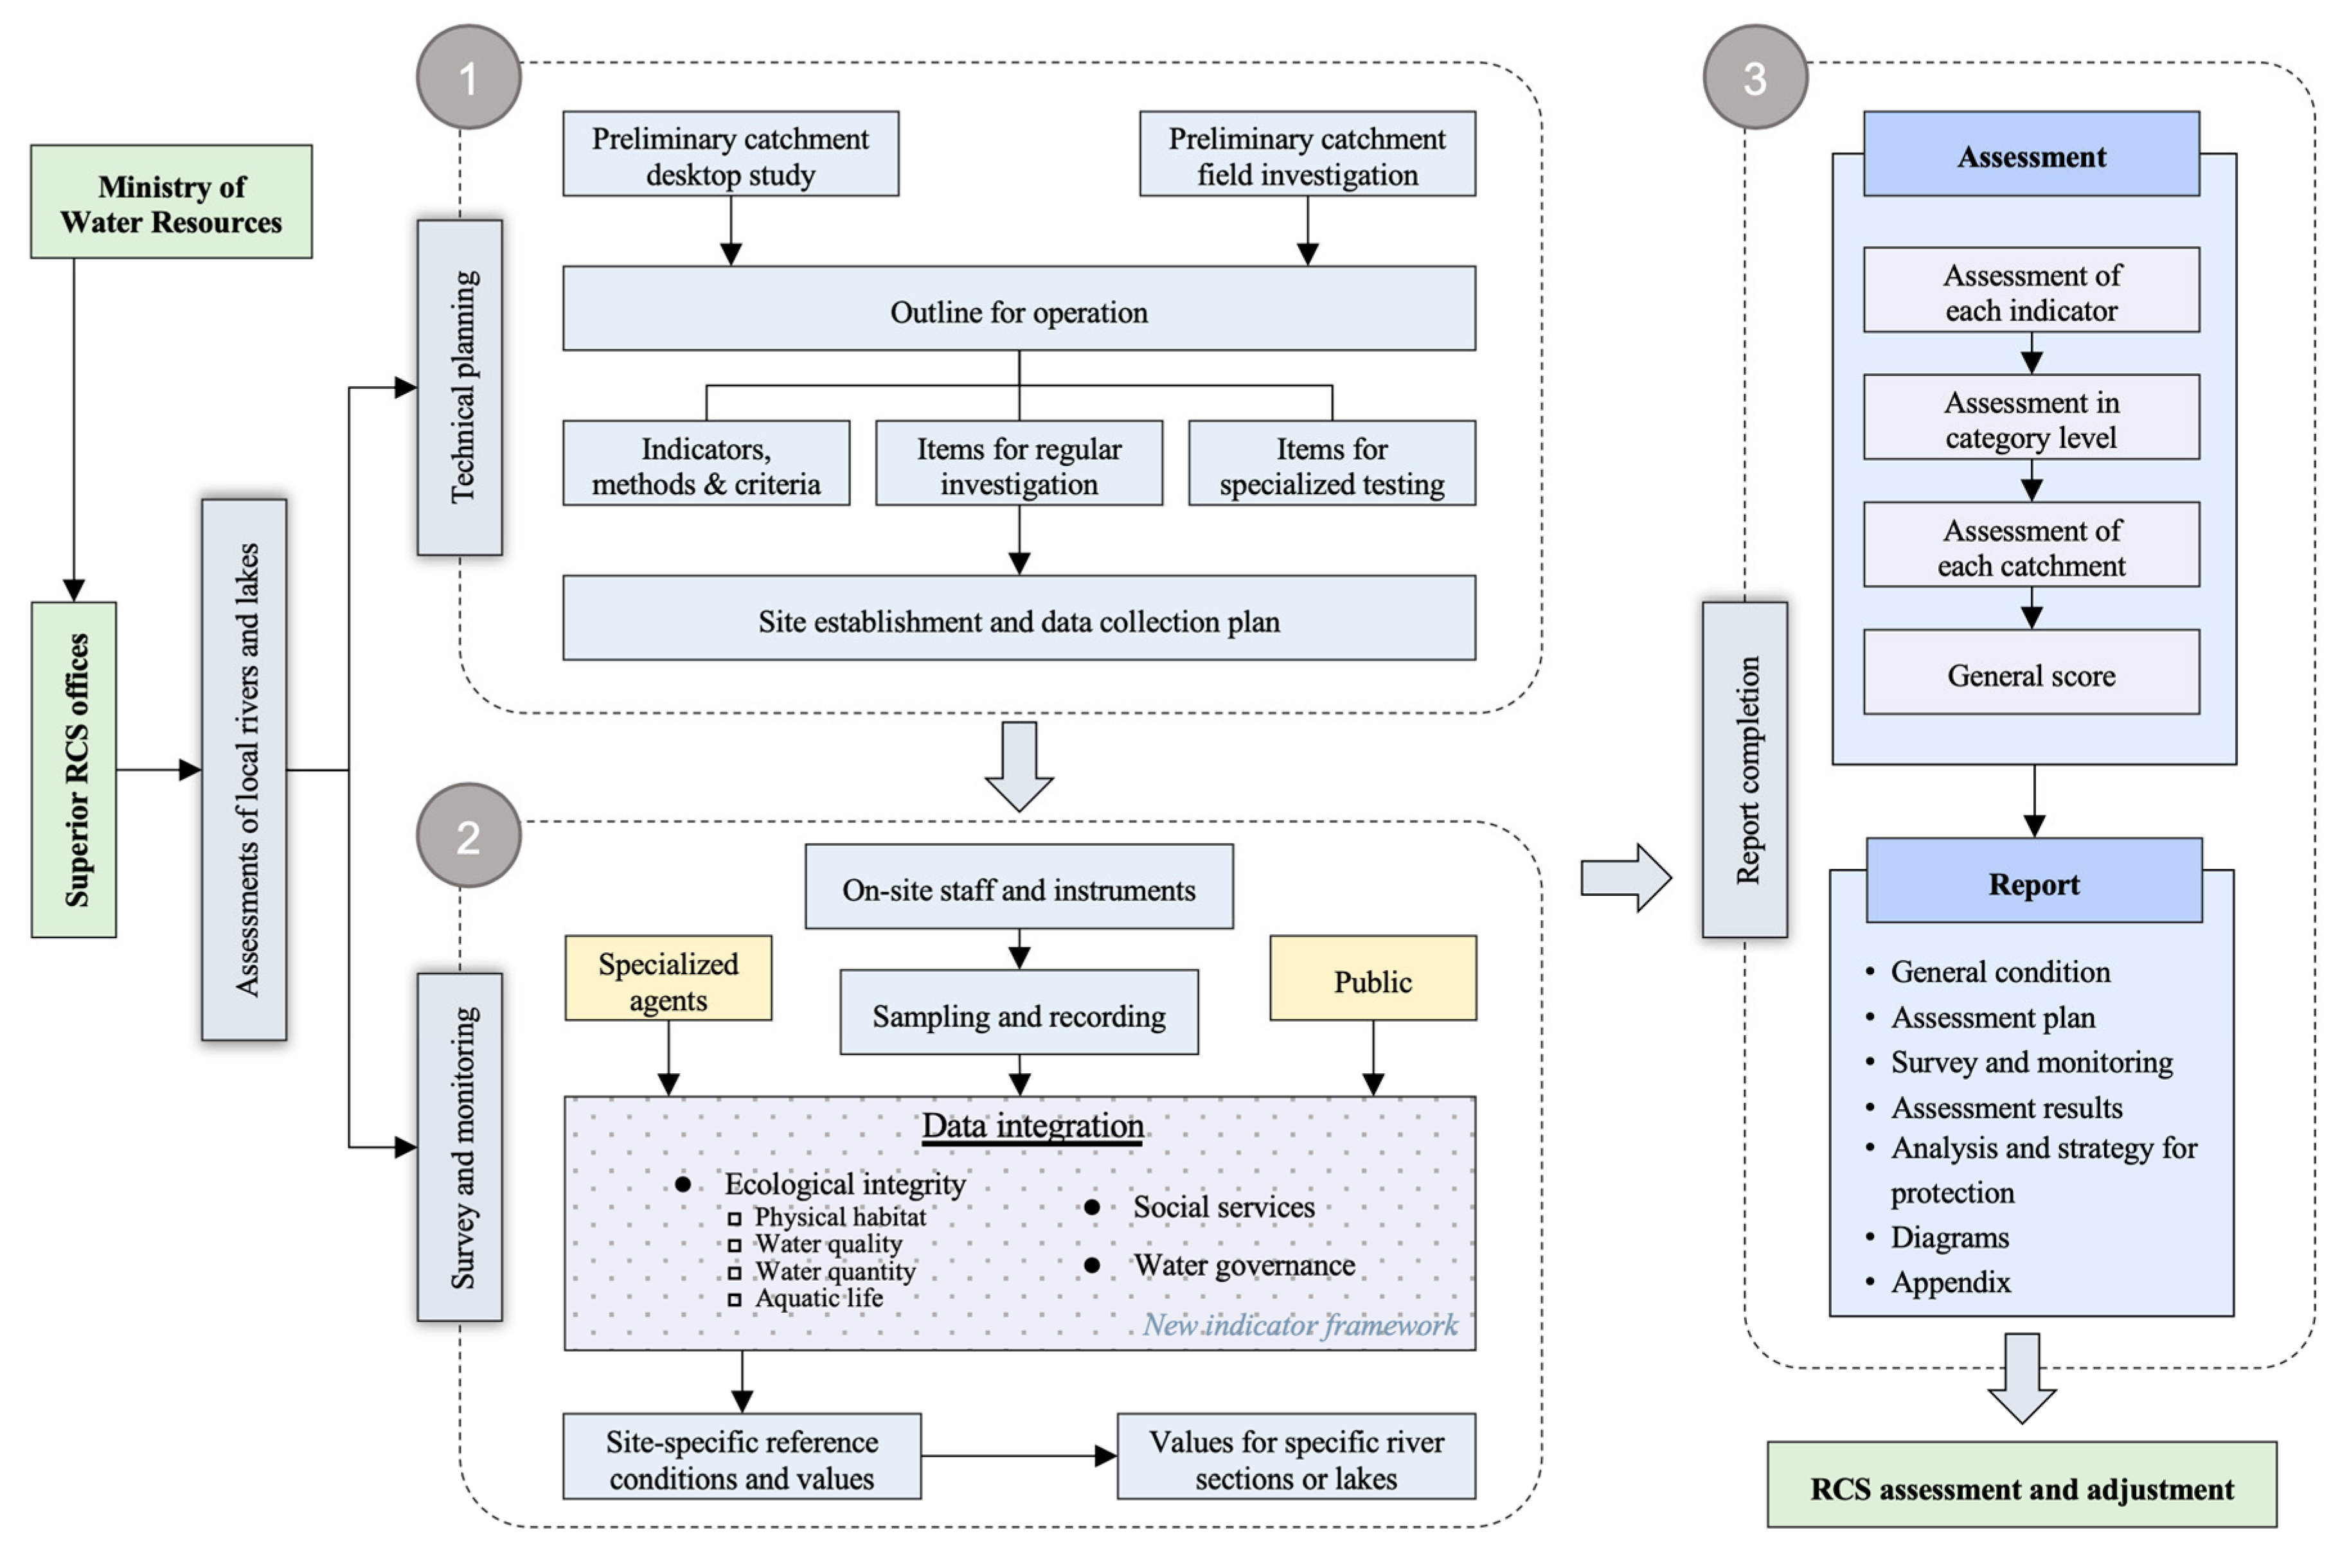
As mentioned previously, a new protocol is proposed in this study to fit for the nation-wide implementation of RCS in China, which is displayed in Figure 1. This protocol is now going through the consultation process and will be officially issued by the end of 2020. Figure 1 shows the three core components of the protocol, including technical preparation, survey and monitoring, and report preparation. Specifically, “technical preparation” provides detailed instruction for preparing for field operation and data acquisition, and this sector is beyond the scope of this study. The following section will present and discuss the newly proposed indicator framework used as the core component of “survey and monitoring”. In addition, the results in the complied final report will be concise and understandable to non-experts and can be used to support the assessment of Chiefs.
5.3. Modified Indicator Framework
Table 6 summarizes the refined indicator framework to be adopted in China as well as the details of data sources and collection method. More specific sampling and testing methods are not discussed in this paper as they are beyond the scope of this study. It can be found that the indicators are classified into three main categories: ecological integrity, social service and water governance. Specifically, ecological integrity can further be classified into four sub-categories (physical habitat, water quantity, water quality and aquatic life) based on the existing experience and best practices around the world.
We recommend that the assessment of water quality follows the existing national standard implemented in China (GB3838-2002 and SL395-2007) [46,47] instead of building another new protocol, as the existing practices have been proved efficient with the reliable outcome. Specifically, GB3838-2002 [46] provides an extensive list of the substances (and threshold values) to be examined for general surface waters and, more importantly, centralized drinking water sources. The included items are more comprehensive than most of the overseas guidelines, and the testing can be conducted by the existing specialized agencies to produce concise reference reports for decision-making officials or Chiefs. SL395-2007 [47] provides an extra composite measure for lakes to determine the degree of eutrophication based on s series of individual water quality indicators (e.g., total nitrogen, total phosphorous, chlorophyll a, permanganate, clarity, etc). Those two standards have also been adopted by some pioneering provinces in China, e.g., Jiangsu, Shandong, and Fujian Provinces (see Table 4). Therefore, a seamless transition to the new nation-wide framework can be accomplished and save administrative resources significantly. Furthermore, the calculation of eco-water (environmental flow) demands can be made based on the existing standard [71]. The daily averaged discharge for rivers or daily averaged water level for lakes are compared with the calculated minimum demands to evaluate to what extent the necessary environmental flows are satisfied.
As shown in Table 6, weights (in parentheses) are assigned to each category and sub-category. A general health score will firstly be given to each selected river (lake) section. The determination of the score is based on weighted averaging approach. The equation can be expressed as:
where the general health score of the ith river (lake) section, the weight of the kth indicator, the score of the kth indicator, the weight of the nth sub-category, and the score of the mth category.
For the entire river or lake, the final score is averaged based on the score at each section, whose weights are determined by the corresponding ratio of length (for rivers) or area (for lakes). The equation for the final score can be expressed as:
where the final score of a river (lake), the length (area) of the ith river (lake) section, and the amount of the total sections. Based on the final score, a certain river or lake can be categorized as “very healthy” (), “healthy” (), “subhealthy” (), “unhealthy” (), or “hazardous” ().
5.4. Limitation and Future Development
It should be mentioned that the main limitation of the new framework is the over-simplification of some indicators (e.g., eco-water/environmental flow) for the convenience of implementing the RCS by non-experts. Furthermore, those more sophisticated indicators (e.g., ecological processes and ecosystem resilience) excluded from the framework should not be ignored by researchers, as they can better reflect the freshwater health as a dynamic status with multiple interrelated constituents. Adopting a simplified framework does not imply that the scientific principles are compromised; on the contrary, ongoing research should be carried out to monitor the efficacy of the framework and make adjustments accordingly.
Although the RCS has been proved as an effective system to manage freshwater resources and improve the health status, challenges still exist due to the fast urbanization in China and the increasing pollutant emission and water consumption, which may significantly influence people’s lives. The future development of the RCS should be based on the essential goal that freshwater health status meets people’s expectation for an enjoyable living environment, which is obviously more fundamental than any “index” or “grade” that describe the condition of water bodies in an unintuitive way. Some pilot works [73] have been done to explore a method to quantify the sensory aspect of rivers and lakes. In 2019, the Ministry of Water Resources in China had also set the objective of the RCS as “unblocked rivers, clear waters, green banks, beautiful scenery, people in harmony”. Priority will be given to a few cities, regions, and catchments of significance to build healthy freshwater ecosystems that meet ecological, sensory, and safety demands under the framework of the RCS; those examples can further be the role models for the rest of China.
6. Summary and Conclusions
In this paper, we analyze the administrative and scientific aspects of evaluating freshwater health in China under the framework of the River Chief System (RCS) and compare those features with the best practices around the world. The most significant distinctions between the principles in China and those overseas are discussed particularly. A new indicator framework is proposed together with a well-structured protocol for implementation. The research findings in the present study will be integrated into China’s new national freshwater evaluation standard to be issued this year.
Regarding the administrative aspect, the unique institutional context in China (centralized authority, party-state hierarchy, and cadre responsibility system) make it is essential to adopt the top-down mechanism of accountability to avoid the inaction of local officials in different levels. Thus, the performance of the RCS should be graded in a concise and quantitative way to simplify the workload of local Chiefs who are usually non-experts. Regarding the scientific aspect, social services and water governance indicators should be appropriately integrated into the new framework, as those indicators emphasize some attributes that are particularly valued in China and also sometimes ignored in western counties. Those attributes, for example, include the effectiveness of water resources management by using a centralized model and the harmony between individuals, the society and the environment.
From this study, we argue that a series of issues should be paid attention to when establishing a widely implemented freshwater health evaluation framework, including well-defined objectives and motivations, comprehensive and practical indicators metrics, standardized data acquisition and analysis protocols, and the adaptability for future development. Regarding the last issue, the new framework proposed in this study is expected to be revised for every two years to ensure its appropriateness.
Author Contributions
Conceptualization, C.X., Y.Y., and Y.L. (Yun Li); formal analysis, C.X. and Y.Y.; funding acquisition, Y.L. (Yun Li); methodology, C.X. and Y.Y.; project administration, C.X. and Y.L. (Yun Li); resources, Y.L. (Yang Liu), G.L., and Z.F.; writing—original draft, C.X. and Y.Y.; writing—review and editing, Y.Y., Y.L. (Yang Liu), G.L., and Z.F.. All authors have read and agreed to the published version of the manuscript.
Funding
This research was funded by National Key R&D Program of China (2018YFC0407205); Shanghai Chengtou Science and Technology Innovation Program (CTKY-ZDXM-2020-003) and the Special Research Fund of the Nanjing Hydraulic Research Institute (Y119016).
Acknowledgments
The authors would like to thank the research group from The University of Auckland, including Bruce Melville, Asaad Shamseldin, Naresh Singhal, and Graham Macky, for their contributions to the completion of this project.
Conflicts of Interest
The authors declare no conflict of interest. The funders had no role in the design of the study; in the collection, analyses, or interpretation of data; in the writing of the manuscript, or in the decision to publish the results.
References
- UN-Water. Integrated Monitoring Guide for Sustainable Development Goal 6 on Water and Sanitation Targets and Global Indicators. Geneva, Switzerland, 2017. Available online: http://www.unwater.org/publications/sdg-6-targetsindicators/ (accessed on 30 August 2020).
- Adler, R.W.; Landman, J.C.; Cameron, D.M. The Clean Water Act 20 YEARS Later; Island Press: Washington, DC, USA, 1993. [Google Scholar]
- Moss, B. The Water Framework Directive: Total environment or political compromise? Sci. Total Environ. 2008, 400, 32–41. [Google Scholar] [CrossRef] [PubMed]
- Hering, D.; Borja, A.; Carstensen, J.; Carvalho, L.; Elliott, M.; Feld, C.K.; Heiskanen, A.-S.; Johnson, R.K.; Moe, J.; Pont, D.; et al. The European Water Framework Directive at the age of 10: A critical review of the achievements with recommendations for the future. Sci. Total Environ. 2010, 408, 4007–4019. [Google Scholar] [CrossRef] [PubMed] [Green Version]
- Joint Nature Conservation Committee. Common Standards Monitoring Guidance for Rivers; Joint Nature Conservation Committee: Peterborough, UK, 2015.
- Joint Nature Conservation Committee. Common Standards Monitoring Guidance for Lakes; Joint Nature Conservation Committee: Peterborough, UK, 2016.
- Scotland’s environment. Ecosystem Health Indicators. 2020. Available online: https://www.environment.gov.scot/our-environment/state-of-the-environment/ecosystem-health-indicators (accessed on 14 August 2020).
- Department of the Environment and Energy. Aquatic Ecosystems Toolkit. Module 5: Integrated Ecosystem Condition Assessment; Department of the Environment and Energy: Canberra, Australia, 2017.
- Clapcott, J.; Young, R.; Sinner, J.; Wilcox, M.; Storey, R.; Quinn, J.; Daughney, C.; Canning, A. Freshwater Biophysical Ecosystem Health Framework; Technical Report prepared for Ministry for the Environment of New Zealand No. 3194; Cawthron Institute: Nelson, New Zealand, 2018; p. 89. [Google Scholar]
- Rapport, D.J.; Costanza, R.; McMichael, A.J. Assessing ecosystem health. Trends Ecol. Evol. 1998, 13, 397–402. [Google Scholar] [CrossRef]
- Norris, R.H.; Thoms, M.C. What is river health? Freshw. Biol. 1999, 41, 197–209. [Google Scholar] [CrossRef] [Green Version]
- Lackey, R.T. Values, policy, and ecosystem health. Bioscience 2001, 51, 437–443. [Google Scholar] [CrossRef] [Green Version]
- Vugteveen, P.; Leuven, R.S.E.W.; Huijbregts, M.A.J.; Lenders, H.J.R. Redefinition and elaboration of river ecosystem health: Perspective for river management. Hydrobiologia 2006, 565, 289–308. [Google Scholar] [CrossRef]
- Elosegi, A.; Gessner, M.O.; Young, R.G. River doctors: Learning from medicine to improve ecosystem management. Sci. Total Environ. 2017, 595, 294–302. [Google Scholar] [CrossRef]
- Meyer, J.L. Stream health: Incorporating the human dimension to advance stream ecology. J. N. Am. Benthol. Soc. 1997, 16, 439–447. [Google Scholar] [CrossRef] [Green Version]
- Boulton, A.J. An overview of river health assessment: Philosophies, practice, problems and prognosis. Freshw. Biol. 1999, 41, 469–479. [Google Scholar] [CrossRef] [Green Version]
- Schallenberg, M.; Kelly, D.; Clapcott, J.; Death, R.; MacNeil, C.; Young, R.G.; Sorrell, B.; Scarsbrook, M. Approaches to assessing ecological integrity of New Zealand freshwaters. Sci. Conserv. 2011, 307, 84. [Google Scholar]
- Hanna, D.E.L.; Tomscha, S.A.; Dallaire, C.O.; Bennett, E.M. A review of riverine ecosystem service quantification: Research gaps and recommendations. J. Appl. Ecol. 2018, 55, 1299–1311. [Google Scholar] [CrossRef]
- Ediger, L.; Hwang, L. Water quality and environmental health in southern China. In Proceedings of the BSR Forum, Guangzhou, China, 15 May 2009; Volume 15, p. 2009. [Google Scholar]
- Liu, D.; Richards, K. The He-Zhang (River chief/keeper) system: An innovation in China’s water governance and management. Int. J. River Basin Manag. 2019, 17, 263–270. [Google Scholar] [CrossRef]
- Dai, L. A new perspective on water governance in China: Captain of the River. Water Int. 2015, 40, 87–99. [Google Scholar] [CrossRef]
- Huang, Q.; Xu, J. Rethinking environmental bureaucracies in River Chiefs System (RCS) in China: A critical literature study. Sustainability 2019, 11, 1608. [Google Scholar] [CrossRef] [Green Version]
- Wang, L.; Tong, J.; Li, Y. River Chief System (RCS): An experiment on cross-sectoral coordination of watershed governance. Front. Environ. Sci. Eng. 2019, 13, 64. [Google Scholar] [CrossRef]
- Liu, H.; Chen, Y.D.; Liu, T.; Lin, L. The river chief system and river pollution control in China: A case study of Foshan. Water 2019, 11, 1606. [Google Scholar] [CrossRef] [Green Version]
- Wang, Y.; Chen, X. River chief system as a collaborative water governance approach in China. Int. J. Water Resour. Dev. 2020, 36, 610–630. [Google Scholar] [CrossRef]
- Zhu, X. Mandate versus championship: Vertical government intervention and diffusion of innovation in public services in authoritarian China. Public Manag. Rev. 2014, 16, 117–139. [Google Scholar] [CrossRef]
- Cartier, C. Territorial urbanization and the party-state in China. Territ. Politics Gov. 2015, 3, 294–320. [Google Scholar] [CrossRef]
- Edin, M. Remaking the communist party-state: The cadre responsibility system at the local level in China. China Int. J. 2003, 1, 1–15. [Google Scholar] [CrossRef]
- Burns, J.P. Local cadre accommodation to the “responsibility system” in rural China. Pac. Aff. 1985, 58, 607–625. [Google Scholar] [CrossRef]
- The State Council of China. Opinions on Comprehensively Promoting the River Chief System. 2014. Available online: http://www.gov.cn/gongbao/content/2014/content_2707859.htm (accessed on 30 August 2020). (In Chinese)
- The State Council of China. Opinions on Strengthening the Management of Rivers and Lakes. 2017. Available online: http://www.gov.cn/gongbao/content/2017/content_5156731.htm (accessed on 30 August 2020). (In Chinese)
- The State Council of China. Opinions on Promoting the Implementation of the River Chief System: From Nominal to Actual. 2017. Available online: http://www.gov.cn/gongbao/content/2019/content_5363080.htm (accessed on 30 August 2020). (In Chinese)
- Development Research Center. Technical outline for comprehensive implementation of the assessment of the River (Lake) chief system. In Report Completed in Collaboration with Hohai University and North China University of Water Resources and Electric Power; Ministry of Water Resources: Beijing, China, 2019. (In Chinese) [Google Scholar]
- Local Standard of Beijing City. DB/11T 1722/2020: Technical Regulations for Ecological Health on Aquatic Ecosystem Assessment; Beijing Municipal Bureau of Market Supervision and Administration: Beijing, China, 2020. (In Chinese)
- Local Standard of Liaoning Province. DB21/T 2724/2017: Liaoning Provincial Evaluation Guidelines for River and Lake (Reservoir) Health; Liaoning Provincial Bureau of Quality and Technical Supervision: Shenyang, China, 2017. [Google Scholar]
- Local Standard of Jiangsu Province. DB32/T 3674-2019: Specification for Ecological River and Lake Status Assessment; Jiangsu Provincial Bureau of Market Supervision and Administration: Nanjing, China, 2019. (In Chinese)
- Local Standard of Suzhou City. Indicator System of River and Lake Health Assessment; Suzhou Municipal Bureau of Market Supervision and Administration: Suzhou, China, ubpublished. (In Chinese)
- Local Standard of Shandong Province. DB37/D 3018-2017: Shandong Provincial Evaluation Standard for Ecological River; Shandong Provincial Bureau of Quality and Technical Supervision: Jinan, China, 2017. (In Chinese) [Google Scholar]
- Zhejiang Institute of Hydraulics and Estuary. Evaluation of Main Rivers and Lakes in Zhejiang Province; Zhejiang Institute of Hydraulics and Estuary: Hangzhou, China, September 2018. (In Chinese) [Google Scholar]
- Fujian Normal University. Indicators and Methods for Assessing River Health in Fujian Province; Fujian Normal University: Fuzhou, China, 2019. (In Chinese) [Google Scholar]
- Guizhou Normal University. Guideline for Assessing River (Lake) Health in Guiyang City; Guizhou Normal University: Guiyang, China, February 2019. (In Chinese) [Google Scholar]
- Standard of China Association for Engineering Construction Standardization. Technical Guidelines for Evaluating Water Quality of Urban Rivers and Lakes; Tsinghua University: Beijing, China, ubpublished. (In Chinese)
- Standard of Water Conservancy Industry of China. Guideline for River and Lake Health Assessment (Draft); Ministry of Water Resources: Beijing, China, unpublished. (In Chinese)
- Peng, W. Research on river and lake health assessment indicators, standards and methods. J. China Inst. Water Resour. Hydropower Res. 2018, 16, 394–416. (In Chinese) [Google Scholar]
- Ministry of Water Resources. Indicators, Standard and Method for Assessing River and LAKE Health (for Pilot Work) (Version 1.0); National Technical Document for Evaluating River and Lake Health; Ministry of Water Resources: Beijing, China, October 2010. (In Chinese)
- National Standard of China. GB3838-2002: Environmental Quality Standards for Surface Water; State Environmental Protection Administration: Beijing, China, 2002. (In Chinese) [Google Scholar]
- Standard of Water Conservancy Industry of China. SL395-2007: Technical Regulations for Surface Water Resources Quality Assessment; Ministry of Water Resources: Beijing, China, 2007. (In Chinese) [Google Scholar]
- National Standard of China. GB15168-2018: Soil Environmental Quality Risk Control Standard for Soil Contamination of Agricultural Land; Ministry of Ecology and Environment: Beijing, China, 2018. (in Chinese) [Google Scholar]
- USEPA. National Lakes Assessment 2018/19: Field Operations Manual; Office of Water and Office of Environmental Information: Washington, DC, USA, 2017.
- USEPA. National Rivers and Streams Assessment 2018/19: Field Operations Manual Non-Wadable; Office of Water and Office of Environmental Information: Washington, DC, USA, 2019.
- USEPA. National Rivers and Streams Assessment 2018/19: Field Operations Manual Wadable; Office of Water and Office of Environmental Information: Washington, DC, USA, 2019.
- Environment Canada. Canadian Aquatic Biomonitoring Network Laboratory Methods: Processing, Taxonomy, and Quality Control of Benthic Macroinvertebrate Samples; Environment Canada: Ottawa, ON, Canada, 2012. [Google Scholar]
- Environment Canada. Canadian Aquatic Biomonitoring Network Field Manual: Wadeable Streams; Environment Canada: Ottawa, ON, Canada, 2012. [Google Scholar]
- Davies, P.E.; Harris, J.H.; Hillman, T.J.; Walker, K.F. The Sustainable Rivers Audit: Assessing river ecosystem health in the Murray-Darling Basin, Australia. Mar. Freshw. Res. 2010, 61, 764–777. [Google Scholar] [CrossRef]
- Hudson, N.; Ballantine, D.; Storey, R.; Schmidt, J.; Davies-Colley, R. National Environmental Monitoring and Reporting (NEMaR): Indicators for National Freshwater Reporting; NIWA Client Report HAM2012-025; Ministry for the Environment: Wellington, New Zealand, 2012. [Google Scholar]
- Ministry for the Environment. National Policy Statement for Freshwater Management 2014 (Amended 2017); Ministry for the Environment: Wellington, New Zealand, 2017.
- Young, R.G.; Matthaei, C.D.; Townsend, C.R. Organic matter breakdown and ecosystem metabolism: Functional indicators for assessing river ecosystem health. J. North Am. Benthol. Soc. 2008, 27, 605–625. [Google Scholar] [CrossRef]
- Clapcott, J.E.; Collier, K.J.; Death, R.G.; Goodwin, E.O.; Harding, J.S.; Kelly, D.; Leathwick, J.R.; Young, R.G. Quantifying relationships between land-use gradients and structural and functional indicators of stream ecological integrity. Freshw. Biol. 2012, 57, 74–90. [Google Scholar] [CrossRef]
- Millennium Ecosystem Assessment. Ecosystems and Human Well-Being: Synthesis; Island Press: Washington, DC, USA, 2005. [Google Scholar]
- National Standard of China. GB 50594-2010: Standard for Water Function Zoning; Ministry of Housing and Urban-Rural Development: Beijing, China, November 2010. (In Chinese) [Google Scholar]
- Holling, C.S. Engineering resilience versus ecological resilience. In Engineering within Ecological Constraints; Schulze, P., Ed.; National Academy Press: Washington, DC, USA, 1996; pp. 31–44. [Google Scholar]
- Parsons, M.; Thoms, M.; Capon, T.; Capon, S.; Reid, M. Resilience and Thresholds in River Ecosystems; Waterlines Report; National Water Commission: Canberra, Australia, 2009. [Google Scholar]
- Tharme, R.E. A global perspective on environmental flow assessment: Emerging trends in the development and application of environmental flow methodologies for rivers. River Res. Appl. 2003, 19, 397–441. [Google Scholar]
- Kuriqi, A.; Pinheiro, A.N.; Sordo-Ward, A.; Garrote, L. Flow regime aspects in determining environmental flows and maximizing energy production at run-of-river hydropower plants. Appl. Energy 2019, 256, 113980. [Google Scholar]
- Kuriqi, A.; Pinheiro, A.N.; Sordo-Ward, A.; Garrote, L. Water-energy-ecosystem nexus: Balancing competing interests at a run-of-river hydropower plant coupling a hydrologic–ecohydraulic approach. Energy Convers. Manag. 2020, 223, 113267. [Google Scholar] [CrossRef]
- Acreman, M.C.; Ferguson, A.J.D. Environmental flows and the European water framework directive. Freshw. Biol. 2010, 55, 32–48. [Google Scholar]
- Poff, N.L.; Zimmerman, J.K. Ecological responses to altered flow regimes: A literature review to inform the science and management of environmental flows. Freshw. Biol. 2010, 55, 194–205. [Google Scholar]
- King, J.; Brown, C. Environmental flows: Striking the balance between development and resource protection. Ecol. Soc. 2006, 11, 1–26. [Google Scholar]
- Hirji, R.; Davis, R. Environmental Flows in Water Resources Policies, Plans, and Projects: Findings and Recommendations; The World Bank: Washington, DC, USA, 2009. [Google Scholar]
- Pahl-Wostl, C.; Arthington, A.; Bogardi, J.; Bunn, S.E.; Hoff, H.; Lebel, L.; Nikitina, E.; Palmer, M.; Poff, L.N.; Richards, K.; et al. Environmental flows and water governance: Managing sustainable water uses. Curr. Opin. Environ. Sustain. 2013, 5, 341–351. [Google Scholar] [CrossRef]
- Standard of Water Conservancy Industry of China. SL/Z 712/2014: Specification for Calculation of Environmental Flow in Rivers and Lakes; Ministry of Water Resources: Beijing, China, 2014. (In Chinese) [Google Scholar]
- Antunes, B.; Carvalho, L.; Geamana, N.; Giuca, R.; Grizzetti, B.; Leone, M.; Liquete, C.; McConnell, S.; Preda, E.; Santos, R.; et al. Ecosystem services for water policy: Insights across Europe. Environ. Sci. Policy 2016, 66, 179–190. [Google Scholar]
- Zhu, Q.; Pan, Y.; Xia, J.; Jia, H.; Xi, J. Sensory Evaluation and Analysis of River Water Quality in Suzhou City. Unpublished manuscript. (In Chinese).
- Karr, J.R. Rivers as sentinels: Using the biology of rivers to guide landscape management. In The Ecology and Management of Streams and Rivers in the Pacific Northwest Coastal Ecoregion; Naiman, P.P., Bilby, R.E., Eds.; Springer: New York, NY, USA, 1996. [Google Scholar]
- Karr, J.R.; Chu, E.W. Restoring Life in Running Waters: Better Biological Monitoring; Island Press: Washington, DC, USA, 1998. [Google Scholar]
Figure 1.
The new evaluation protocol proposed for nation-wide implementation in China.


Table 1.
The approach to assessing the implementation of the River Chief System (RCS) with detailed scoring criteria.
Table 1.
The approach to assessing the implementation of the River Chief System (RCS) with detailed scoring criteria.
| No. | Tier-1 Categories | Tier-2 Categories | Scoring Criteria |
|---|---|---|---|
| I | Building RCS hierarchy and organizations (25 points) |
|
|
|
| ||
|
| ||
|
| ||
| II | Building RCS regulations and mechanism (15 points) |
|
|
|
| ||
|
| ||
| III | Duties performed by River Chiefs (12 points) |
|
|
|
| ||
| IV | Organizational works (16 points) |
|
|
|
| ||
|
| ||
| V | The outcome of water protection and management (32 points) |
|
|
|
| ||
|
| ||
|
| ||
|
|
Table 2.
The national, regional, and industrial standards, guidelines, and specifications used for summarizing the existing freshwater health indicators.
Table 2.
The national, regional, and industrial standards, guidelines, and specifications used for summarizing the existing freshwater health indicators.
| Source | Abbr. |
|---|---|
| Local Standard of Beijing City: DB/11T 1722/2020 Technical regulations for ecological health on aquatic ecosystem assessment [34] | DB11 |
| Local Standard of Liaoning Province: DB21/T 2724/2017 Liaoning provincial evaluation guidelines for river and lake (reservoir) health [35] | DB21 |
| Local Standard of Jiangsu Province: DB32/T 3674-2019 Specification for ecological river and lake status assessment [36] | DB32 |
| Local Standard of Suzhou City: DB3205T 2019 Indicator system of river and lake health assessment (Unpublished draft) [37] | DB3205 |
| Local Standard of Shandong Province: DB37/D 3018-2017 Shandong provincial evaluation standard for ecological river [38] | DB37 |
| Report of Zhejiang Institute of Hydraulics and Estuary Evaluation of main rivers and lakes in Zhejiang Province [39] | ZJ |
| Report of Fujian Normal University: Indicators and methods for assessing river health in Fujian Province [40] | FJ |
| Report of Guizhou Normal University: Guideline for assessing river (lake) health in Guiyang City [41] | GY |
| Standard of China Association for Engineering Construction Standardization: Technical Guidelines for Evaluating Water Quality of Urban Rivers and Lakes (draft) [42] | CECS |
| Draft of Ministry of Water Resources (for consultation purpose): Guideline for river and lake health assessment [43,44] | SL |
| Report of Ministry of Water Resources: Indicators, standard and method for assessing river and lake health (for pilot work) [45] | 2010 |
| “Happy River” indicators of Ministry of Water Resources (internal documents) | XFH |
| The United States Environmental Protection Agency: National Aquatic Resource Surveys [49,50,51] | USA |
| Cawthron Institute report prepared for Ministry for the Environment, New Zealand: Freshwater Biophysical Ecosystem Health Framework [9] | NZ |
| Australian Department of the Environment and Energy: Aquatic Ecosystems Toolkit. Module 5: Integrated Ecosystem Condition Assessment [8] | AU |
| The United Kingdom Joint Nature Conservation Committee (JNCC): Common Standards Monitoring Guidance for Rivers/Lakes [5,6] | UK |
Table 3.
Indicator categories of a freshwater evaluation framework and definitions.
| Category | Criteria for Being “Healthy” | |
|---|---|---|
| Ecological integrity | Physical habitat | The physical form and extent of the water body and the surrounding riparian areas are capable of supporting diverse flora and fauna throughout their life cycle. |
| Water quality | The physical and chemical properties as well as other components of the water body are in natural status and may support diverse flora and fauna. For example, contaminants are scarce or absent. | |
| Water quantity | The water level, extent and flow regime are sufficient to support diverse flora and fauna during their full life cycle. As defined by Clapcott et al. [9], ‘flow regime’ includes the floods and droughts that ensure the surface water connectivity between the fresh waters and surrounding terrestrial habitat and other freshwaters (e.g., rivers and their floodplains, and wetlands), the regulation of biotic production and diversity, and that shape the morphology of physical habitat. | |
| Aquatic life | A diverse range of native species of flora and fauna persist; invasive alien species are scarce or absent; rare native species can be seen. | |
| Ecological processes | The normal interactions among aquatic lives and their environment persist (e.g., metabolism) with an optimized level of organic matter cycling, e.g., the retention, transformation and uptake of carbon and other nutrients. | |
| Social services / values | A healthy water body can provide a wide range of non-ecological functions and benefits to human beings and the society, including cultural services (e.g., recreation and aesthetic beauty), provisioning services (e.g., water supply and aquaculture), regulating services (e.g., flood protection), etc. | |
| Water governance | A healthy water body entails a set of managerial protocols that can effectively facilitate the implementation of specific water protection activities and more efficient water governance in different administrative levels. | |
Table 4.
Comparison of indicators of different frameworks, guidelines, and regional specifications. The dots show in which framework the inidicators are adopted.
Table 4.
Comparison of indicators of different frameworks, guidelines, and regional specifications. The dots show in which framework the inidicators are adopted.
| Category | Sub-Category | Indicator | DB11 | DB21 | DB32 | DB3205 | DB37 | ZJ | FJ | GY | CECS | SL | 2010 | XFH | NZ | AU | UK | USA | Total |
|---|---|---|---|---|---|---|---|---|---|---|---|---|---|---|---|---|---|---|---|
| Physical habitat | Shape | Bank/channel form & stability | ⚫ | ⚫ | ⚫ | ⚫ | ⚫ | ⚫ | ⚫ | ⚫ | ⚫ | 9 | |||||||
| Substrate | Substrate stability | ⚫ | 1 | ||||||||||||||||
| Substrate composition | ⚫ | ⚫ | ⚫ | ⚫ | 4 | ||||||||||||||
| Substrate contamination | ⚫ | ⚫ | ⚫ | ⚫ | 4 | ||||||||||||||
| Connectivity | Water mobility & connectivity | ⚫ | ⚫ | ⚫ | ⚫ | ⚫ | ⚫ | ⚫ | ⚫ | ⚫ | ⚫ | ⚫ | 11 | ||||||
| Instream structures | ⚫ | ⚫ | 2 | ||||||||||||||||
| Riparian | Riparian naturalness | ⚫ | ⚫ | ⚫ | ⚫ | ⚫ | ⚫ | ⚫ | ⚫ | ⚫ | ⚫ | ⚫ | 11 | ||||||
| Riparian vegetation coverage | ⚫ | ⚫ | ⚫ | ⚫ | ⚫ | ⚫ | ⚫ | ⚫ | ⚫ | ⚫ | ⚫ | ⚫ | ⚫ | ⚫ | ⚫ | 15 | |||
| Other | Naturalness of water area & form | ⚫ | ⚫ | ⚫ | ⚫ | 4 | |||||||||||||
| Erosion & sedimentation | ⚫ | ⚫ | ⚫ | ⚫ | ⚫ | ⚫ | 6 | ||||||||||||
| Debris | ⚫ | ⚫ | 2 | ||||||||||||||||
| Wetland status | ⚫ | ⚫ | ⚫ | 3 | |||||||||||||||
| Habitat extent & structure | ⚫ | ⚫ | 2 | ||||||||||||||||
| Water quality | Physical | Temperature | ⚫ | ⚫ | ⚫ | 3 | |||||||||||||
| Dissolved oxygen | ⚫ | ⚫ | ⚫ | ⚫ | ⚫ | ⚫ | ⚫ | ⚫ | ⚫ | ? | ⚫ | ⚫ | ⚫ | ⚫ | 13 | ||||
| Conductivity | ⚫ | 1 | |||||||||||||||||
| Clarity/turbidity | ⚫ | ⚫ | ⚫ | ? | ⚫ | ⚫ | ⚫ | 6 | |||||||||||
| Sediment load | ⚫ | ⚫ | ⚫ | 3 | |||||||||||||||
| Salinity | ⚫ | ? | ⚫ | ⚫ | 3 | ||||||||||||||
| Oxidation Reduction Potential | ⚫ | 1 | |||||||||||||||||
| Chemical | pH & acidity | ⚫ | ⚫ | ⚫ | ⚫ | ⚫ | ? | ⚫ | ⚫ | ⚫ | ⚫ | 9 | |||||||
| Nitrogen | ⚫ | ⚫ | ⚫ | ⚫ | ⚫ | ⚫ | ? | ⚫ | ⚫ | ⚫ | 9 | ||||||||
| Phosphorous | ⚫ | ⚫ | ⚫ | ⚫ | ⚫ | ⚫ | ? | ⚫ | ⚫ | ⚫ | ⚫ | 10 | |||||||
| Ammonia or nitrate | ⚫ | ⚫ | ⚫ | ⚫ | ⚫ | ⚫ | ⚫ | ⚫ | ? | ⚫ | ⚫ | 10 | |||||||
| Permanganate | ⚫ | ⚫ | ⚫ | ⚫ | ⚫ | ⚫ | ⚫ | ? | 7 | ||||||||||
| Oxygen needs (COD, BOD5, etc) | ⚫ | ⚫ | ⚫ | ⚫ | ⚫ | ⚫ | ⚫ | ⚫ | 8 | ||||||||||
| Other organic composites | ⚫ | ⚫ | 2 | ||||||||||||||||
| Nutrient loads | ⚫ | ⚫ | ⚫ | ? | ⚫ | ⚫ | 5 | ||||||||||||
| Trophic diatom | ⚫ | ⚫ | 2 | ||||||||||||||||
| Heavy metals | ⚫ | ⚫ | ⚫ | ⚫ | ⚫ | ⚫ | ⚫ | ? | ⚫ | ⚫ | ⚫ | 10 | |||||||
| Chlorophyll a | ⚫ | ⚫ | ? | ⚫ | ⚫ | 4 | |||||||||||||
| Sulfide | ⚫ | ⚫ | ⚫ | ⚫ | ? | 4 | |||||||||||||
| Other (cyanide, fluoride, etc) | ⚫ | ⚫ | ⚫ | ⚫ | ⚫ | 5 | |||||||||||||
| Pathogen | E. coli | ⚫ | ⚫ | ⚫ | ⚫ | ? | 4 | ||||||||||||
| Enterococci | ⚫ | 1 | |||||||||||||||||
| Water quantity | Magnitude | Water depth & area | ⚫ | ⚫ | ⚫ | ⚫ | 4 | ||||||||||||
| Water volume | ⚫ | 1 | |||||||||||||||||
| Discharge & velocity | ⚫ | ⚫ | ⚫ | 3 | |||||||||||||||
| Flow | Eco-water (environmental flow) | ⚫ | ⚫ | ⚫ | ⚫ | ⚫ | ⚫ | ⚫ | ⚫ | ⚫ | ⚫ | ⚫ | ⚫ | 12 | |||||
| Mean (annual) flow | ⚫ | 1 | |||||||||||||||||
| Long-term and seasonal variability | ⚫ | ⚫ | ⚫ | ⚫ | ⚫ | ⚫ | ⚫ | ⚫ | 8 | ||||||||||
| Flood and drought | Flood occurrence | ⚫ | 1 | ||||||||||||||||
| Drought occurrence | ⚫ | 2 | |||||||||||||||||
| Aquatic life | Fish | ⚫ | ⚫ | ⚫ | ⚫ | ⚫ | ⚫ | ⚫ | ⚫ | 8 | |||||||||
| Benthonic (macro)invertebrate | ⚫ | ⚫ | ⚫ | ⚫ | ⚫ | ⚫ | ⚫ | ⚫ | ⚫ | ⚫ | ⚫ | 11 | |||||||
| Macrophytes | ⚫ | ⚫ | ⚫ | ⚫ | ⚫ | ⚫ | ⚫ | 7 | |||||||||||
| Periphyton | ⚫ | ⚫ | ⚫ | ⚫ | 4 | ||||||||||||||
| Plankton | ⚫ | ⚫ | ⚫ | ⚫ | ⚫ | ⚫ | ⚫ | 7 | |||||||||||
| Microbes | ⚫ | ⚫ | 2 | ||||||||||||||||
| Waterbirds | ⚫ | ⚫ | ⚫ | ⚫ | ⚫ | ⚫ | 6 | ||||||||||||
| Terrestrial animals | ⚫ | ⚫ | 2 | ||||||||||||||||
| Fauna diversity | ⚫ | ⚫ | 2 | ||||||||||||||||
| Invasive species | ⚫ | ⚫ | ⚫ | 3 | |||||||||||||||
| Rare species | ⚫ | ⚫ | ⚫ | 3 | |||||||||||||||
| Social service | Flood protection | ⚫ | ⚫ | ⚫ | ⚫ | ⚫ | ⚫ | ⚫ | ⚫ | ⚫ | ⚫ | 10 | |||||||
| Shipping & navigation | ⚫ | 1 | |||||||||||||||||
| Water supply & consumption | ⚫ | ⚫ | ⚫ | ⚫ | ⚫ | ⚫ | 6 | ||||||||||||
| Scenic & aesthetic | ⚫ | ⚫ | ⚫ | 3 | |||||||||||||||
| Culture & history | ⚫ | ⚫ | ⚫ | ⚫ | 4 | ||||||||||||||
| Recreation & tourism | ⚫ | ⚫ | 2 | ||||||||||||||||
| Sensory & human comfort | ⚫ | ⚫ | ⚫ | 3 | |||||||||||||||
| Public satisfaction | ⚫ | ⚫ | ⚫ | ⚫ | ⚫ | ⚫ | ⚫ | ⚫ | 8 | ||||||||||
| Agriculture & food supply | ⚫ | ⚫ | ⚫ | 3 | |||||||||||||||
| Industrial benefit | ⚫ | 1 | |||||||||||||||||
| Water governance | Zoning & zonal status | ⚫ | ⚫ | ⚫ | ⚫ | ⚫ | ⚫ | ⚫ | ⚫ | ⚫ | ⚫ | 10 | |||||||
| Professional team & plan | ⚫ | 1 | |||||||||||||||||
| Disturbance to society | ⚫ | ⚫ | ⚫ | ⚫ | ⚫ | ⚫ | ⚫ | 7 | |||||||||||
| Utilization of water resources | ⚫ | ⚫ | ⚫ | ⚫ | ⚫ | ⚫ | ⚫ | 7 | |||||||||||
| Facility, instruments & signboards | ⚫ | 1 | |||||||||||||||||
| Sewage regulation | ⚫ | ⚫ | ⚫ | 3 | |||||||||||||||
| Illegal activities | ⚫ | ⚫ | ⚫ | 3 | |||||||||||||||
| Ecological processes | Biota interaction & food web | ⚫ | 1 | ||||||||||||||||
| Ecosystem metabolism | ⚫ | ⚫ | 2 | ||||||||||||||||
| Organic matter processing | ⚫ | 1 | |||||||||||||||||
Table 5.
The definition and classification of water function zones under the framework of the RCS in China.
Table 5.
The definition and classification of water function zones under the framework of the RCS in China.
| Tier-1 Category | Tier-2 Category | Description |
|---|---|---|
| Protection zone | A protection zone is a water area of significance for the protection of water sources, drinking water, nature reserves, scenic locations, and the protection of rare and endangered species. It is prohibited to build, rebuild, expand, or engage in water-related activities that are not related to protection within the core areas of nature reserves and tier-1 water source areas. | |
| Reservation zone | A reservation zone is a water area reserved and protected for future development and water resources utilization. Activities that may have a significant impact on water quantity, water quality, and water ecology should be strictly limited and managed. | |
| Buffer zone | A buffer zone is a water area designated for the following purposes: (1) coordinating water-use relations among provinces and areas with prominent conflicts of benefit; (2) connecting inland/marine zones and protection/development zones that are designated for different purposes. In a buffer zone, all types of water-related activities should be strictly managed to prevent adverse effects on adjacent water function zones. All water-related activities that may be detrimental to the protection of water functional areas in the buffer zone at the provincial boundary shall be notified to the basin management agency in advance. | |
| Development zone | Drinking water zone | A drinking water zone is a water area delimited or reserved for providing drinking water for urban and rural areas. In the areas that have been supplying water, further protection areas should be delimited for subsided water sources to preserved the water quality and volume. It is prohibited to build, rebuild or expand any types of sewage outfalls. In the areas reserved for future water use, the discharge of pollutants should be strictly controlled, and no new discharge into the river is allowed. |
| Industrial water zone | An industrial water zone is an area designated to meet industrial water demand. Priority should be given to the specified water usage, and any type of water intake should be strictly managed. Any installation of sewage outfall should not influence the water quality required for the specified zonal functions. | |
| Agricultural water zone | An agriculture water zone is an area designated to meet the water demand for irrigation. Priority should be given to the specified water usage, and any type of water intake should be strictly managed. Any installation of sewage outfall should not influence the water quality required for the specified zonal functions. | |
| Fishery zone | A fishery zone is an area designated for protecting aquatic life (e.g., fish). The basic water demand for fishery should be maintained, and important physical environments (e.g., habitats for natural species, spawning beds, wintering beds, feeding grounds and migration passages) should be protected. Water pollution should be strictly controlled by the units and individuals engaged in aquaculture. | |
| Scenic and recreation zone | A scenic and recreation zone is the area designated to meet the needs of landscape, entertainment, and various leisure activities. Any activity shall not influence the water quality status in the area. | |
| Transitional zone | A transition zone is an area designated to connect adjacent function zones with different water quality requirements. Transition zone should be managed to guarantee the water quality in the downstream function zone. Any water-related activity that may damage the self-purification capacity of the water body should be strictly controlled. | |
| Sewage control zone | A sewage control zone is the area designated to receive intensive domestic and industrial wastewater while restraining the adverse impacts on the functions of downstream zones. |
Table 6.
The proposed new indicator framework. The weights for categories and sub-categories are shown in parentheses.
Table 6.
The proposed new indicator framework. The weights for categories and sub-categories are shown in parentheses.
| Category | Sub-Category | Indicator | Selection | More Description | Data Source |
|---|---|---|---|---|---|
| Ecosystem integrity (0.7) | Physical habitat (0.2) | Water connectivity | Optional | Instream obstructions (rivers) and incoming discharge (lakes) | Engineering record; field investigation; remote sensing |
| Riparian naturalness | Mandatory | Bank stability and vegetation coverage | Field investigation; remote sensing | ||
| Riparian widenessR | Optional | Width during the dry season | |||
| Lake shrinking ratioL | Mandatory | Compared with the area in the 1950s | |||
| Water quantity (0.15) | Eco-water satisfaction | Mandatory | Follow SL/Z 712-2014 | Hydrologic monitoring live data; on-site monitoring; the historical records | |
| Water quantity mutation | Optional | Use monthly surface discharge deviation for rivers Use monthly incoming discharge deviation for lakes | |||
| Water quality (0.15) | Water quality | Mandatory | Follow GB3838-2002 and SL395-2007 [46,47] | Local water quality reports; live data or on-site monitoring | |
| Substrate contamination | Optional | Follow GB15168-2018 [48] | |||
| EutrophicationL | Mandatory | Follow SL395-2007 [47] | |||
| Aquatic life (0.2) | Macroinvertebrate * | Optional | Use the Benthic Index of Biological Integrity (B-IBI) [74,75] | Field investigation by specialists | |
| Fish | Mandatory | Compared with the status before 1980 | Data from aquaculture departments; field investigation by specialists | ||
| Waterbirds | Optional | Population, diversity and the existence of rare birds | Data from forestry departments or environment protection agencies; field investigation by specialists | ||
| Plankton densityL | Mandatory | Compared with the status before 1980 | FIeld investigation by specialists | ||
| Macrophytes | Optional | Compared with the status of specific periods in history | Field investigation; remote sensing | ||
| Non-ecological performance (0.3) | Social services (0.2) | Flood protection | Optional | Length of the embankment and other engineering interventions | Data from water conservancy departments |
| Water supply | Optional | How often the daily averaged discharge (or water level) is higher than the threshold for abstraction | Reports of local water authorities | ||
| Land development | Optional | The ratio of developed riparian land to the reference value | Data from local planning consents | ||
| NavigationR | Optional | The ratio of navigable days in a year | Open hydrologic data or official reports | ||
| Public satisfaction | Mandatory | Public opinion about sensory/recreational aspects, the general condition of physical habitats and the surrounding environment | On-site or online questionnaires | ||
| Water governance (0.1) | Drinking water zones ** | Optional | The ratio of drinking water zones with the required water quality. | Local water quality reports; live data or on-site monitoring | |
| Illegal activities (“four chaos”) | Mandatory | Illegal mining, occupation, disposing, and construction are managed. | Reports of local administration | ||
| Sewage regulation | Mandatory | The outfalls should be registered and well managed with reasonable layouts that do not influence drinking water sources |
© 2020 by the authors. Licensee MDPI, Basel, Switzerland. This article is an open access article distributed under the terms and conditions of the Creative Commons Attribution (CC BY) license (http://creativecommons.org/licenses/by/4.0/).
Share and Cite
MDPI and ACS Style
Xie, C.; Yang, Y.; Liu, Y.; Liu, G.; Fan, Z.; Li, Y. A Nation-Wide Framework for Evaluating Freshwater Health in China: Background, Administration, and Indicators. Water 2020, 12, 2596. https://doi.org/10.3390/w12092596
AMA Style
Xie C, Yang Y, Liu Y, Liu G, Fan Z, Li Y. A Nation-Wide Framework for Evaluating Freshwater Health in China: Background, Administration, and Indicators. Water. 2020; 12(9):2596. https://doi.org/10.3390/w12092596
Chicago/Turabian StyleXie, Chen, Yifan Yang, Yang Liu, Guoqing Liu, Ziwu Fan, and Yun Li. 2020. "A Nation-Wide Framework for Evaluating Freshwater Health in China: Background, Administration, and Indicators" Water 12, no. 9: 2596. https://doi.org/10.3390/w12092596
Note that from the first issue of 2016, this journal uses article numbers instead of page numbers. See further details here.