Shallow Water Bathymetry Based on Inherent Optical Properties Using High Spatial Resolution Multispectral Imagery


1
College of Geographical Science, Inner Mongolia Normal University, Hohhot 010010, China
2
Lab of Marine Physics and Remote Sensing, First Institute of Oceanography, Ministry of Natural Resources, Qingdao 266061, China
*
Author to whom correspondence should be addressed.
Remote Sens. 2020, 12(18), 3027; https://doi.org/10.3390/rs12183027
Submission received: 27 July 2020
/
Revised: 9 September 2020
/
Accepted: 15 September 2020
/
Published: 17 September 2020
(This article belongs to the Special Issue Satellite Mapping and Monitoring of the Coastal Zone)
Abstract
:Bathymetric surveys are of great importance for submarine topography mapping and coastal construction projects. They are also of great significance for terrain surveys of islands and coastal zones, maritime navigation and marine management planning. Traditional ship-borne water depth measurement methods are costly and time-consuming, therefore, in recent years, passive optical remote sensing technology has become an important means for shallow water depth measurements. In addition, multispectral water depth optical remote sensing has wide application values. Considering the relationship between water depth and the inherent optical characteristics of water column, an inherent optical parameters linear model (IOPLM) is developed to estimate shallow water bathymetry from high spatial resolution multispectral images. Experiments were carried out in the shallow waters (≤20 m) around Dongdao Island in China’s Paracel Islands and Saipan Island in the Northern Mariana Islands. Different accuracy evaluation indexes were used to verify the model. The comparisons with the traditional log-linear model and the Stumpf model show that in terms of overall accuracy and accuracy in different water depths, the IOPLM has slightly better results and stronger retrieval capabilities than the other models. The mean absolute error (MAE) of Dongdao Island and Saipan Island reached 1.17 m and 1.92 m, and the root mean square error (RMSE) was 1.49 m and 2.4 m, respectively.
1. Introduction
Water depth is a key variable for exploring the marine environment and an important part of hydrographic surveys and nautical chart production. It is of great importance for coastal research and marine engineering construction and provides important information for maritime transportation and navigation. The awareness of the shallow water depth is also conducive to the management and monitoring of coral reefs and the protection of ecosystems [1]. Although the traditional ship-borne bathymetric survey method is highly accurate, it still has some shortcomings. For example, it is not applicable to complex areas that cannot be accessed by ships and the measurement process is time-consuming and labor-intensive [2].
Airborne lidar sounding is an active remote sensing sounding technology [3,4,5], it can be used to measure the water depth of areas that ships cannot reach, such as the regions around islands and reefs. However, its wide use is difficult because of its high costs and small measurement ranges. Passive optical remote sensing water depth bathymetry has gradually become an important method for obtaining water depth information due to its wide coverage, fast update time and low cost.
Passive optical remote sensing technology includes multispectral remote sensing and hyperspectral remote sensing. Based on the radiative transfer theory of water column, the water depth is related to the inherent optical properties of the water column (such as the diffusion attenuation, absorption and backscattering coefficient), and a large number of passive optical retrieval models for water depth have been developed [6,7,8]. According to the degree of parameterization, the models can basically be divided into two types: theoretical analytical models and semi-theoretical semi-empirical models [9]. The theoretical analytical models require many water optical parameters and complex calculations during the construction process [10]. The semi-theoretical and semi-empirical models are a combination of theoretical models and empirical algorithms [11]. Lyzenga [12] proposed a general logarithmic linear model. On this basis, Paredes [13] developed a dual band log-linear model, which can also be extended to multiple bands. Because the model integrates more information from spectral bands, it has a higher accuracy than the single-band model. Stumpf [14] proposed a logarithmic transformation ratio model based on the linear model, which is more stable and robust than the linear model.
With the rise of machine learning methods, neural networks models have gradually been applied to water depth bathymetry [15,16,17]. Although previous studies have shown the accuracy of these types of models, the structure of the models is not fixed, their accuracy is greatly affected by the training sample used and the parameter adjustments take a long time. In addition, they are not suitable for areas lacking a large amount of actual measured water depths.
For situations where there is no actual measured water depth, in recent years, some scholars have developed new methods to directly obtain water depths based on the band information contained in multispectral or hyperspectral images [18,19,20]. However, the calculation process of these methods is relatively cumbersome, and they are not necessarily applicable to different water quality conditions in different regions, and their accuracy cannot be guaranteed.
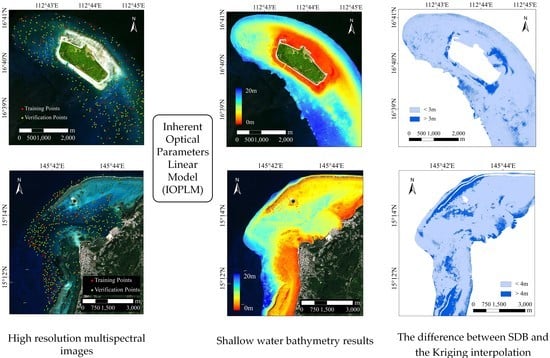
According to the relationship between water depth and the inherent optical characteristics of water column, in this study, an inherent optical parameter linear water depth retrieval model is proposed. The model uses the blue and green bands of the WorldView-2 multispectral images to obtain a wide range of water depth information. The blue and green bands of the multispectral image are more closely related to the depth of the water column and provide more information [21]. In the absence of field information and a large number of actually measured water depths, an accurate water depth can still be obtained. At the same time, it is compared with the results of the classic log-linear model and the Stumpf ratio model, and the effectiveness of the model is verified through the accuracy comparison results for several different metrics.
2. Materials and Methods
2.1. The Study Areas and Data Sets
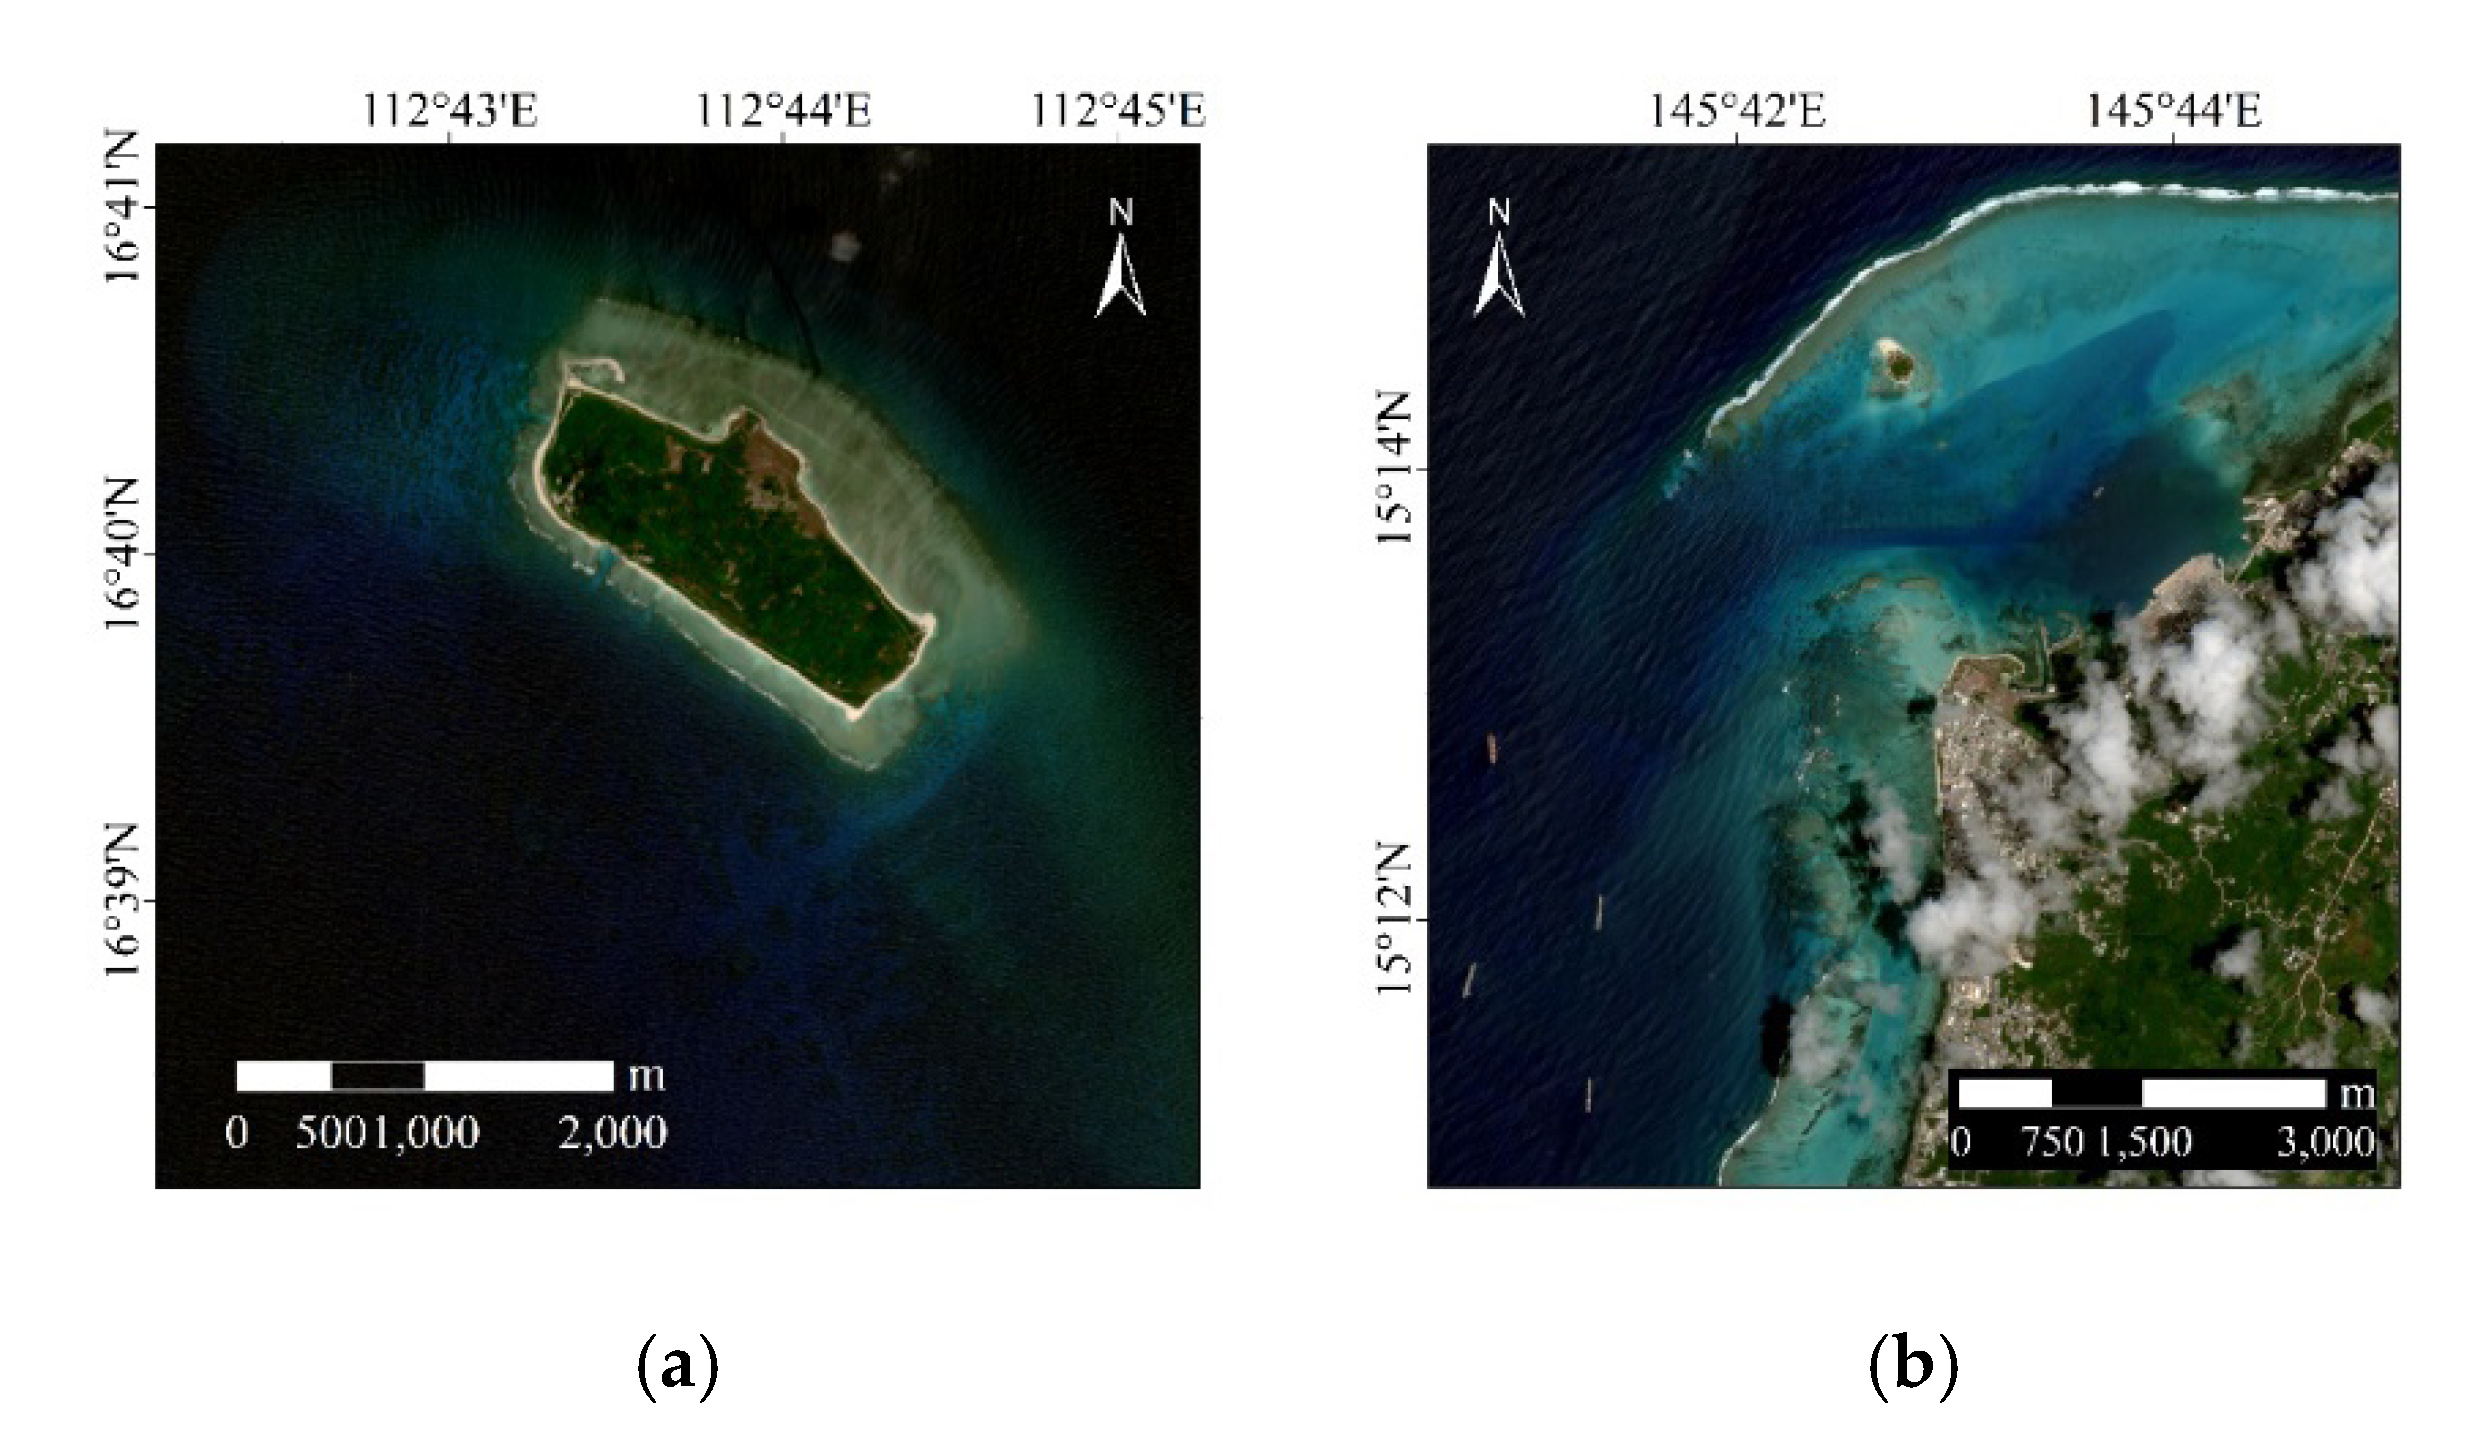
Dongdao Island, located in the South China Sea, and Saipan Island, the federal capital of the Northern Mariana Islands, are chosen as demonstrative cases for shallow water depth retrieval. Dongdao Island is located in the east of the Paracel Islands in the South China Sea. It is the second largest island in the Paracel Islands. The region extends between 16°39′ N and 16°41′ N, and 112°43′ E and 112°45′ E. Dongdao island is nearly rectangular in shape, it covers an area of 1.7 km2 with a rough length of 2.4 km and a width of 1 km. The average altitude on the island is 4–5 m. It is composed of rising reefs and coral shell sand bodies, surrounded by sandbanks. The reef of Dongdao is a long arc-shaped huge reef, protruding to the northeast. In the southwestern part of the atoll, the coral reef has not yet reached the surface of the water but becomes a dark reef beach which is deeply underwater.
Saipan is the largest island of the Northern Mariana Islands, located between 15°5′ N and 15°18′ N, 145°40′ E and 145°50′ E. It is close to Asia, on the edge of the Pacific Ocean. The area of the island is approximately 185 km2, and about 23 km long and 8 km wide. Saipan Island is composed of rising coral reefs, with the surrounding terrain changing abruptly, and the mountains extend from north to south. The seawater surrounding the island has good water quality and the water column has high transparency. On the west coast of the island are sandy beaches, the coral reefs are distributed in the open sea, and there are lagoons along the west coast. There is also a small island called Managaha in the open sea on the west side of Saipan, with a circumference of only 1.5 km. It is surrounded by white sand beaches, which were formed by the erosion and the grinding of the corals, and there are also sparsely coral reefs distributed around the island.
The satellite data of two study areas are both the WorldView-2 (WV-2) multispectral satellite images with a spatial resolution of 2 m (Figure 1). It contains four multispectral bands; the spectral band ranges are: Blue 450–510 nm, Green 510–580 nm, Red 630–690 nm, and NIR 770–895 nm. The images over Dongdao Island and Saipan Island were acquired on 20 September 2012 and 27 September 2019, respectively. Besides, we used Sentinel-2A Level-2A multispectral images (consisting of 13 spectral channels) of two areas (see Section 3.2.4). There are four bands with spatial resolution of 10 m: Blue 458–523 nm, Green 543–578 nm, Red 650–680 nm, and NIR 785–900 nm. The data were downloaded directly from the open-source ESA/Copernicus Science Hub, and was ortho-corrected to the bottom-of-atmosphere reflectance.
The actual water depth data of Dongdao Island were obtained by a single beam echosounder in 2011, and the depth error and position error are 0.01 m and 1 m. The water depth data of Saipan Island are from the electronic nautical chart data measured in 2013, they meet the standard of Category of Zone of Confidence (CATZOC) proposed by the International Hydrographic Organization (IHO). The data in the nearshore areas meet the B standard, that is, between 0 m and 10 m water depth, the depth uncertainty and position uncertainty are less than 1.2 m and 20 m. The deep areas meet the A2 standard, the depth and position uncertainty are less than 1.6 m and 50 m between 10 m and 30 m water depth. The water depth data have been corrected to the theoretical depth datum. The research scope of this study is the 0–20 m water depth area around Dongdao Island and the northwest side of Saipan Island.
2.2. Data Processing
2.2.1. Multispectral Image Processing
The first step is radiation correction. It is the process of converting the image dimensionless gray value into the radiance value with practical significance, the conversion formula is as follows:
where is the radiance value of band , the unit is ; is the absolute scaling factor; is the gray value of image pixel; and is the equivalent band width.
Then the atmospheric correction is carried out. The attenuation of the atmosphere is selective for light of different wavelengths, so the effect of the atmosphere on different bands is different. Atmospheric correction can remove the influence of atmospheric scatterings and aerosols, and restores the true reflectance as much as possible. Our study uses the Fast line-of-sight atmospheric analysis of spectral hypercubes (FLAASH) module for atmospheric correction. After the abovementioned processing, we also use visual interpretation methods to mask the land and sea wave areas to obtain the final result.
2.2.2. Actual Water Depth Data Processing
The time of collecting the actual water depth data is not the same as that of acquiring the multispectral image. If the actual water depth data is used directly to participate in the calculation without the processing, errors will occur. In order to make the water depth retrieval result more accurate, the tidal correction is necessary. Tidal correction is to correct the actual measured water depth data to the instantaneous water depth at the time of the image acquisition. The water depth at a certain moment is equal to the sum of the actual water depth and the tidal height at that moment. According to the tide table, the tide height at the time of image acquisition for Dongdao Island was 0.81 m. The tidal height for Saipan Island was 0.57 m (Tides and solunar charts. Available online: https://tides4fishing.com/pi/northern-marianas-islands/saipan-harbor (accessed on 2020.05.16)).
2.3. Shallow Water Bathymetry Models
2.3.1. Inherent Optical Parameters Linear Model
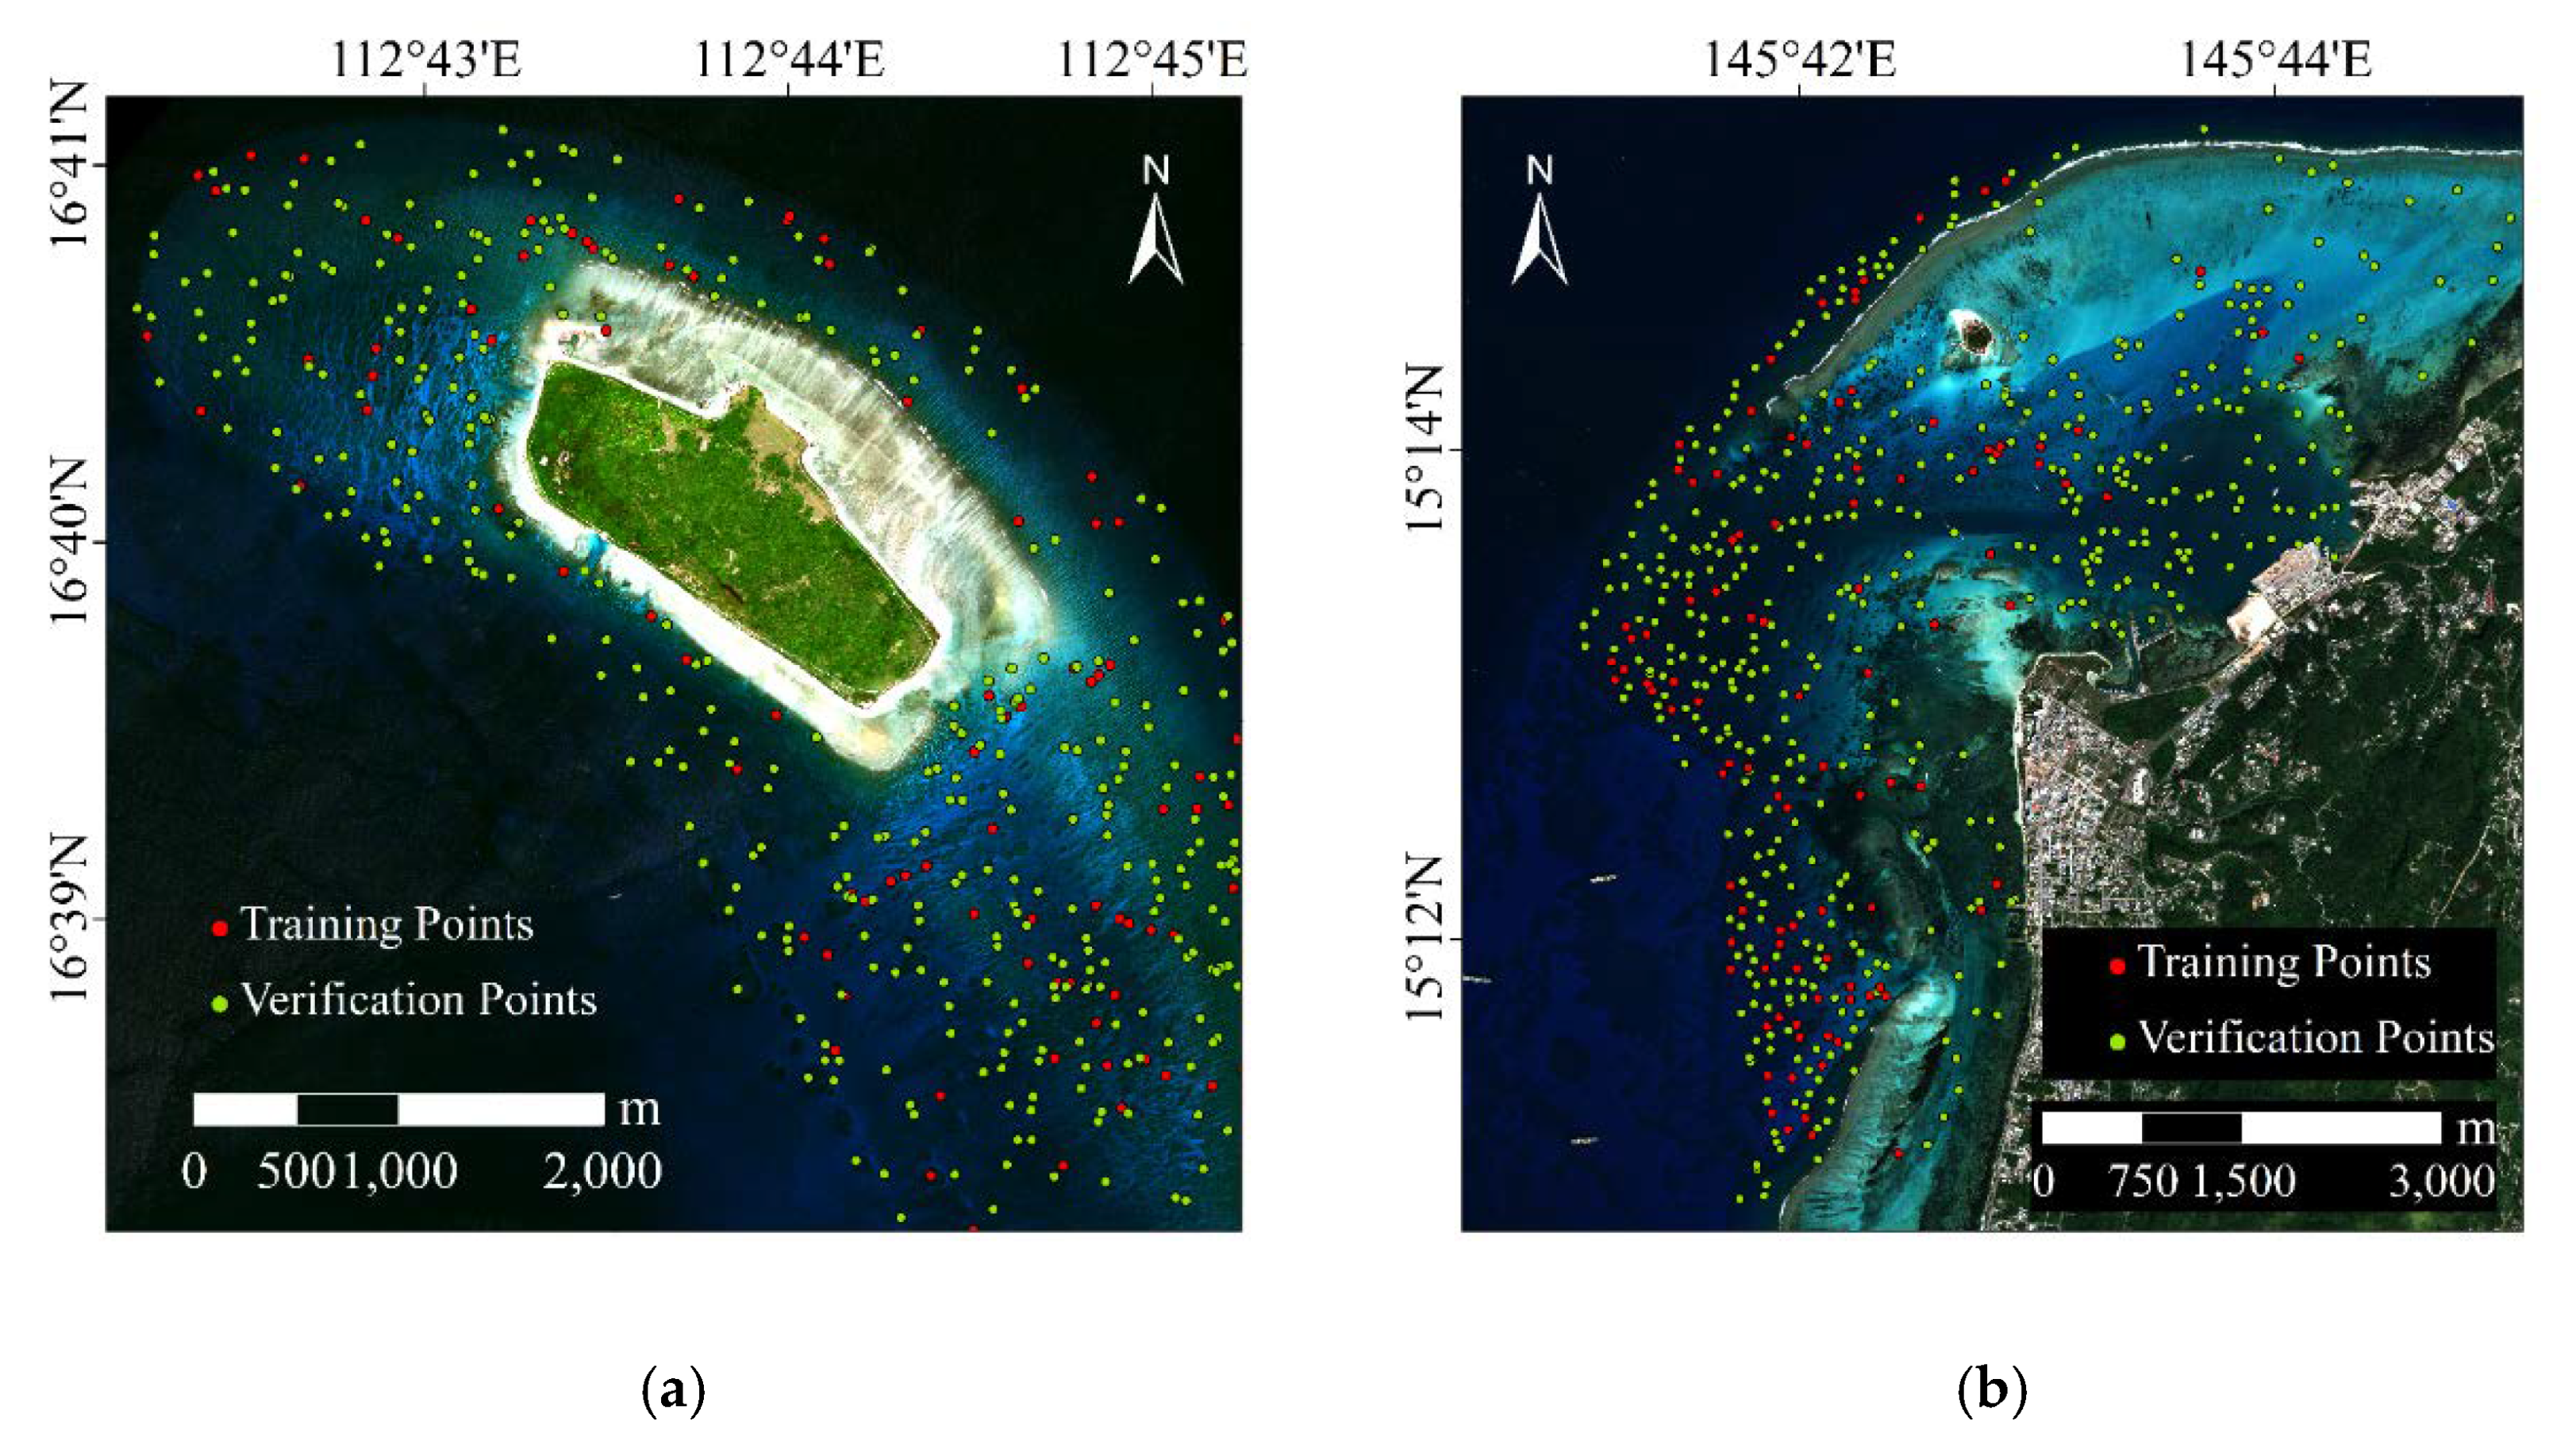
The area in Figure 2a is the North Island in the Paracel Islands of China. The points in Figure 2a are actual water depth points at different depths. In the water depth retrieval study of the multispectral image (Worldview-2), it was found that there is an obvious linear relationship between the water depth Z and the ratio of the inherent optical parameters (u(λ)) of the blue and green bands.
As shown in Figure 2b, two different color points in the figure represent the water depth points of different sediment types. For different types of sediments and different depths of water, there are obvious linear relationships. Therefore, in this study we propose a water depth retrieval model based on inherent optical parameters, which is called the Inherent Optical Parameters Linear Model (IOPLM). The formula is as follows:
where , are the regression coefficients; and are the inherent optical parameters of the blue band and the green band , it is a parameter related to absorption coefficient and backscattering coefficient. The formula is as follows [22]:
Here, and are model constants that change with a variety of water optical properties, the values of them may vary with the particle phase function, which is not known remotely. For oceanic case-1 water, ; 4 [22]. For coastal water with high scattering, and is more suitable [23]. In order to be applied to both coastal and open water bodies, here the averaged values taken by Lee [24] is used, and . In addition, is the subsurface remote sensing reflectance, it is obtained by conversion of atmospherically corrected reflectance [25,26], the conversion formula is as follows:
Since the North Island is too small, and the northeast part of the island is basically covered by waves, the bathymetric mapping result and accuracy evaluation of the North Island area are not performed in the following paper. It is only used as an example to show the IOPLM with different sediment types and water depths.
2.3.2. Stumpf Model
To avoid the situation where the difference between the radiance received by the optical remote sensor and the radiance in the deep water is negative, Stumpf et al. [14]. proposed a log conversion ratio model:
where and are the regression coefficients; is a fixed constant, which is usually taken as 1000; and are the remote sensing reflectance of the blue band and the green band .
2.3.3. Log-Linear Model
The dual band log-linear model [13] formula is as follows:
Here, , , , are the regression coefficients; and are the radiance of the blue band and the green band ; and are the radiance of each band in deep water.
2.4. Accuracy Evaluation Methods
The accuracy evaluation indexes of water depth accuracy are the mean absolute error (MAE), the mean relative error (MRE) and the root mean square error (RMSE), the corresponding formulas are as follows:
where is the estimated water depth; is the actual water depth; and is the number of water depth points.
Besides, we use the Kriging interpolation method to interpolate the verification points to obtain the overall results of the study areas. And the results will be used as the approximate “true” water depth results to compare with the retrieval results. Kriging is also called spatial local interpolation. It is an advanced geostatistical process that generates estimated surfaces through a set of scattered points with z values. Kriging considers that the change of spatial attributes is based on the spatial location relationship and the spatial autocorrelation and uses the variogram structure of the sample data points in the regionalized variables for unbiased and optimal estimations, which has a good smoothing effect. According to different research perspectives, there are different types of interpolation methods, the most widely used is the ordinary Kriging method [27].
The principle is to assume that the spatial distribution of the data satisfies the normal distribution. Then, select an appropriate theoretical model of the variogram according to the type of the sample variogram for simulation. And finally perform a linear estimation of the points. The formula is as follows:
here, represents the value of the point to be estimated; is the value of the points around the estimated point; is the weight coefficient, which is the optimal coefficient that can satisfy the minimum difference between the estimated value and the real value :
and the unbiased estimation is satisfied:
The accuracy of interpolation typically depends on the measurement sampling density and the distance to the measurements, as well as the terrain slope and curvature [28,29,30,31,32]. The standard deviation of the Kriging interpolation results of the two study areas is within 2 m. Although there are few verification points in our study areas, there will be some certain errors. However, the spatial distribution of the selected points and their distribution in different water depth sections are uniform, so the interpolation results can be approximately regarded as the actual results.
2.5. Sediment Classification Method
Support vector machine (SVM) [33] is a highly accurate machine learning algorithm based on statistical learning theory, and is widely used in the classification of remote sensing images [34]. The classification principle is to establish a hyperplane as the decision surface. When the decision plane can correctly classify the sample, the interval between the points closest to the classification plane in the sample is maximized. The point at the maximum interval is the support vector. The learning process of SVM is to find the support vector. For non-linear classification problems, the original data is mapped from the original R-dimensional space to the high-dimensional space Ω through a nonlinear mapping Φ. And then the optimal classification surface is obtained in the high-dimensional feature space Ω. The dimensionality of Ω may be very high, and the kernel function can be used to solve the dimensionality disaster. The kernel function used in the SVM classifier in this paper is the polynomial kernel function. The SVM method is used to classify the bottom sediment types of Dongdao Island and Saipan Island. Then, the results are separately used to evaluate the depth retrieval accuracy for different sediment types.
3. Results
3.1. Water Depth Retrieval Results
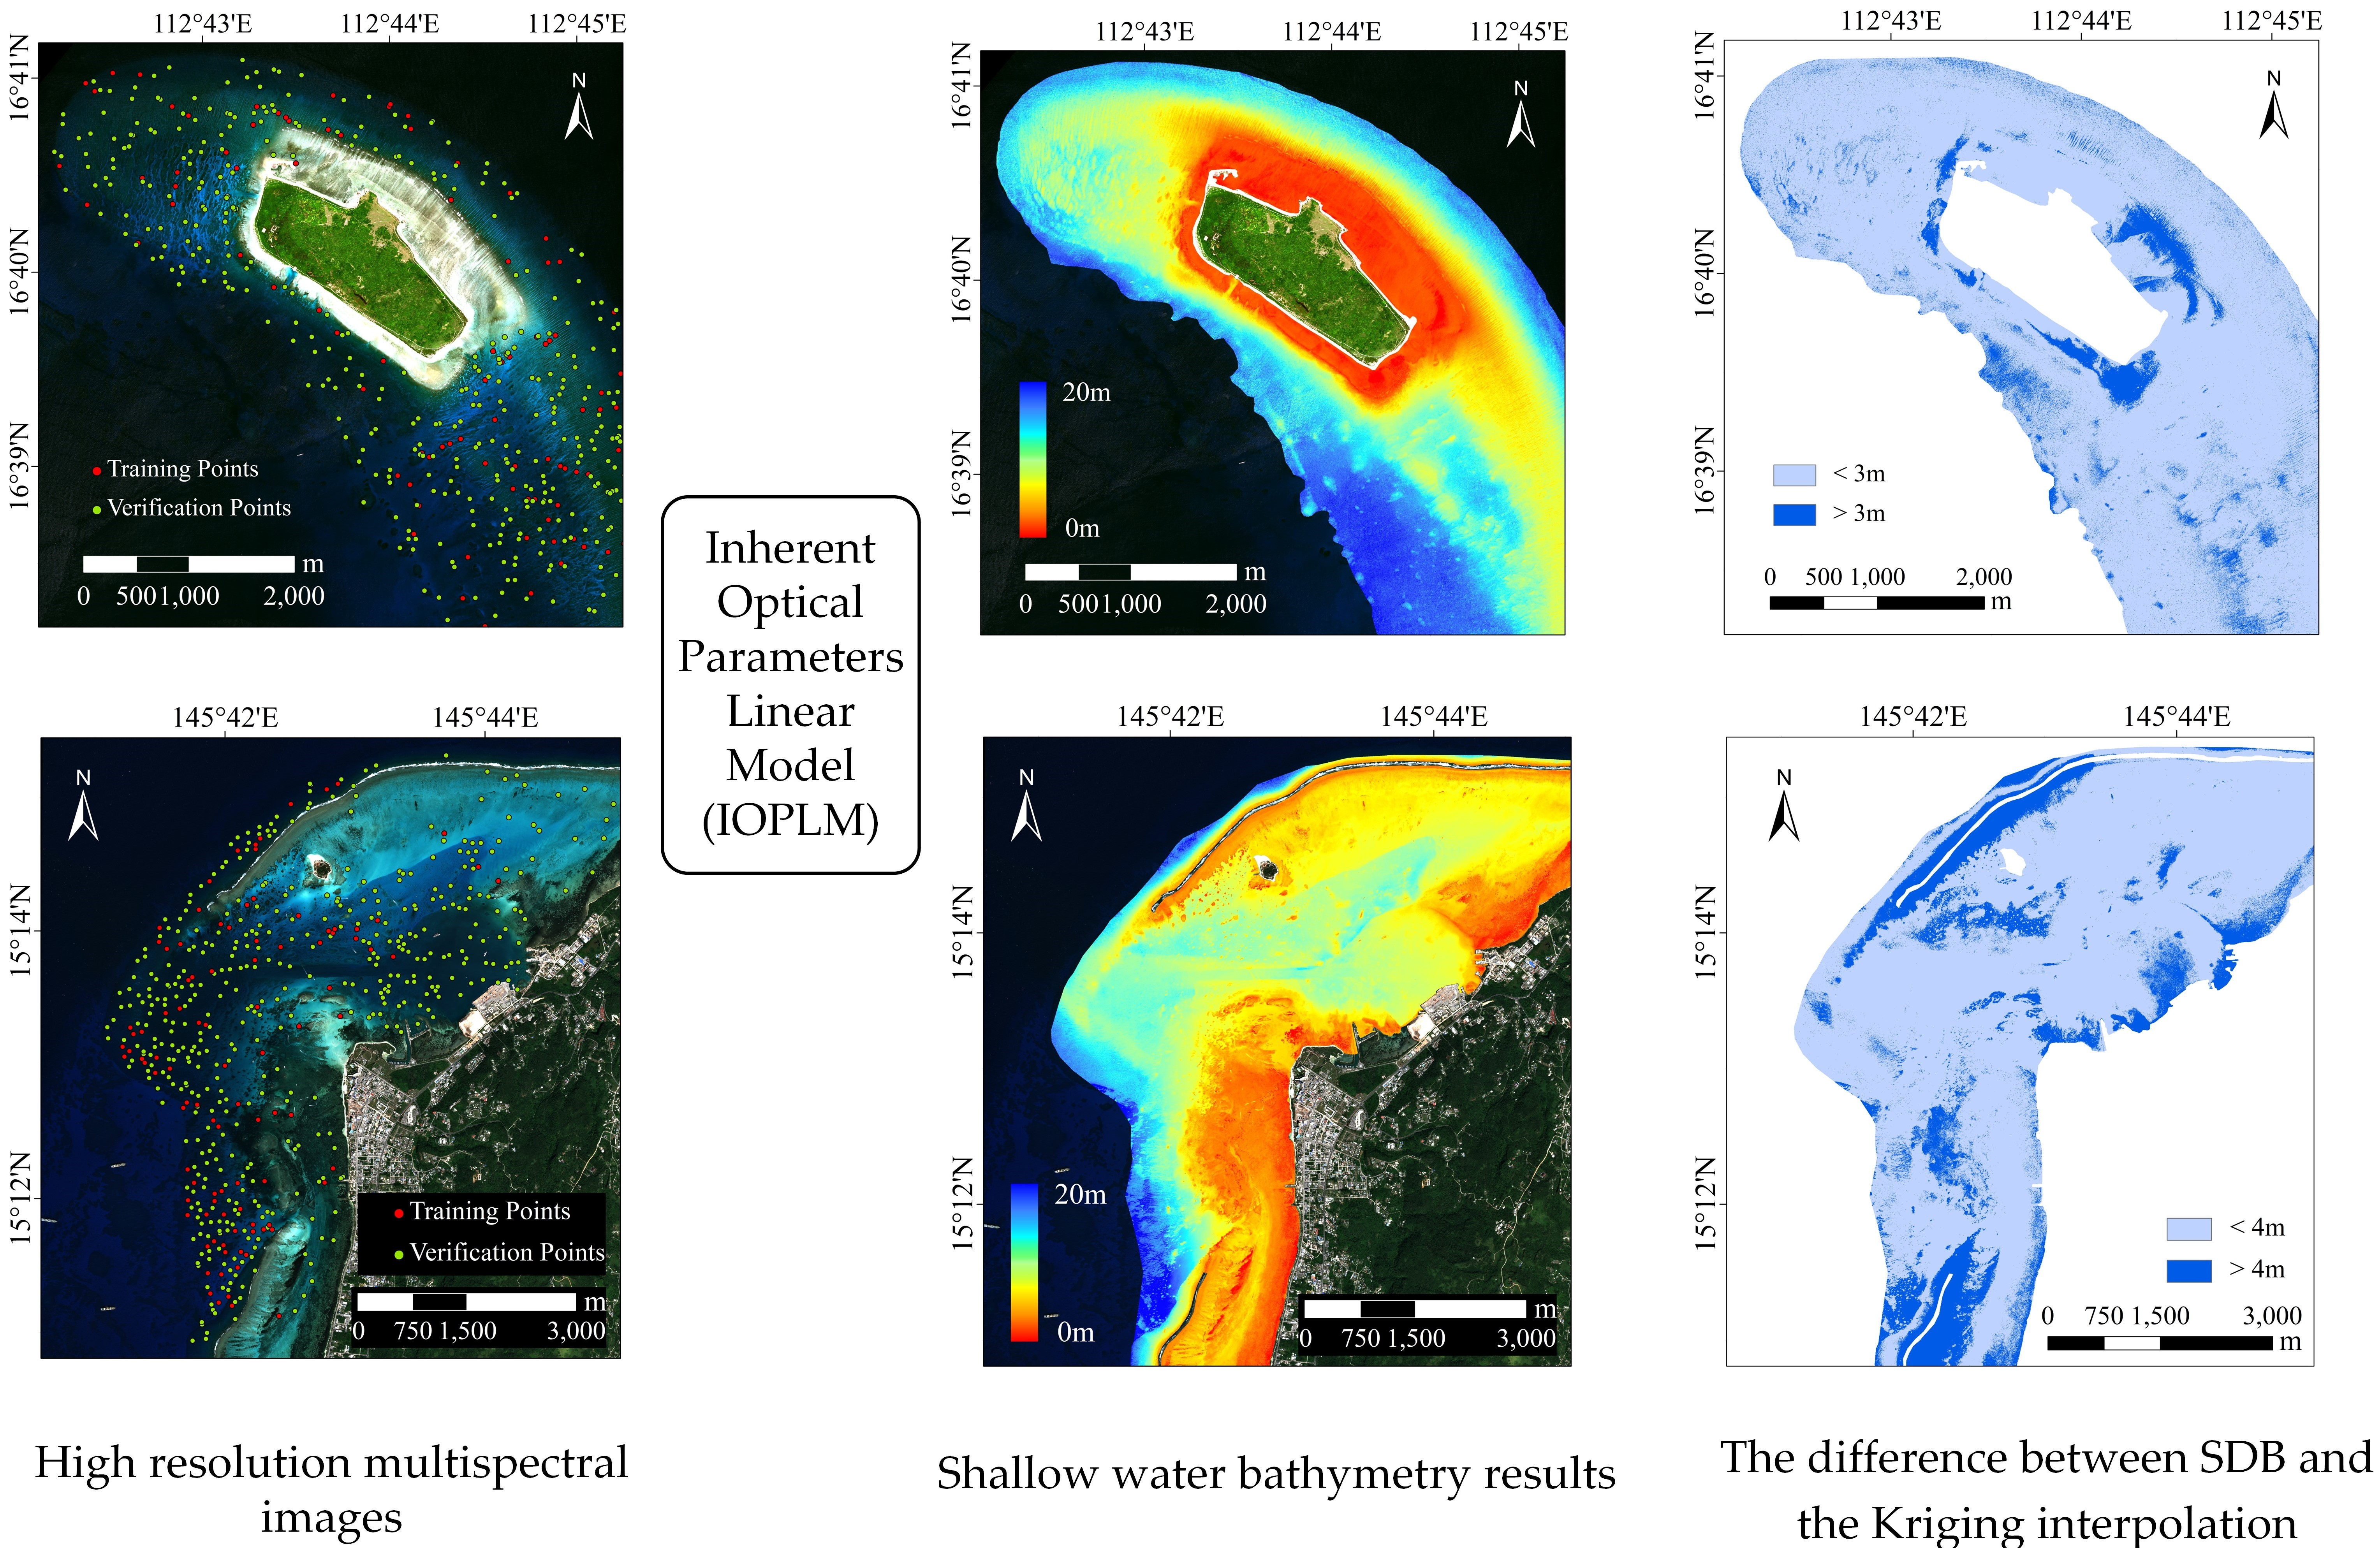
Water depth training points and verification points with uniform spatial distribution are selected in the two study areas, as shown in Figure 1. The water depth training points are used to calculate the parameters of each model. In the range of 0–20 m water depth, five training points are selected at every 1 m interval, so a total of 100 training points are selected. Verification points are used to verify the accuracy of the model and evaluate the water depth retrieval results. The number of verification points for Dongdao Island and Saipan Island are 395 and 450, respectively. Their number is evenly distributed in different water depths.
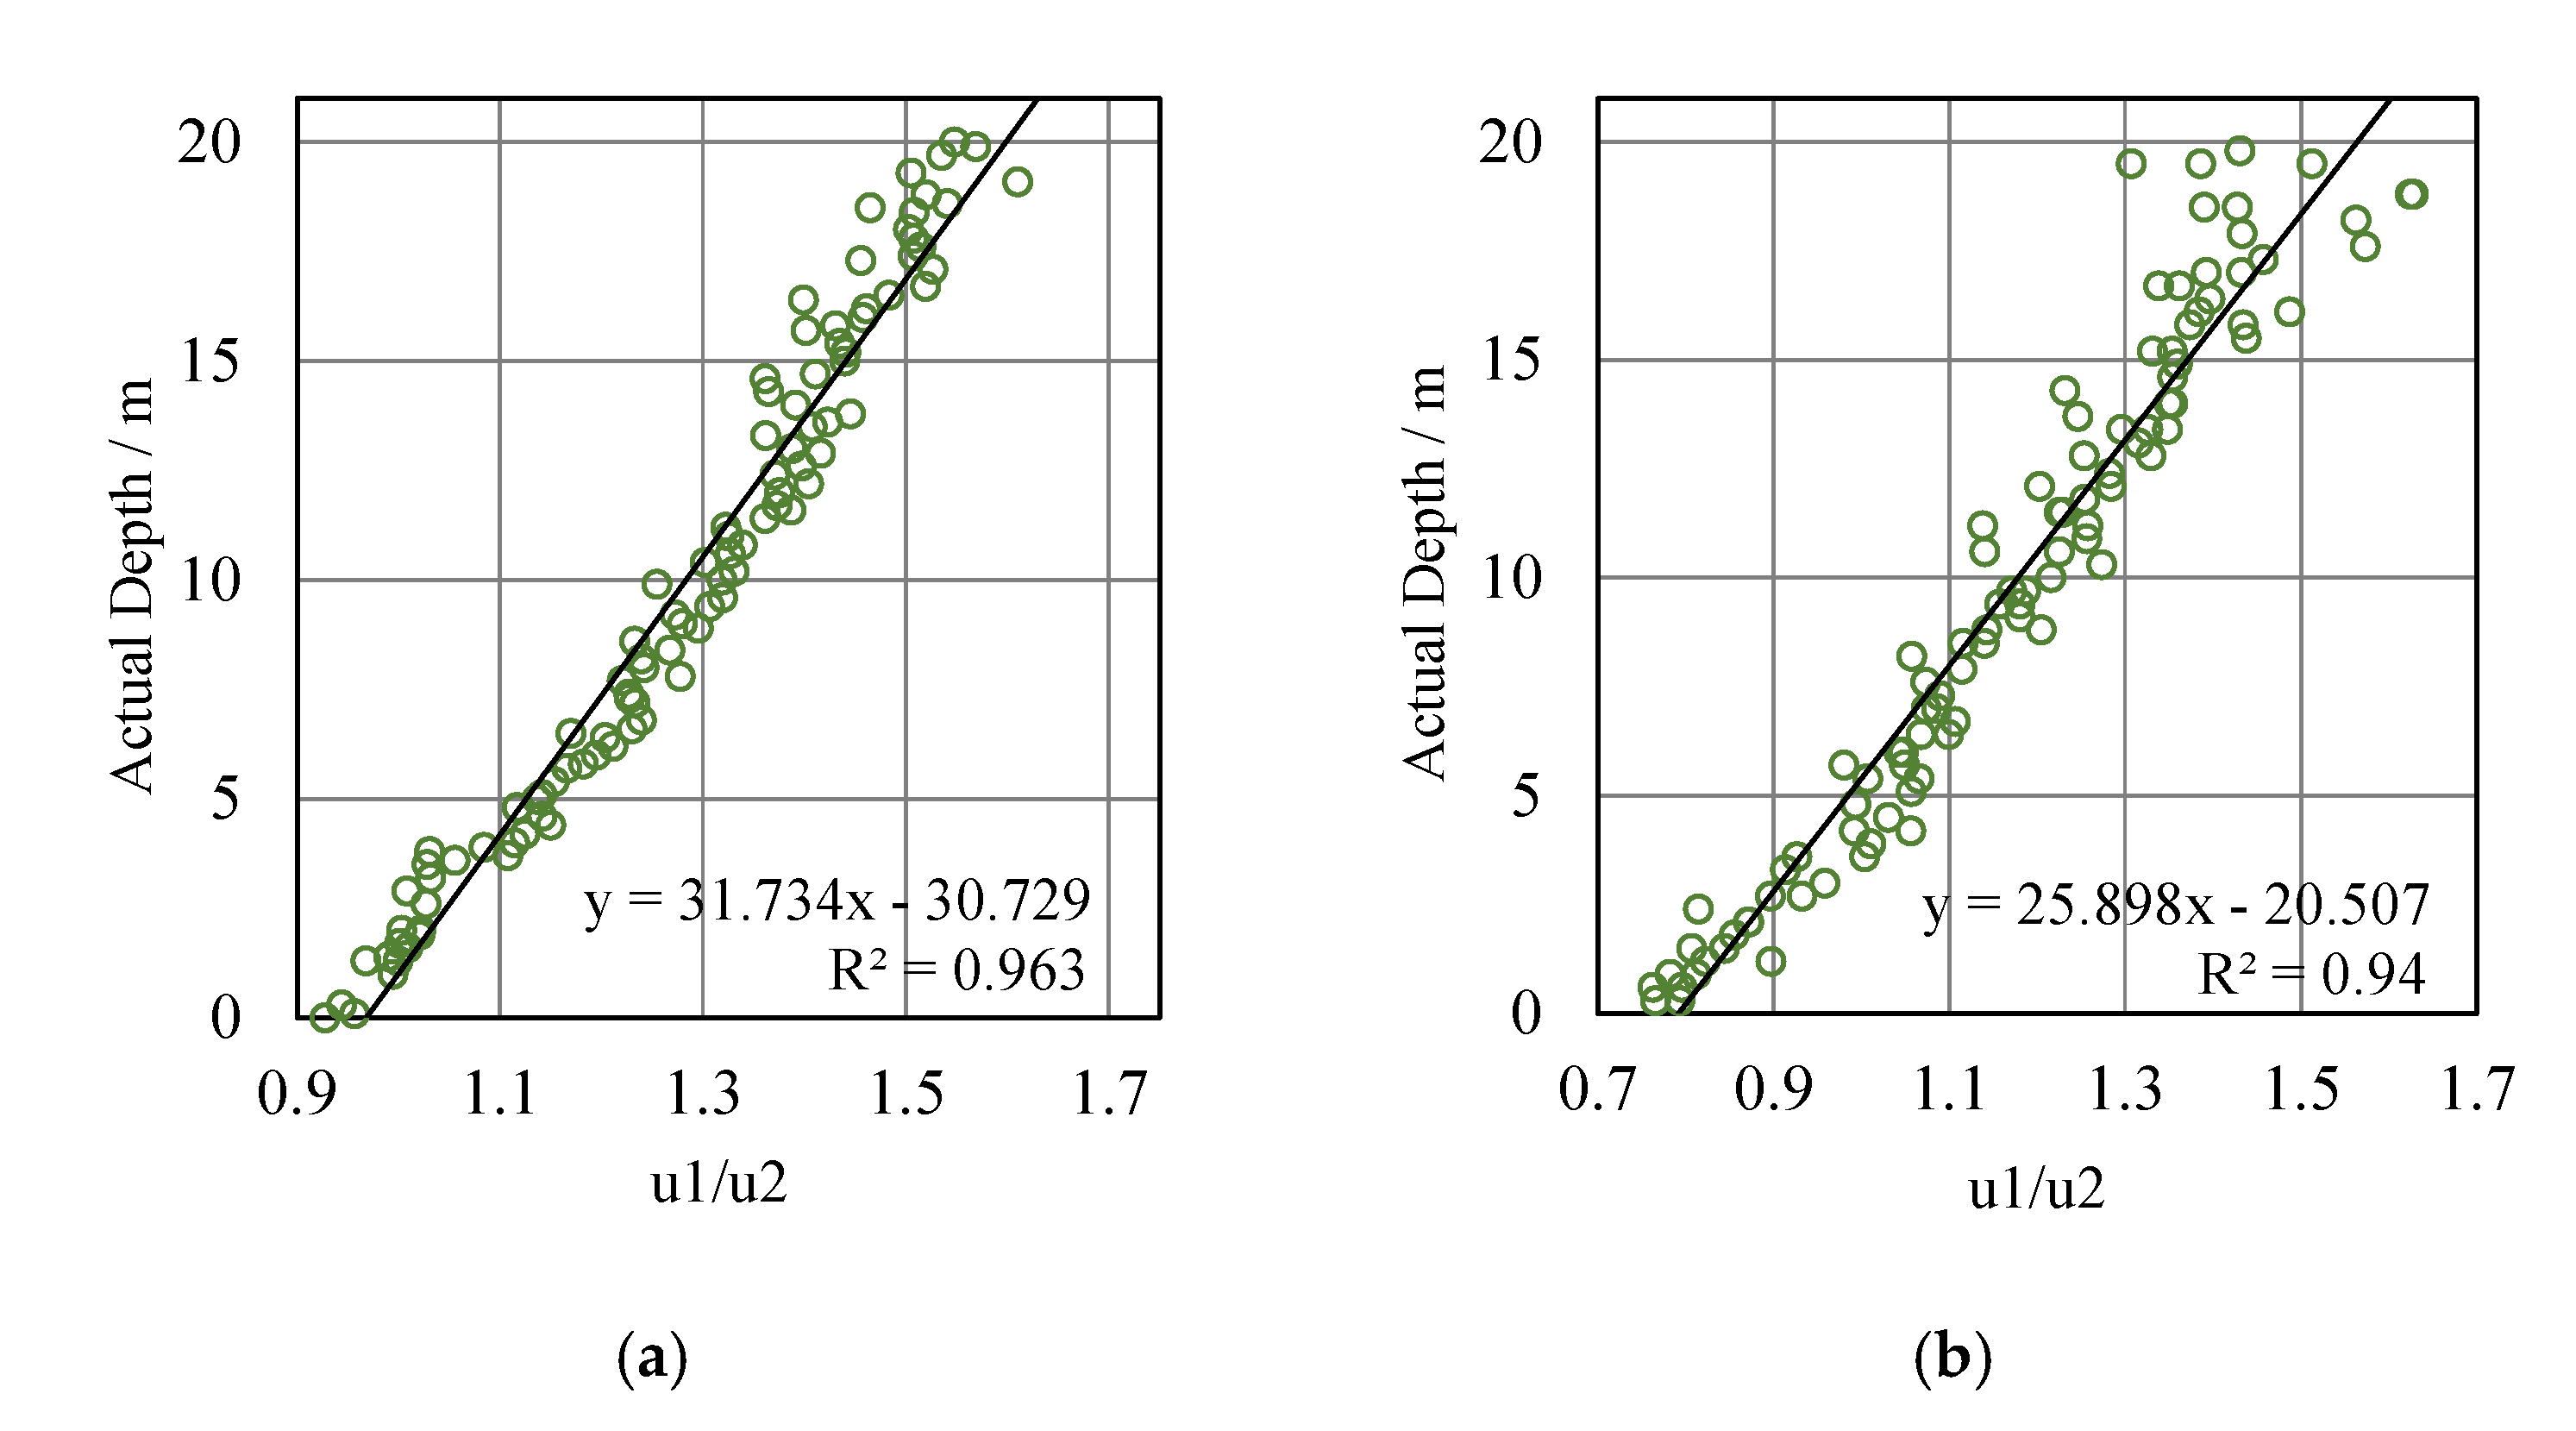
The models are established by using the relationship between the water depth value of the training points and the remote sensing reflectance or radiance value, and the parameters of the three models are then calculated (Table 1). Figure 3a is the fitted scatter plot of the inherent optical parameters linear model of Dongdao Island’s training points. It can be seen that the scatter distribution is roughly a straight line, and the R2 is 0.963. In addition, Table 1 shows the R2 of Stumpf’s model and the Log-linear model are 0.95 and 0.92, respectively, which are less than the inherent optical parameters linear model. Figure 3b is the fitted scatter plot of IOPLM of Saipan Island’s training points, and the scatter points also approximately show a linear distribution. However, when the water depth is deep (15–20 m), the deviation degree of the scatter points is large, and the fitting effect is inferior to that of 0–15 m. The overall R2 is 0.94, and the R2 of Stumpf’s model and the Log-linear model are 0.93 and 0.89, respectively, which are inferior to IOPLM.
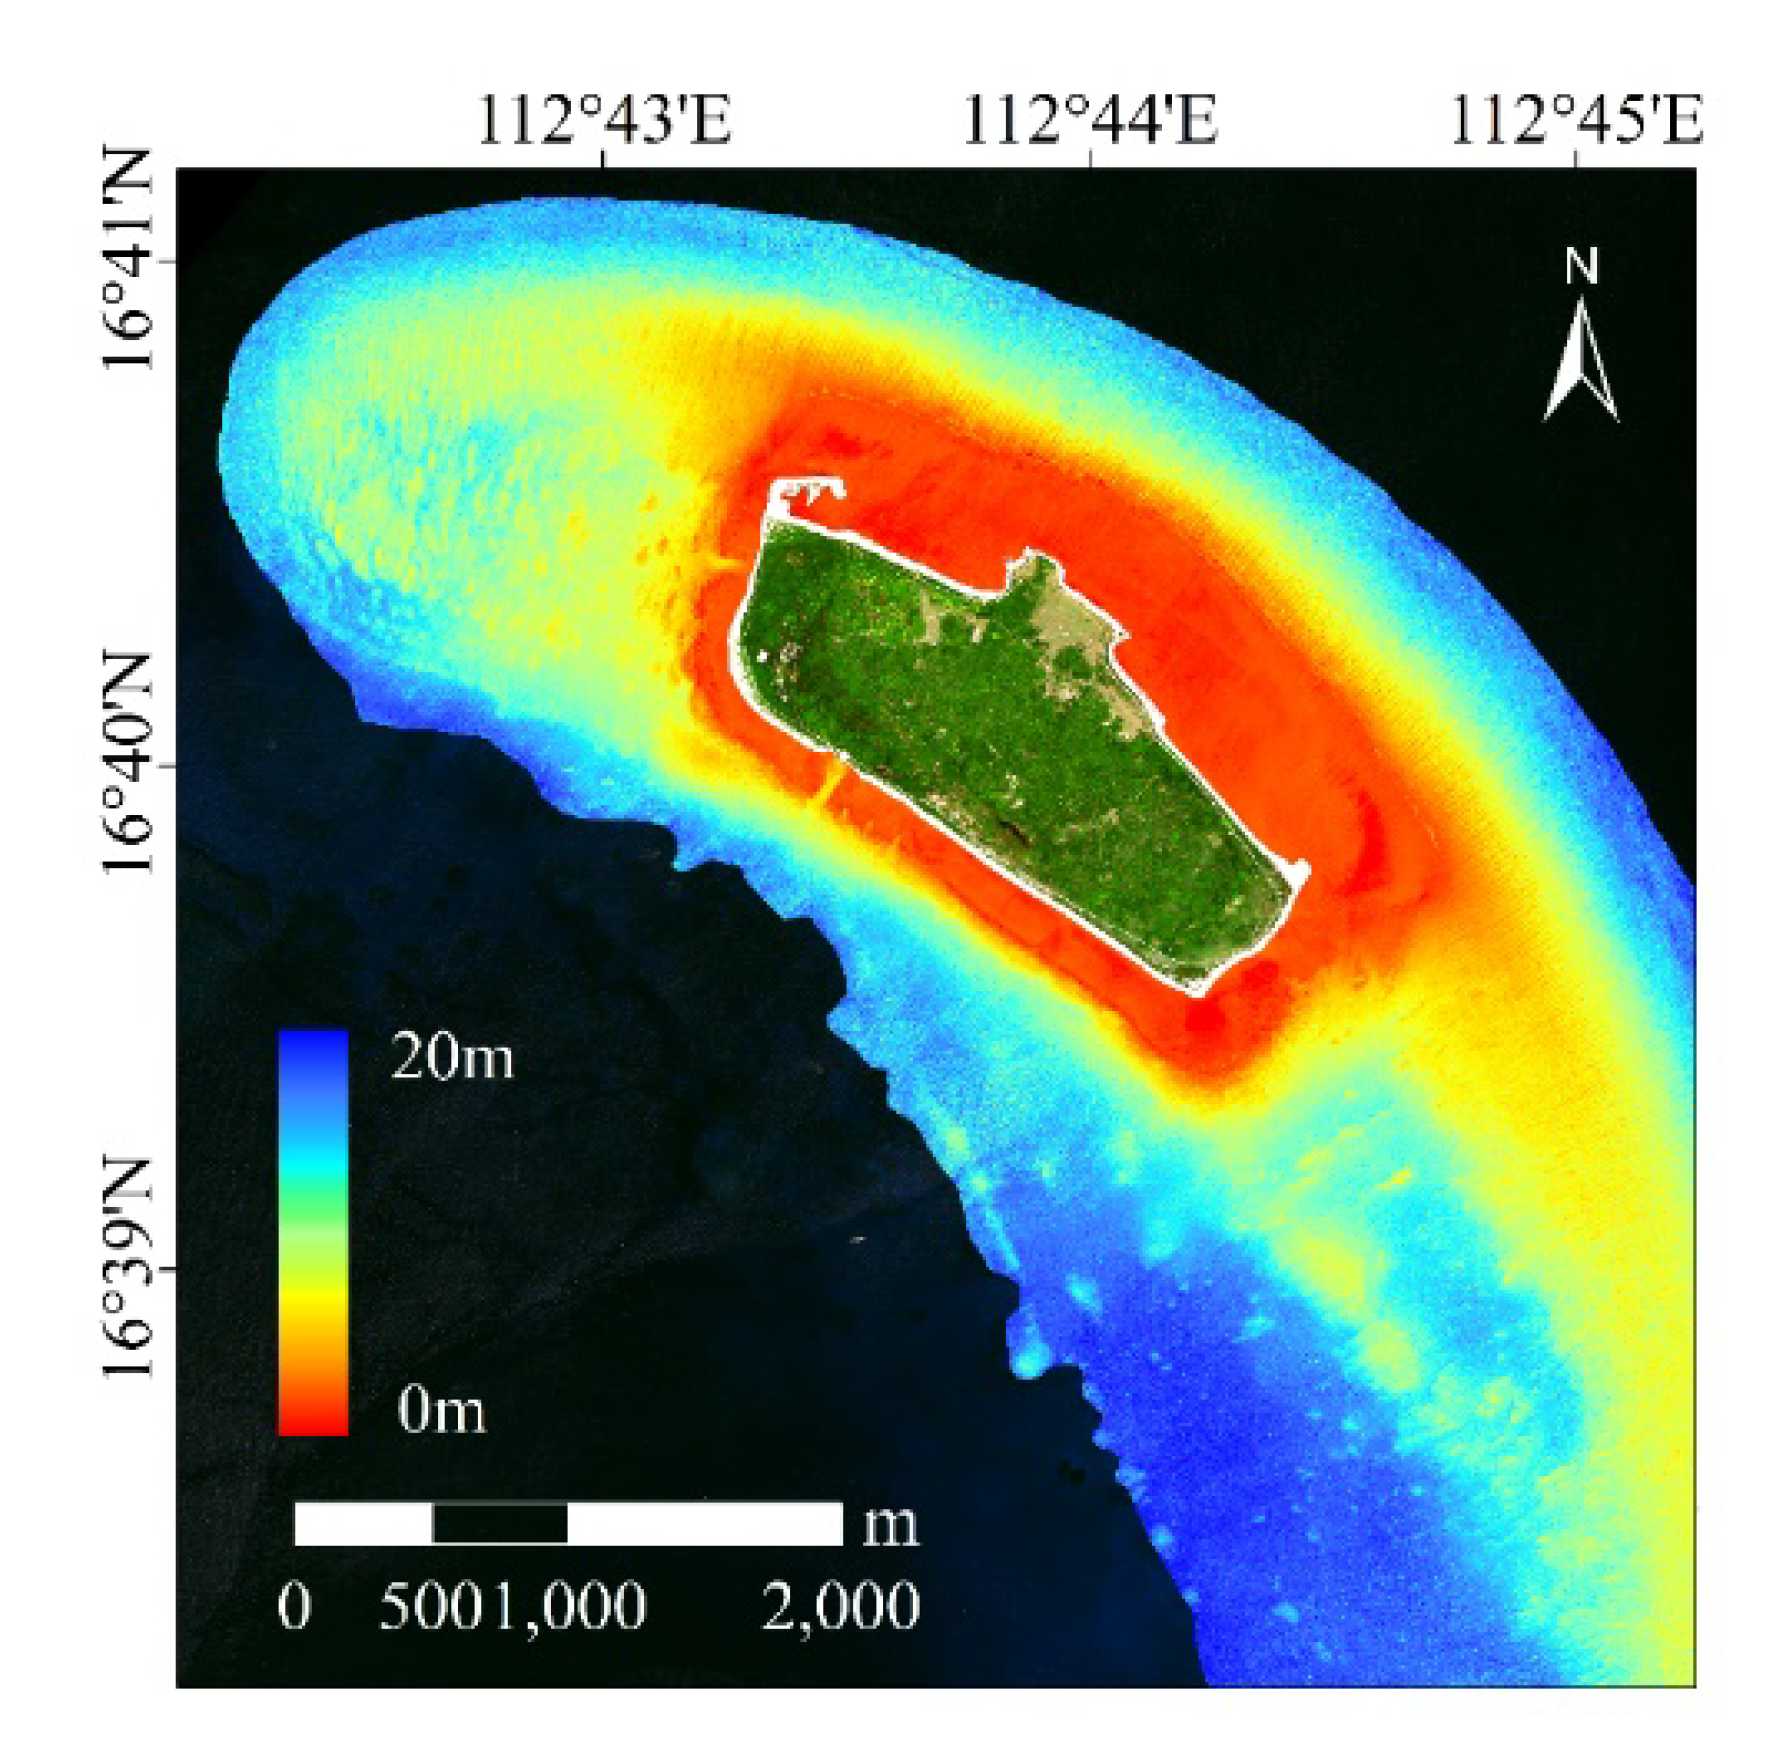
Figure 4 shows the water depth retrieval map based on the IOPLM of Dongdao Island. It reflects the variation trend of the water depth in different areas from 0 to 20 m. The variation of water depth around Dongdao Island is relatively uniform, and the water depth from around the island to the open water increases gradually. On the island’s reef, the water depth ranges approximately from 0 to 5 m, and the distribution range in the northeast direction is larger than that in the southwest direction. The area with the water depth ranging from 5 to 15 m is roughly distributed on the northwest and southeast sides of the island from 0.5 km to 2 km. The area with the water depth greater than 15 m is small in the northern part of the island, but it is widely distributed in the southeast of the island (18–20 m). Notice that there is a harbor basin at the southwest corner of Dongdao Island, and the model reflects this feature accurately.
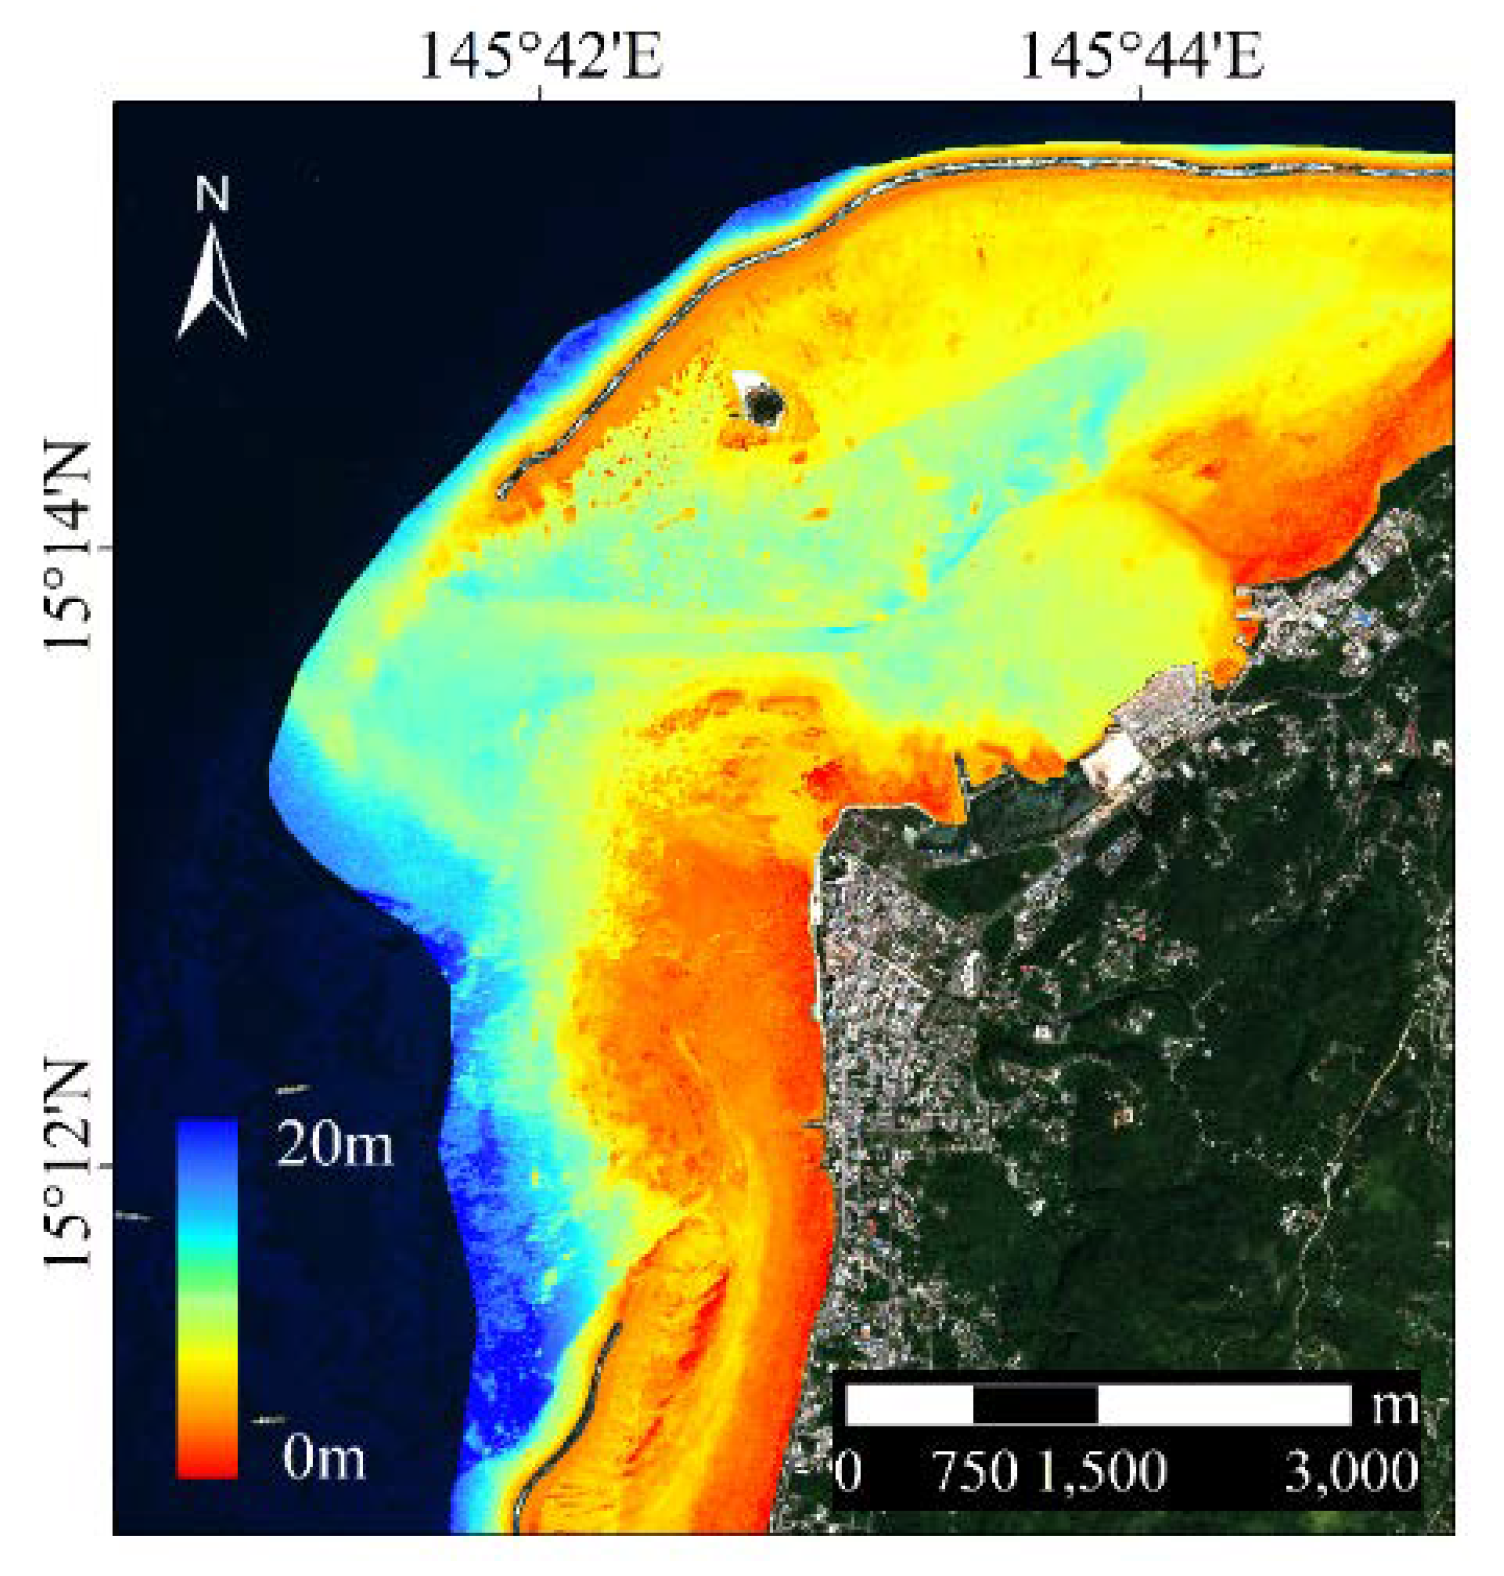
Figure 5 shows the water depth retrieval map based on the IOPLM of Saipan Island. The variation of water depth in the area around Saipan Island is irregular. The shallow water area is located on the central coast of Saipan Island and the reef beach on the west to the east side around Managaha Island. The deeper water area is located between the lagoon in the middle of Saipan Island, and the channel in the south of Managaha Island towards the open water. The bottom of the map shows that the water depth in the south of Saipan Island varies greatly from east to west. The 0–5 m water depth area is roughly in the coral reef area along the west and northeast of Saipan and the northwest to northeast of Managaha Island. The area in the range of 5–15 m water depth is relatively large, while the deep water area of 15–20 m is mostly distributed in the south of the study area.
3.2. Accuracy Evaluation of Water Depth Retrieval
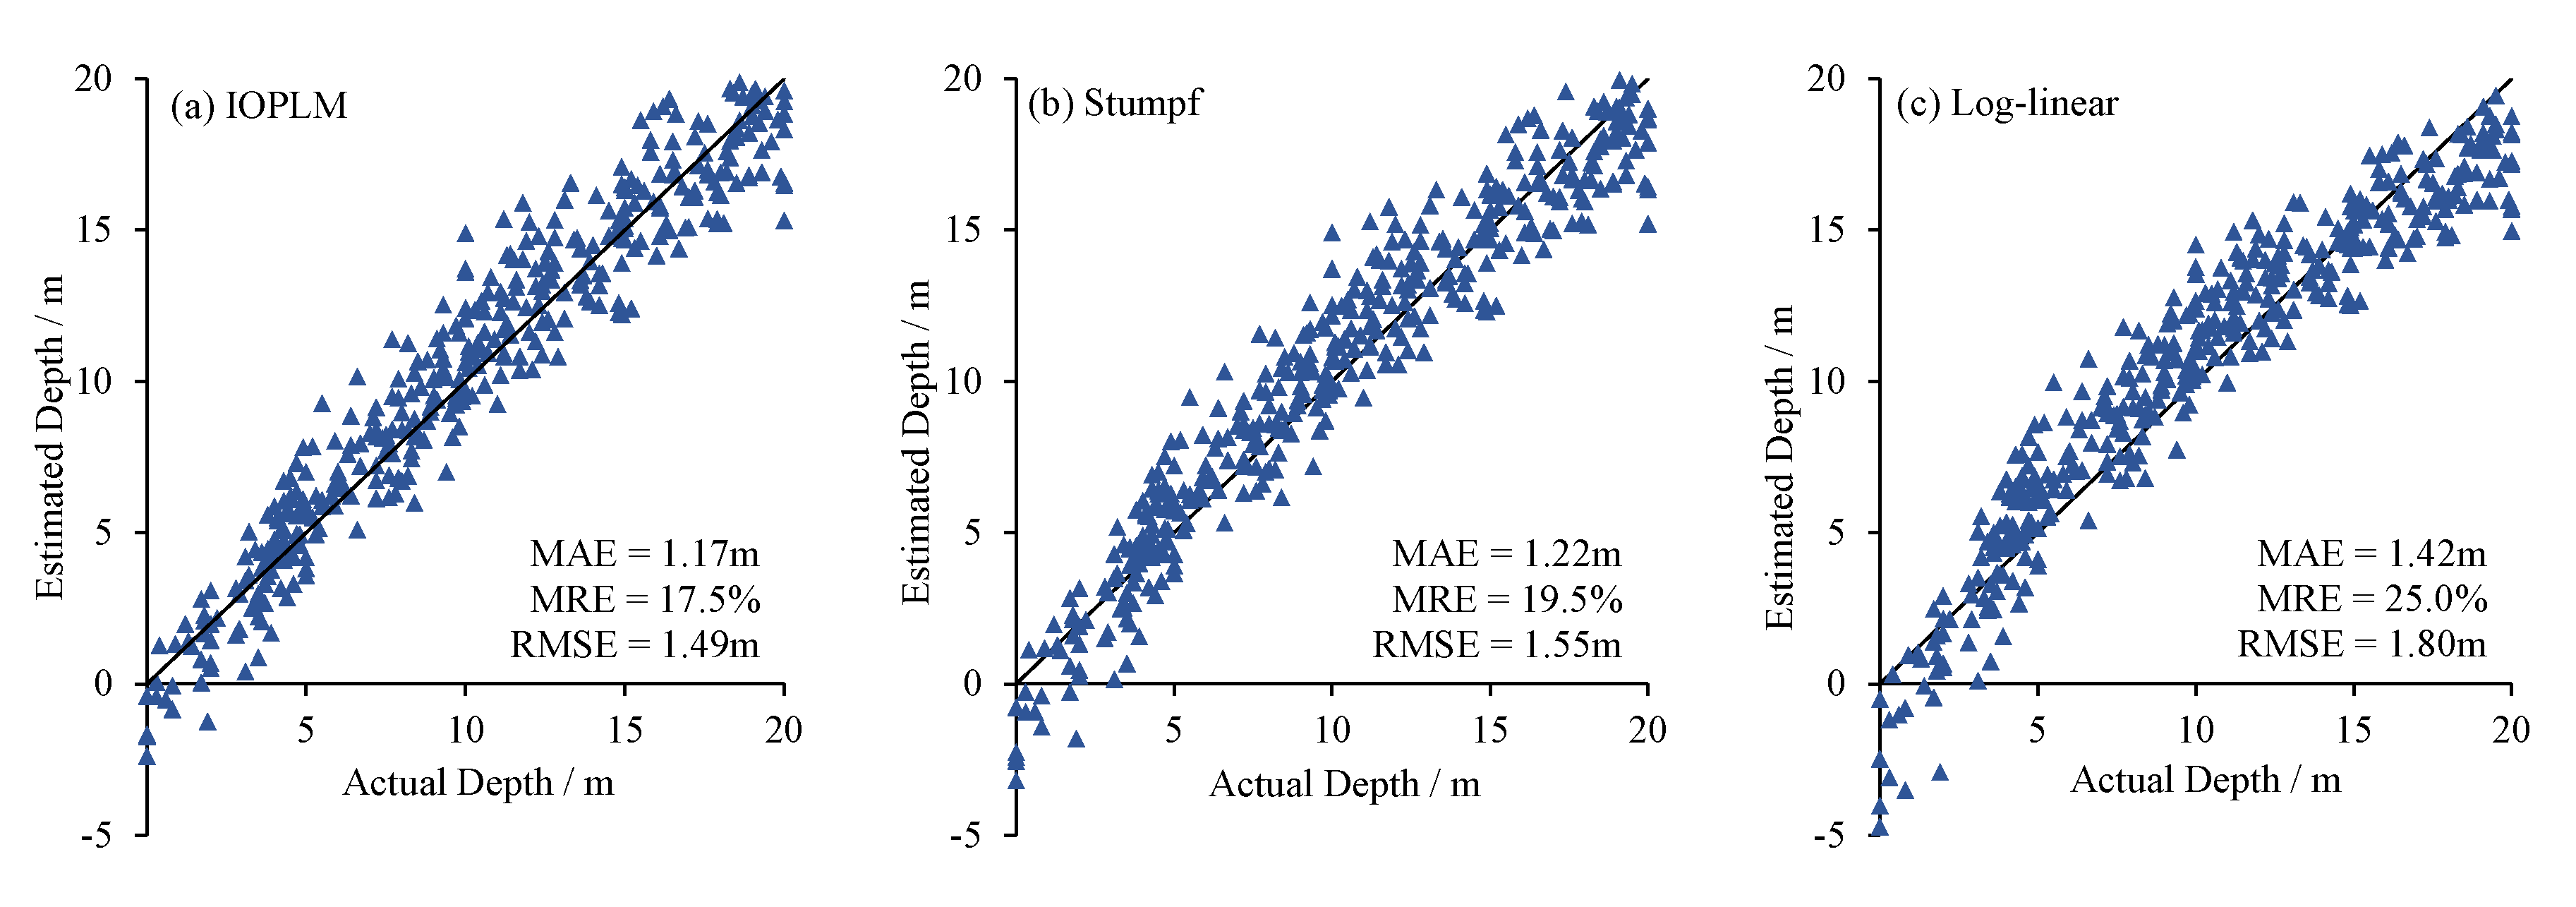
The mean absolute error, the mean relative error and the root mean square error of the different models in two study areas are calculated, as shown in the labels in Figure 6 and Figure 7. The results show that the best overall retrieval results in the two study areas both are from IOPLM. The overall retrieval results of Dongdao Island are better than that of Saipan Island. The MAE, MRE and RMSE of IOPLM are 1.17 m, 17.5% and 1.49 m, respectively. The MAE is 0.05 m and is 0.25 m lower than the Stumpf model and the log-linear model; the MRE is 2% and 7.5% lower than Stumpf model and log linear model; and RMSE was 0.06 m and 0.31 m lower than Stumpf model and log linear model, respectively.
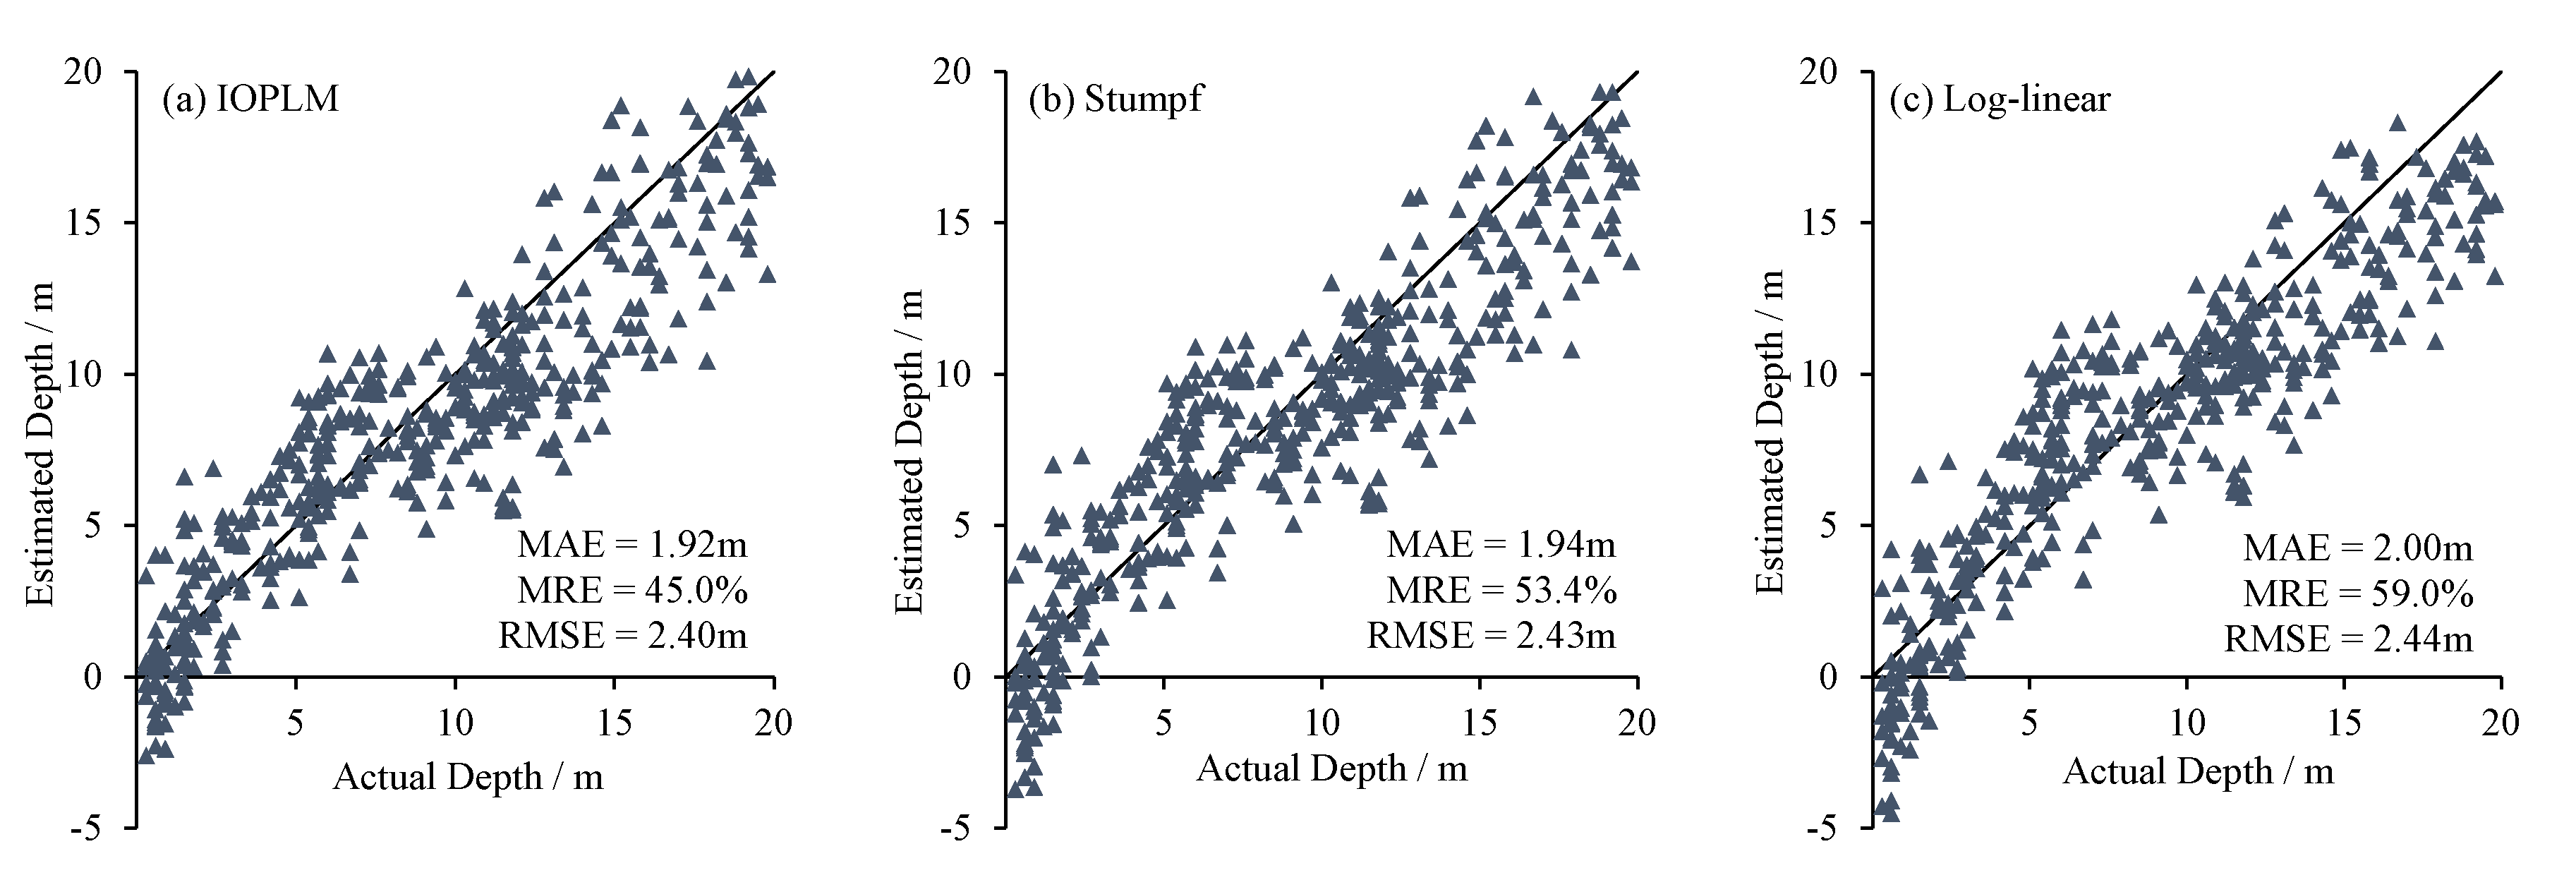
The study area of Saipan Island is larger than that of Dongdao Island, and the accuracy is lower. The results show that the MAE, MRE and RMSE of IOPLM are 1.92 m, 45% and 2.4 m, respectively. Its MAE is 0.03 m and 0.08 m lower than that of Stumpf model and log-linear model; and MRE is about 9% and 14% lower than that of Stumpf model and log linear model, respectively; The RMSE of Stumpf model and log-linear model are also higher than that of IOPLM.
The scatterplots of the estimated water depth and the actual water depth, resulting from the different models for both study areas are drawn in Figure 6 and Figure 7. The scatter plot shows the deviation of estimated water depth and the actual water depth of each verification point. The closer the scatter points are to the 1:1 line, the smaller the deviation is. That is, the closer the estimated water depth value is to the actual water depth value, and vice versa.
For Dongdao Island, the IOPLM has the best water depth retrieval results. The verification points in each water depth segment are close to the 1:1 line, and the degree of deviation is smaller than that of the other two models. In the water depth of 0–5 m, it can be clearly seen that the deviation of IOPLM is the smallest, while the deviation of the log-linear model is the largest. In the range of 5–15 m, the Stumpf model and the log-linear model overestimate the water depth values more than the IOPLM, especially in the log-linear model. In the range of 15–20 m, the deviation degree of IOPLM and the Stumpf model is similar, but the log-linear model is relatively large, and most of the water depth values are underestimated. As for Saipan Island, the overall retrieval results of the three models are similar, and the degree of deviation of the scatter points is greater than that of Dongdao Island. In the range of 0 to 10 m, it can also be seen that the deviation degree of IOPLM is relatively small. For 10–15 m, most points of the IOPLM and the Stumpf model underestimate the water depth values; however, the log-linear model has a better fitting result, and the deviation is the smallest. For the 15–20 m, the deviation degree between the IOPLM and the Stumpf model is close, which is better than the result of log-linear model.
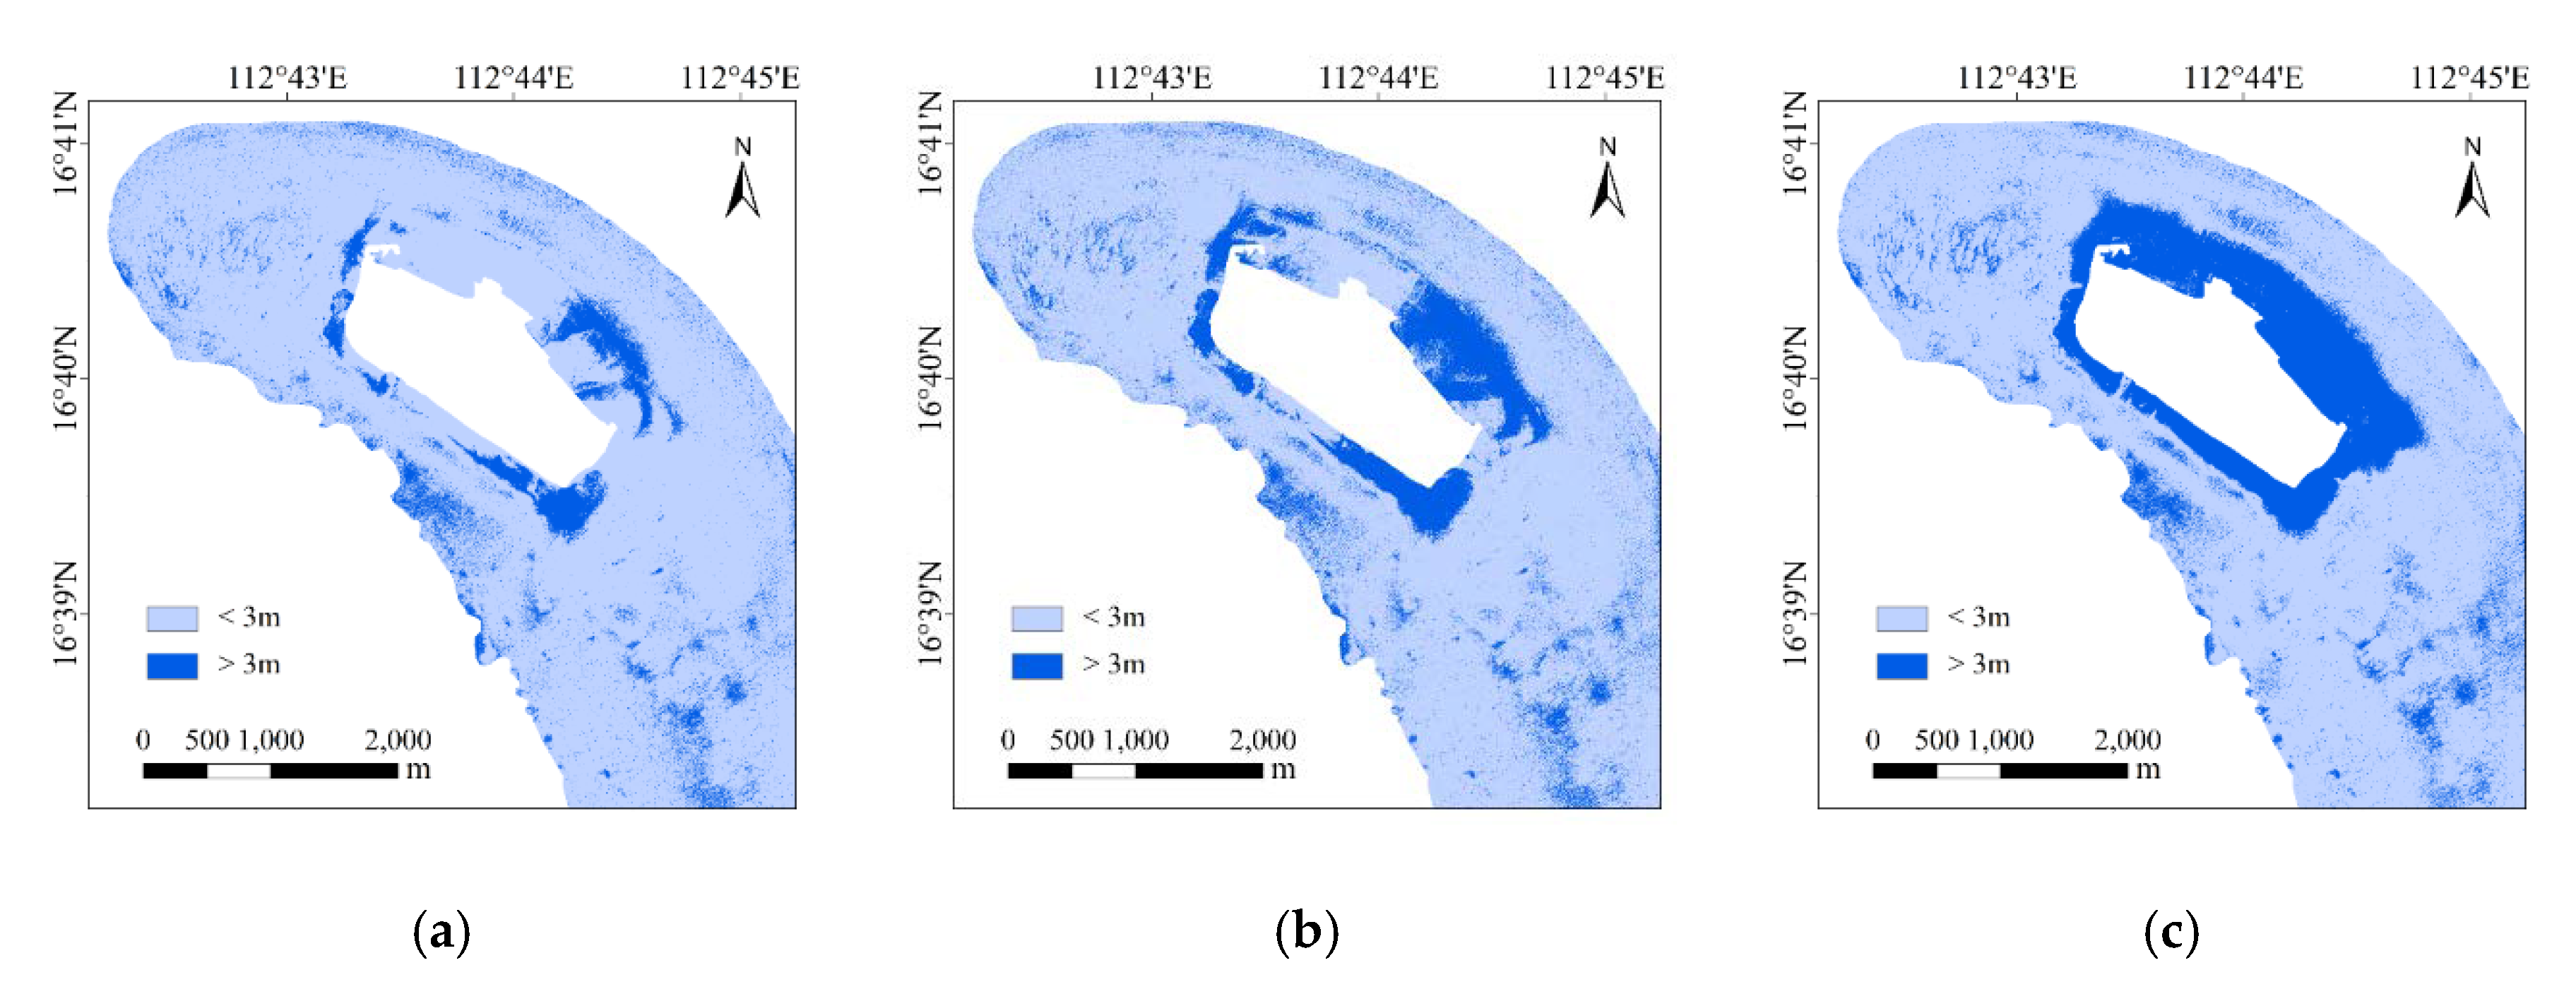
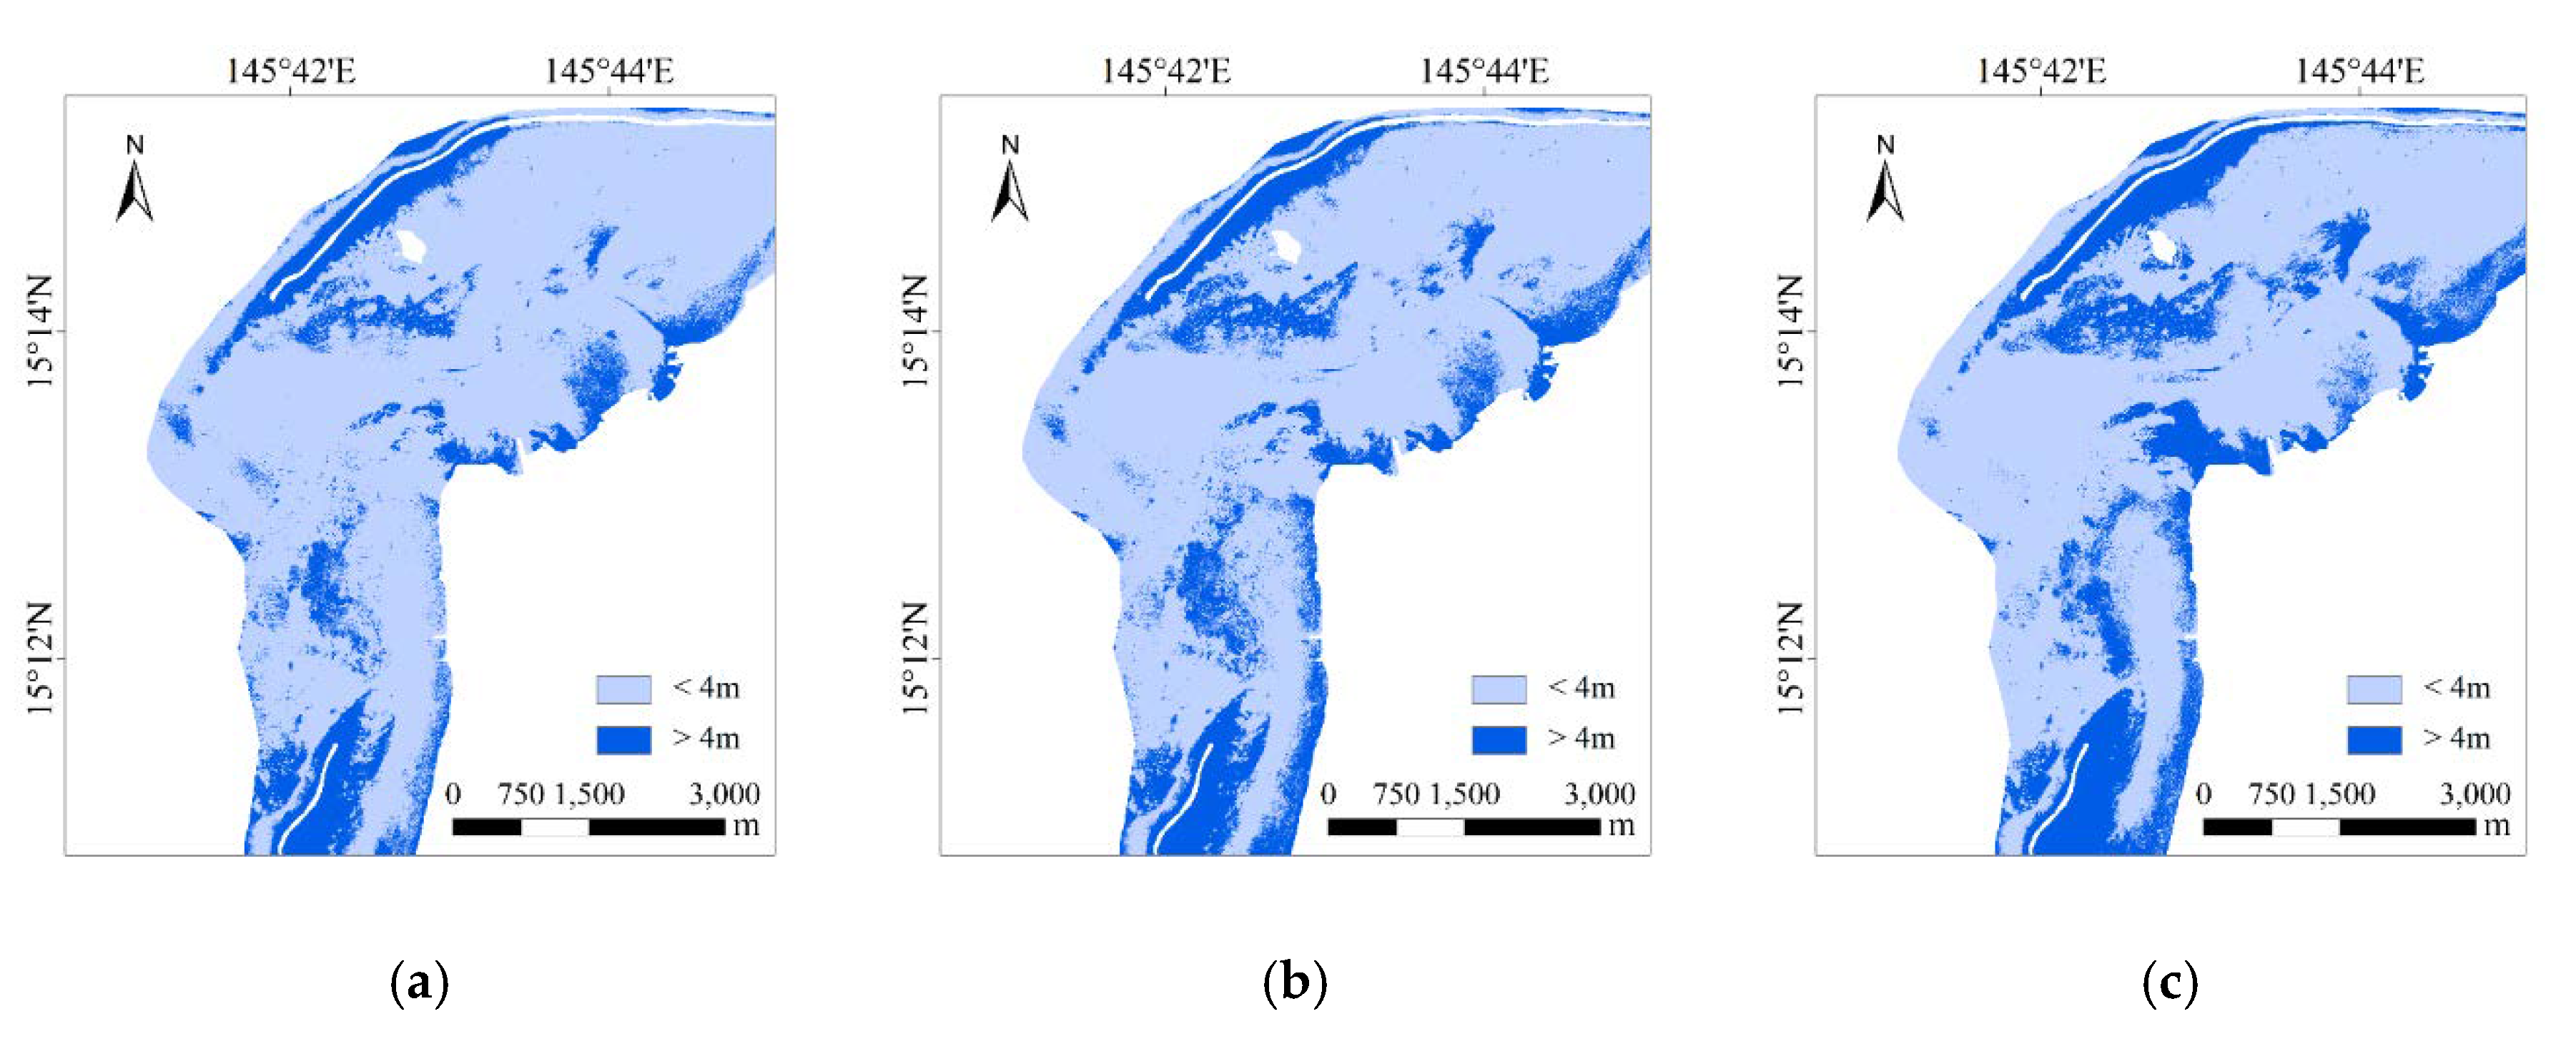
Figure 8 and Figure 9 show the difference between the retrieval results and the Kriging interpolation of the verification points of different models in the two study areas. According to the above analysis, due to the high accuracy of Dongdao Island, taking the error of 3 m as the boundary, and the difference between different models is compared. For Saipan Island, 4 m is taken as the boundary due to the large error. The dark blue represents the areas with large water depth differences, and the light color represents the areas with small water depth differences.
The result in Figure 8 shows that the difference in most areas between the IOPLM and the Kriging interpolation results are less than 3 m, but only in small area in the eastern part of the reef. Stumpf model is similar to the IOPLM in areas with large differences, but it has a larger distribution range. And the remaining areas with large differences are also more than IOPLM. As for the log-linear model, the large difference results almost cover the entire range of the reef around island, and the remaining large difference areas are also more than those from the Stumpf model. Figure 9 shows that the areas in three models where the great differences appear on the coast of Saipan Island and around Managaha Island. However, the regions with large differences in the IOPLM are the smallest. According to the above results, the overall retrieval results in the two study areas of the IOPLM are more coincident with the Kriging interpolation result than that of the Stumpf’s model and the log-linear model.
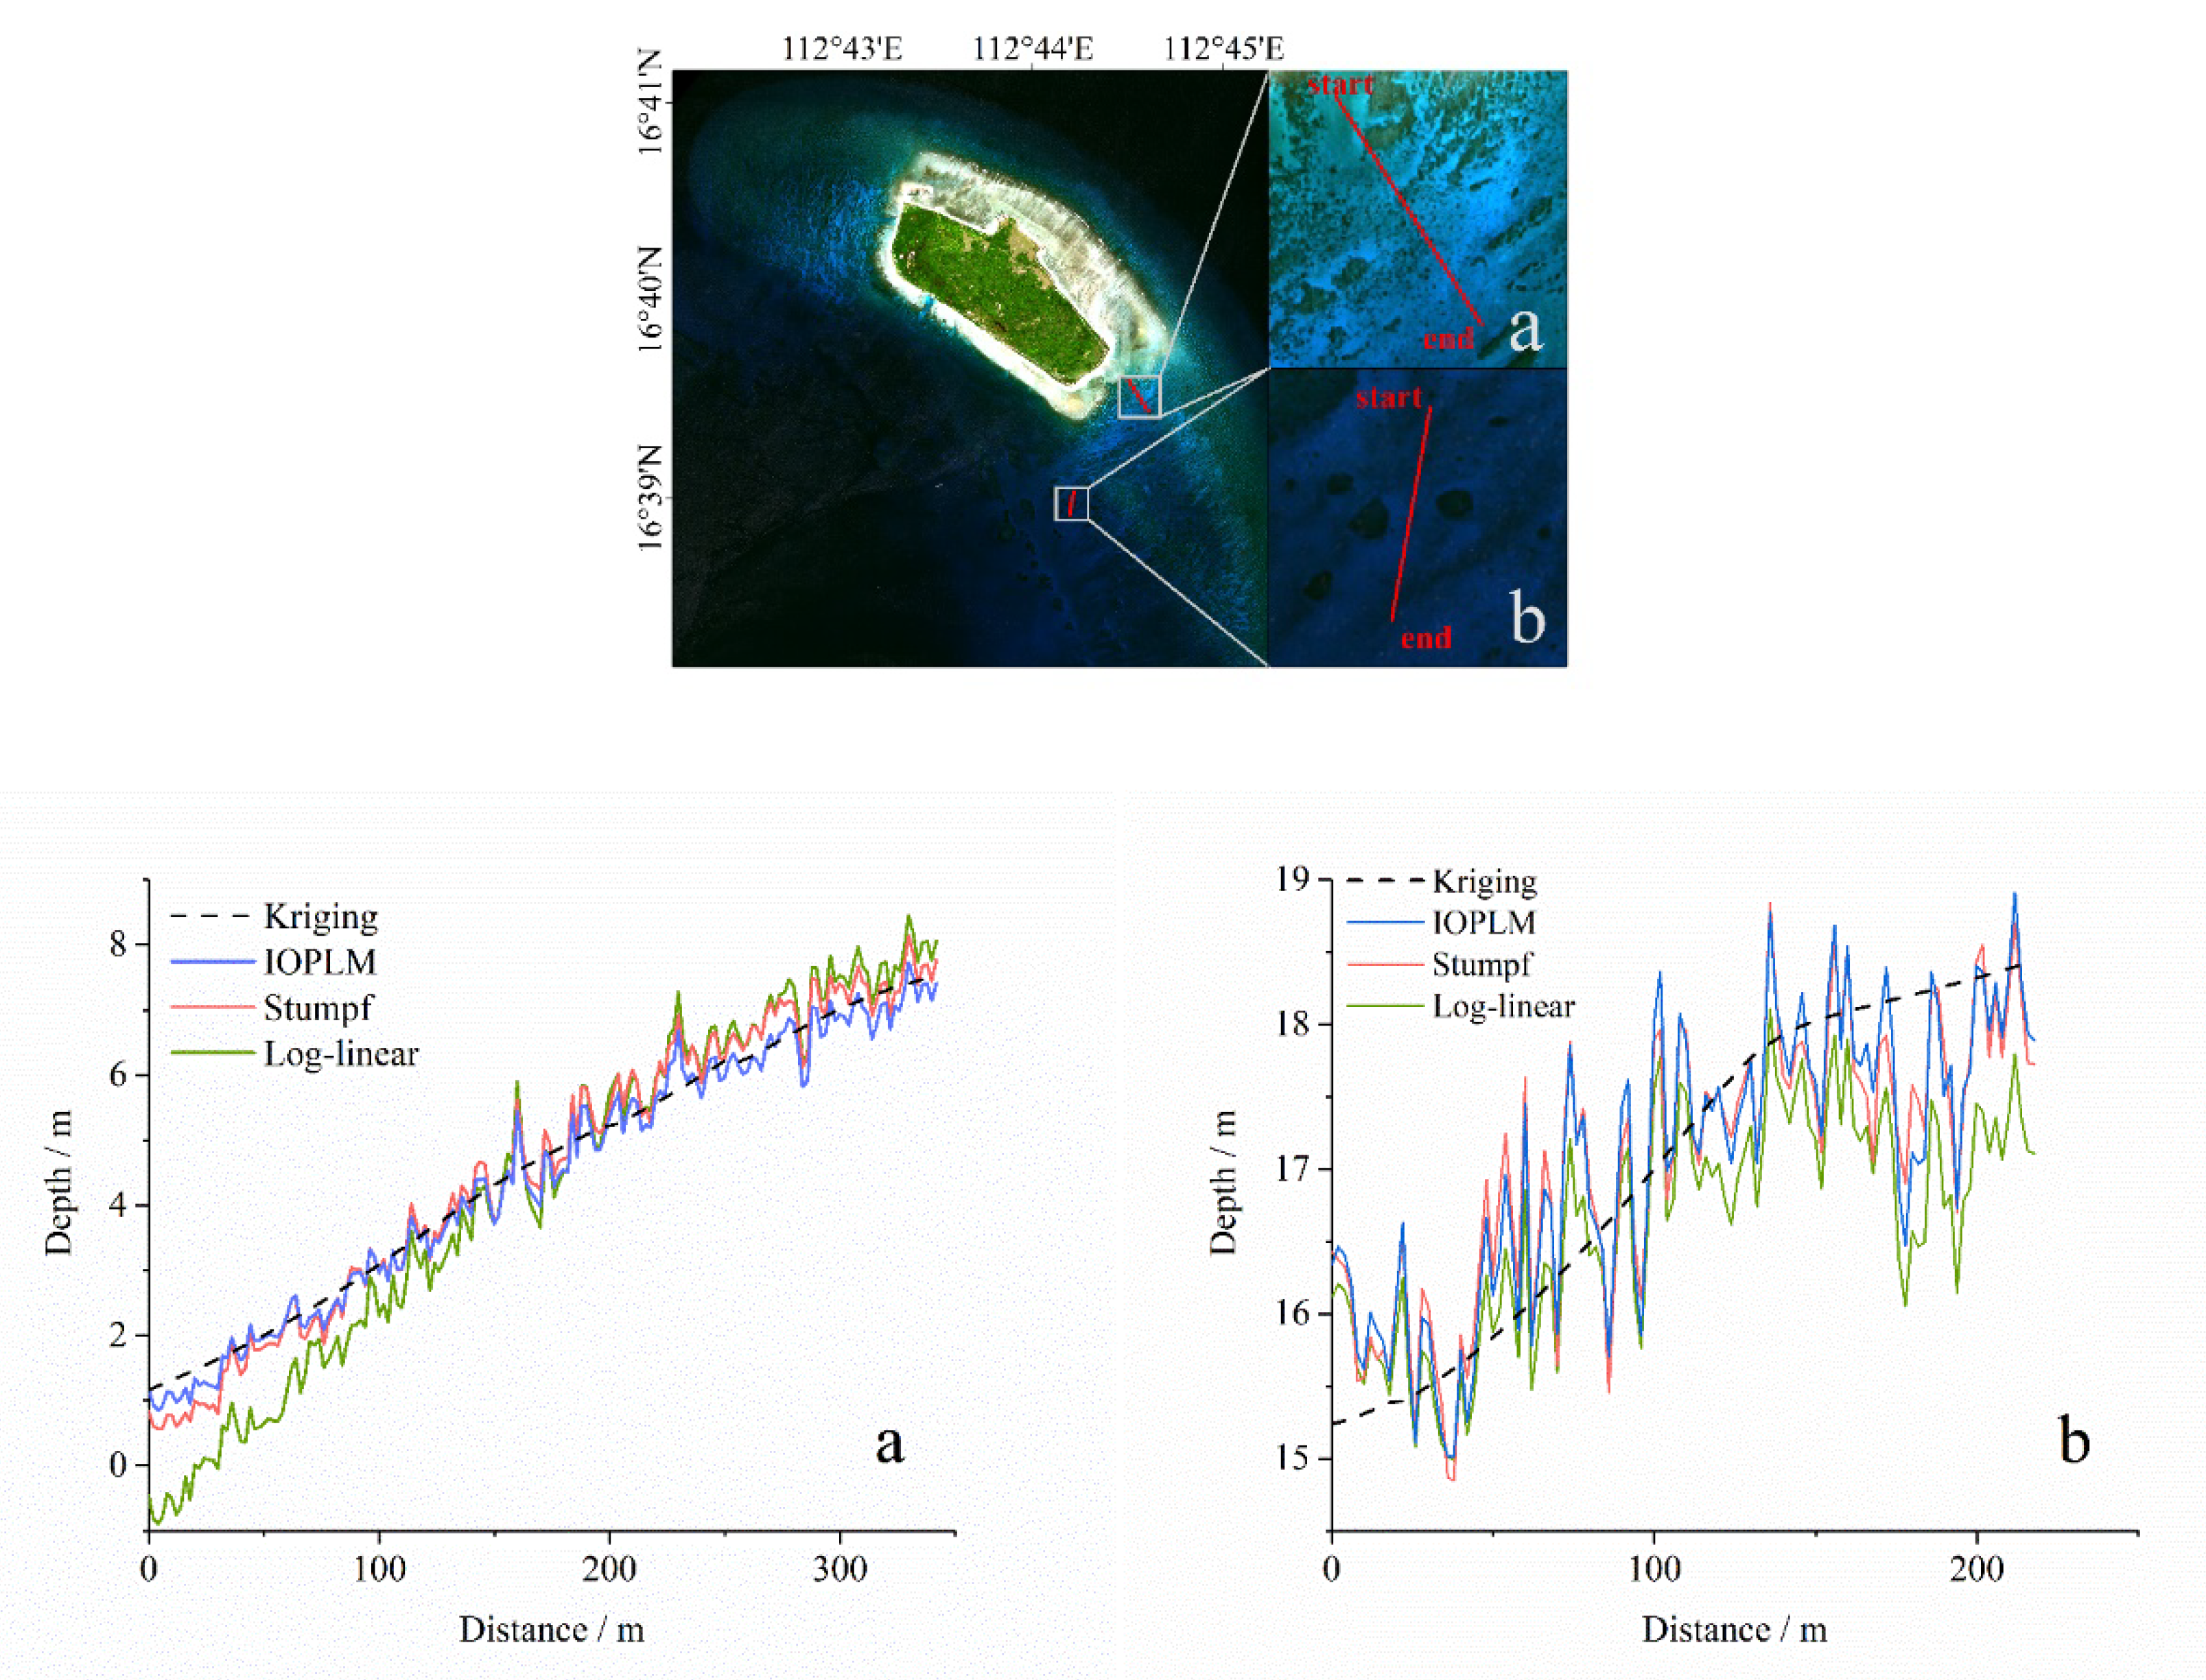
3.2.1. Comparison of Water Depth Profile Results
In Dongdao Island and Saipan Island, two profiles with different water depth are selected (see Figure 10 and Figure 11). The black dotted line is the Kriging interpolation result of the actual water depth, and the blue, green, and red solid lines are the water depth retrieval results obtained by the IOPLM, Stumpf model, and log-linear model, respectively. Figure 10 shows that for Dongdao Island, the variation range of water depth values of the profile (a) increases from approximately 1 m to 8 m. The three models’ variation curves are in good agreement with the actual water depth interpolation results, and they all reflect the increasing trend of water depth values. Among them, the IOPLM is the closest to the Kriging results with the smallest range of changes, while the log-linear model has a larger range of changes than the IOPLM and Stumpf model, especially within the first third of profile (a). The profile (b) of Dongdao Island ranges from 15 m to 19 m. The water depth values of the three models also increase gradually, but the difference between them is larger than the profile (a). The figure shows that the fluctuations of the IOPLM and Stumpf model are basically the same. Although the fluctuation of the log-linear model in the first half of the profile (b) is less than that of the other two models, the results in the latter half are underestimated, thus, the log-linear model is unstable.
In Saipan Island (Figure 11), the water depth variation range of profile (a) is very small, basically about 5 m. The results of the IOPLM and Stumpf model are basically consistent with the actual water depth, and the fluctuation degree of the IOPLM is smaller than that of Stumpf model. However, the result of log-linear model in profile (a) with shallow water depth is very poor, which is quite different from the actual depth values. The profile (b) of Saipan Island ranges from 3 m to 8 m. The estimated water depth value of the IOPLM basically coincides with the actual water depth, and fluctuates around the actual depth within a small range. But the other two models overestimate the water depth in the entire profile (b). Therefore, the retrieval accuracy of the model we proposed performs better than the Stumpf model and the log-linear model for different water depth ranges and topographic characteristics.
3.2.2. Comparison of Accuracy in Different Water Depths
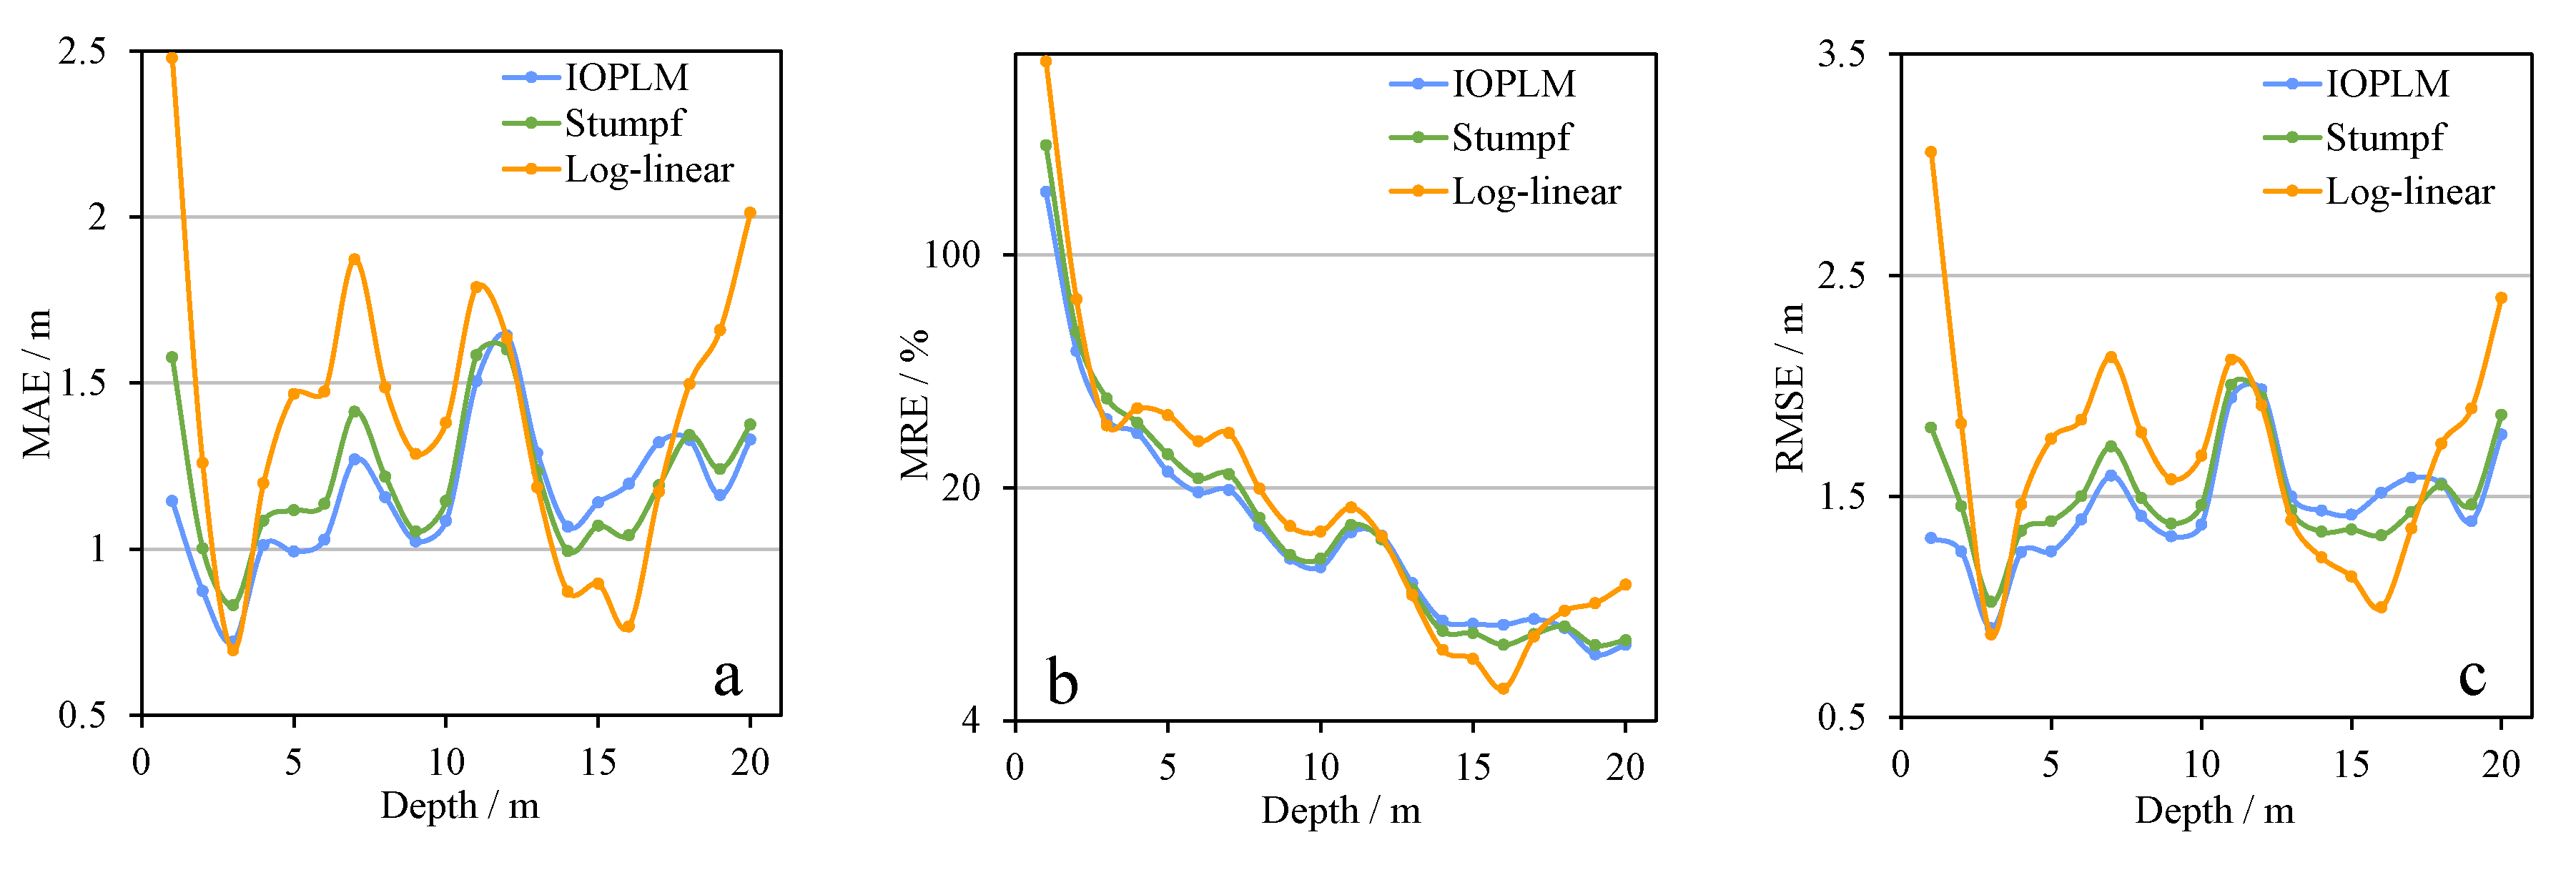
The results of Figure 6 and Figure 7 show that the accuracy of the three models in the various water depths is different. Then, the water depth of 0–20 m is divided into finer water depth segments, that is, the interval is set to 1 m. Three accuracy indexes in 20 water depth sections of the two study areas were calculated (See Figure 12 and Figure 13). In Dongdao Island (Figure 12), the error fluctuation range of IOPLM is small and the model is stable. MAE fluctuates in the range of 0.8 m to 1.3 m, RMSE fluctuates in the range of 1 m to 1.8 m, but the error variation range of Stumpf model and log-linear model is large. With the increases in water depth, MRE shows a decreasing trend. When the water depth is greater than 5 m, the MRE remains within 20% (Figure 12b). The three error indexes show that the accuracy obtained by the IOPLM in most water depth sections is optimal, but only in the range of about 13 m–17 m is slightly higher than that of the other two models.
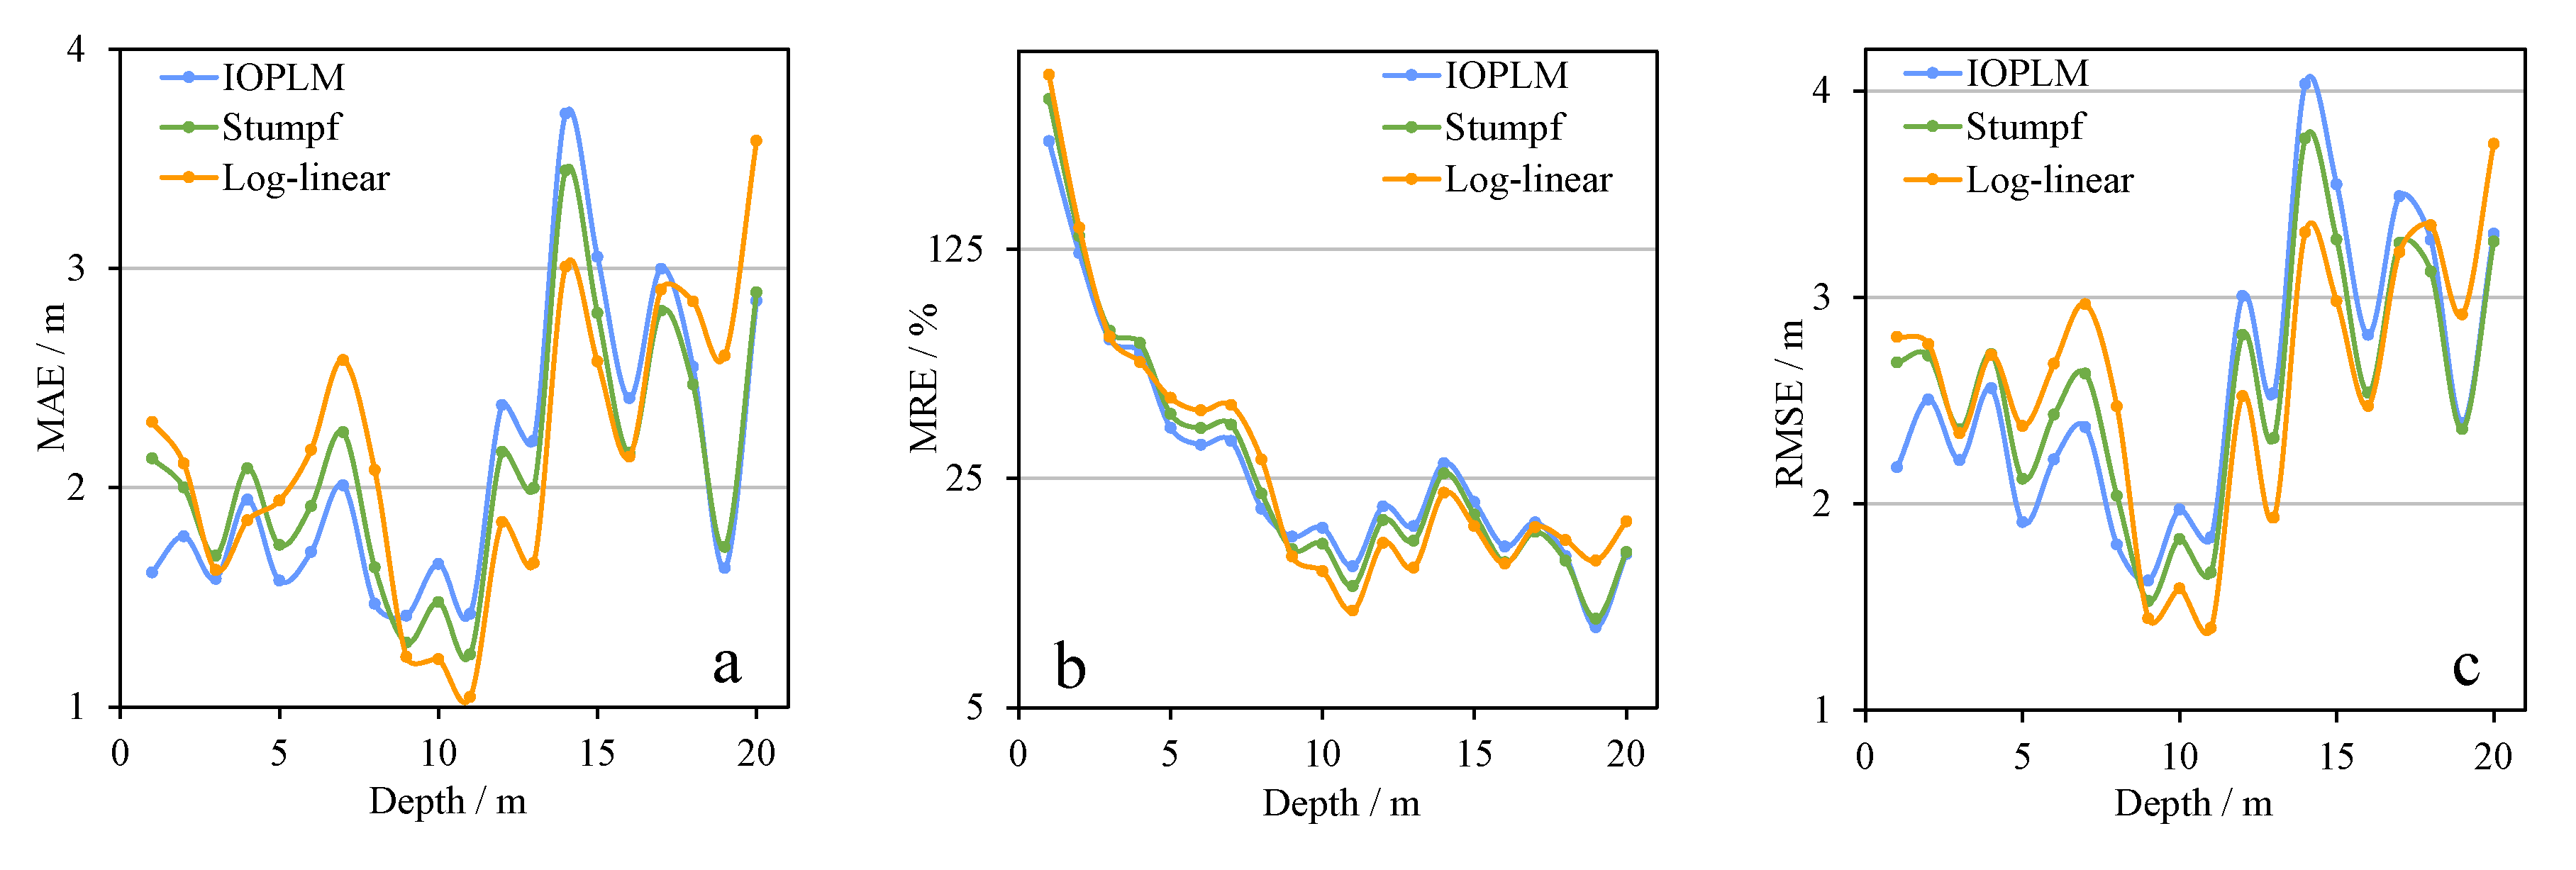
For the study area of Saipan Island (Figure 13), The MAE and RMSE of the three models fluctuate greatly, the MAE is approximately 1.6 m–3.7 m, and the RMSE is about 2.1 m to 4 m. The MRE still shows a decreasing trend, and the water depth value remains within 25% after 7 m (Figure 13b). The error of IOPLM in shallow to medium water depth (0–9 m) and deep water depth (after 18 m) is smaller than that of the other two models. In the remaining water depth, the log-linear model has the best retrieval accuracy. The figures also show the errors for Saipan Island in the depth of 0–5 m are larger than those for Dongdao Island, which may be due to the undulating terrain and irregular topography of Saipan Island, while the sediment of Dongdao Island is relatively uniform. Combined with the above results, for the finer division of water depth, the IOPLM results are still good, and the model is relatively stable. The errors of most water depth segmentations are smaller than that of the Stumpf model and the log-linear model. The inversion accuracy of the proposed model is better improved than the other two traditional models, especially in the shallow to medium water depth sections.
3.2.3. Comparison of Accuracy in Different Sediment Types
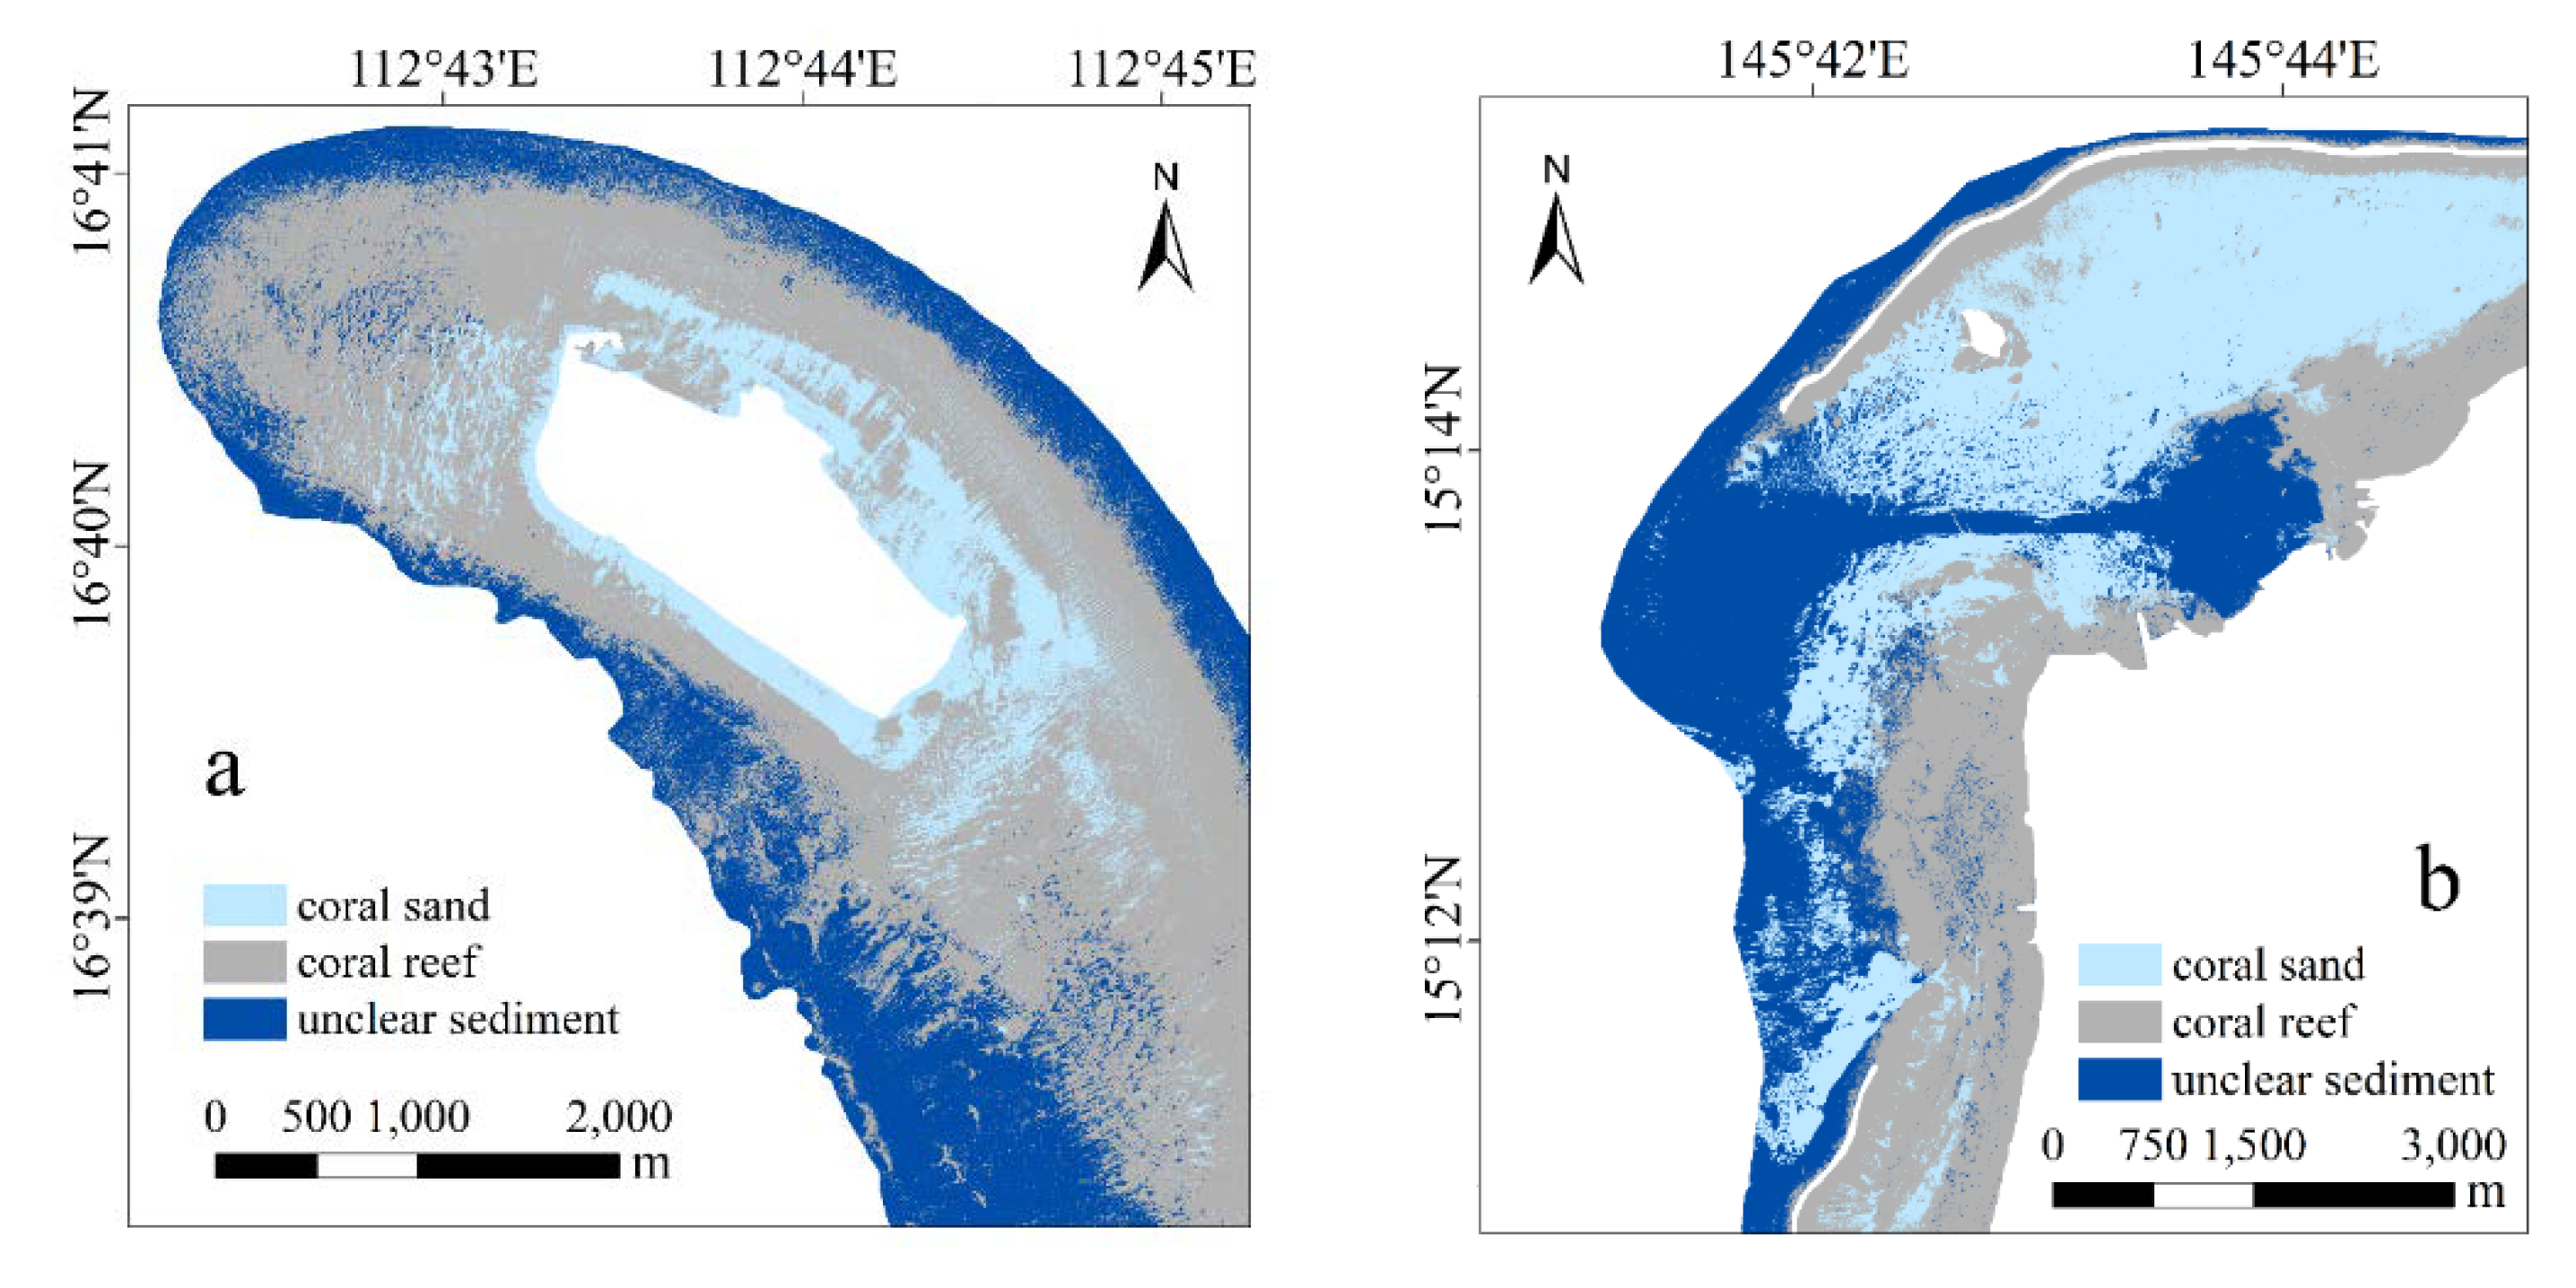
The seabed sediment is often heterogeneous, and the contribution of various bottom sediments to the visible light attenuation coefficient is different. For the areas with complex sediment types, the results of water depth retrieval in different regions are also different. The SVM classification method was attempted to classify the bottom sediments in the study area around Dongdao Island and Saipan Island. The classification results of the two study areas are shown in Figure 14.
The sediment types in the study area can be roughly divided into three types, coral sand, coral reef, and areas with unclear sediment type. In Dongdao Island (Figure 14a), the distribution range of the coral sand is relatively small, and mainly distributed around the island. The unclear sediment is mainly distributed in areas with deep water depth at the edge of the study area. The widest distribution range is the sediment of coral reef, which accounts for more than half of the entire study area. For the study area of Saipan Island (Figure 14b), the distribution range of the coral reef is the smallest, it is mainly around Saipan Island and the northern part of Managaha Island. The areas where the bottom sediment type is unclear are mainly distributed from the central lagoon to the deep water. The sediment type of coral sand has the widest range and is mainly distributed in the northern part of the study area.
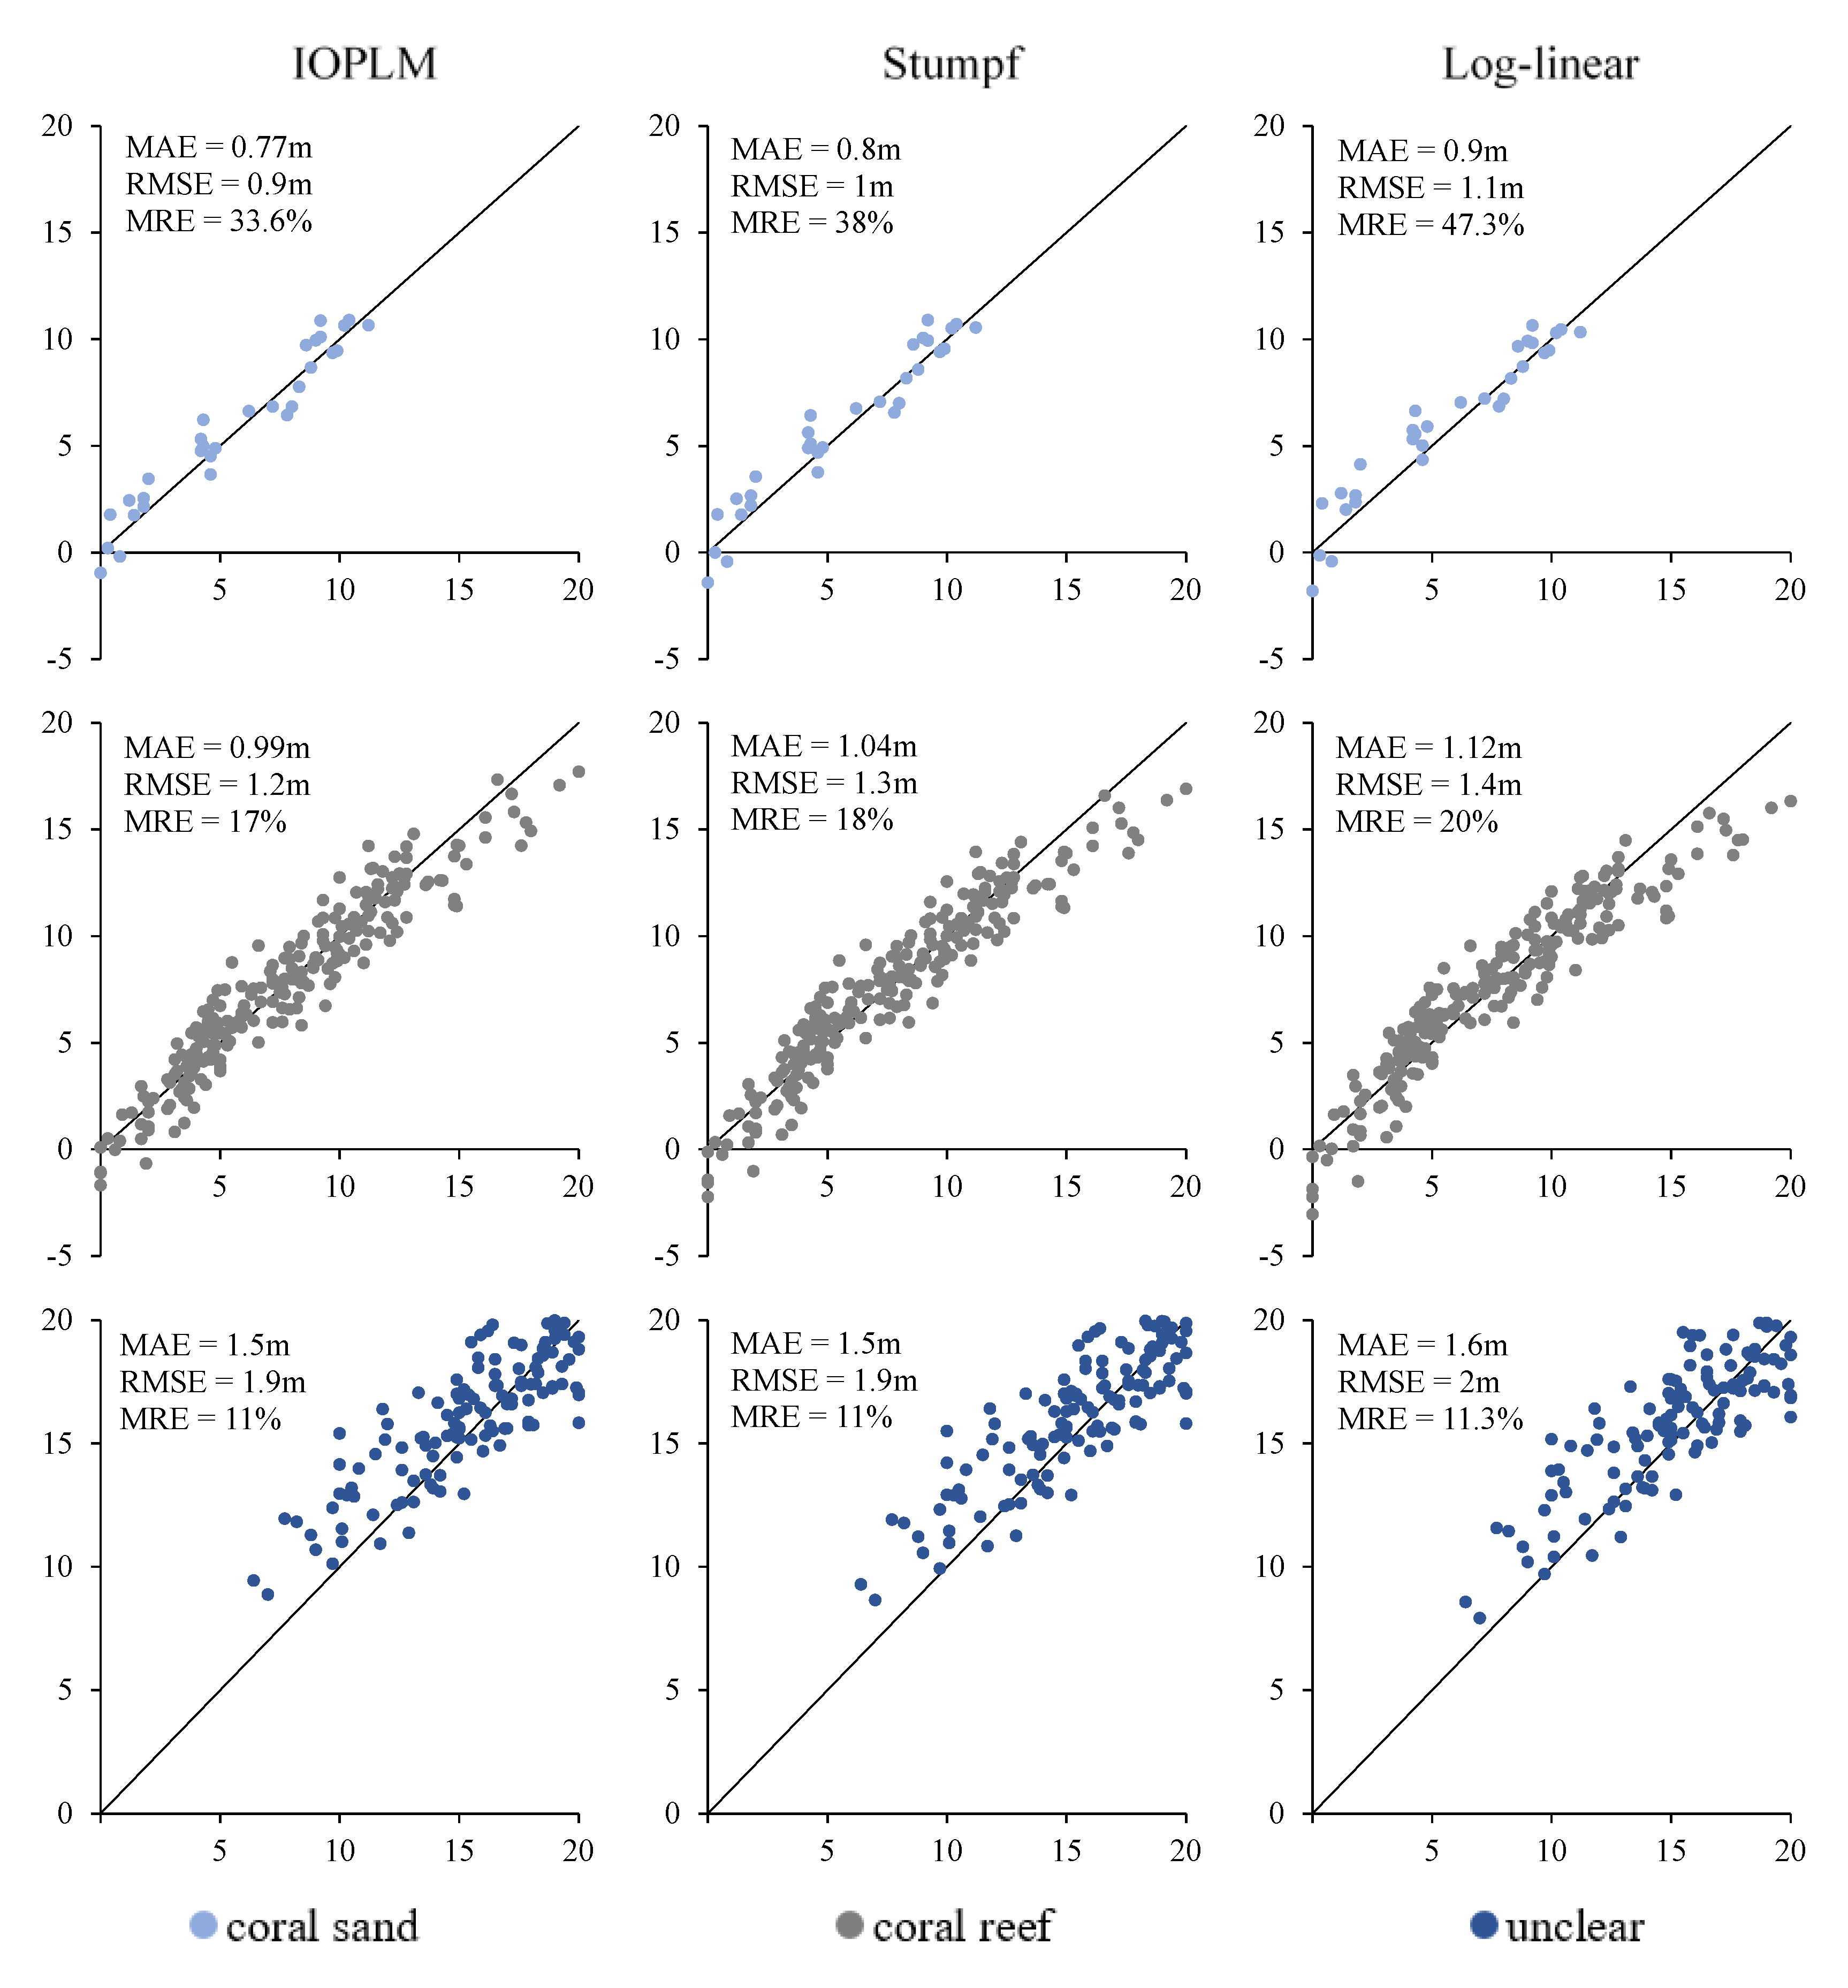
The models of three different types of sediments were established respectively. The retrieval results are shown in Table 2. For the two study areas, the results of different models after classifications have improved. The best overall retrieval result is still the IOPLM. Stumpf model and log-linear model have lower errors after classification, but the IOPLM’s results are not much different from the results without sediment classification. Figure 15 and Figure 16 are scatter plots of the estimated depth and actual depth of the verification points of different sediment types and different models in the two study areas. IOPLM has the lowest error under the most types of sediments. In Dongdao Island (Figure 15), the error of the coral sand sediment is the lowest, which ranges from shallow to medium water depths. The unclear sediment area is in the middle to deep water depths, while the coral reef is basically distributed in the entire 0–20 m water depth. Saipan Island has the least distribution under the type of coral reef, most of which are in shallow water depth. And the scatter point is close to the 1:1 line, however, due to the water depth being shallow, the MRE is quite large. Similar to Dongdao Island study area, the coral sand are mainly distributed in the shallow to medium water depth. As for the area where the sediment type is not clear, the spots are distributed in the entire range of water depth. To sum up, the new model can achieve the same retrieval results as the traditional models before the classification of sediments. Therefore, the model has strong abilities of water depth retrieval in the areas with complex bottom sediment types, and has a wider range of applications.
3.2.4. Comparison of Accuracy with Different Satellites
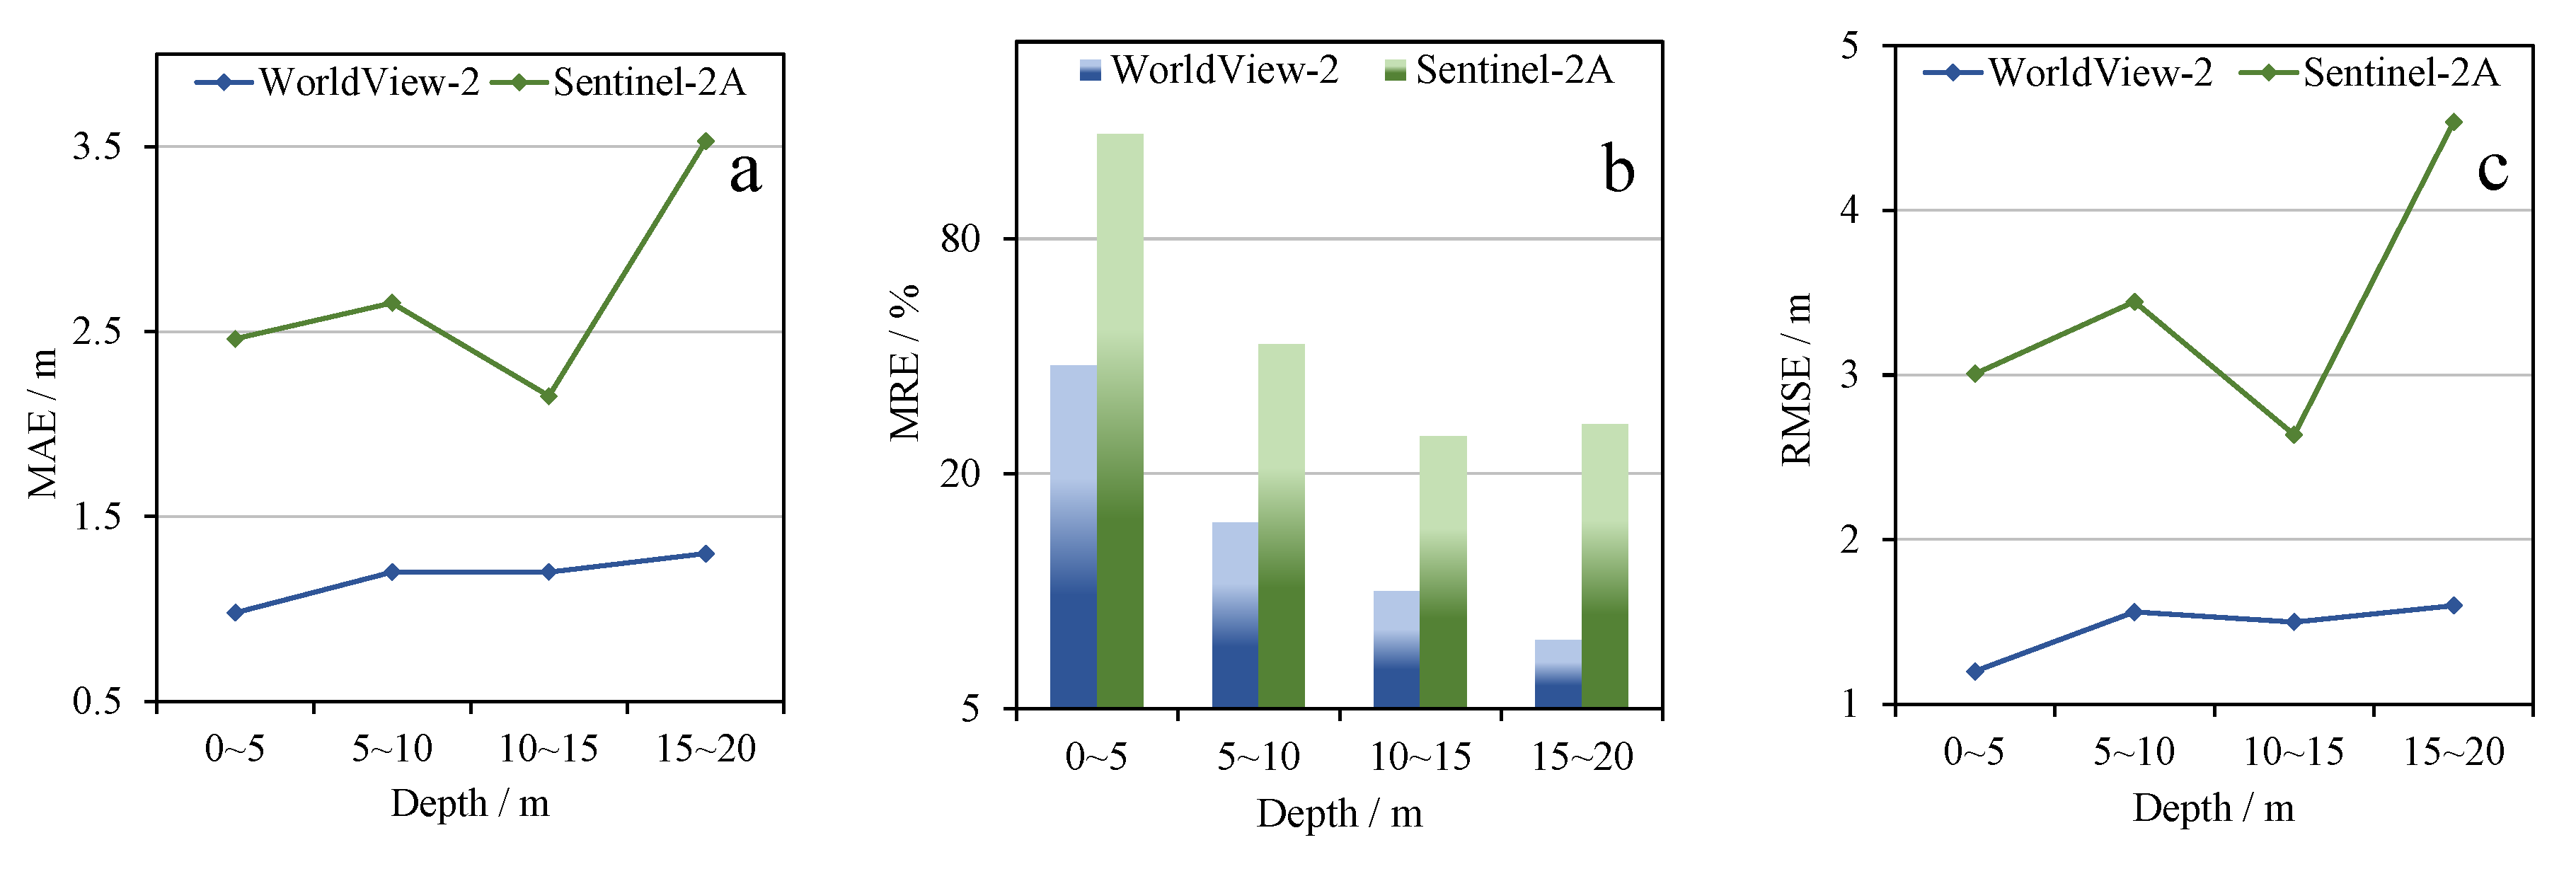
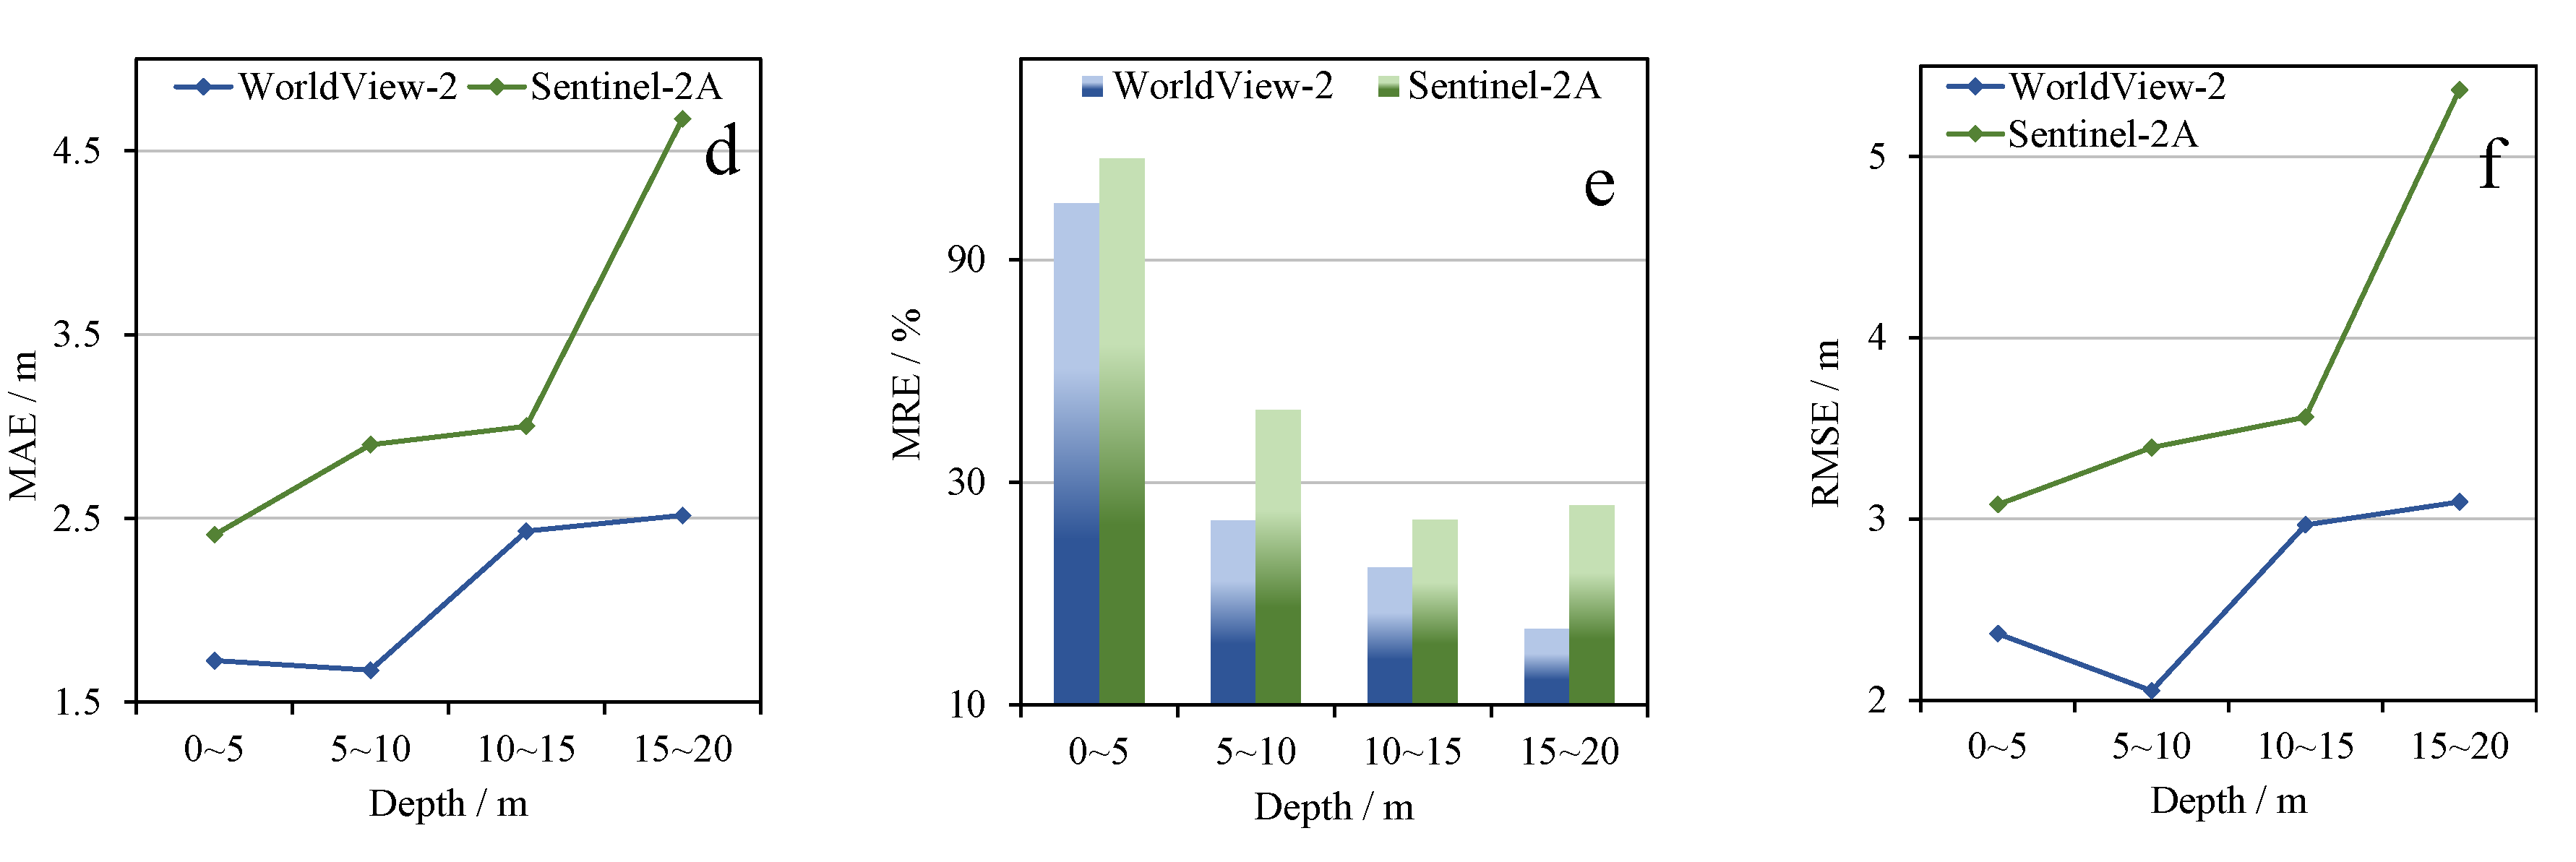
High resolution multispectral satellite images are used for experiments in this paper. To evaluate the performance of the proposed model for different spatial resolution satellites, we used the Sentinel-2A images provided by the European Space Agency (ESA) for experiments. The Sentinel-2A also contains blue and green multispectral bands, which meet the requirements of the new model. Satellite images of the two study areas are shown in Figure 17, and the overall accuracy results are shown in Table 3.
The results show that the accuracy of Sentinel-2A is not as good as WorldView-2 in both study areas (As the study area of Saipan Island contains a few clouds, for the sake of unification, there are some differences in the selection of verification points. Therefore, the WorldView-2 results have changed.). Figure 18 shows the accuracy at different water depth sections (interval of 5 m). In comparison, the Sentinel-2A satellite has a relatively weak retrieval capability. The error of Sentinel-2A is larger than that of WorldView-2, and the maximum differences of MAE and RMSE between two different satellites are close to 2 m.
4. Discussion
Based on the WorldView-2 high resolution multispectral images, a new empirical model for shallow water depth bathymetry is proposed. Similarly, many other methods have also been developed using WorldView-2 data, such as a two-media photogrammetry technique for WorldView-2 stereo multispectral imagery proposed by Cao et al. [35]. The research areas selected in the article are also located in the Paracel Islands (Zhaoshu Island and Ganquan Island) in the South China Sea. In the water depth ranges of 5–20 m, the MRE is about 17% and 14%, and the RMSE is 2.09 m and 1.76 m, respectively. The accuracy is similar to the results of Dongdao Island, but it does not include waters of 0–5 m depths, which relative errors in this section are fairly high. Besides, our study uses a variety of perspectives to evaluate the model, and diversified comparison aspects can better prove the accuracy and stability of the model. Other scholars have used different ways to analyze the accuracy of different models. For example, Hamylton et al. [36] calculated the difference between the modeled water depth and the measured water depth. Then, they drew the geographical distributions map of model residuals, and calculated the spatial autocorrelation. As a novel way of comparing different models, this technique has also achieved satisfactory results.
In this study, there is a difference between the acquisition date of satellite images and the actual water depth data in the two study areas, which is about one year for Dongdao Island and six years for Saipan Island. This difference may cause an impact on the accuracy of shallow water bathymetry. However, the study area of Dongdao Island is inaccessible, and the time difference between the actual water depth and the image is short, so the impact is quite small. The time difference of Saipan Island is relatively long, but the electronic chart data is generally updated once every three years, and most of the updated contents are light beacons, navigation reference landmarks. Natural features such as water depth and topography remain unchanged for many years. Actually, the shorter the time difference of the satellite images and the actual water depth, the more beneficial it is for the water depth retrieval research.
In addition, for the coastal shallow water areas of the two islands, the scatter plots both show some negative water depth values (see Figure 6, Figure 7, Figure 15 and Figure 16). Optical remote sensing of bathymetry is based on the correlation between brightness or reflectance values and water depths, so the values have a considerable influence on water depth. In addition, because of the different reflectance of the sediments, the situation of positive or negative water depth value situation will also occur. This result is similar to the conclusions of previous researchers [37,38]. In the very shallow offshore waters, a negative water depth may be estimated. In our study, there are few points with negative water depth estimates for Dongdao Island, and they are basically distributed within 0–2 m. After the classification, it was found that the sediment type is coral reef or coral sand, and the area with unclear sediment type has no negative value. There are relatively more negative water depth points in Saipan Island, roughly between the depths of 0–3 m. It was found that most of them are located in the unclear sediment type, that is, in the lagoon on the west side of the island. The sediment is not obvious and the bottom signal is weak, resulting in negative water depth values. There is a small amount of negative values distributed in the coral reef sediment type, while the sediment type of coral sand shows none. However, it is shown that the IOPLM produces less negative water depth values than the other two models. Therefore, for different study areas, topographic changes and differences in the distribution of sediment types will have varying degrees of impact on the estimation of water depth, which needs further study.
Furthermore, the number of training water depth points may also affect the accuracy of the water depth retrieval results. By expanding the number of training points to about four times and 10 times, the three accuracy indexes result of the different models are shown in Figure 19. The results show that when the number of training points increases, the accuracy of each model is slightly improved or basically the same. Early studies have shown that as long as the training points are distributed in space and in different water depth sections, the retrieval accuracy obtained by a small number of water depth control points tends to be stable. And if too many training points are selected, the retrieval accuracy may decrease [39]. Therefore, the accuracy results of water depth retrieval using a small number of training points in this study are reliable, and the proposed model is also applicable to the regions that lacking actual water depth data.
Satellite spatial resolution is also an important factor that affects shallow water bathymetry. We compared the accuracy of WorldView-2 and Sentinel-2A (see Figure 18), which have different spatial resolutions. Satellites with high spatial resolution have better inversion capabilities, the reasons mainly include that (1) Sentinel-2A, with the resolution of 10 m, may not show areas with relatively drastic water depths and topographical fluctuations. And the proposed model may be more suitable for satellite with higher resolution. Also, (2) the image quality is not ideal; there are a few solar flares on the sea surface. (3) Although both satellites contain blue and green bands, the ranges of wavelength are different.
5. Conclusions
In this study, we used the blue and green bands of WorldView-2 to develop an inherent optical parameters linear model. Then, water depth retrieval experiments were carried out in Dongdao Island and Saipan Island. Compared with the traditional empirical model, the log-linear model and the Stumpf logarithmic ratio model, the retrieval abilities and applicability of the new model were explored.
The results show that the overall retrieval results of the IOPLM are the best for two different study areas. The MAE, RMSE and MRE of Dongdao Island are 1.17 m, 1.49 m and 17.5%, respectively. The Saipan Island’s results are inferior to those for Dongdao Island, the MAE is 1.92 m, the RMSE is 2.4 m, and the MRE is 45%. The reason for the high MRE is that the range of the shallow water depth area of Saipan Island is extensive. And the water depth is quite shallow, resulting in a relatively high MRE. The comparison of the accuracy results shows that the IOPLM performs well in most of the different water depth sections, especially when the water depth is shallow. The comparisons, in the two areas studied, with the traditional log-linear model and the Stumpf model show that in terms of overall accuracy and accuracy in different water depths, the IOPLM has slightly better results and stronger retrieval capabilities than the other models. In addition, the water depth scatter plots, the comparison with the difference between the Kriging interpolation results and the water depth profile results also reflect the superior water depth retrieval capabilities of the proposed model.
Author Contributions
Y.M. provided the conceptualization and revised the manuscript. X.Z. developed the methodology, performed the experiments and analysis, and wrote the manuscript. J.Z. revised the manuscript. All authors have read and agreed to the published version of the manuscript.
Funding
This research was funded by National Key Research and Development Program of China (2016YFC1402701) and National Natural Science Foundation of China (51839002 and 41906158).
Acknowledgments
We gratefully acknowledge the Chinese National Programs for High Technology Research and Development (863 Program) that provided the actual water depth data for Dongdao Island. Furthermore, we gratefully acknowledge the European Space Agency (ESA) for Provid. the Sentinel-2 productions.
Conflicts of Interest
The authors declare no conflict of interest.
References
- Goodman, J.A.; Lay, M.; Ramirez, L.; Ustin, S.J.; Haverkamp, P.J. Confidence Levels, Sensitivity, and the Role of Bathymetry in Coral Reef Remote Sensing. Remote Sens. 2020, 12, 496. [Google Scholar] [CrossRef] [Green Version]
- Naik, M.; Ranade, G.; Lohani, R.B. Underwater Sonar Systems: A Methodology to Generate Bathymetry and Sub-strata Data. Int. J. Comput. Appl. 2017, 170, 1–5. [Google Scholar] [CrossRef]
- Irish, J.L.; White, T.E. Coastal engineering applications of high-resolution lidar bathymetry. Coast. Eng. 1998, 35, 47–71. [Google Scholar] [CrossRef]
- Klemas, V. Beach Profiling and LIDAR Bathymetry: An Overview with Case Studies. J. Coast. Res. 2011, 27, 1019–1028. [Google Scholar] [CrossRef]
- Yeu, Y.; Yee, J.; Yun, H.S.; Kim, K.B. Evaluation of the Accuracy of Bathymetry on the Nearshore Coastlines of Western Korea from Satellite Altimetry, Multi-Beam, and Airborne Bathymetric LiDAR. Sensors 2018, 18, 2926. [Google Scholar] [CrossRef] [Green Version]
- Hu, L.; Liu, Z.; Liu, Z.; Hu, C.; He, M. Mapping bottom depth and albedo in coastal waters of the South China Sea islands and reefs using Landsat TM and ETM+ data. Int. J. Remote Sens. 2014, 35, 4156–4172. [Google Scholar] [CrossRef]
- Eugenio, F.; Marcello, J.; Martin, J. High-Resolution Maps of Bathymetry and Benthic Habitats in Shallow-Water Environments Using Multispectral Remote Sensing Imagery. IEEE Trans. Geosci. Remote Sens. 2015, 53, 3539–3549. [Google Scholar] [CrossRef]
- Mavraeidopoulos, A.K.; Oikonomou, E.; Palikaris, A.; Poulos, S. A Hybrid Bio-Optical Transformation for Satellite Bathymetry Modeling Using Sentinel-2 Imagery. Remote Sens. 2019, 11, 2746. [Google Scholar] [CrossRef] [Green Version]
- Ma, Y.; Zhang, J.; Zhang, J.; Zhang, Z.; Wang, J. Progress in Shallow Water Depth Mapping From Optical Remote Sensing. Adv. Mar. Sci. 2018, 36, 331–351. [Google Scholar]
- Figueiredo, I.N.; Pinto, L.; Goncalves, G. A modified Lyzenga’s model for multispectral bathymetry using Tikhonov regularization. IEEE Geosci. Remote Sens. Lett. 2016, 13, 53–57. [Google Scholar] [CrossRef]
- Pacheco, A.; Horta, J.; Loureiro, C.; Ferreira, O. Retrieval of nearshore bathymetry from Landsat 8 images: A tool for coastal monitoring in shallow waters. Remote Sens. Environ. 2015, 159, 102–116. [Google Scholar] [CrossRef] [Green Version]
- Lyzenga D, R. Passive remote sensing techniques for mapping water depth and bottom features. Appl. Opt. 1978, 17, 379–383. [Google Scholar] [CrossRef] [PubMed]
- Papedes, J.M.; Spero, R.E. Water depth mapping from passive remote sensing data under a generalized ratio assumption. Appl. Opt. 1983, 22, 1134–1135. [Google Scholar] [CrossRef] [PubMed]
- Stumpf, R.P.; Holderied, K.; Sinclair, M. Determination of water depth with high-resolution satellite imagery over variable bottom types. Limnol. Oceanogr. 2003, 48, 547–556. [Google Scholar] [CrossRef]
- Wang, Y.; Zhou, X.; Li, C.; Chen, Y.; Yang, L. Bathymetry Model Based on Spectral and Spatial Multifeatures of Remote Sensing Image. IEEE Geosci. Remote Sens. Lett. 2020, 17, 37–41. [Google Scholar] [CrossRef]
- Sagawa, T.; Yamashita, Y.; Okumura, T.; Yamanokuchi, T. Satellite Derived Bathymetry Using Machine Learning and Multi-Temporal Satellite Images. Remote Sens. 2019, 11, 1155. [Google Scholar] [CrossRef] [Green Version]
- Misra, A.; Vojinovic, Z.; Ramakrishnan, B.; Luijendijk, A.; Ranasinghe, R. Shallow water bathymetry mapping using Support Vector Machine (SVM) technique and multispectral imagery. Int. J. Remote Sens. 2018, 1–20. [Google Scholar] [CrossRef]
- Li, J.; Knapp, D.E.; Schill, S.R.; Roelfsema, C.; Phinn, S.; Silman, M.; Mascaro, J.; Asner, G.P. Adaptive bathymetry estimation for shallow coastal waters using Planet Dove satellites. Remote Sens. Environ. 2019, 232, 11032. [Google Scholar] [CrossRef]
- Chen, B.; Yang, Y.; Xu, D.; Huang, E. A dual band algorithm for shallow water depth retrieval from high spatial resolution imagery with no ground truth. ISPRS J. Photogramm. Remote Sens. 2019, 151, 1–13. [Google Scholar] [CrossRef]
- Liu, Y.; Deng, R.; Qin, Y.; Cao, B.; Liang, Y.; Liu, Y.; Tian, J.; Wang, S. Rapid estimation of bathymetry from multispectral imagery without in situ bathymetry data. Appl. Opt. 2019, 58, 7538–7551. [Google Scholar] [CrossRef]
- Asner, G.P.; Vaughn, N.R.; Balzotti, C.; Brodrick, P.G.; Heckler, J. High-Resolution Reef Bathymetry and Coral Habitat Complexity from Airborne Imaging Spectroscopy. Remote Sens. 2020, 12, 310. [Google Scholar] [CrossRef] [Green Version]
- Gordon, H.R.; Brown, O.B.; Evans, R.H. A semianalytic radiance model of ocean color. J. Geophy. Res. 1988, 10909–10924. [Google Scholar] [CrossRef]
- Lee, Z.; Carder, K.L.; Mobley, C.D.; Steward, R.G.; Patch, J.S. Hyperspectral remote sensing for shallow waters. 2. Deriving bottom depths and water properties by optimization. Appl. Opt. 1999, 38, 3831–3843. [Google Scholar] [CrossRef] [PubMed] [Green Version]
- Lee, Z.; Carder, K.L.; Arnone, R.A. Deriving inherent optical properties from water color: A multiband quasi-analytical algorithm for optically deep waters. Appl. Opt. 2002, 41, 5755–5772. [Google Scholar] [CrossRef]
- Barnes, B.B.; Hu, C.; Schaeffer, B.A.; Lee, Z.; Palandro, D.A.; Lehrter, J.C. MODIS-derived spatiotemporal water clarity patterns in optically shallow Florida Keys waters: A new approach to remove bottom contamination. Remote Sens. Environ. 2013, 134, 377–391. [Google Scholar] [CrossRef] [Green Version]
- Reports of the International Ocean-Colour Coordinating Group. Remote Sensing of Inherent Optical Properties: Fundamentals, Tests of Algorithms, and Applications. IOCCG. 2006. Available online: http://www.ioccg.org/reports/report5.pdf (accessed on 16 September 2020).
- Le, N.D.; Zidek, J.V. Statistical Analysis of Environmental Space-Time Processes, 3rd ed.; Springer Science & Business Media: New York, NY, USA, 2006; pp. 101–134. [Google Scholar]
- Aguilar, F.J.; Agüera, F.; Aguilar, M.A.; Carvajal, F. Effects of terrain morphology, sampling density, and interpolation methods on grid DEM accuracy. Photogramm. Eng. Remote Sens. 2005, 71, 805–816. [Google Scholar] [CrossRef] [Green Version]
- Amante, C.J.; Eakins, B.W. Accuracy of Interpolated Bathymetry in Digital Elevation Models. J. Coast. Res. 2005, 76, 123–133. [Google Scholar] [CrossRef] [Green Version]
- Erdogan, S. A comparison of interpolation methods for producing digital elevation models at the field scale. Earth Surf. Process. Landf. 2009, 34, 366–376. [Google Scholar] [CrossRef]
- Erdogan, S. Modelling the spatial distribution of DEM error with geographically weighted regression: An experimental study. Comput. Geosci. 2010, 36, 34–43. [Google Scholar] [CrossRef]
- Guo, Q.; Li, W.; Yu, H.; Alvarez, O. Effects of topographic variability and lidar sampling density on several DEM interpolation methods. Photogramm. Eng. Remote Sens. 2010, 76, 701–712. [Google Scholar] [CrossRef] [Green Version]
- Vapnik, V. Statistical Learning Theory, 3rd ed.; Wiley: New York, NY, USA, 1998. [Google Scholar]
- Fauvel, M.; Benediktsson, J.A.; Chanussot, J.; Sveinsson, J.R. Spectral and Spatial Classification of Hyperspectral Data Using SVMs and Morphological Profiles. IEEE Trans. Geosci. Remote Sens. 2008, 46, 3804–3814. [Google Scholar] [CrossRef] [Green Version]
- Cao, B.; Fang, Y.; Jiang, Z.; Gao, L.; Hu, H. Shallow water bathymetry from WorldView-2 stereo imagery using two-media photogrammetry. Eur. J. Remote Sens. 2019, 52, 506–521. [Google Scholar] [CrossRef] [Green Version]
- Hamylton, S.M.; Hedley, J.; Beaman, R.J. Derivation of High-Resolution Bathymetry from Multispectral Satellite Imagery: A Comparison of Empirical and Optimisation Methods through Geographical Error Analysis. Remote Sens. 2015, 7, 16257–16273. [Google Scholar] [CrossRef] [Green Version]
- Vahtmäe, E.; Kutser, T. Airborne Mapping of Shallow Water Bathymetry in the Optically Complex Waters of the Baltic Sea. J. Appl. Remote Sens. 2016, 10, 025012. [Google Scholar] [CrossRef]
- Casal, G.; Monteys, X.; Hedley, J.; Harris, P.; Cahalane, C.; McCarthy, T. Assessment of empirical algorithms for bathymetry extraction using Sentinel-2 data. Int. J. Remote Sens. 2019, 40, 2855–2879. [Google Scholar] [CrossRef]
- Liang, J.; Zhang, J.; Ma, Y. Analysis of the influence of the amount and proportion of control points and check points on the accuracy of bathymetry re-mote sensing inversion. Mar. Sci. 2015, 39, 15–19. [Google Scholar]
Figure 1.
WorldView-2 Satellite images of the study areas and the distribution of actual water depth points. (a) Dongdao Island. (b) Saipan Island.
Figure 1.
WorldView-2 Satellite images of the study areas and the distribution of actual water depth points. (a) Dongdao Island. (b) Saipan Island.

Figure 2.
(a) Satellite images and actual water depth points. (b) Scatter plot between actual water depth and the ratio of inherent optical parameters for different types of sediment.
Figure 2.
(a) Satellite images and actual water depth points. (b) Scatter plot between actual water depth and the ratio of inherent optical parameters for different types of sediment.

Figure 3.
The IOPLM fitting scatter plots between the ratio of the inherent optical parameters and the water depth in different study areas. (a) Dongdao Island. (b) Saipan Island.
Figure 3.
The IOPLM fitting scatter plots between the ratio of the inherent optical parameters and the water depth in different study areas. (a) Dongdao Island. (b) Saipan Island.

Figure 4.
Water depth retrieval map derived from the IOPLM of Dongdao Island.

Figure 5.
Water depth retrieval map derived from the IOPLM of Saipan Island.

Figure 6.
Scatter plots of estimated water depth and actual water depth of different models for Dongdao Island: (a) the IOPLM; (b) the Stumpf model; (c) the log-linear model. (the black line is 1:1 line).
Figure 6.
Scatter plots of estimated water depth and actual water depth of different models for Dongdao Island: (a) the IOPLM; (b) the Stumpf model; (c) the log-linear model. (the black line is 1:1 line).

Figure 7.
Scatter plots of estimated water depth and actual water depth of different models for Saipan Island: (a) the IOPLM; (b) the Stumpf model; (c) the log-linear model. (the black line is 1:1 line).
Figure 7.
Scatter plots of estimated water depth and actual water depth of different models for Saipan Island: (a) the IOPLM; (b) the Stumpf model; (c) the log-linear model. (the black line is 1:1 line).

Figure 8.
The difference between the results of different models and the Kriging interpolation for Dongdao Island. (a) IOPLM. (b) Stumpf Model. (c) Log-linear Model.
Figure 8.
The difference between the results of different models and the Kriging interpolation for Dongdao Island. (a) IOPLM. (b) Stumpf Model. (c) Log-linear Model.

Figure 9.
The difference between the results of different models and the Kriging interpolation for Saipan Island. (a) IOPLM. (b) Stumpf Model. (c) Log-linear Model.
Figure 9.
The difference between the results of different models and the Kriging interpolation for Saipan Island. (a) IOPLM. (b) Stumpf Model. (c) Log-linear Model.

Figure 10.
The results of different water depth profiles of different models for Dongdao Island. (a) Profile a. (b) Profile b.
Figure 10.
The results of different water depth profiles of different models for Dongdao Island. (a) Profile a. (b) Profile b.

Figure 11.
The results of different water depth profiles of different models for Saipan Island. (a) Profile a. (b) Profile b.
Figure 11.
The results of different water depth profiles of different models for Saipan Island. (a) Profile a. (b) Profile b.

Figure 12.
Accuracy at different water depths in Dongdao Island (interval of 1 m): (a) MAE; (b) MRE; (c) RMSE.
Figure 12.
Accuracy at different water depths in Dongdao Island (interval of 1 m): (a) MAE; (b) MRE; (c) RMSE.

Figure 13.
Accuracy at different water depths in Saipan Island (interval of 1 m): (a) MAE; (b) MRE; (c) RMSE.
Figure 13.
Accuracy at different water depths in Saipan Island (interval of 1 m): (a) MAE; (b) MRE; (c) RMSE.

Figure 14.
Classification results in the two study areas, and different colors represent different types of sediment. (a) Dongdao Island. (b) Saipan Island.
Figure 14.
Classification results in the two study areas, and different colors represent different types of sediment. (a) Dongdao Island. (b) Saipan Island.

Figure 15.
Scatter plots of the estimated depth (vertical axis, unit: m) and actual depth (horizontal axis, unit: m) of different sediment types of Dongdao Island. The three columns from left to right are the IOPLM, the Stumpf Model and the Log-linear model. The dots with different colors represent different types of sediment, and the black line is a 1:1 line.

Figure 16.
Scatter plots of the estimated depth (vertical axis, unit: m) and actual depth (horizontal axis, unit: m) of different sediment types of Saipan Island. The three columns from left to right are the IOPLM, the Stumpf Model and the Log-linear model. The dots with different colors represent different types of sediment, and the black line is a 1:1 line.

Figure 17.
Sentinel-2A images of study areas (the acquisition time of Dongdao Island is 21 December 2019; the acquisition time of Saipan Island is 17 April 2020). (a) Dongdao Island. (b) Saipan Island.
Figure 17.
Sentinel-2A images of study areas (the acquisition time of Dongdao Island is 21 December 2019; the acquisition time of Saipan Island is 17 April 2020). (a) Dongdao Island. (b) Saipan Island.

Figure 18.
Accuracy of two satellites at different water depths (interval of 5 m) in Dongdao Island: (a) MAE; (b) MRE; (c) RMSE; in Saipan Island: (d) MAE; (e) MRE; (f) RMSE.
Figure 18.
Accuracy of two satellites at different water depths (interval of 5 m) in Dongdao Island: (a) MAE; (b) MRE; (c) RMSE; in Saipan Island: (d) MAE; (e) MRE; (f) RMSE.


Figure 19.
Accuracy of different numbers of training points in three models; the different colors represent different numbers of training points.
Figure 19.
Accuracy of different numbers of training points in three models; the different colors represent different numbers of training points.


Table 1.
Regression parameters of different models.
| Study Area | Model | Parameters | R2 | ||
|---|---|---|---|---|---|
| Dongdao Island | IOPLM | = 31.734 | = −30.729 | 0.963 | |
| Log-linear | = 20.844 | = −23.051 | = 15.233 | 0.92 | |
| Stumpf | = 83.69 | = −82.869 | 0.95 | ||
| Saipan Island | IOPLM | = 25.898 | = −20.507 | 0.94 | |
| Log-linear | = 16.426 | = −17.478 | = 12.605 | 0.89 | |
| Stumpf | = 64.093 | = −58.499 | 0.93 | ||
Table 2.
Evaluation of overall accuracy of different models after classification.
| Study Areas | Model | MAE (m) | MRE (%) | RMSE (m) |
|---|---|---|---|---|
| Dongdao Island | IOPLM | 1.15 | 16 | 1.49 |
| Stumpf | 1.17 | 17 | 1.51 | |
| Log-linear | 1.26 | 19.1 | 1.6 | |
| Saipan Island | IOPLM | 1.8 | 39 | 2.3 |
| Stumpf | 1.8 | 41 | 2.3 | |
| Log-linear | 1.9 | 43 | 2.4 |
Table 3.
Accuracy of different satellites in two study areas.
| Study Areas | Satellites | MAE (m) | MRE (%) | RMSE (m) |
|---|---|---|---|---|
| Dongdao Island | WorldView-2 | 1.17 | 17.5 | 1.49 |
| Sentinel-2A | 2.67 | 41.8 | 3.44 | |
| Saipan Island | WorldView-2 | 2.00 | 45.8 | 2.60 |
| Sentinel-2A | 3.09 | 62.1 | 3.76 |
© 2020 by the authors. Licensee MDPI, Basel, Switzerland. This article is an open access article distributed under the terms and conditions of the Creative Commons Attribution (CC BY) license (http://creativecommons.org/licenses/by/4.0/).
Share and Cite
MDPI and ACS Style
Zhang, X.; Ma, Y.; Zhang, J. Shallow Water Bathymetry Based on Inherent Optical Properties Using High Spatial Resolution Multispectral Imagery. Remote Sens. 2020, 12, 3027. https://doi.org/10.3390/rs12183027
AMA Style
Zhang X, Ma Y, Zhang J. Shallow Water Bathymetry Based on Inherent Optical Properties Using High Spatial Resolution Multispectral Imagery. Remote Sensing. 2020; 12(18):3027. https://doi.org/10.3390/rs12183027
Chicago/Turabian StyleZhang, Xuechun, Yi Ma, and Jingyu Zhang. 2020. "Shallow Water Bathymetry Based on Inherent Optical Properties Using High Spatial Resolution Multispectral Imagery" Remote Sensing 12, no. 18: 3027. https://doi.org/10.3390/rs12183027
Note that from the first issue of 2016, this journal uses article numbers instead of page numbers. See further details here.