Monitoring of Chestnut Trees Using Machine Learning Techniques Applied to UAV-Based Multispectral Data
by
 , , , , and
Luís Pádua
1,2,* ,
,
Pedro Marques
1,3 ,
,
Luís Martins
1,3,
António Sousa
1,2,
Emanuel Peres
1,2 and
Joaquim J. Sousa
1,2 1
Engineering Department, School of Science and Technology, University of Trás-os-Montes e Alto Douro, 5000-801 Vila Real, Portugal
2
Centre for Robotics in Industry and Intelligent Systems (CRIIS), INESC Technology and Science (INESC-TEC), 4200-465 Porto, Portugal
3
Centre for the Research and Technology of Agro-Environmental and Biological Sciences, University of Trás-os-Montes e Alto Douro, 5000-801 Vila Real, Portugal
*
Author to whom correspondence should be addressed.
Remote Sens. 2020, 12(18), 3032; https://doi.org/10.3390/rs12183032
Submission received: 17 August 2020
/
Revised: 9 September 2020
/
Accepted: 15 September 2020
/
Published: 17 September 2020
(This article belongs to the Special Issue Application of Remote Sensing in Agroforestry)
Abstract
:Phytosanitary conditions can hamper the normal development of trees and significantly impact their yield. The phytosanitary condition of chestnut stands is usually evaluated by sampling trees followed by a statistical extrapolation process, making it a challenging task, as it is labor-intensive and requires skill. In this study, a novel methodology that enables multi-temporal analysis of chestnut stands using multispectral imagery acquired from unmanned aerial vehicles is presented. Data were collected in different flight campaigns along with field surveys to identify the phytosanitary issues affecting each tree. A random forest classifier was trained with sections of each tree crown using vegetation indices and spectral bands. These were first categorized into two classes: (i) absence or (ii) presence of phytosanitary issues. Subsequently, the class with phytosanitary issues was used to identify and classify either biotic or abiotic factors. The comparison between the classification results, obtained by the presented methodology, with ground-truth data, allowed us to conclude that phytosanitary problems were detected with an accuracy rate between 86% and 91%. As for determining the specific phytosanitary issue, rates between 80% and 85% were achieved. Higher accuracy rates were attained in the last flight campaigns, the stage when symptoms are more prevalent. The proposed methodology proved to be effective in automatically detecting and classifying phytosanitary issues in chestnut trees throughout the growing season. Moreover, it is also able to identify decline or expansion situations. It may be of help as part of decision support systems that further improve on the efficient and sustainable management practices of chestnut stands.

1. Introduction
Chestnut trees (Castanea sativa Mill.) are one of the most important species in Portugal for both forestry and agricultural purposes. In an agricultural context, in 2018, this species represented a surface of 38,728 ha with 33,929 tons of chestnuts produced. It is especially relevant in the northern region of the country, where it represents 89% of planted surface (34,504 ha) and 88% of yield (29,908 tons) [1]. Chestnut trees can be affected by several phytosanitary issues due to both biotic or abiotic factors. These issues can significantly impact the chestnut development and yield [2]. Chestnut ink disease (Phytophthora cinnamomi Rands) [3], chestnut blight (Cryphonectria parasitica (Murr.) Barr.) [4], nutritional deficiencies [5] and, more recently (June 2014), the chestnut gall wasp (Dryocosmus kuriphilus Yasumatsu) [6], are among the most meaningful biotic and abiotic factors that can affect chestnut trees. The phytosanitary condition of chestnut stands is usually evaluated by in-field observations, which are time-consuming, laborious, demand specialized human resources, and are based on small samples. Using currently available methods and tools, all based on manual and laborious measurements, phytosanitary conditions monitoring over a longer period of time is even more challenging.
Remote sensing can be considered as a viable approach to help in monitoring and managing chestnut stands regarding phytosanitary issues caused by either biotic or abiotic factors. There are several studies published using remote sensing platforms coupled with different sensors that have chestnut trees as their research subject. Small format aerial photography via manned aircrafts was used to assess chestnut ink disease [7,8,9] and chestnut blight [8]. The same aerial imagery format was also used to assess chestnut ink disease and blight spread through the use of geostatistical methods [10,11] and to discriminate different phytosanitary statuses [12]. Airborne low-density LiDAR (Light Detection and Ranging) data were also used for biomass estimation [13]. However, these initial attempts to use aerial images to assess chestnut trees’ health status revealed low correlation. More recently, Marchetti et al. [14] proposed an approach for mapping chestnut stands using WorldView satellite multispectral imagery, enabling the classification of chestnut stands within a heterogeneous landscape.
Meanwhile, unmanned aerial vehicles (UAVs) have been established as a versatile remote sensing platform capable of being coupled to an array of different sensors and to operate under diverse flight and terrain conditions. Furthermore, they are also able to adapt to specific requirements for monitoring different crops (both temporal and spatial). Precision agriculture and forestry have greatly benefited from this remote sensing platform in the last few years, with many advances being published and already in use. As for studies related to chestnut trees, orthophoto mosaics obtained through photogrammetric processing of high-resolution imagery acquired from UAVs were used by Martins et al. [15] to monitor 231 ha of chestnut trees. By comparing these data with aerial imagery acquired almost ten years earlier, it was possible to measure areas of new plantations and to assess the decline of chestnut trees. The main conclusion drawn by this study was that the decline was very significant along that time period. The study was extended to subsequent years, and the results are presented in Pádua el al. [16], where a decline from 2014 to 2015 was confirmed. A novel method based on image processing was proposed in Marques et al. [17], enabling the automatic monitoring of chestnut trees through estimation of some of the main parameters, such as tree height and crown diameter and area. By applying this methodology, multi-temporal analysis was possible both at the tree and plantation level. Di Gennaro et al. [18] used a similar method to estimate the pruning wood biomass of chestnut trees. Finally, in Pádua et al. [19], the impact of different flight heights in the estimation of tree height and crown diameter was evaluated using UAV-based RGB imagery. It was concluded that flight altitudes of 60 and 120 m (corresponding to a spatial resolution of 2.65 and 5.25 cm, respectively) presented the best overall results.
Nonetheless, despite the numerous advances in monitoring chestnut trees provided by the use of UAV-based high-resolution aerial imagery, little progress has been made in both automatic detection and classification of the biotic or abiotic factors that can affect them. The ability to act (or react) in the timely detection of factors that can negatively affect the phytosanitary condition of a chestnut stand will be essential to improve management practices and, therefore, have a significant social and economic impact. In this study, we explore UAV-based multispectral imagery with high spatial and temporal resolutions [20] of chestnut stands to detect potential phytosanitary problems.
There are studies with comparable objectives for vineyards [21] to detect Flavescence dorée, for olive groves [22] to detect symptoms of Xylella fastidiosa, and for oil palm plantations [23] to assess health status and disease detection. Balasundram et al. [24] provided insights into the deployment of site- and time-specific approaches to manage plant disease problems. However, and according to the authors’ best knowledge, there are no similar studies or approaches applied to chestnut trees. Indeed, the challenge is even greater when dealing with chestnut trees as there are several biotic and abiotic factors that can cause similar symptoms, with very different mitigation treatments or methods.
As such, seeking to determine precisely which factors are affecting a given tree, the proposed methodology also includes an incremental approach based on machine learning methods. Several flight campaigns were accomplished to acquire multispectral imagery over a chestnut stand located in northeastern Portugal. Furthermore, field surveys were also conducted, by an expert, to obtain the phytosanitary characterization of every individual chestnut tree within the monitored area. The proposed methodology begins by applying photogrammetric processing to the acquired high-resolution aerial imagery. Then, tree crowns are detected using the outcomes of the first step. A random forest (RF) classifier is then applied to distinguish healthy trees from those affected by any biotic or abiotic factor. This process is repeated to determine which phytosanitary problem is affecting each tree. Multi-temporal analysis comes into play by applying the proposed methodology to data acquired in different flight campaigns that occur in the same growing season. It is a contributing factor to improve this methodology’ precision as some chestnut trees were asymptomatic or showed a low incidence of phytosanitary issues early in the growing season. The proposed methodology is able to distinguish healthy chestnut trees, and it can also identify which is the specific limiting factor affecting the development of each tree.
2. Materials and Methods
2.1. Study Area Characterization
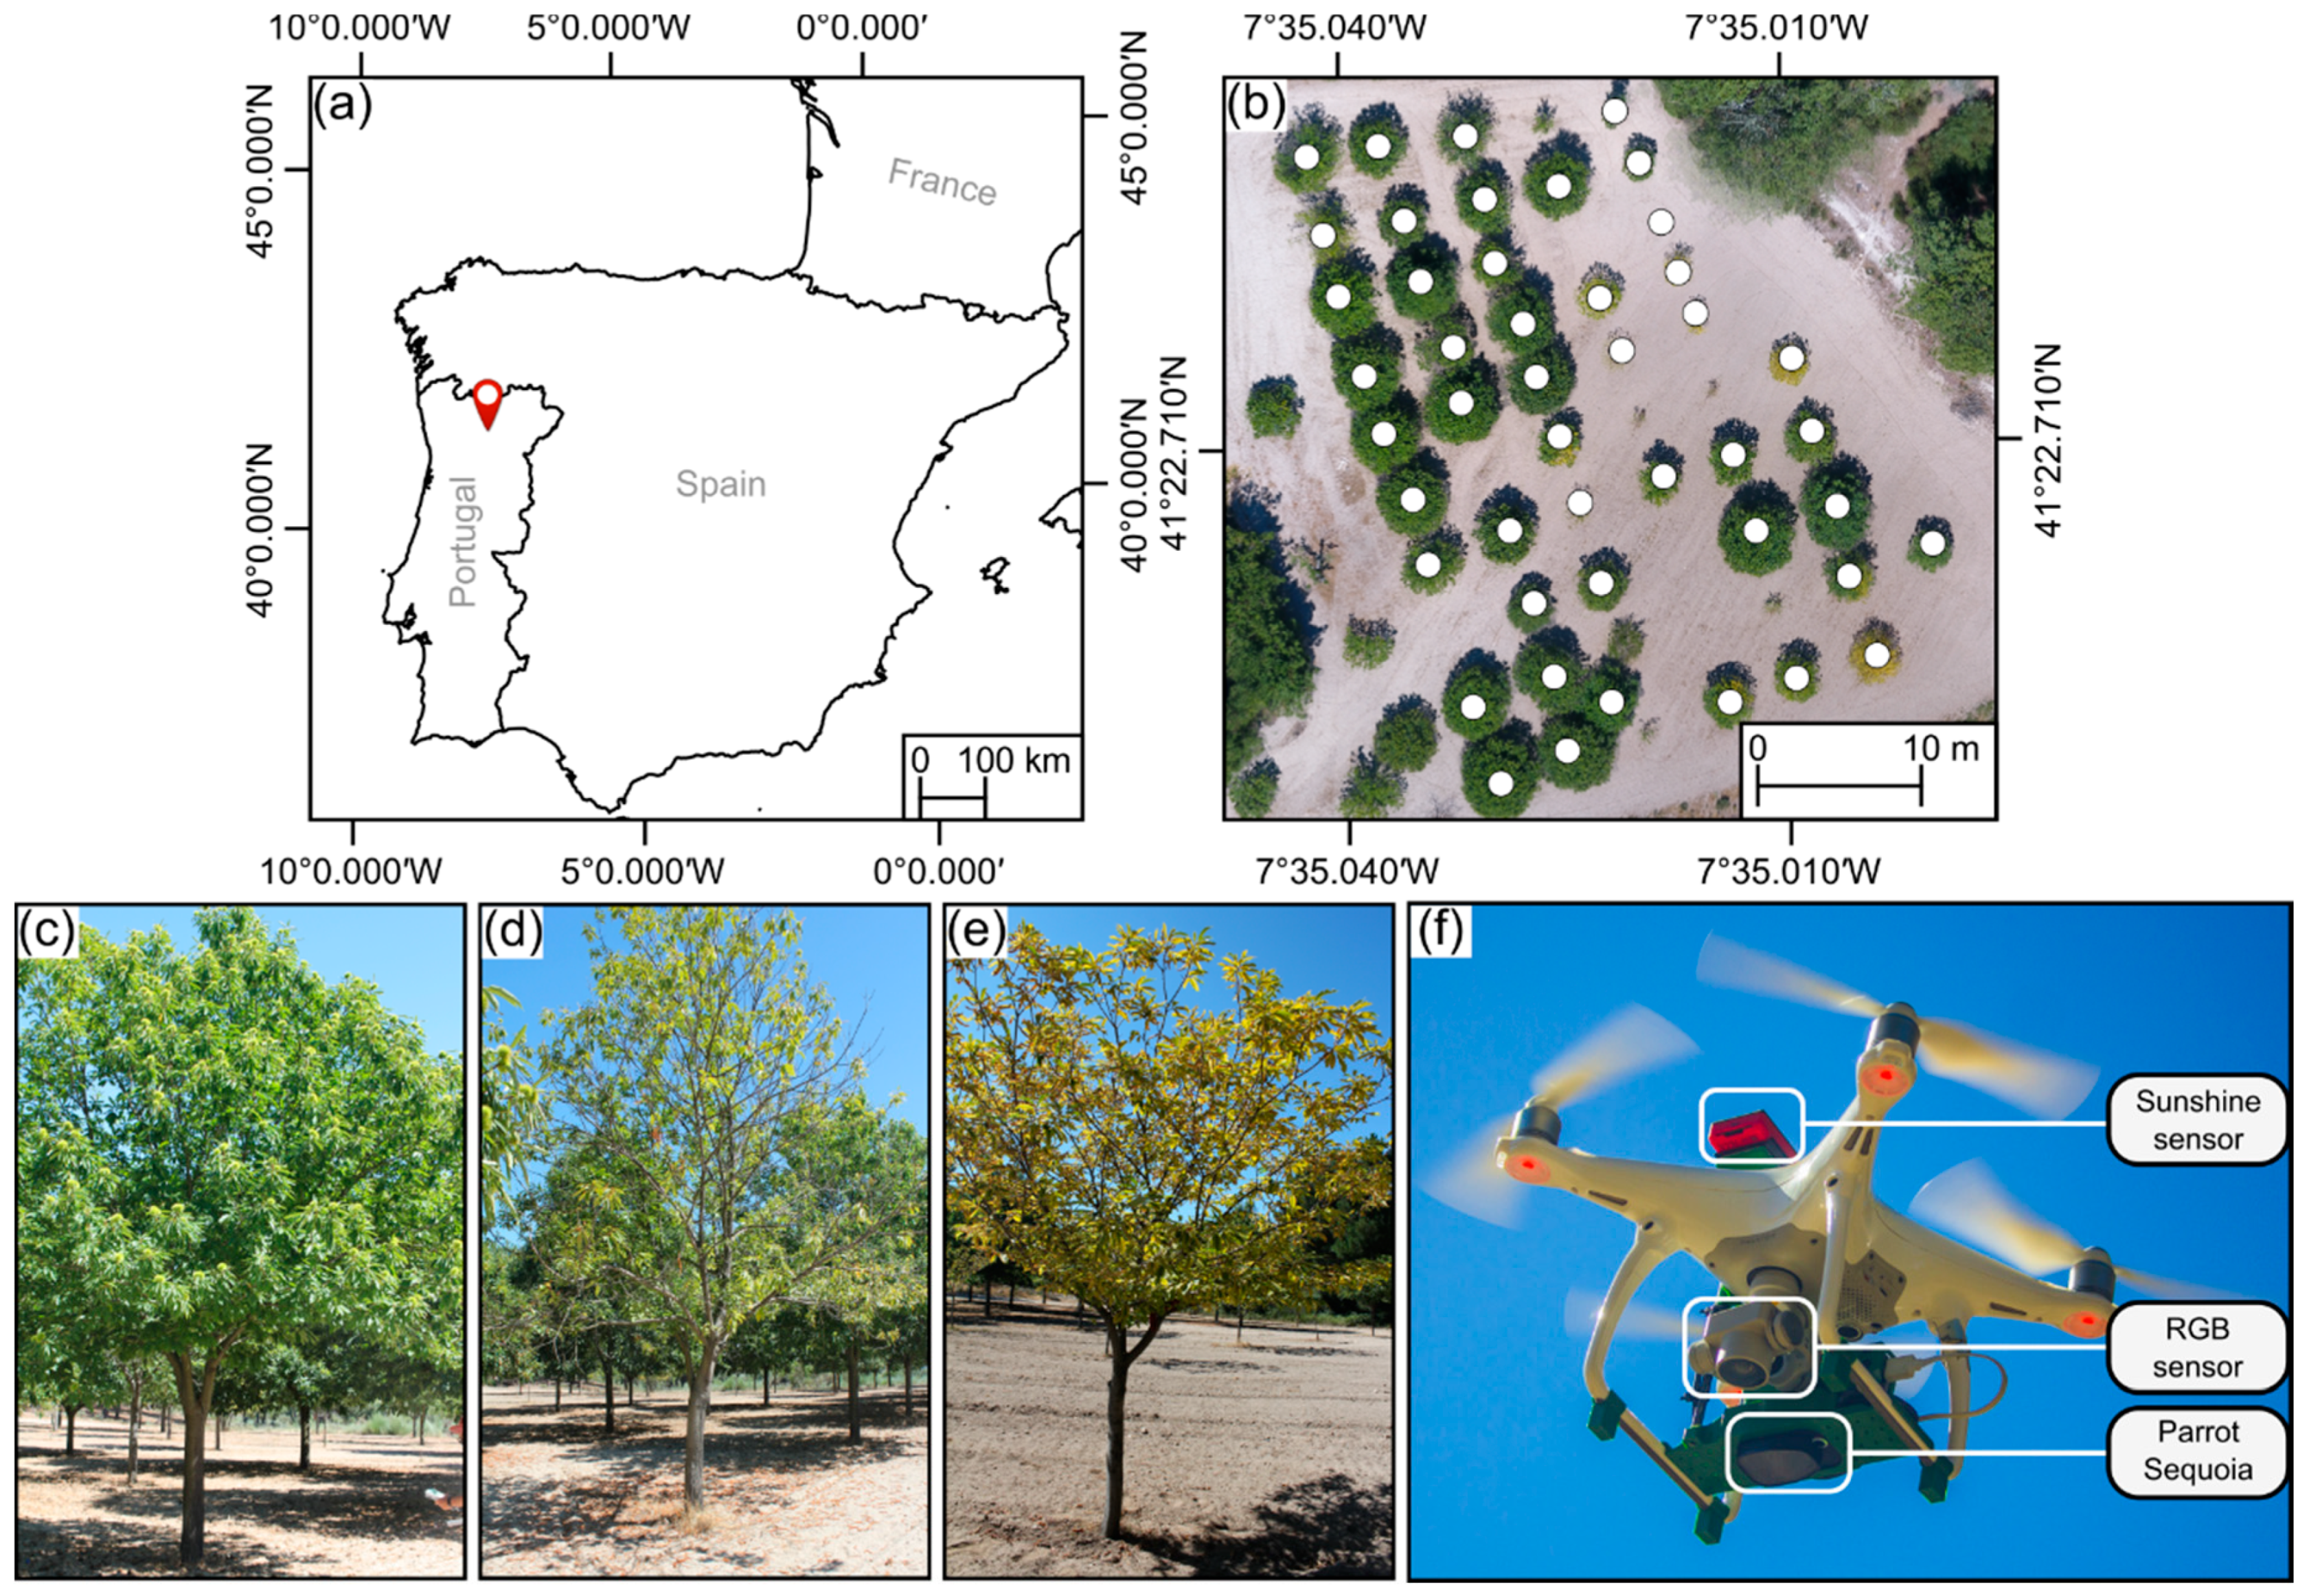
Research involving trees, in general, and chestnut trees, in particular, requires keen knowledge of the area under study. The studied chestnut stand is a laboratory area located in northeastern Portugal (Figure 1a, 41°22–42.8 N, 7°35–01.4 W, altitude 760 m) within one of the main chestnut production regions in Portugal [25]. It has an area of approximately 0.4 ha and is composed of 52 trees from which 46 are chestnut trees (marked in Figure 1b). This area was rigorously characterized by experts from the University of Trás-os-Montes e Alto Douro (Vila Real, Portugal), and to ensure the representativeness of this area, the most common cultural practices were also used [17].
In-field observations were carried out during the 2018 growing season, on the same dates as the flight campaigns, to assess the phytosanitary condition of the chestnut stand. Issues such as chestnut ink disease and potential nutritional deficiencies were evaluated using a discrete scale ranging from zero (absence) to four (strong incidence). Furthermore, the condition of each chestnut tree was evaluated using a five-level scale ranging from 1 = very bad condition to 5 = excellent condition, considering the severity of the phytosanitary issues along with the overall tree status. This qualitative classification was performed by an expert and based on the severity of visible symptoms [15]. Dendrometric measurements of each tree were also acquired. Soil analyses were also conducted to assess the nutrient levels.
2.2. UAV-Based Data Acquisition
A DJI Phantom 4 (DJI, Shenzhen, China) was used to acquire the aerial imagery used in this study. This multi-rotor UAV comes equipped out-of-the-box with a complementary metal oxide semiconductor (CMOS) sensor—mounted in a 3-axis gimbal—capable of acquiring georeferenced RGB imagery with 12.4 MP resolution (details about UAV and sensor specifications can be found at [26]). The UAV was modified to support multispectral imagery acquisition (Figure 1f) using the Parrot Sequoia (Parrot SA, Paris, France). This sensor is composed of a camera array responsible for acquiring green, red, red-edge (RE), and near-infrared (NIR) single-band images. Each band has a 1.2 MP resolution. For radiometric calibration of the multispectral imagery, irradiance data are acquired during flight (from a sensor positioned at the top of the UAV—see Figure 1f) and, prior to each flight, reflectance data are acquired using a calibration target.
Flight campaigns were carried out throughout the growing season of 2018 to acquire multispectral aerial imagery. A flight mission was planned to provide a complete overview of the area, in a double-grid pattern, with 80% overlap between images and 70% overlap between flight lines. Flight height from the take-off point was set to 60 m, and the total area covered by flights was approximately 2 ha. Considering the planned imagery overlap and the flight height, the sensor was set up to acquire images at each 11 m travelled. The same flight plan was used for all flight campaigns.
The selected dates—27 May, 24 June, 8 July, 8 August, 25 September, and 16 October—allowed spanning across the most important stages of chestnut tree development: sprouting, flowering, fruiting, and defoliation. The vegetative dormancy of chestnut trees usually spans from November to March [27].
2.3. Data Processing
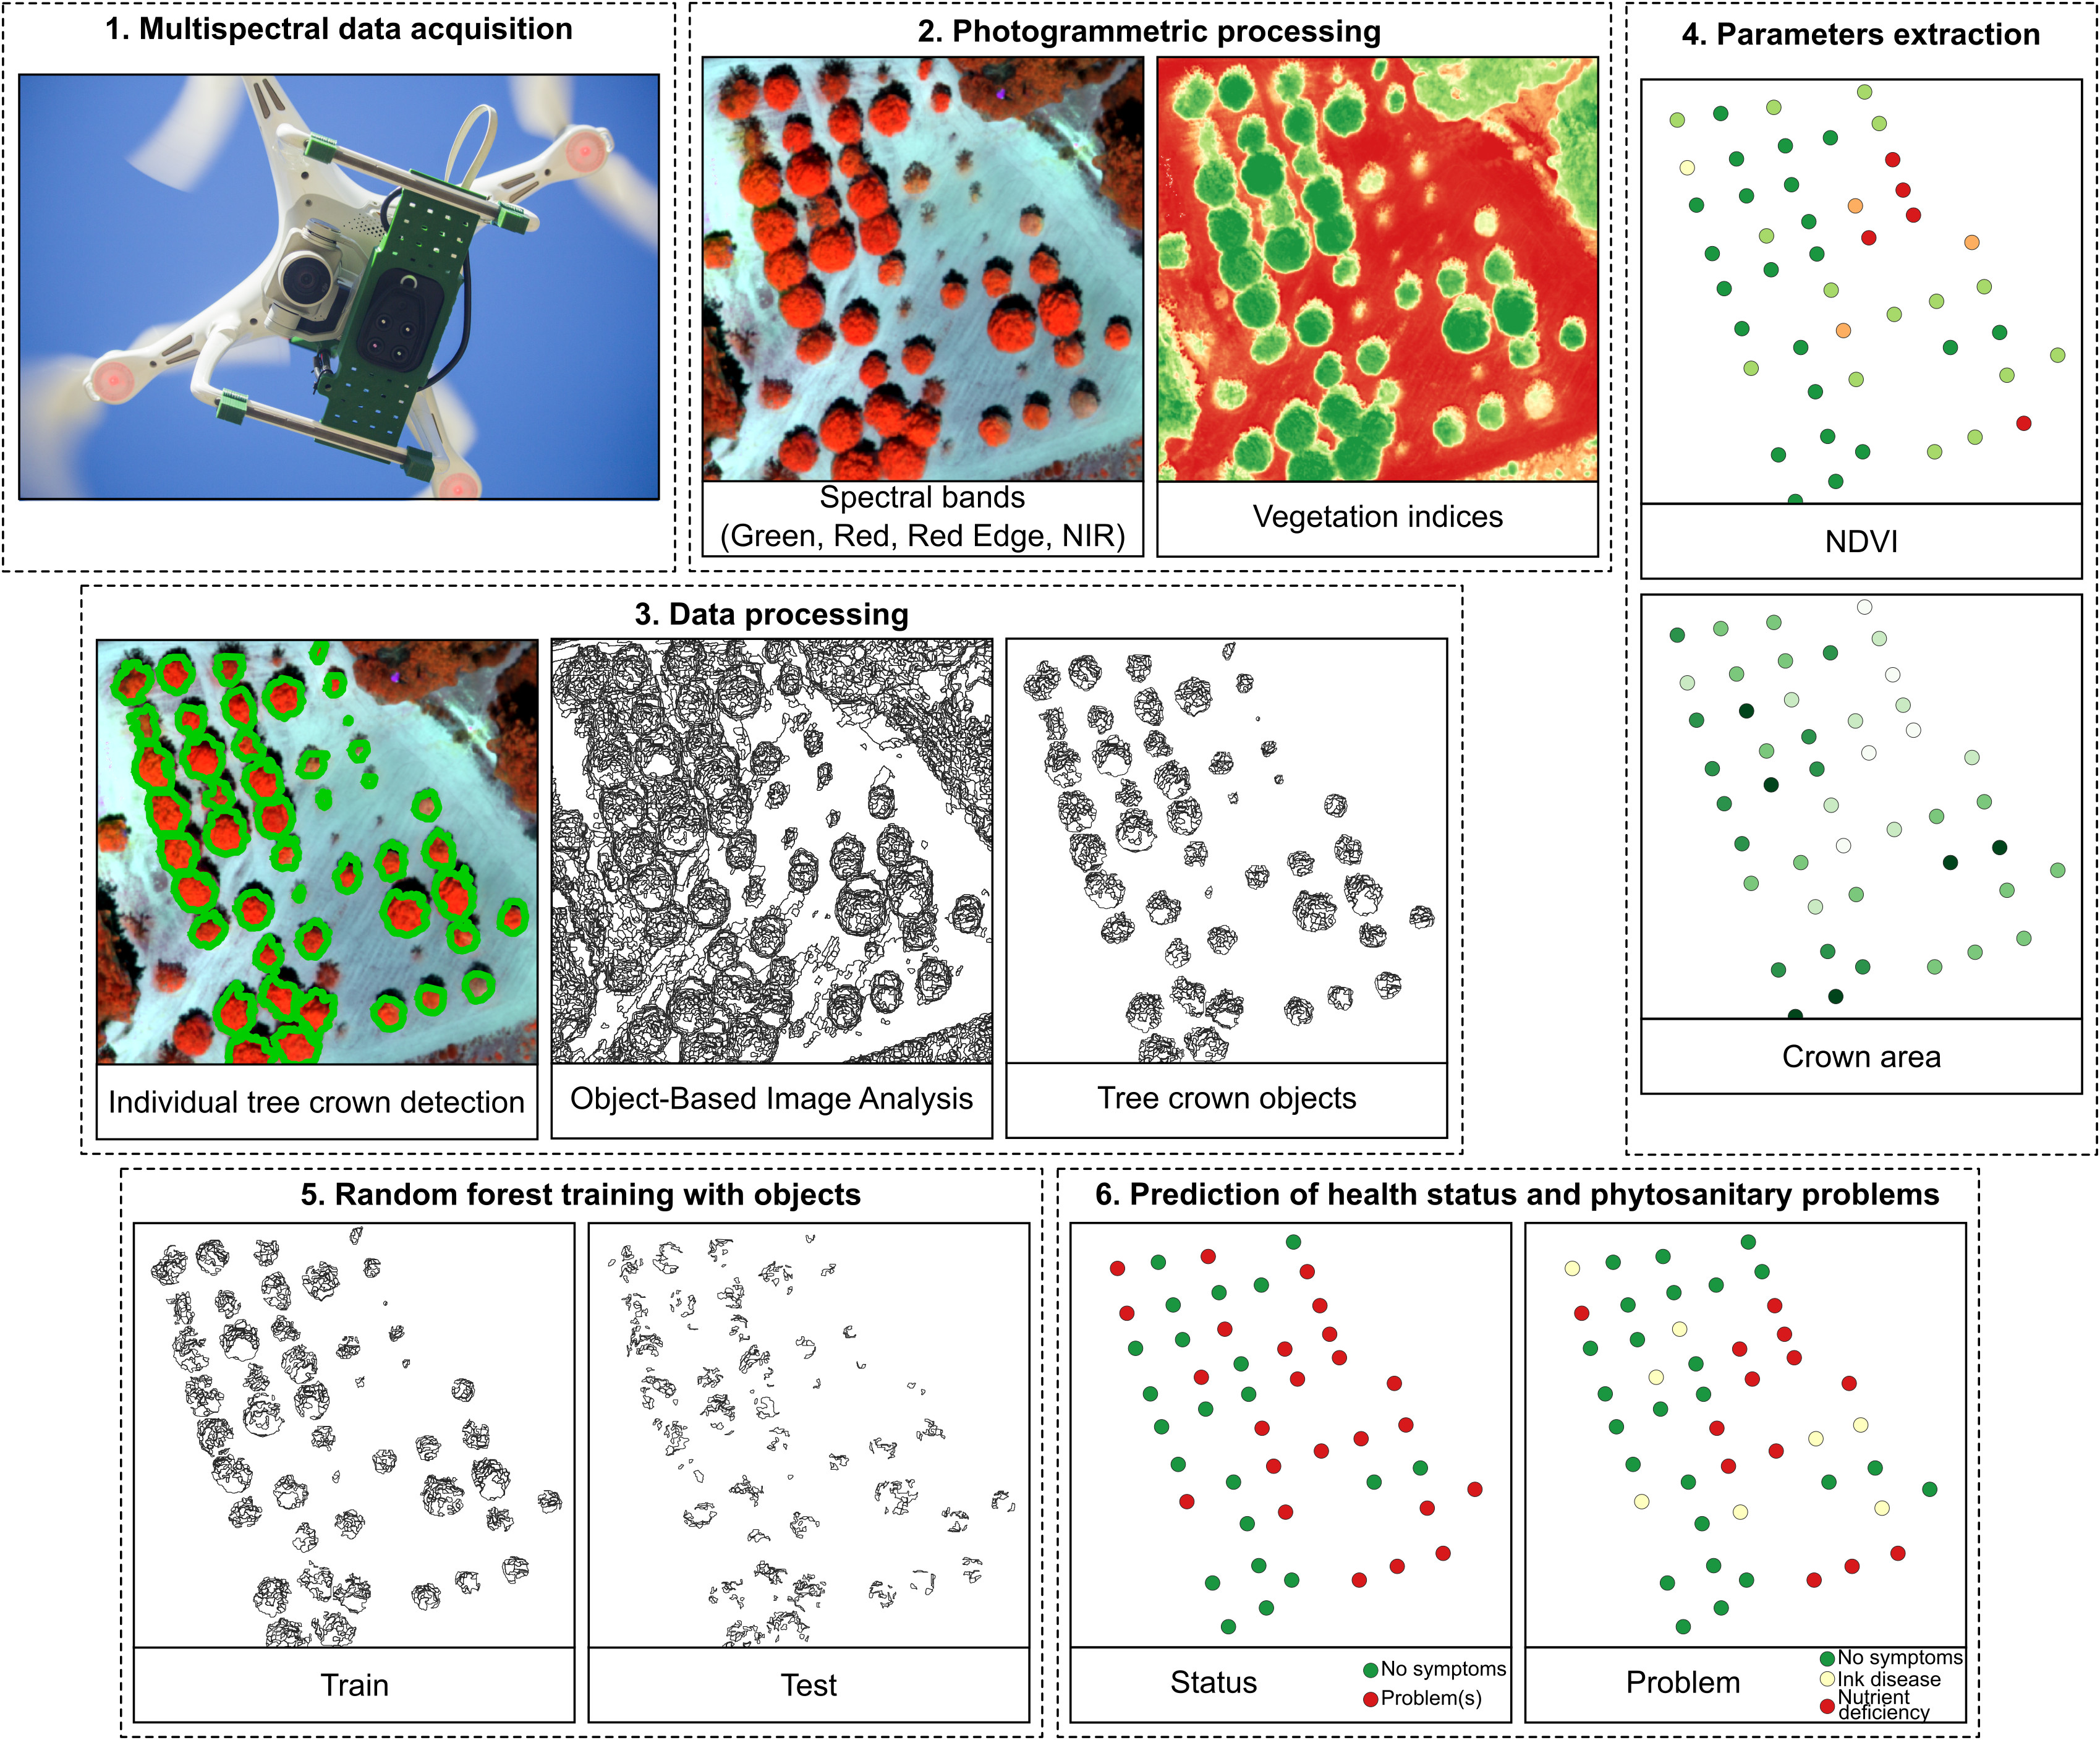
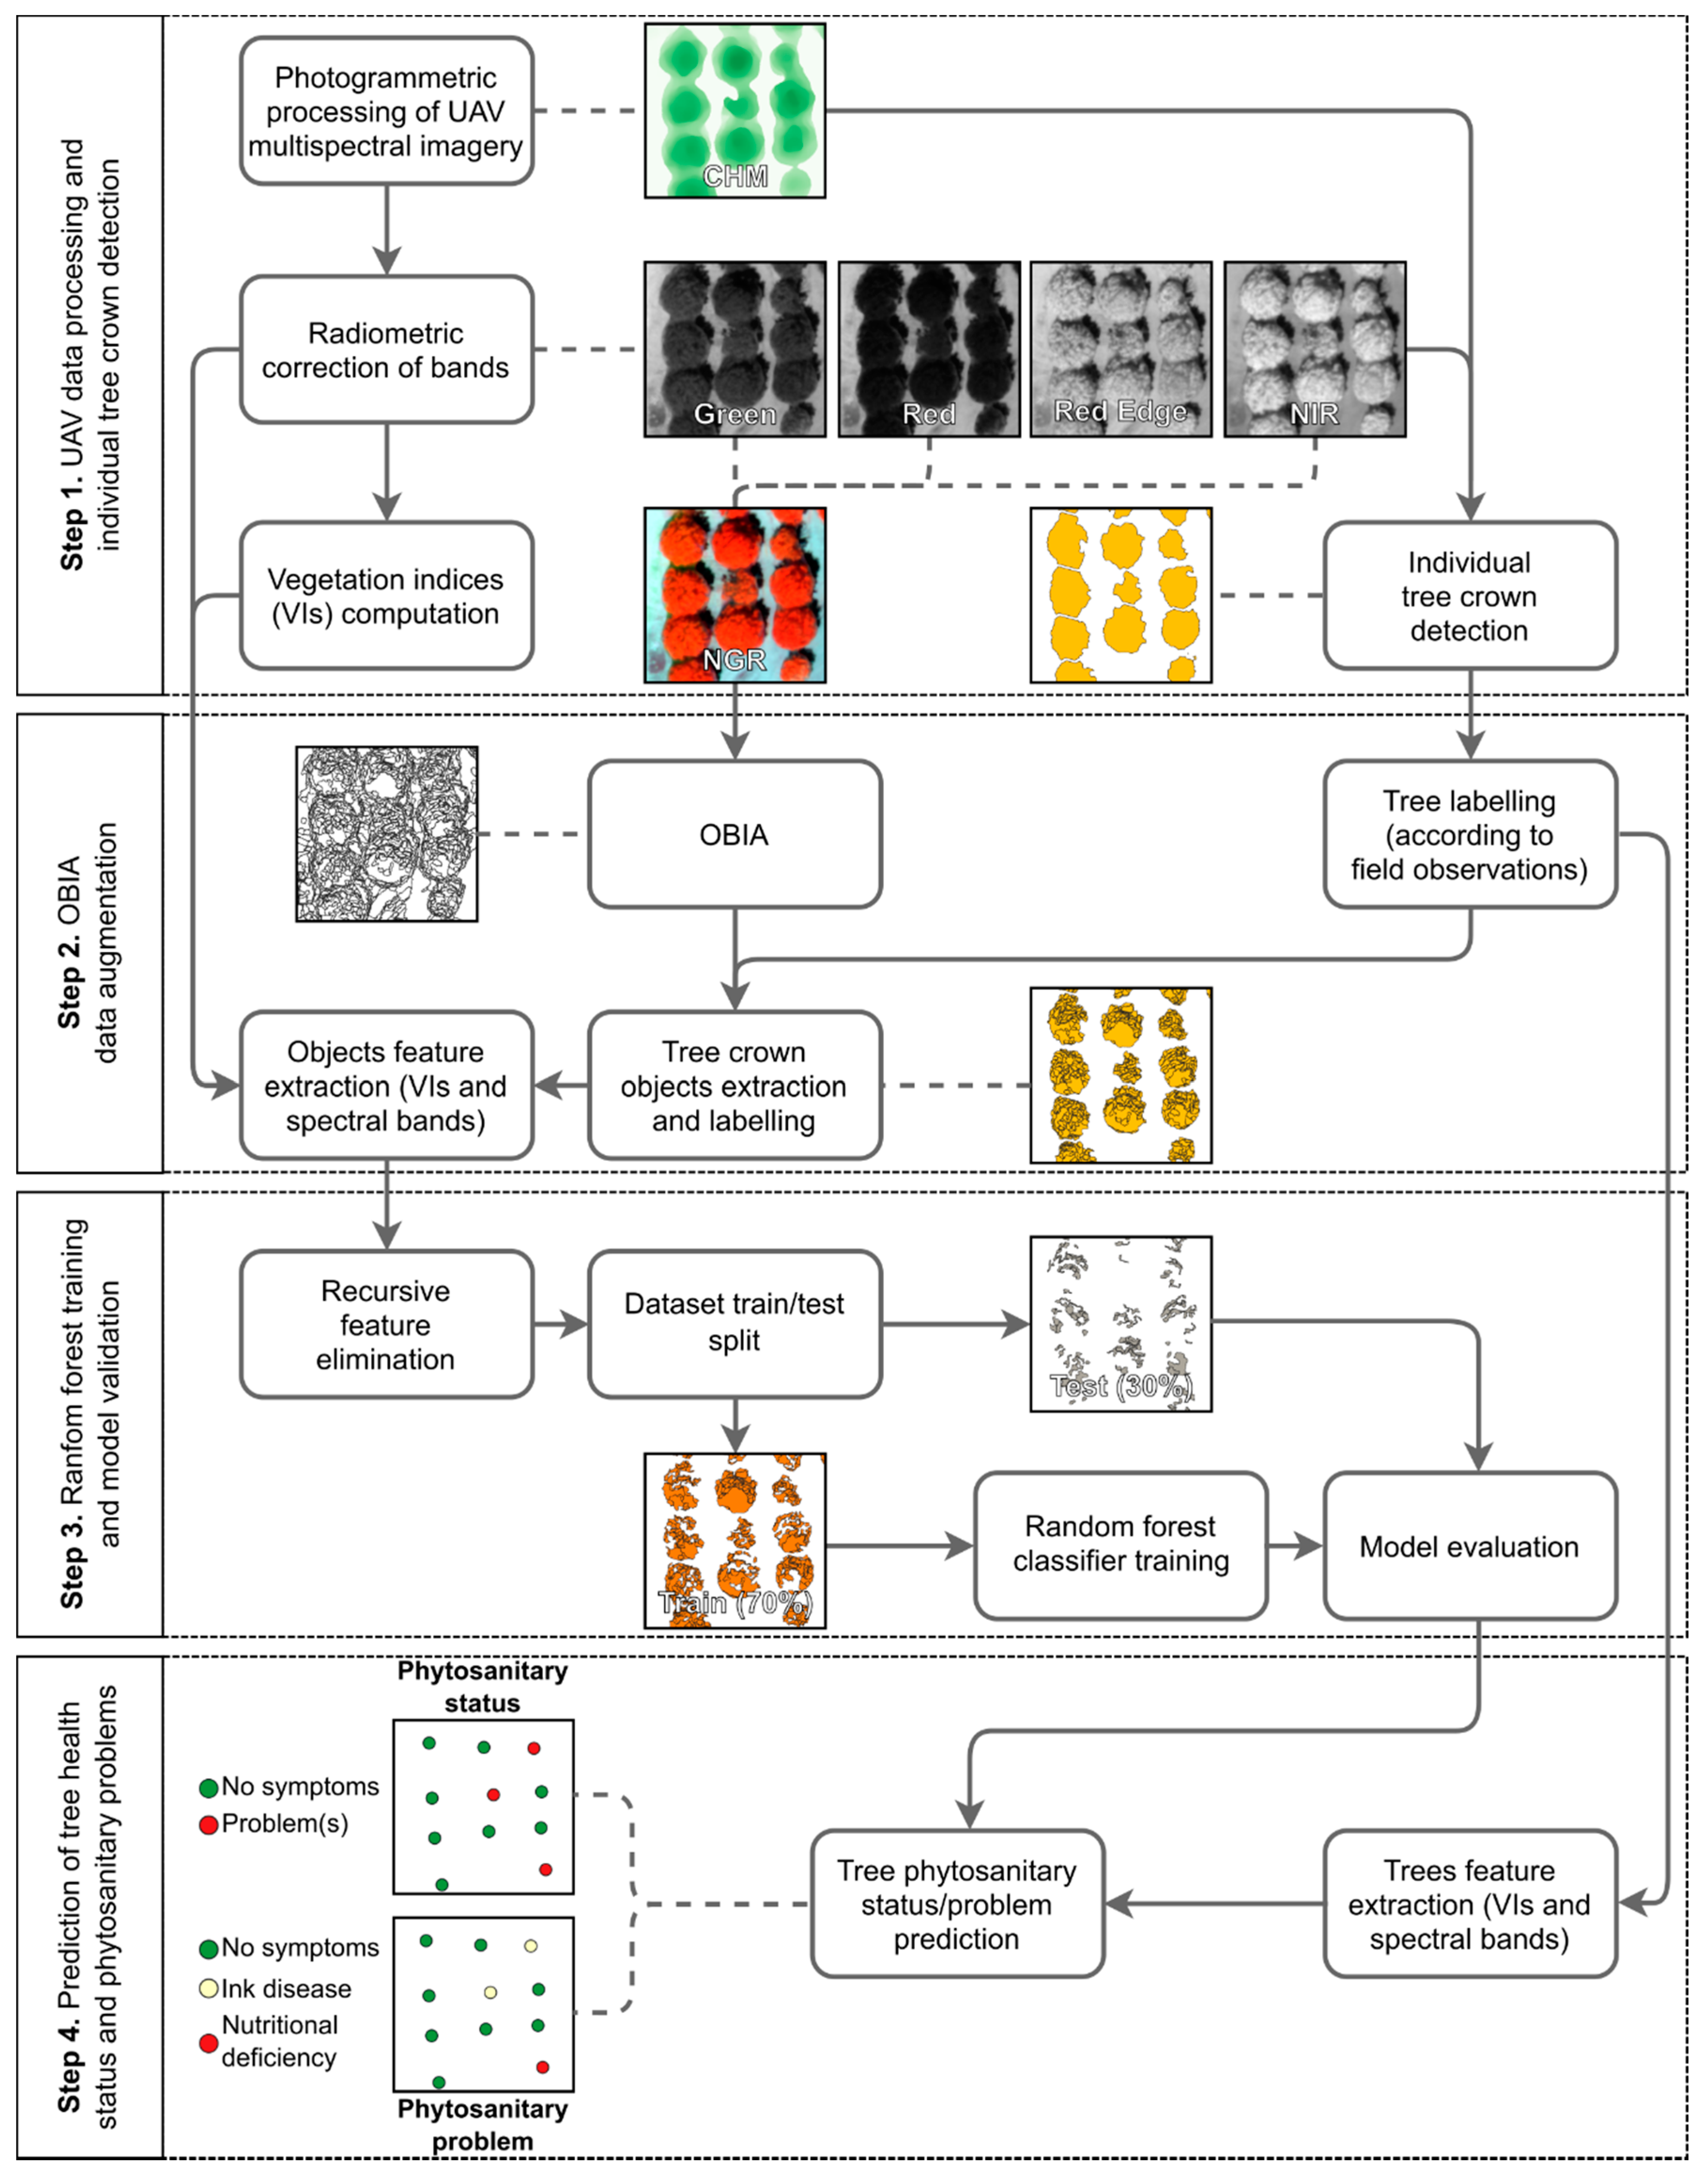
Figure 2 presents the main steps of the proposed methodology as applied to each flight campaign’s data. Outcomes generated from the initial photogrammetric processing enable output of a crop height model (CHM) and several vegetation indices. The latter are computed from different combinations of the four acquired bands and can be used for different purposes: (1) individual tree crown detection; (2) object-based image analysis (OBIA); and (3) dataset features. Training and prediction processes are the same to (1) classify the presence of phytosanitary issues, and (2) to identify the specific phytosanitary issue (if any). Only the number of classes varies. The proposed methodology remains functional, regardless of the sensor used.
2.3.1. Photogrammetric Processing and Vegetation Indices Computation
Pix4DMapper Pro (Pix4D SA, Lausanne, Switzerland) was used to achieve the photogrammetric processing of the acquired aerial imagery. It provides a complete processing pipeline dealing with imagery correction, alignment, and radiometric calibration, producing dense point clouds.
Within this study, RGB orthophoto mosaics were computed for visualization purposes only. Despite the flight campaigns being carried out at the same height with both sensors, their spatial resolution differs. Indeed, due to different sensor resolutions, the ground sample distance (GSD) of the RGB imagery is approximately double that of the multispectral imagery (2.6 and 6 cm, respectively). Point cloud density, per m3, was, respectively, ~500 and ~40 points. Data from both sensors were aligned relative to each other by using points that are clearly identifiable in the imagery and then merged, and geometric correction was applied using ground control points (GCPs) using both natural features and artificial targets.
In projects using multispectral imagery, a radiometric calibration is performed. Reflectance maps are generated for each band, and the most relevant vegetation indices—suggested in the literature—to monitor spatiotemporal variations in biomass and yield and to estimate leaf pigments [21] are computed (Table 1). A digital surface model (DSM) and a digital terrain model (DTM) are also generated, and a CHM is computed. This process was accomplished in QGIS software by subtracting the DTM to the DSM.
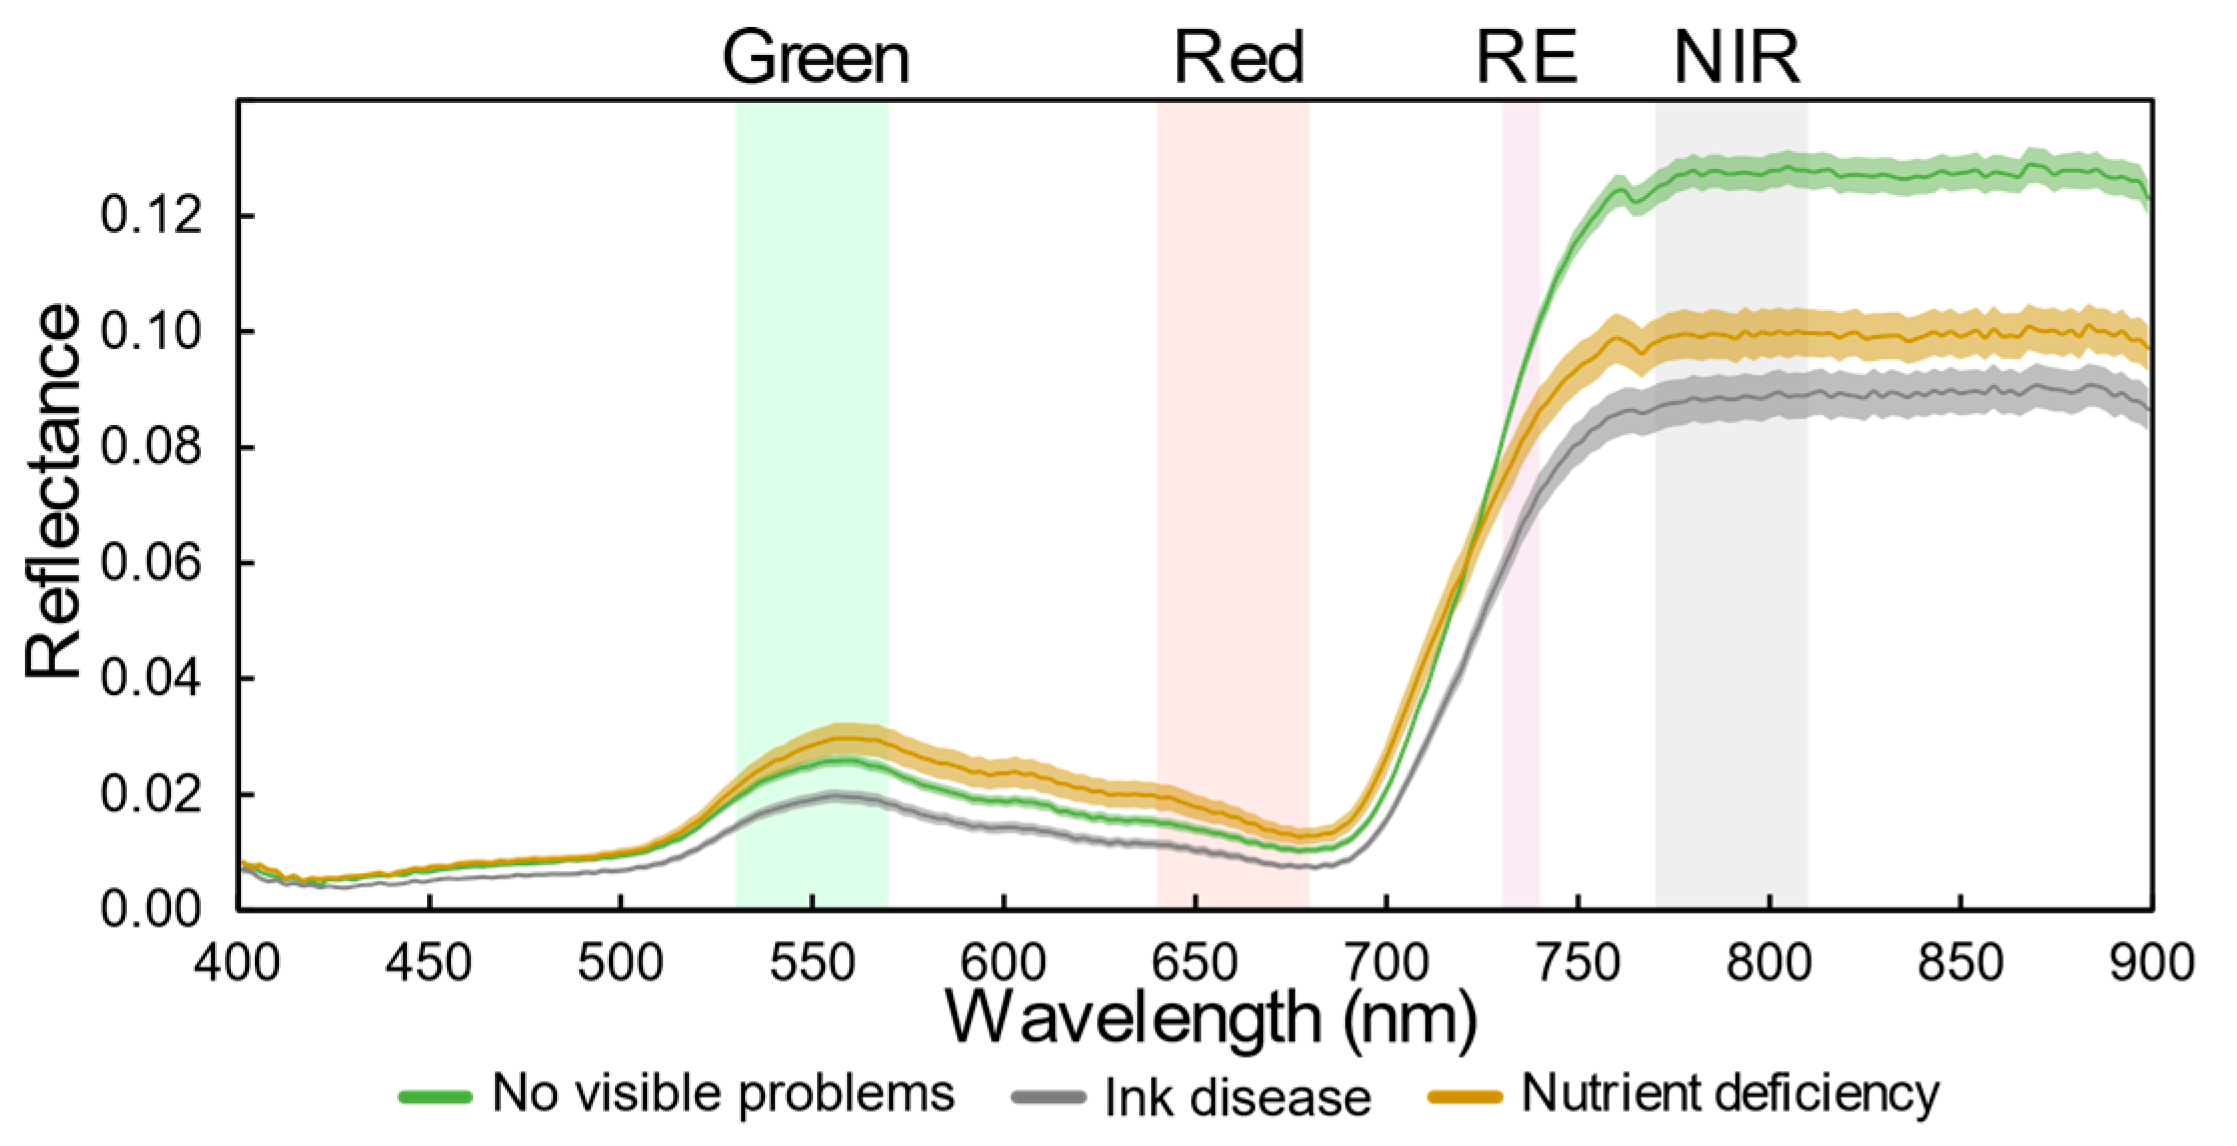
In addition to the vegetation indices shown in Table 1, new ones are proposed in this study. In fact, knowledge about the typical spectral signature of symptomatic and asymptomatic chestnut trees, allowed to conclude the relevance of the red-edge (RE) and near-infrared (NIR) regions. Figure 3 presents the spectral signatures for the main issues identified in the chestnut stand (chestnut ink disease and nutritional deficiencies) and for chestnut trees with no visible symptoms obtained from UAV-based hyperspectral data using the Nano-Hyperspec® VNIR (400–1000 nm) imaging sensor (Headwall Photonics, Inc., MA, USA). Significant differences among them are observed along spectrum; in the visible part (400–690 nm), a higher reflectance is achieved in trees with nutritional deficiencies, followed by trees with no visible symptoms, while in the RE and NIR parts (690–900 nm), the opposite is verified. Trees affected by the ink disease always presented the lowest reflectance.
Therefore, customized vegetation indices were developed considering the strong influence of the RE and NIR bands. These vegetation indices are inspired by the Excess Green Index (ExG) [36] that showed effectiveness in weed discrimination [36], crop identification [37,38] and quantification [39], early-season crop monitoring [40], and multi-temporal mapping of vegetation fractions [41] using both close-range and UAV-based imagery. Thus, the assumption that added weight of both RE and NIR bands would improve the detection of phytosanitary problems was made (Figure 3). Two new vegetation indices are proposed and were named Excess NIR (ExNIR) and Excess RE (ExRE) and are represented by the following equations:
where Gn, Rn, NIRn and REn corresponds to the division of, respectively, green, red, NIR and RE bands by the sum of the four bands. Normalized difference versions of the two proposed indices, the Normalized Difference Excess NIR (NDExNIR) and the Normalized Difference Excess RE (NDExRE), were also computed as follows:
2.3.2. Individual Tree Crown Detection and Multi-Temporal Analysis
For extraction of individual tree parameters (Step 1 from Figure 2), each tree must be isolated from its surrounding environment (soil, vegetation, and other trees). However, given its planting distance and crown size, chestnut trees tend to be too close from each other, giving rise to the need for their segmentation and isolation. In this way, the orthorectified outcomes can be used as input in an image processing method for individual tree crown detection. For this purpose, the principles enunciated in Marques et al. [17] were used with slight modifications to encompass multispectral imagery. The method was developed for chestnut plantation monitoring with the scope of performing multi-temporal analysis. It relies on the combination of photogrammetric outcomes in a raster format which, in turn, is automatically binarized. Some changes were implemented to ensure that all monitored chestnut trees within the study area were included for analysis. Taking both the NIR band and the CHM as inputs, a locally adaptive threshold [42] is used in the binarization of the stand. A visual analysis allowed us to conclude that apart from trees of significant size (chestnuts and other trees) the amount of green vegetation in the study area was low or almost absent (depending on the flight campaign). For that reason, a value of 0.20 m was selected for CHM thresholding. Both binary images were then concatenated.
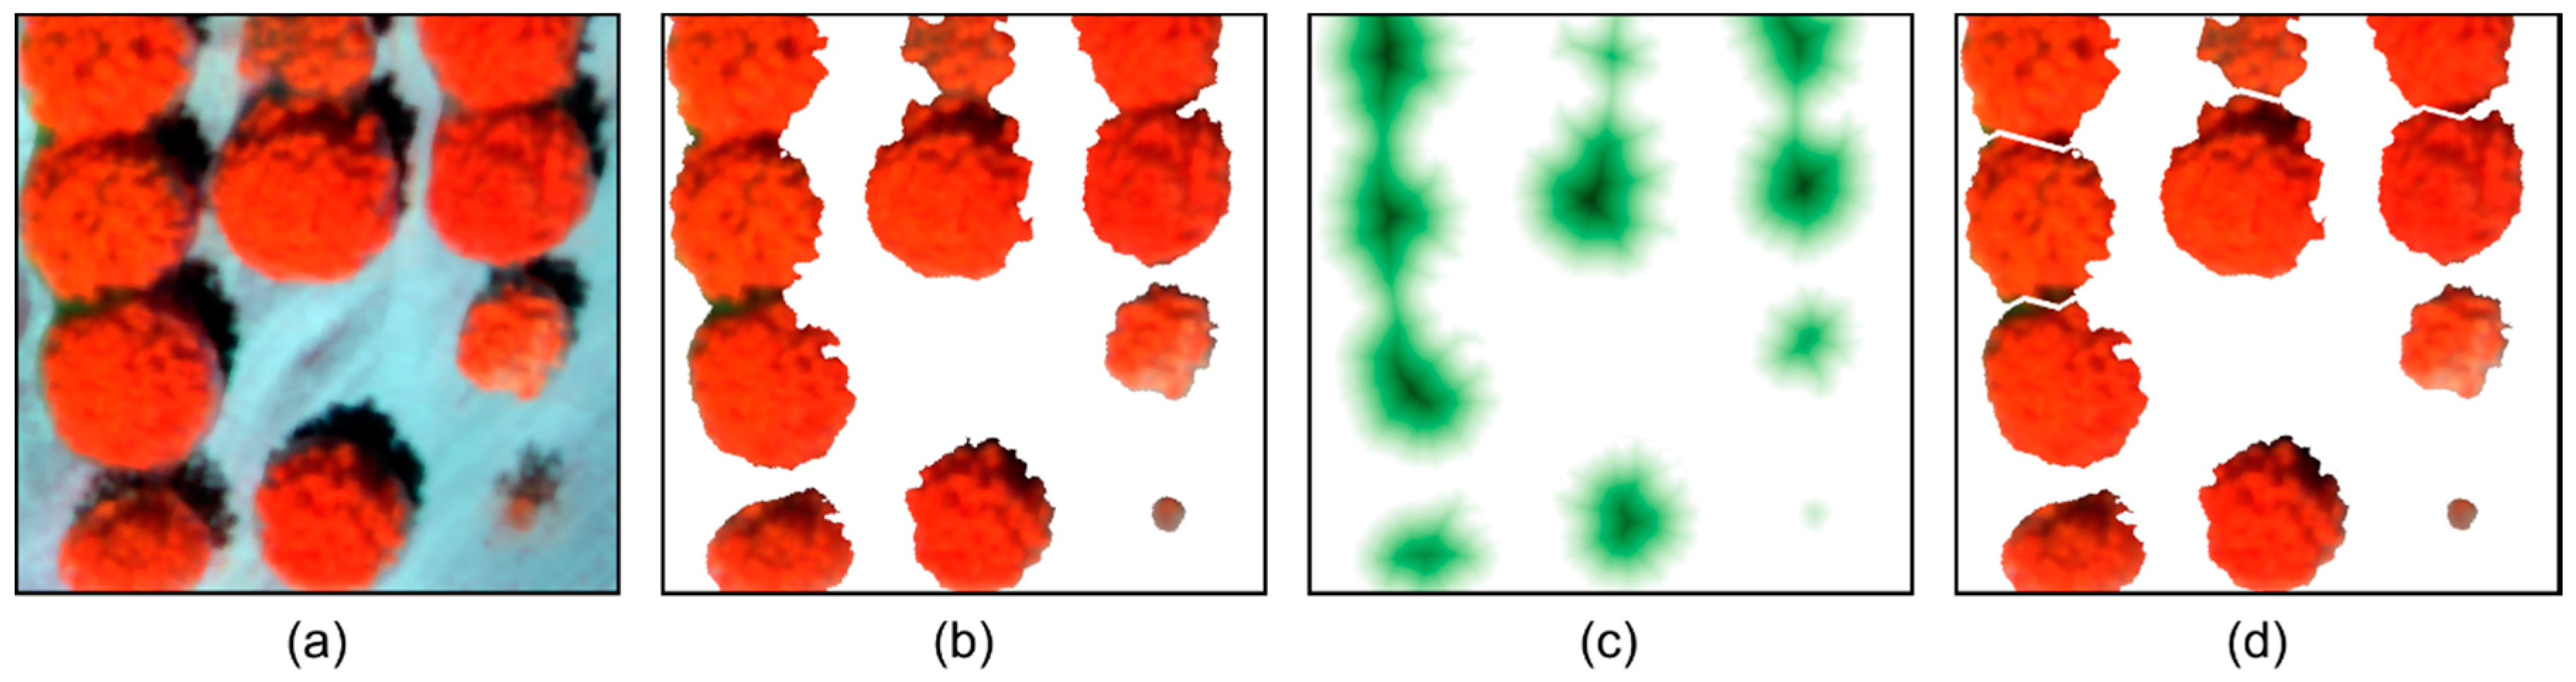
In the output, most of the pixels in the binary image (Figure 4b) belong to the crowns of chestnut trees. Still, some clusters of pixels can eventually represent more than one tree, leading to the need for a cluster isolation step (see Figure 4). The inverse of the binary imagery is used to compute a distance transform (Figure 4c) based on the Euclidean distance transform [43], where a value is assigned for each pixel corresponding to the distance to the nearest pixel with a zero value. In turn, the complement image is used in the watershed transform [44]. This way, in an ideal scenario, clusters representing multiple trees are separated into individual clusters representing a single tree (Figure 4d). However, given the high spatial resolution, there can be cases where small parts can be erroneously separated. The process is reversed by analyzing the bounding boxes overlap ratio, namely, if it is higher than 90% relative to another. Binary images as presented in Figure 4b,d were used to mask the color–infrared image.
After cluster isolation, it is possible to obtain individual tree parameters. Several parameters can be driven by the analysis of each cluster, such as the crown diameter, perimeter, and area. Moreover, values retrieved from remotely sensed data, such as the CHM (tree height), vegetation indices, or spectral bands, can be obtained by matching each cluster to the raster data. This information can be presented as geospatial data in vector format (shapefile) to be analyzed in a geographic information system (GIS) or in a table format.
Finally, multi-temporal analysis can be carried out using the values extracted for each flight campaign by comparison with the subsequent campaign. This way, the extracted parameters can be used for individual tree monitoring or to obtain an overview of the chestnut stand at the time of each flight campaign. In this study, the tree crown area and the mean NDVI value are analyzed in a multi-temporal perspective, focusing on the overall stand development and on trees affected/non-affected by phytosanitary issues.
2.4. Detection of Phytosanitary Issues Using a Random Forest Classifier
Apart from the possibility of doing multi-temporal analysis using the extracted parameters, they can be used in a machine learning (ML) approach to distinguish chestnut trees in different phytosanitary conditions. Then, it is possible to (1) classify healthy chestnut trees and chestnut trees with phytosanitary issues and (2) distinguish among phytosanitary issues. The clusters resulting from the automatic individual tree detection were labeled in two ways according to their phytosanitary status: in two classes—with or without phytosanitary issues; and in three classes—to distinguish the different major phytosanitary problems (no visible symptoms, ink disease, and nutritional deficiencies).
An RF algorithm was used to carry out these classifications. It is a type of ensemble classifier that generates several decision trees using a random subset of training samples capable of handling high data dimensionality and multicollinearity and is insensitive to overfitting [45]. This method is widely used in remote sensing applications [46,47,48], including tree species classification [49,50,51].
2.4.1. Data Augmentation from Object-Based Image Analysis
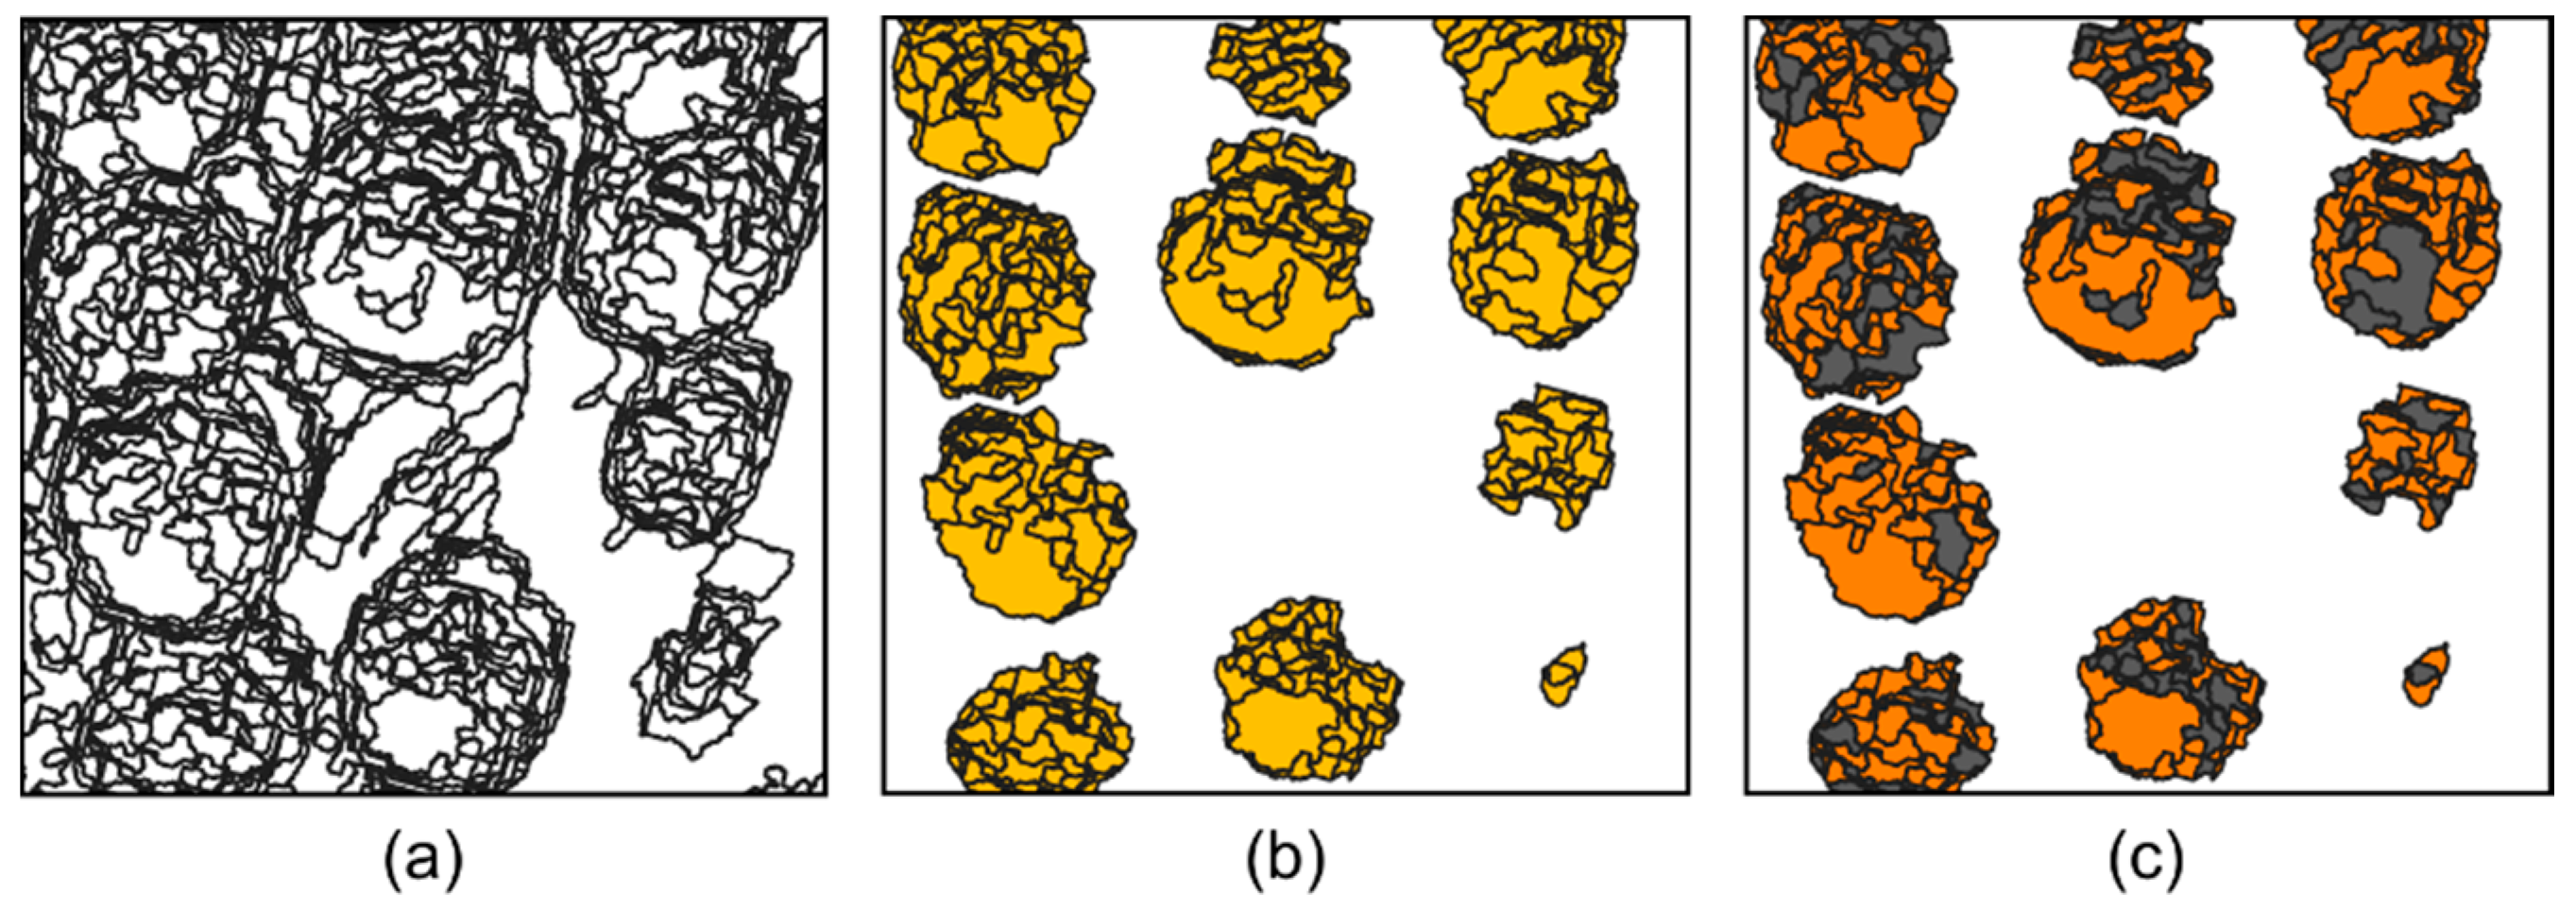
As mentioned in Section 2.1, the use of a well-characterized area with well-known behavior is essential for validation of results. However, the fact that the stand used in the study is composed of a relatively small number of samples is a challenge for ML techniques. In fact, the essence of ML is based on using a high number of observations/samples. To overcome this limitation, the number of available samples was substantially increased using an OBIA approach (Step 2 from Figure 2). This was done using large-scale segmentation based on the mean shift algorithm [52] from the Orfeo ToolBox (OTB) [53]. It requires a raster as input and results in a set of objects in vector format with a similar spectral similarity. To better discriminate tree crowns, the NIR, green, and red bands (NGR, example in Figure 4a) were concatenated and rasterized to produce a three-band false-color image. This combination of bands was revealed to be the best compromise for this specific task. To increase the number of objects produced in this procedure, its sensitivity was augmented. Therefore, the spectral radius was set to 10 while the spatial radius and minimum segment size were kept at five and 50, respectively. The originated objects which intercept the detected tree crowns inherit the same classification as their correspondent tree, being classified according to its predominant phytosanitary issue that was observed in the field. Figure 5a presents part of the output obtained from the OBIA step; the objects matching tree crowns (Figure 5b) are then used for further model training and testing (Figure 5c).
2.4.2. Feature Selection, Training, Validation, and Prediction
The created dataset is composed of the mean values of 16 features: the eight vegetation indices presented in Table 1; the green, red, RE and NIR bands; and the last four corresponding to the vegetation indices proposed in this study (see Section 2.3.1.). As such, the database connected to the objects representing the tree crowns include a column with the mean value of these features. However, given the number of features to discriminate, those may behave differently by class. Hence, to decrease the number of features, an intermediate step was introduced. For this purpose, recursive feature elimination (RFE) [54] was used (Step 3, from Figure 2). This method ranks features recursively based on their respective importance [55].
For training and evaluation of the RF models (Step 3, from Figure 2), a hold-out strategy was used by randomly performing train-test splits (70% to train and 30% to test). To avoid possible discrepancies in the solution, an average of 10 repetitions was used. The data split operation is made by considering the area of each object within each tree and using 70% of the tree crown area for training and the remaining 30% for testing. This step is applied to the datasets from each flight campaign.
To evaluate the classification procedure in the different flight campaigns, the resultant confusion matrices were analyzed. For this purpose, the following metrics were used: precision—the number of objects correctly classified for a given class divided by its total number of samples; recall—the number of correct classifications for a given class divided by its row total; and F1score—the harmonic mean of precision and recall measures. The overall accuracy and the Cohen’s kappa coefficient (K) [56]—a statistic used to measure inter- or intra-rater reliability for qualitative items—were also analyzed for a general perspective of the models’ behavior. While the overall accuracy indicates the proportion of correct classifications in the total number of samples, the kappa coefficient evaluates the performed classification while considering the possibility of the agreement occurring by chance.
To predict potential phytosanitary issues in the analyzed stand (Step 4, from Figure 2), the mean value of each tree is used. The mean feature value differs from the training values since the mean value of the whole tree crown is different from the mean value of their objects (used from training and testing). To evaluate the performance, the overall accuracy and the classification errors for each class were assessed. The predictions were made for two classes (with or without phytosanitary problems) and categorized according to the detected issue (no visible symptoms, ink disease, and nutritional deficiencies).
3. Results
3.1. Phytosanitary Characterization of the Study Area
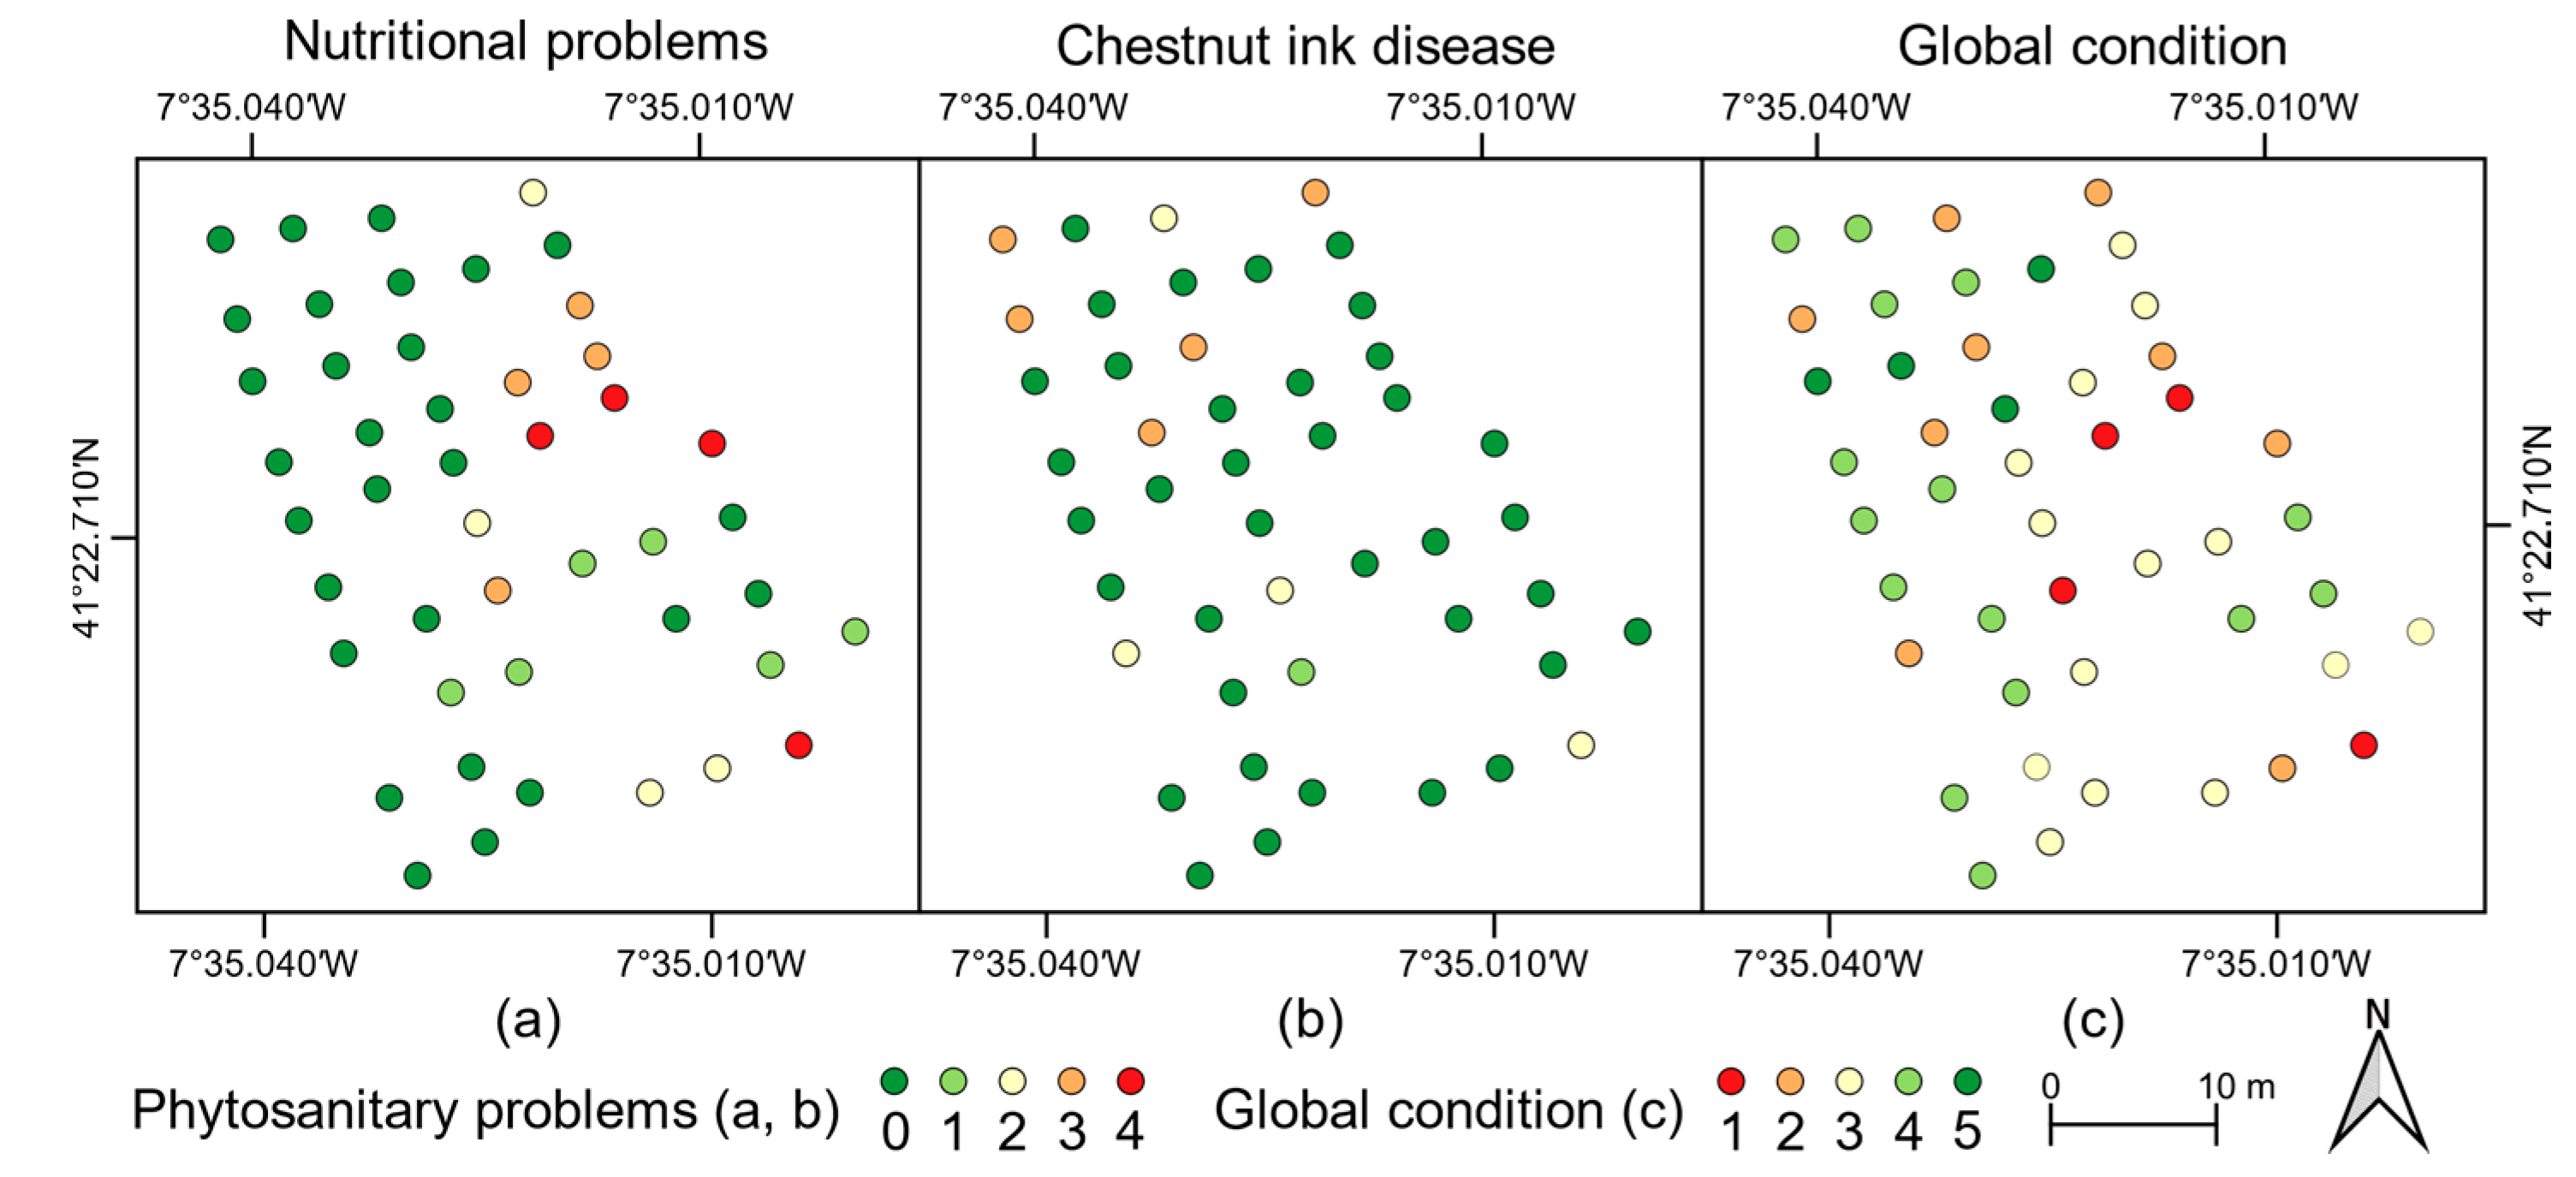
The phytosanitary issues detected in affected trees were mostly ink disease and nutritional deficiencies. Both show symptoms on tree crown and foliage: while for chestnut ink disease, the dieback can be observed by low-density foliage or even its absence in some parts of the canopy (Figure 1d), nutritional deficits are noticeable by leaf discoloration and stress symptoms (Figure 1e). From the 46 chestnut trees assessed, 16 presented nutritional deficiencies (Figure 6a), eight had a higher predominance of ink disease symptoms (Figure 6b), and the remaining 22 were considered to be without symptoms. The latter had 6.5 m mean height and a mean crown diameter of 6.5 m. Those presenting ink disease symptoms had 6.2 m mean height and 6.1 m mean crown diameter. Chestnut trees with symptoms of nutritional deficiencies had a mean height of 4.5 m and a mean crown diameter of 4.0 m. The overall mean chestnut tree height was 5.8 m, and the overall mean crown diameter was 5.6 m. The global condition of each evaluated chestnut tree is presented in Figure 6c.
3.2. Multi-Temporal Analysis
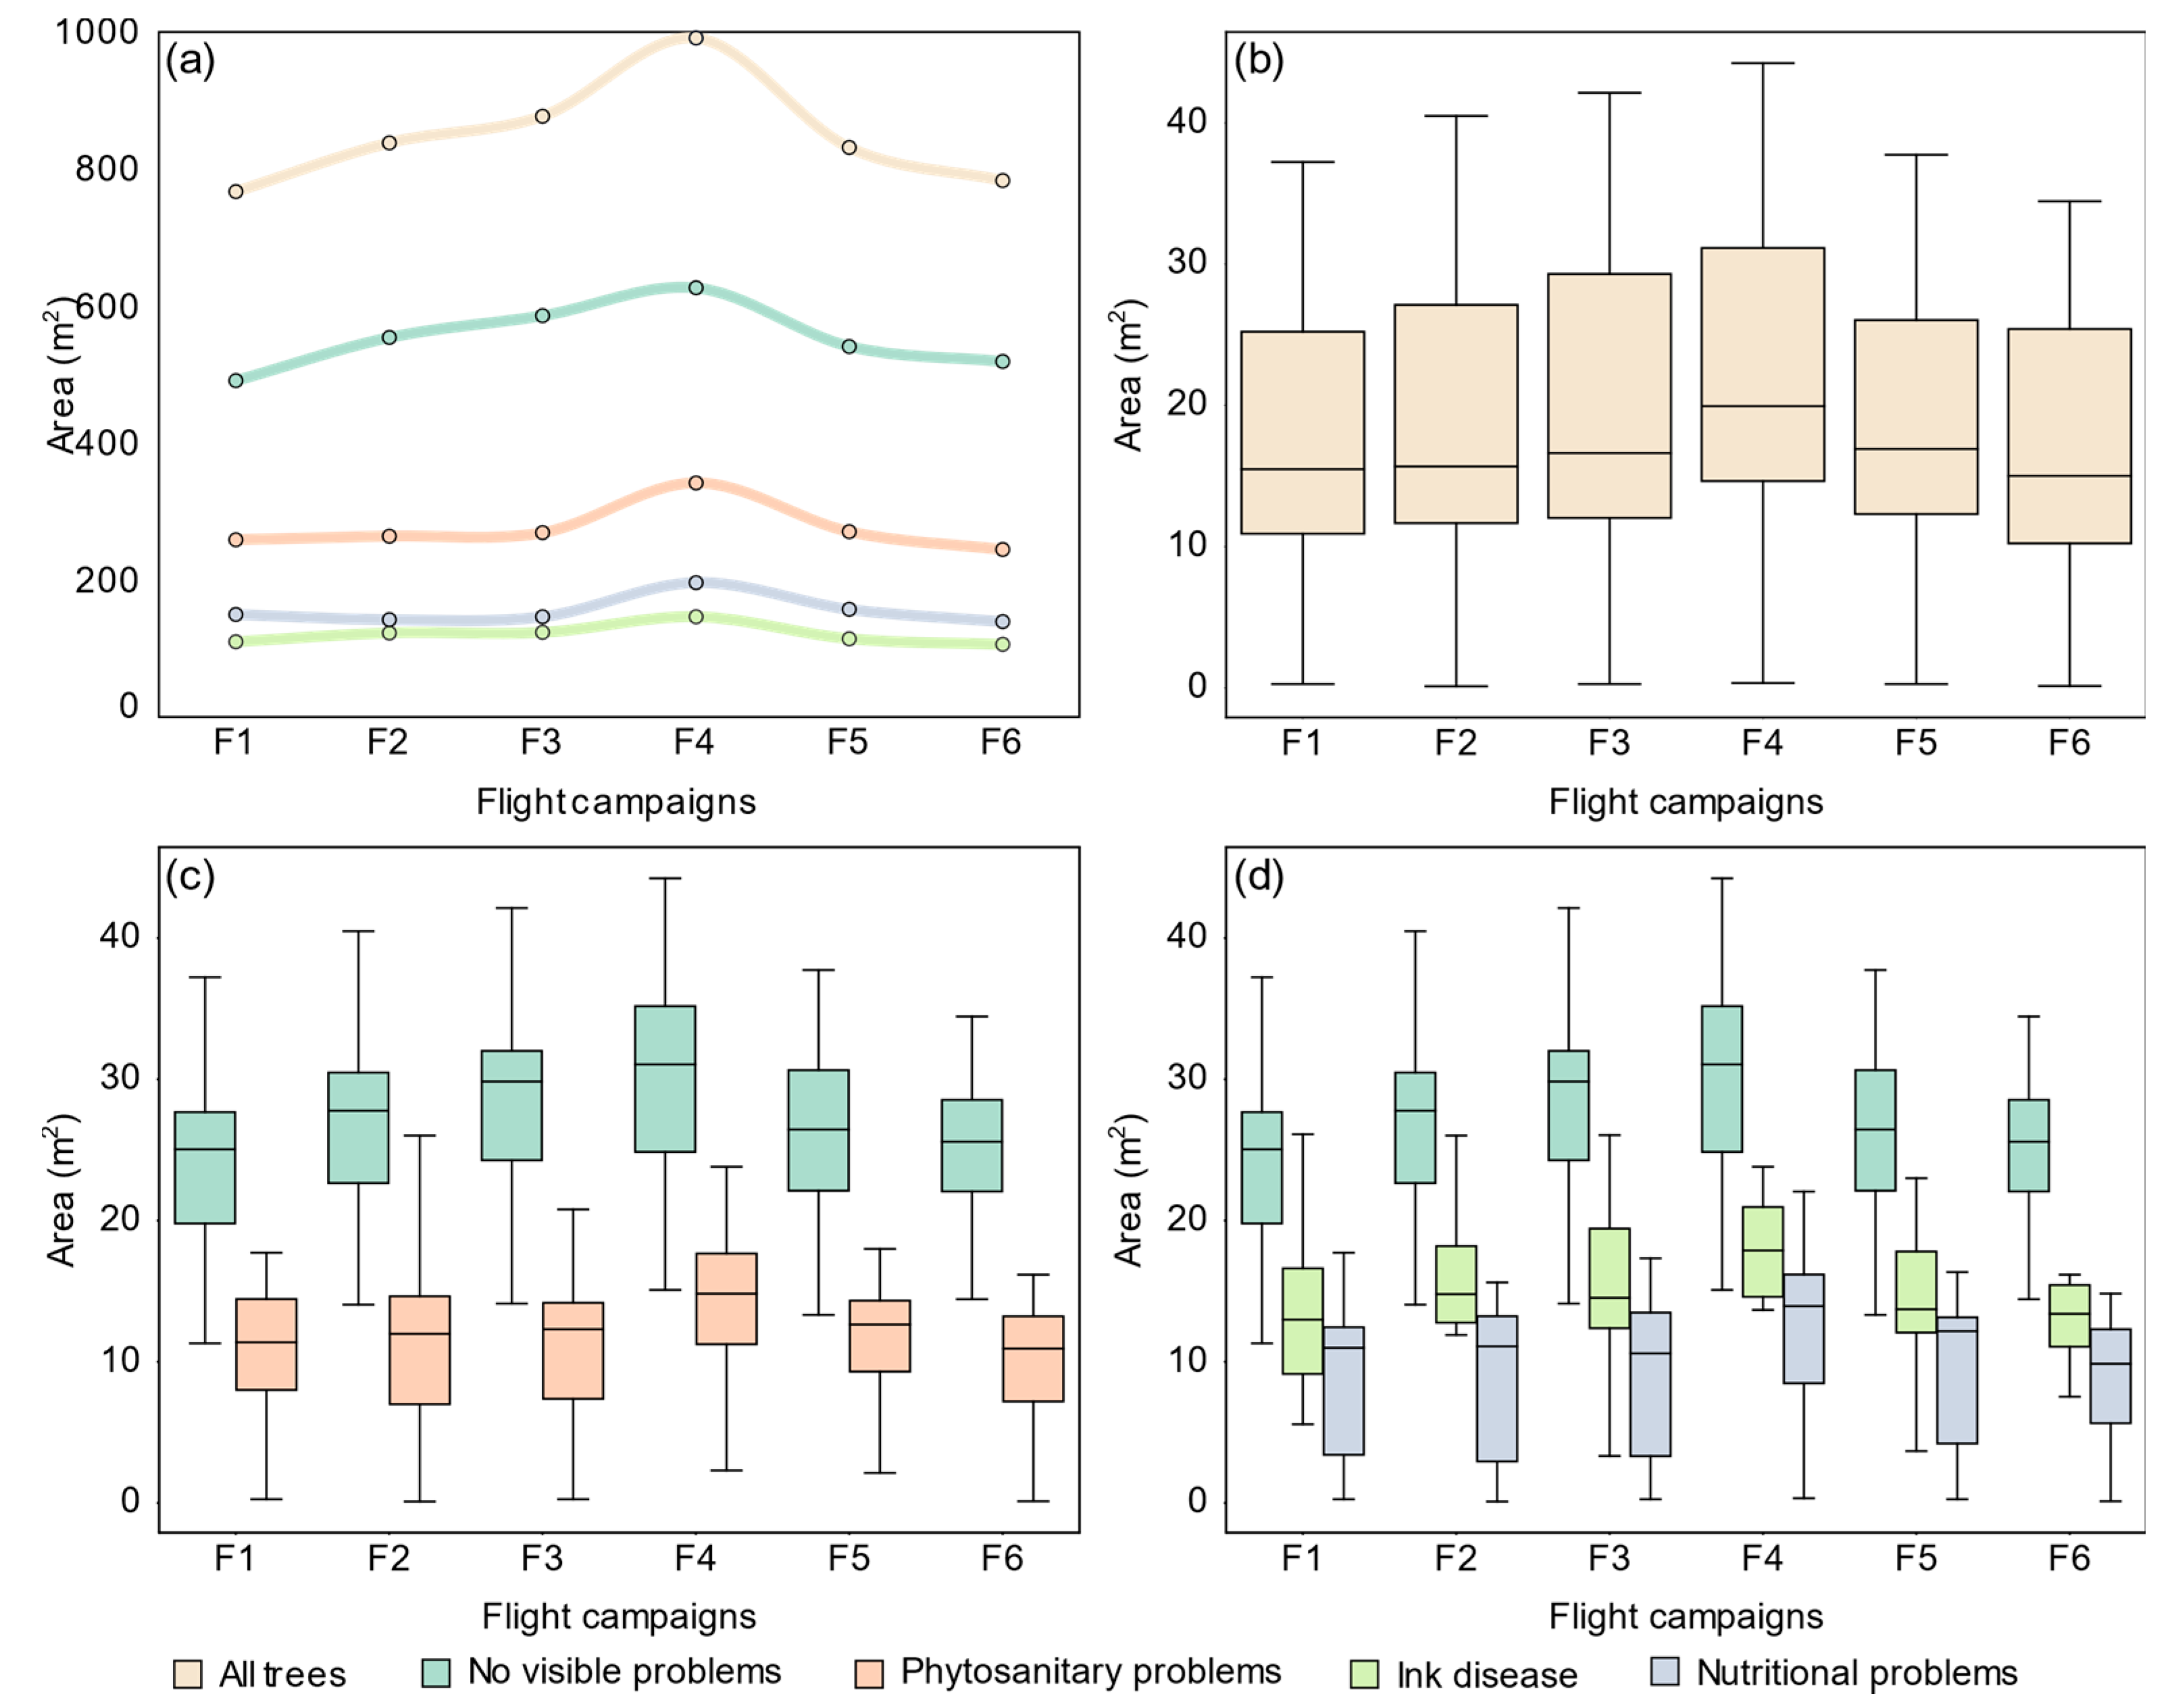
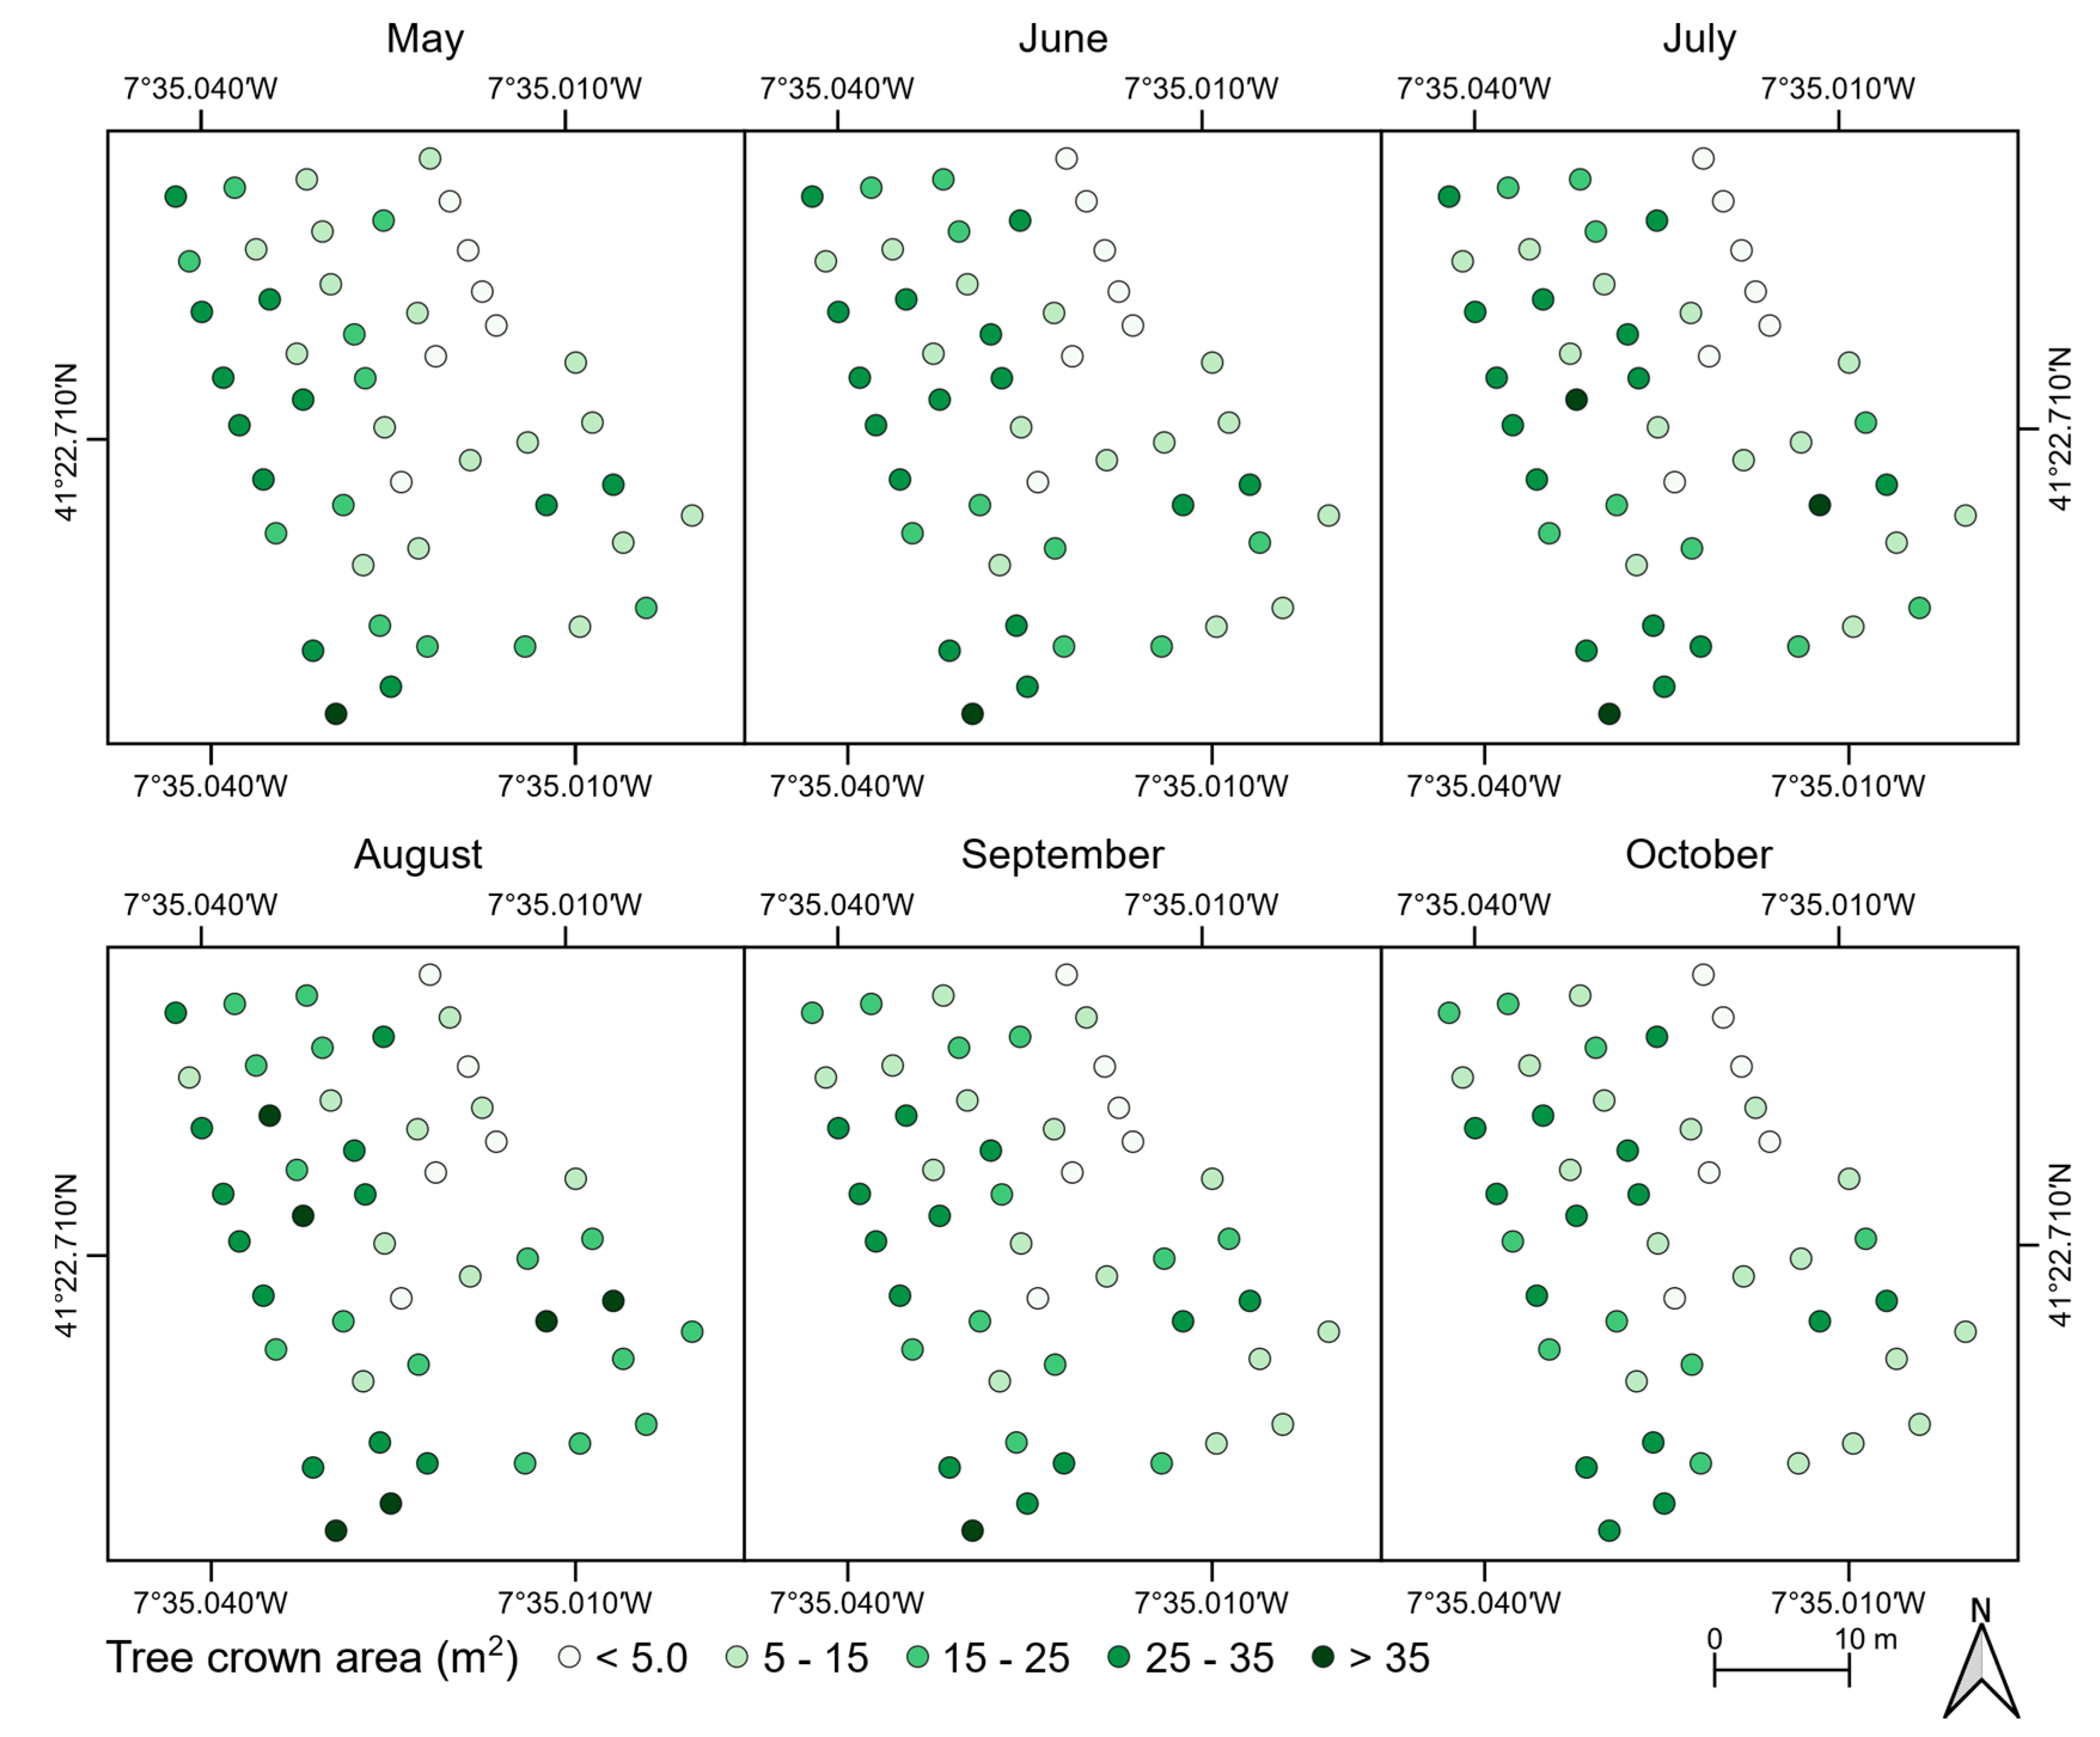
The estimated individual parameters of the chestnut trees from the different flight campaigns allowed for an understanding of the overall evolution of the stand. From these, the crown area and vegetation indices are the foremost parameters that can support multi-temporal analysis. Figure 7a presents the overall area occupied by chestnut trees, while Figure 8 depicts the individual crown area for each chestnut tree. A growth trend from the first (late May) to the fourth flight campaign (August) can be observed. From the fourth up to the last flight campaign, an overall decline occurred. The first three flight campaigns (May to June and June to July) presented a growth in area of 9% and 5%, respectively (from 767 to 877 m2), while from the third to the fourth flight campaign, a growth of 13% was verified (991 m2). In the last two flight campaigns, a decline was registered (16% and 6%, respectively), resulting in a final chestnut tree crown area of 783 m2.
Considering trees with no visible symptoms (22 trees, ~48% of the total number of trees) and trees otherwise affected by phytosanitary issues (24 trees affected by ink disease or/and nutritional deficiencies), the former represents between 63% to 67% of the crown area along the flight campaigns. Figure 7a presents the crown area of the chestnut trees (i) that had no visible phytosanitary issues detected in the in-field characterization; (ii) with phytosanitary issues, regardless of which (24 trees); (iii) affected by ink disease (8 trees); and (iv) with nutritional deficiencies (16 trees). In general, the various curves fit well in their behavior, presenting an almost linear increase in crown area until the third flight. Maximum crown area was reached in the fourth flight. Crown area decline for trees affected by phytosanitary issues was 29% (−98 m2, from 341 to 244 m2), with data acquired in the two last flight campaigns. As for chestnut trees with no visible symptoms, the area decline was 17% (−108 m2, from 626 to 519 m2). Crown areas of chestnut trees affected by ink disease or/and with nutritional deficiencies have a 30 m2 mean difference, representing 14% and 18% of the overall crown area, respectively.
The distribution of tree crown area is presented in Figure 7b–d. While some trees present a tree crown area higher than 40 m2, others present an area lower than 1 m2 (Figure 7b). Such discrepancies can be justified by the fact that the trees of smaller area represent recent plantations, carried out to replace dead trees. Considering all flight campaigns, the mean chestnut tree crown area is 18 m2. Whereas chestnut trees with no visible phytosanitary issues had a higher mean crown area (26 m2), trees affected by ink disease had 15 m2, and trees with nutritional deficiencies presented a mean crown area value of 10 m2.
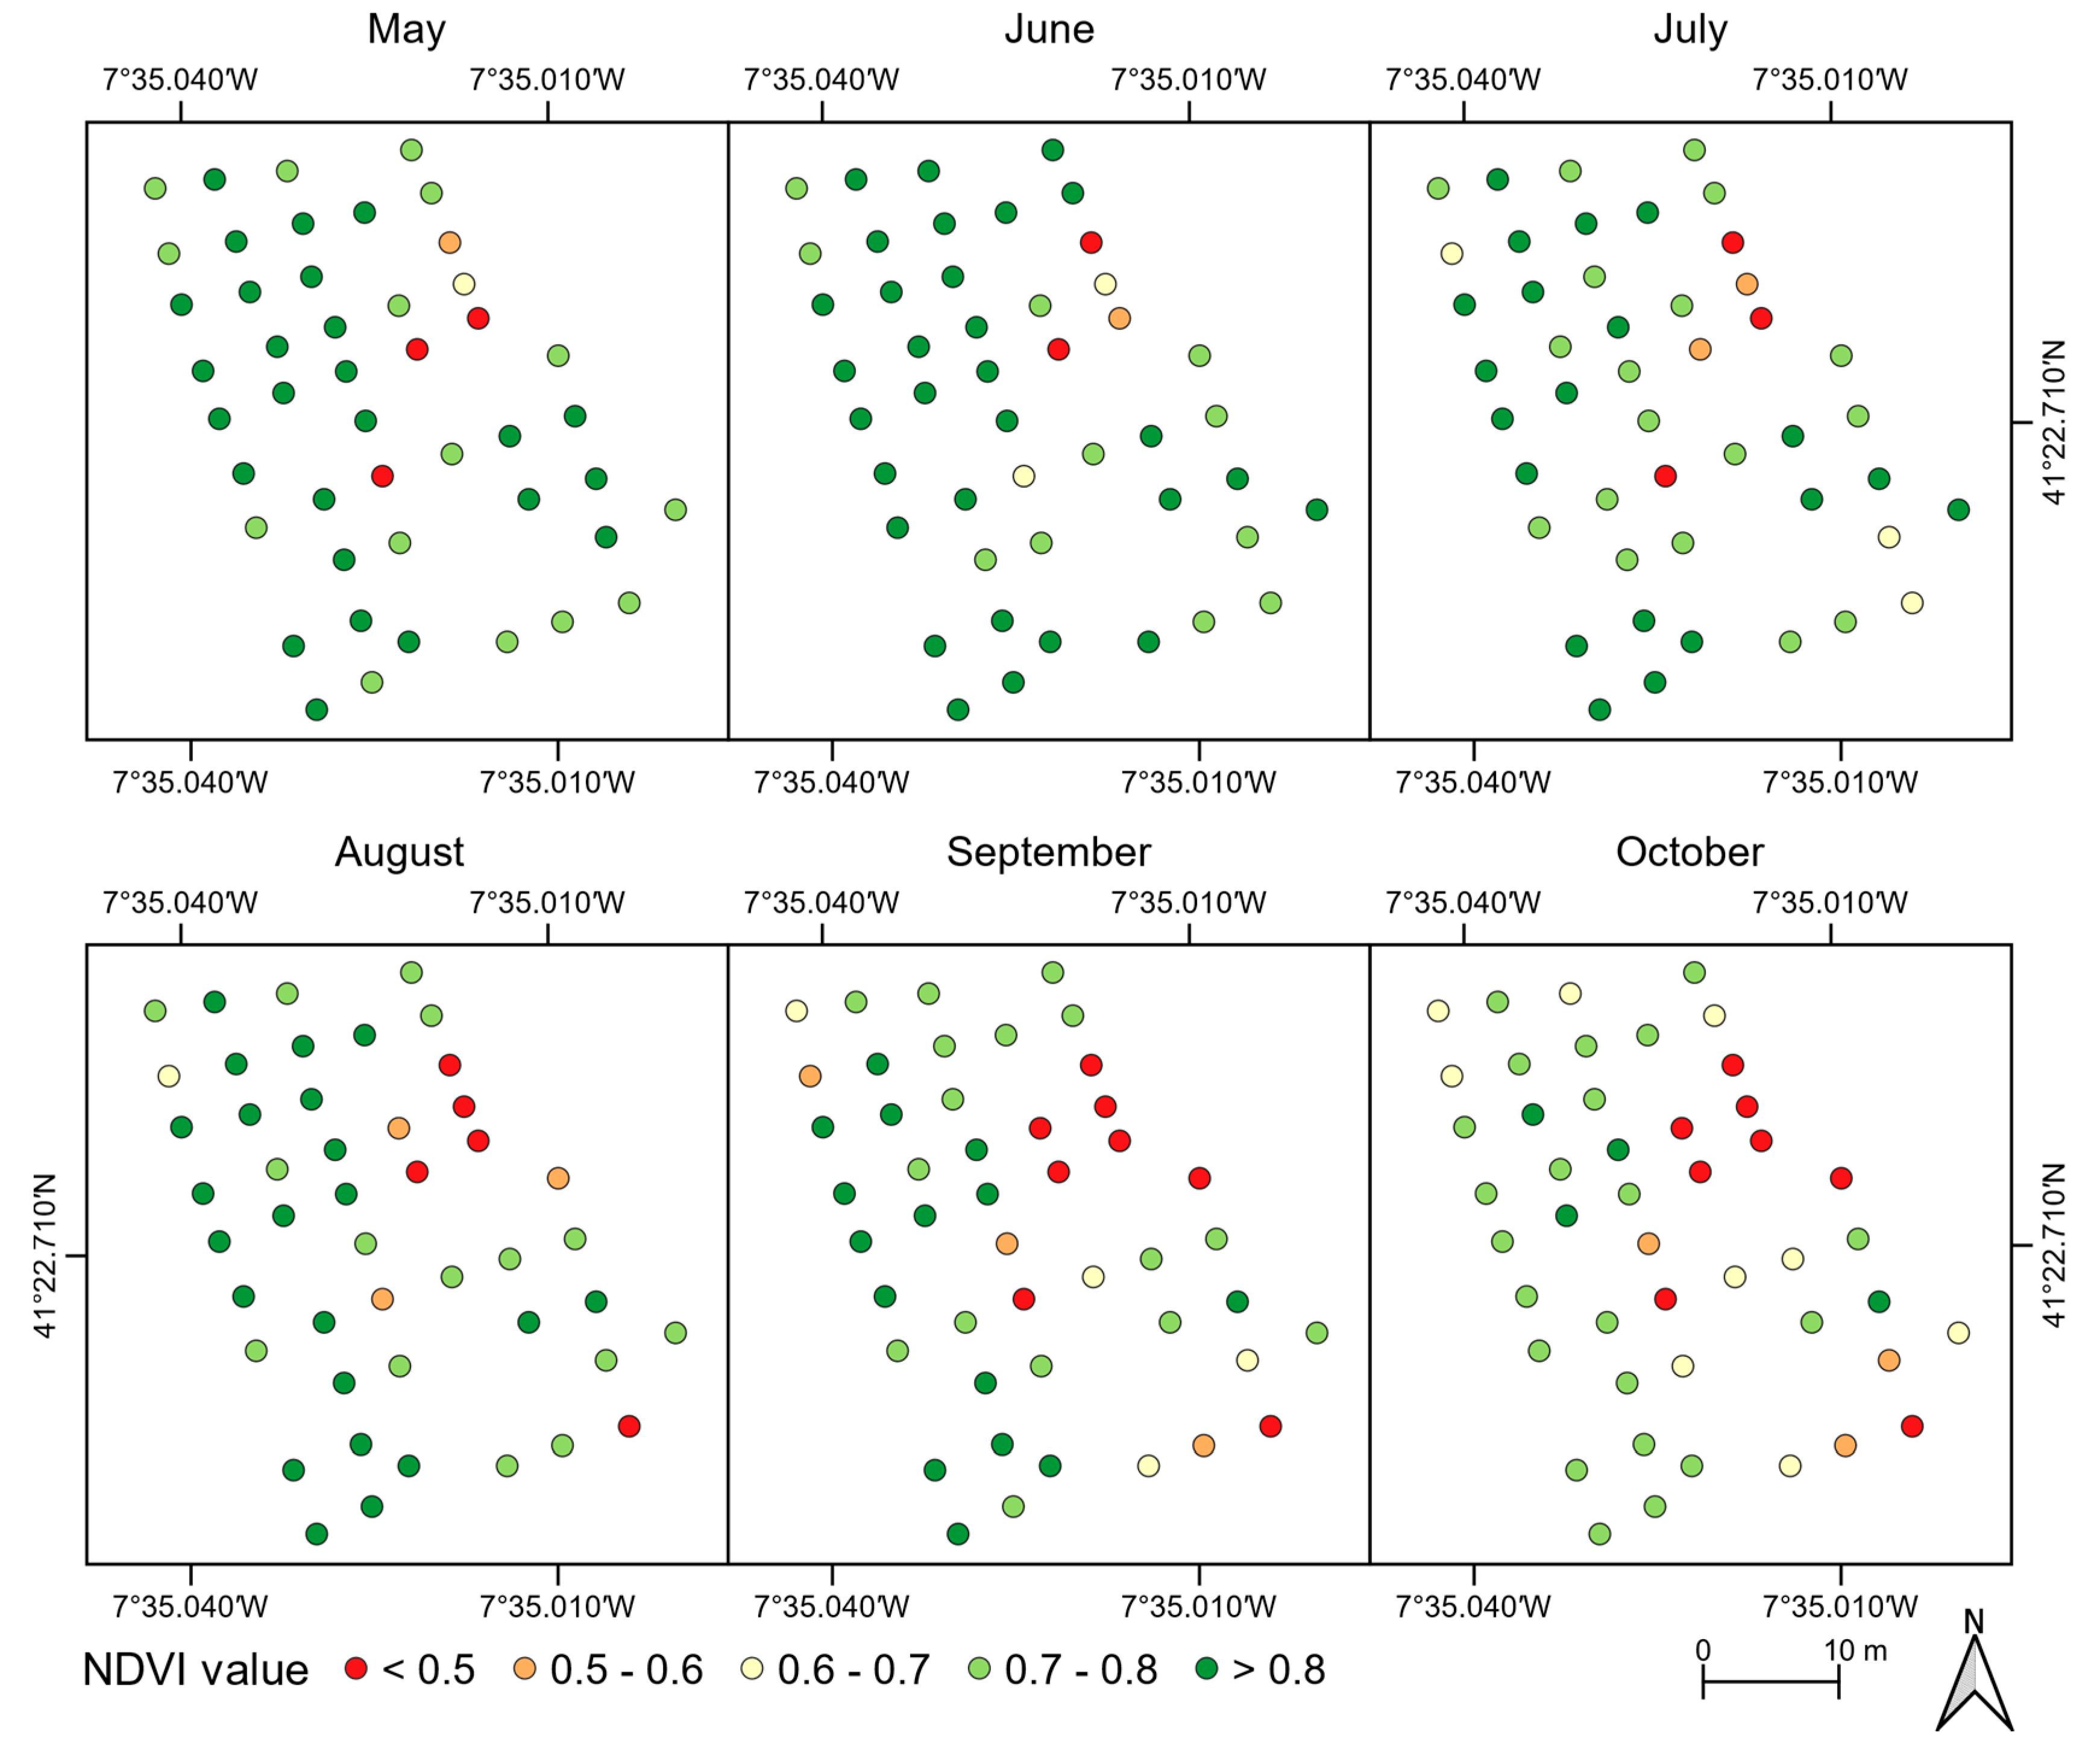
The mean NDVI value of each chestnut tree is presented in Figure 9. Slight variations can be detected in the first two flight campaigns. However, a constant decline was verified in the remaining campaigns. Chestnut trees with symptoms of phytosanitary issues presented a lower NDVI value in all flight campaigns when compared to healthy trees. Indeed, the lowest mean values were presented by trees with nutritional deficiencies. This difference increased throughout the flight campaigns. While for the first four campaigns, the mean difference—tree crown growth—was −0.06 for trees affected by ink disease and −0.17 for those that showed nutritional deficiencies, for the last two flight campaigns—tree crown decline—these were −0.09 and −0.32, respectively.
3.3. Detection of Trees with Phytosanitary Symptoms
The individual tree crown projections obtained with each flight campaign were subjected to an OBIA procedure to output a set of objects (step 2, in Figure 2). Naturally, each set has a different number of objects due to canopy area evolution and appearance over time. An average of 1650 objects was obtained throughout all flight campaigns. While 1527 objects were identified in May, that number grew in the following two flight campaigns—1668 in June and 1720 objects identified in July—and decreased in August (1389 objects). Then, it grew again in the last two flight campaigns, with 1452 objects identified in September and 2165 in October. These variations can be explained by changes in the canopy appearance over time, which result in reflectance alteration. The latter can be justified either by the dieback observed in the overall leaf discoloration and/or by the presence of some chestnut fruits, which results in higher spectral differences among each tree crown. As for the distribution of objects per class (considering the average of all epochs), the class of healthy trees has a higher number (67%), while the class with phytosanitary issues is left with the remainder (33%). Ink disease represents 15% and nutritional deficiencies 19% of the latter class.
3.3.1. Dataset Description and Feature Selection
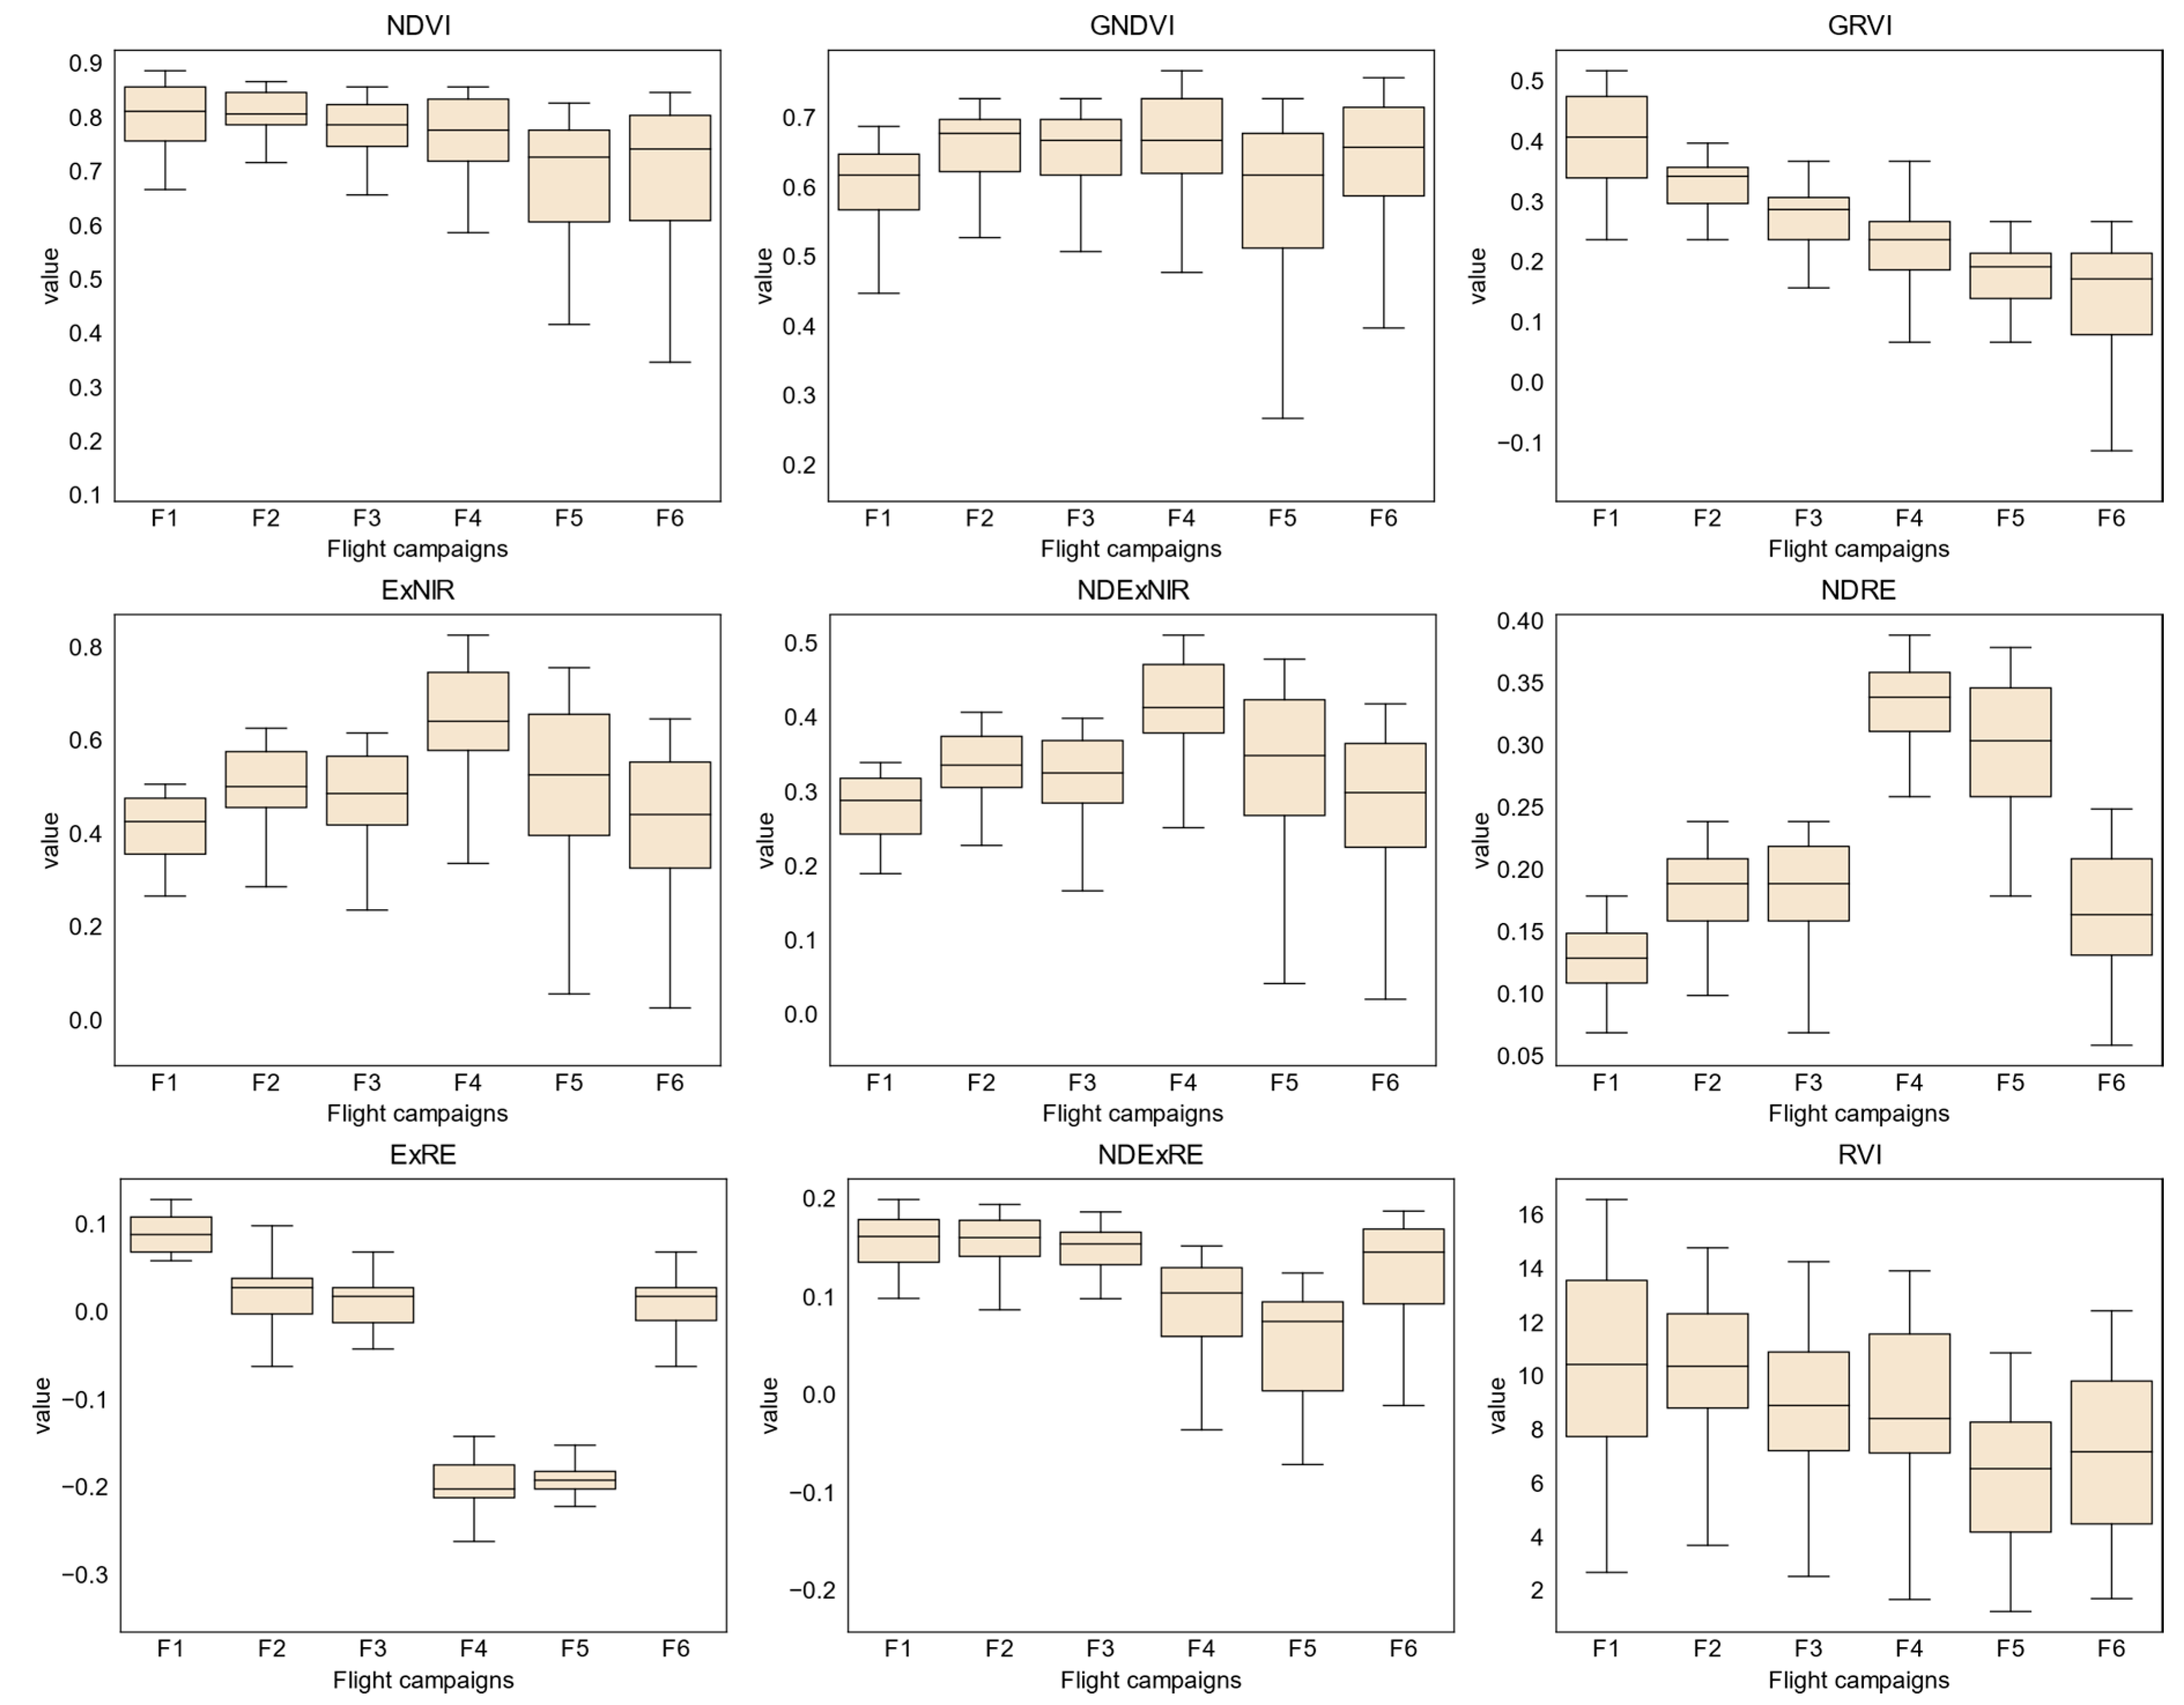
Figure 10 presents the trends for vegetation indices throughout the flight campaigns. Excluding RVI—for the first campaign—the majority of the vegetation indices present values disposed in a shorter interval. However, in the last flight campaigns, values are spanned on a larger interval. An example is NDVI: it tends to decrease in value but presents an increased value span in the last two flight campaigns. GNDVI shows a different trend, increasing in the first four flight campaigns and decreasing in the last ones. As for GRVI, it presents an overall decline along the flight campaigns. ExNIR, NDExNIR, NDRE, ExRE, and NDExRE present a similar behavior, increasing in value from the first to the second flight campaigns, followed by a small decrease in the third flight campaign. Hereinafter, values increase again in the fourth campaign and decrease in the last two flight campaigns. Lastly, RVI presents values spread over a larger interval in almost all flight campaigns, being lower in the last two.
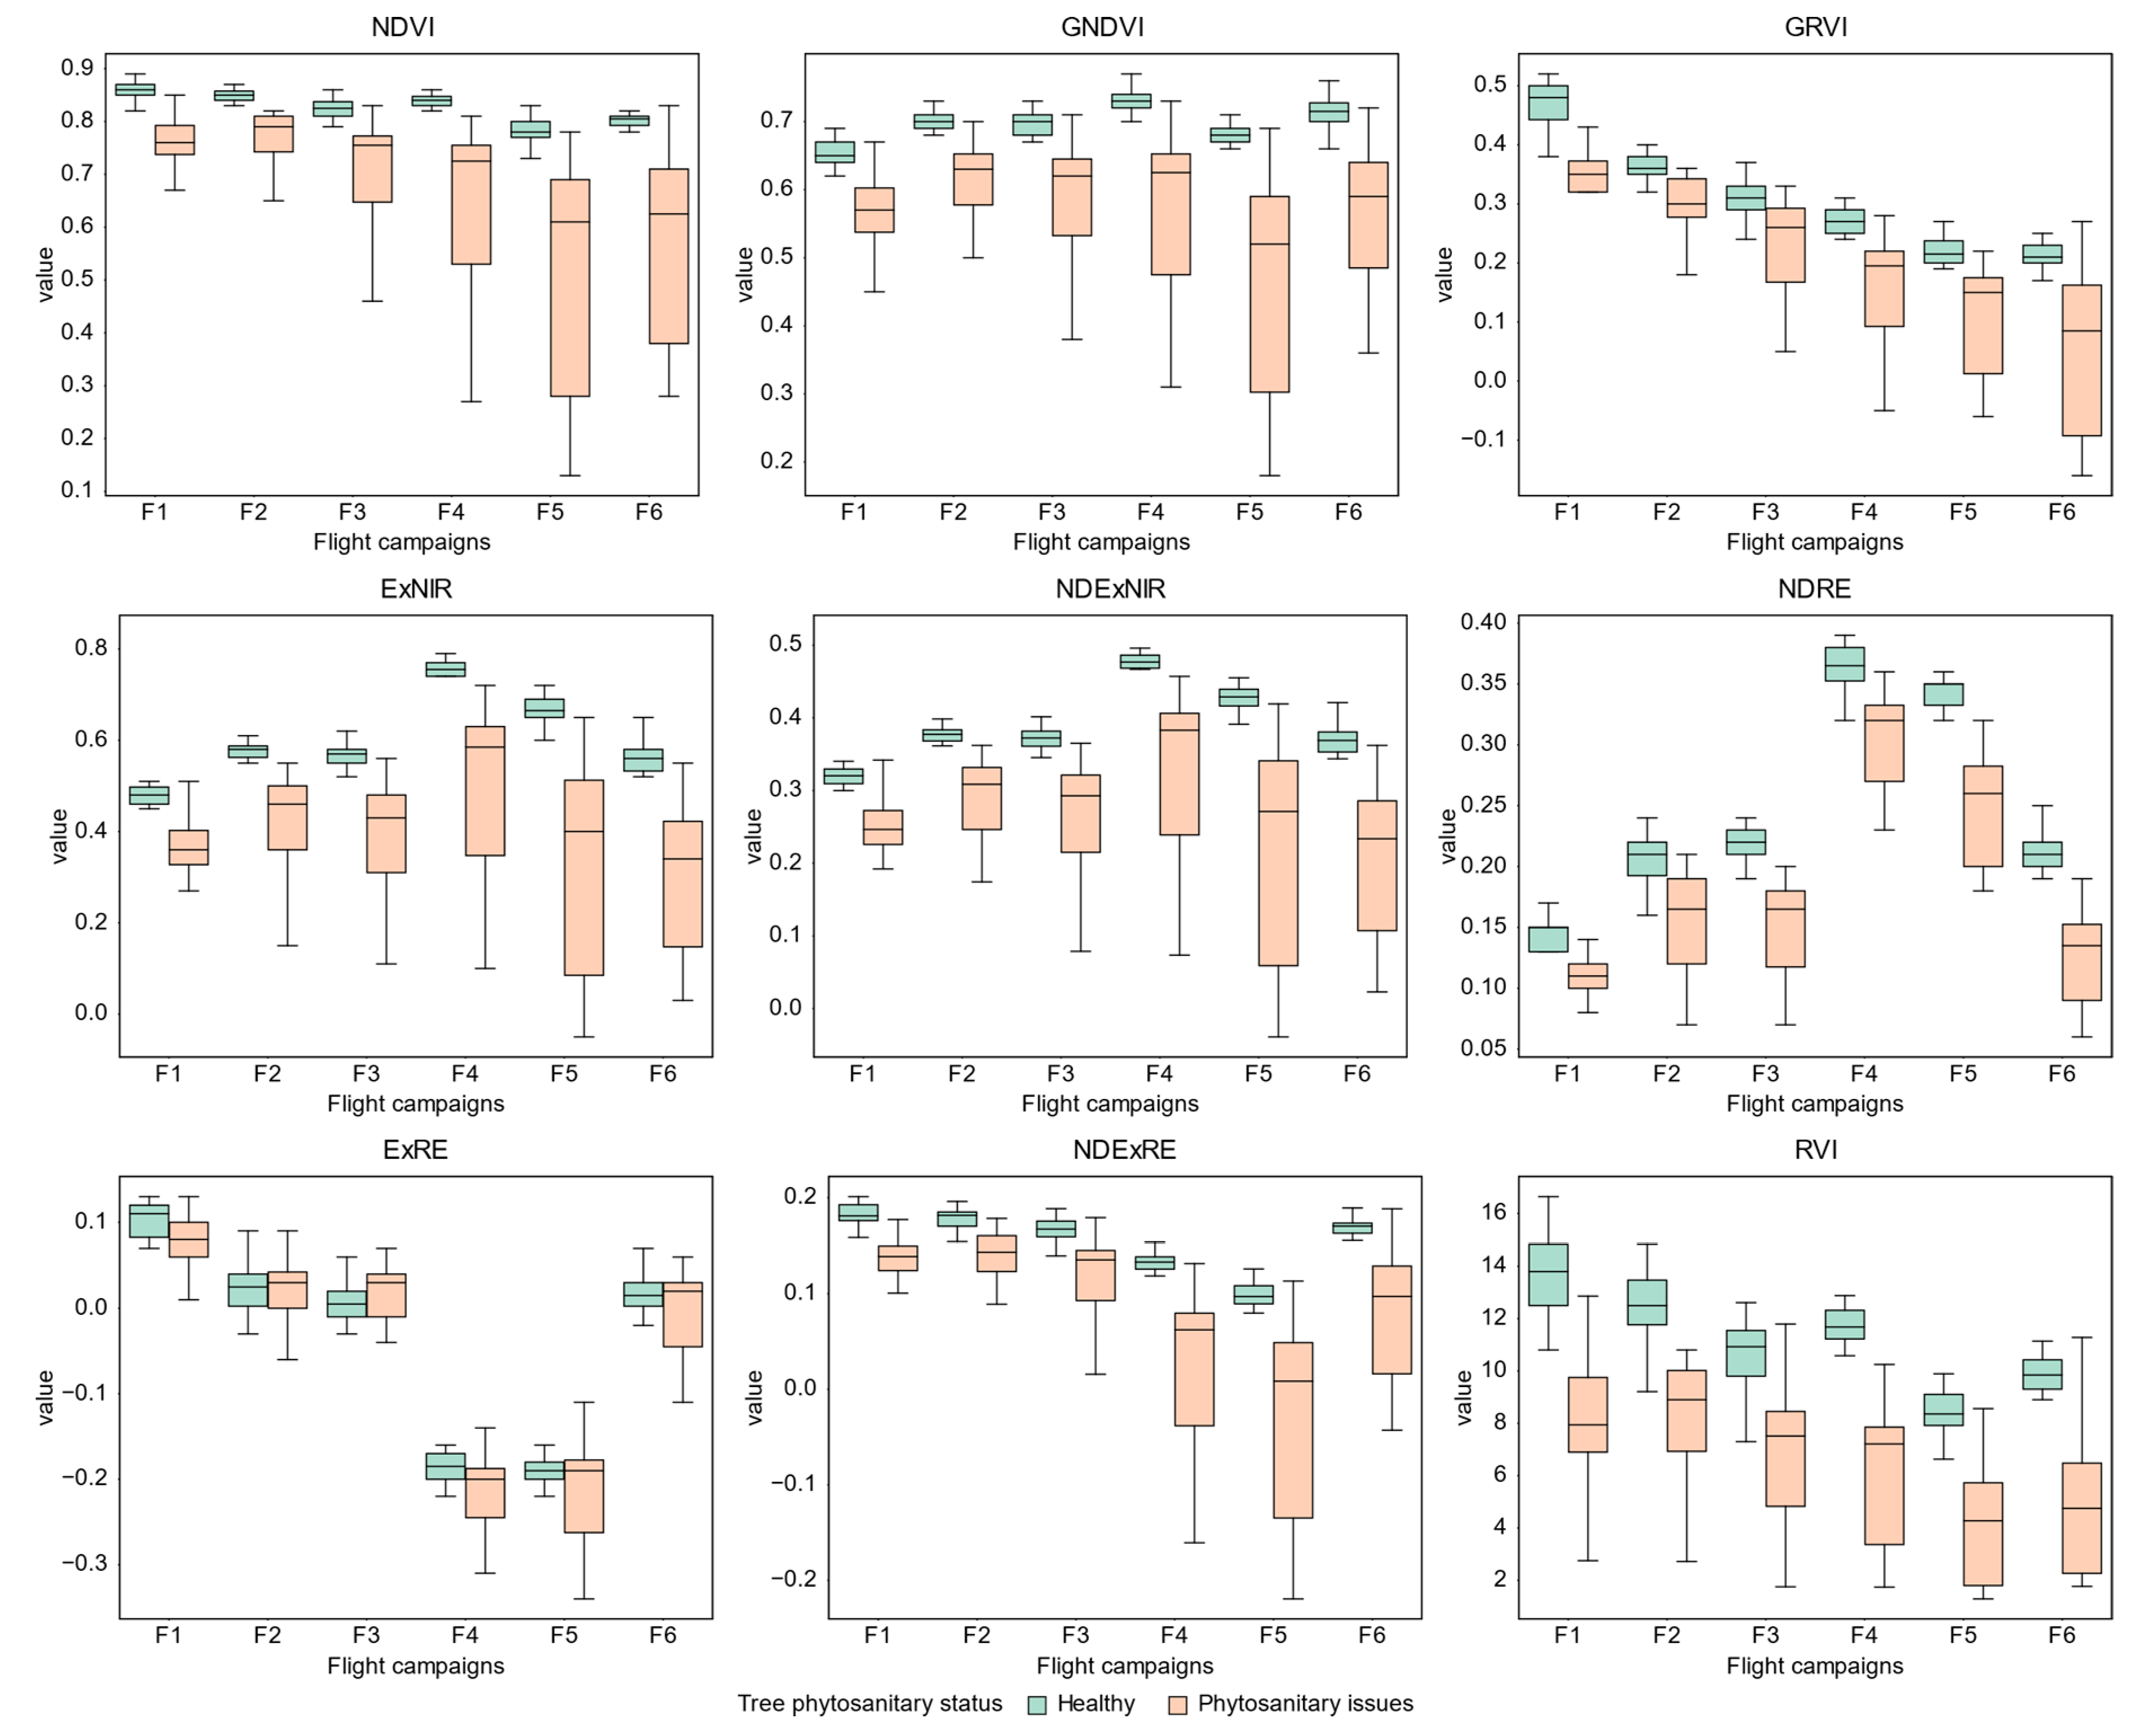
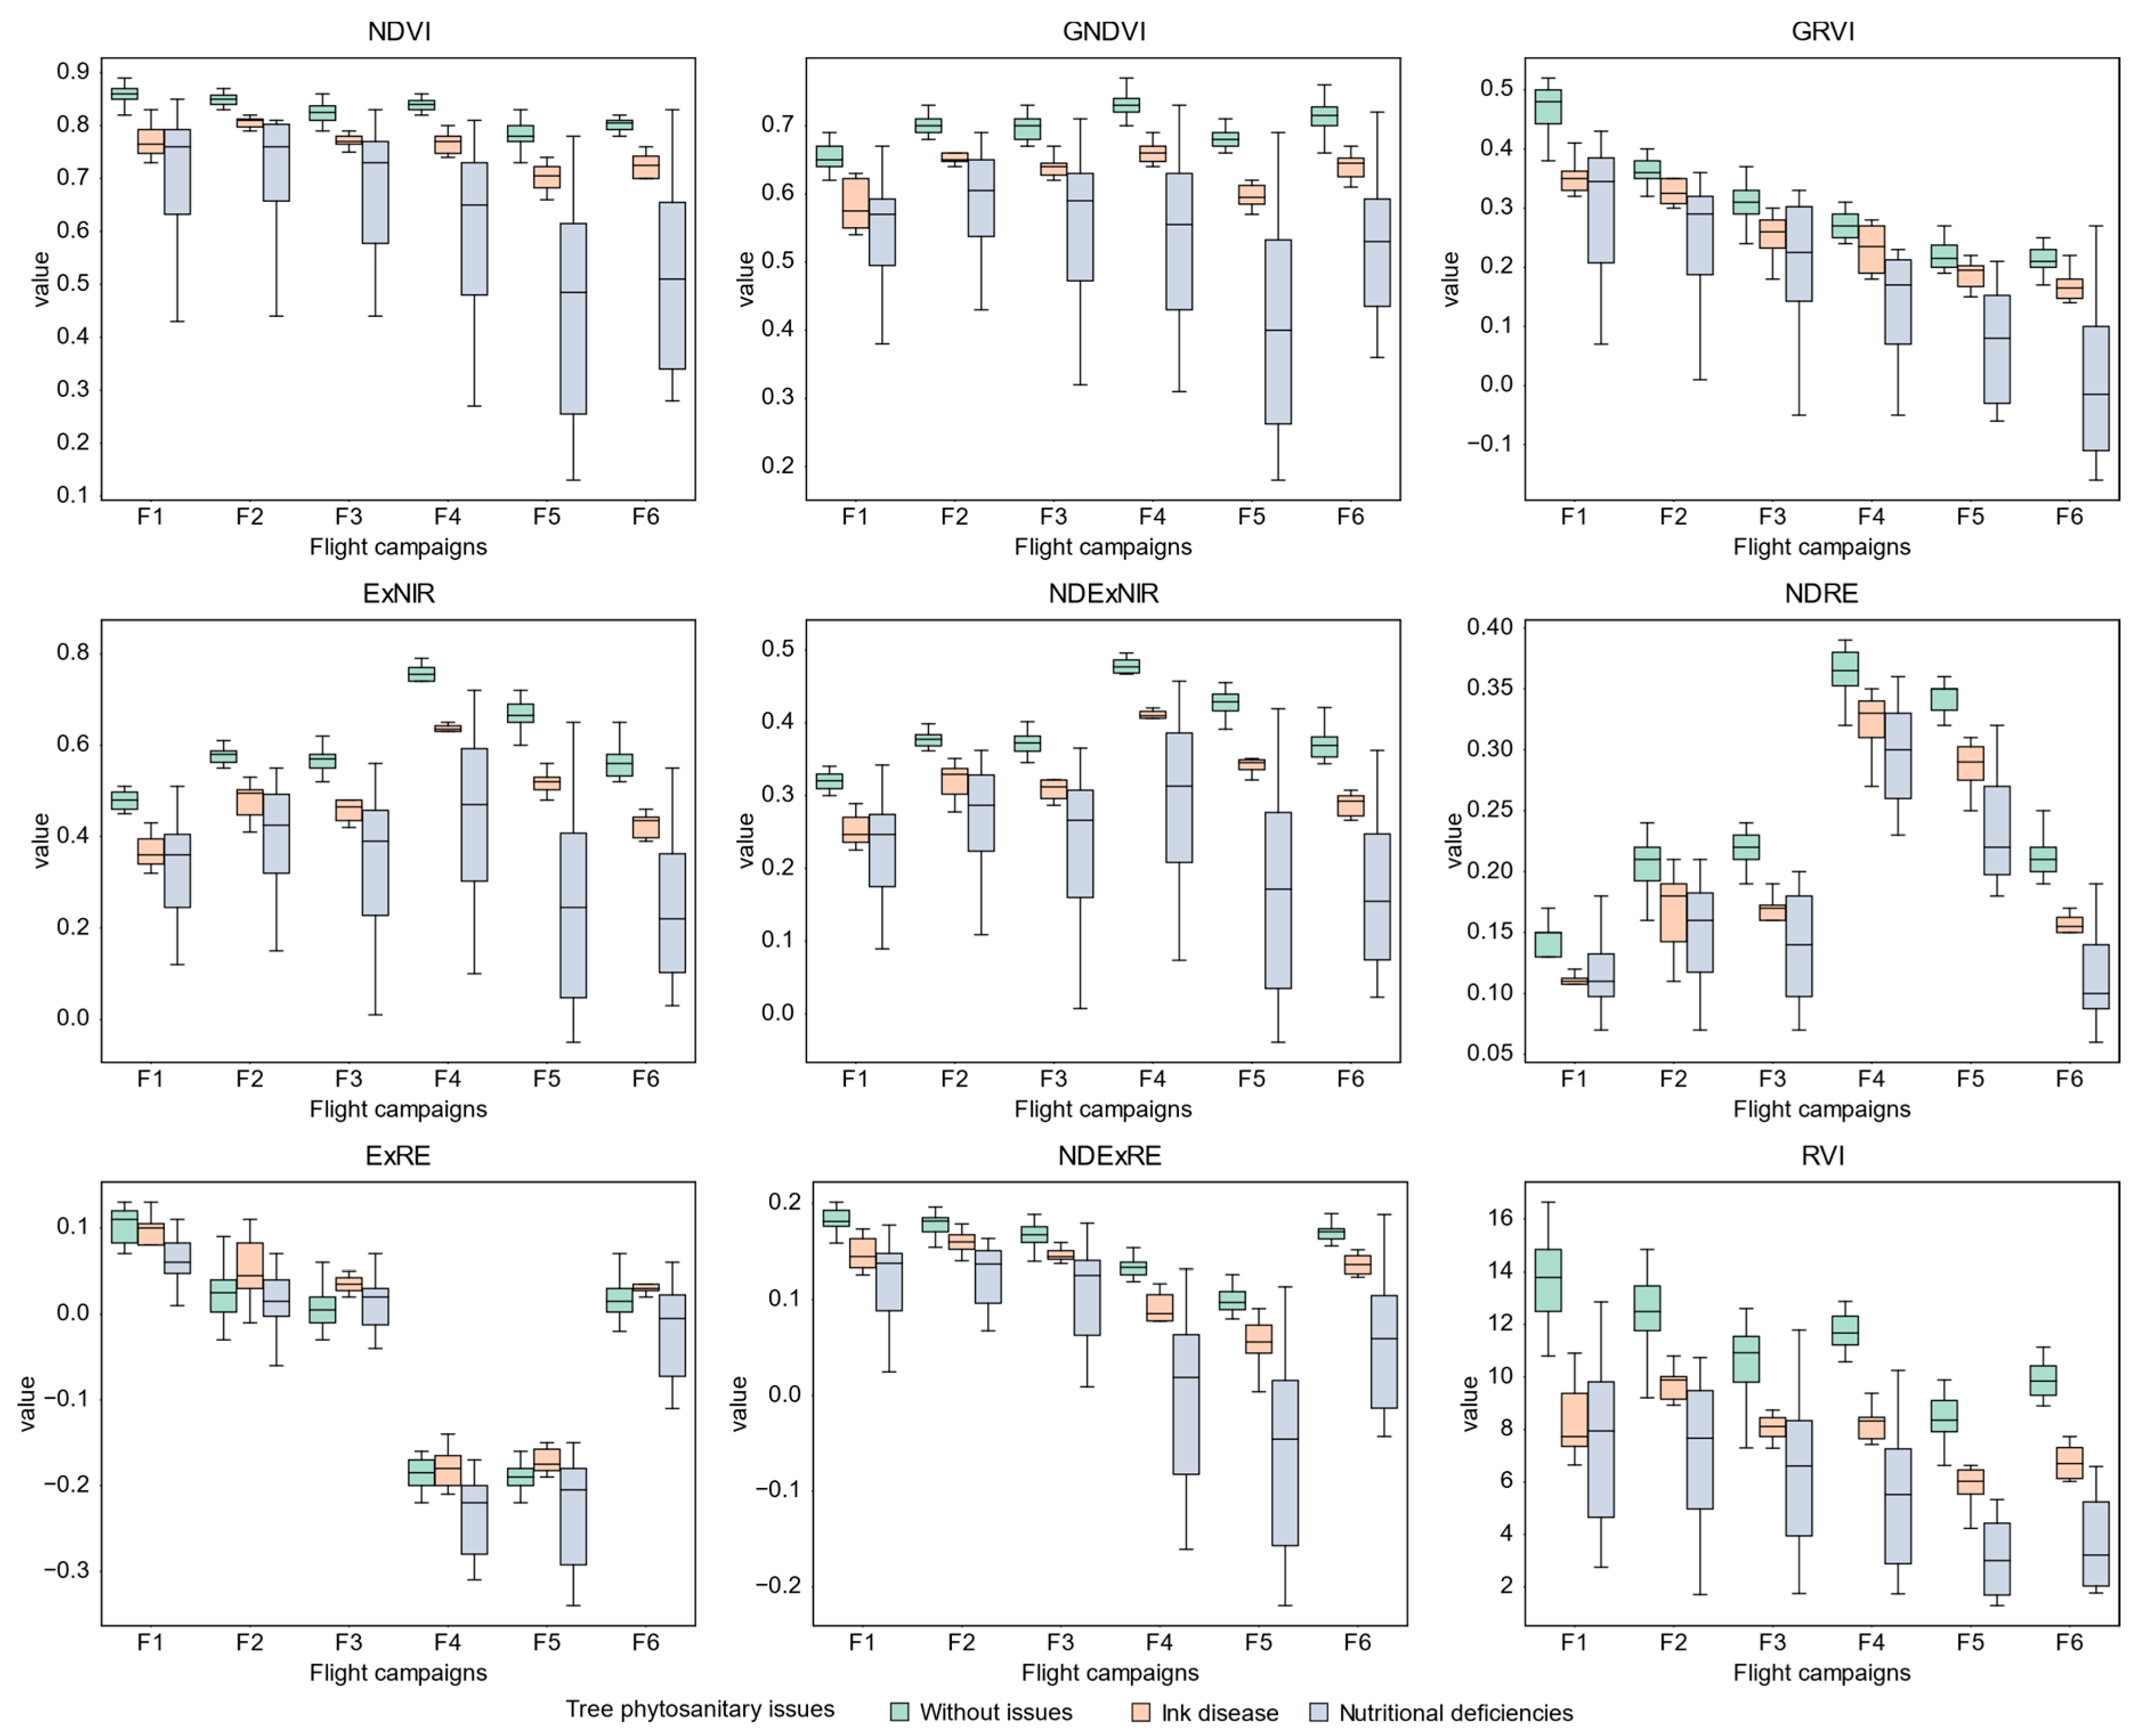
When analyzing the values of the vegetation indices automatically extracted from the detected tree crowns—considering trees with or without phytosanitary symptoms (Figure A1)—both classes are distinguishable by their interquartile range (IQR). Trees presenting ink disease and/or nutritional deficiencies can be clearly distinguished from those that are healthy in all flight campaigns and by vegetation indices, with the exception of ExRE (see distribution in Figure A2). Moreover, ExRE is again the exception when comparing values between healthy trees and those affected by chestnut ink: in the remaining vegetation indices, the latter presented lower values. As for nutritional deficiencies, only the third flight campaign of ExRE presents a higher value when compared to healthy trees. It should also be noted that trees affected by chestnut ink disease had higher values in comparison with those affected by nutritional deficiencies.
Feature selection based on RFE allowed for understanding the influence of features extracted from each object on the RF classifier. These results are presented in Table A1. By analyzing the overall results—achieved by adding all ranks and sorting the features by their lower value—when considering two and three classes, the top ten features are the same in both situations (highlighted in bold in Table A1). As such, those features were selected to be used in the subsequent analysis.
3.3.2. Random Forest Classifier and Dataset Performance Evaluation
The model was trained by using ten random selections of 70% of each tree crown area per epoch. It was then tested using the remaining 30%. The mean accuracy of the ten random splits and their standard deviations were used to evaluate the model performance.
Table 2 presents the results when considering only two classes: absence or presence of phytosanitary issues. Datasets acquired from all flight campaigns obtained an overall accuracy equal or higher than 85%. The highest value (91%) was achieved in September’s flight campaign. As for accuracy statistics (kappa index), a substantial agreement (kappa > 0.65) was obtained in all flight campaigns. From July onward, kappa was always equal or higher than 0.71. Regarding metrics, when each class is analyzed individually—precision, recall, and F1score—the healthy tree class achieved better results. When comparing each flight campaign, June and May showed similar results. However, a higher standard deviation was observed in May. Similarly, July, August, and October presented similar results. Still, results from August are slightly lower.
Table 3 presents the results obtained when distinguishing between specific phytosanitary issues of ink disease and/or nutritional deficiencies. The minimum overall accuracy is 80% (May and August flight campaigns) and the highest (85%) was achieved in the September and October flight campaigns. However, the statistical significance of the results differs: a moderate agreement (kappa > 0.55) was registered in May, while in the remaining epochs, the value increased. Indeed, the highest value was in September (0.69). July and October also registered a kappa value of at least 0.65. Regarding each class classification, F1-score was always higher than 0.90 for trees without phytosanitary problems. As for the other two classes—affected by ink disease and/or by nutritional deficiencies—the F1-score was lower. Nonetheless, the class containing trees affected by nutritional deficiencies had better results.
3.3.3. Detection of Chestnut Trees Affected by Phytosanitary Issues
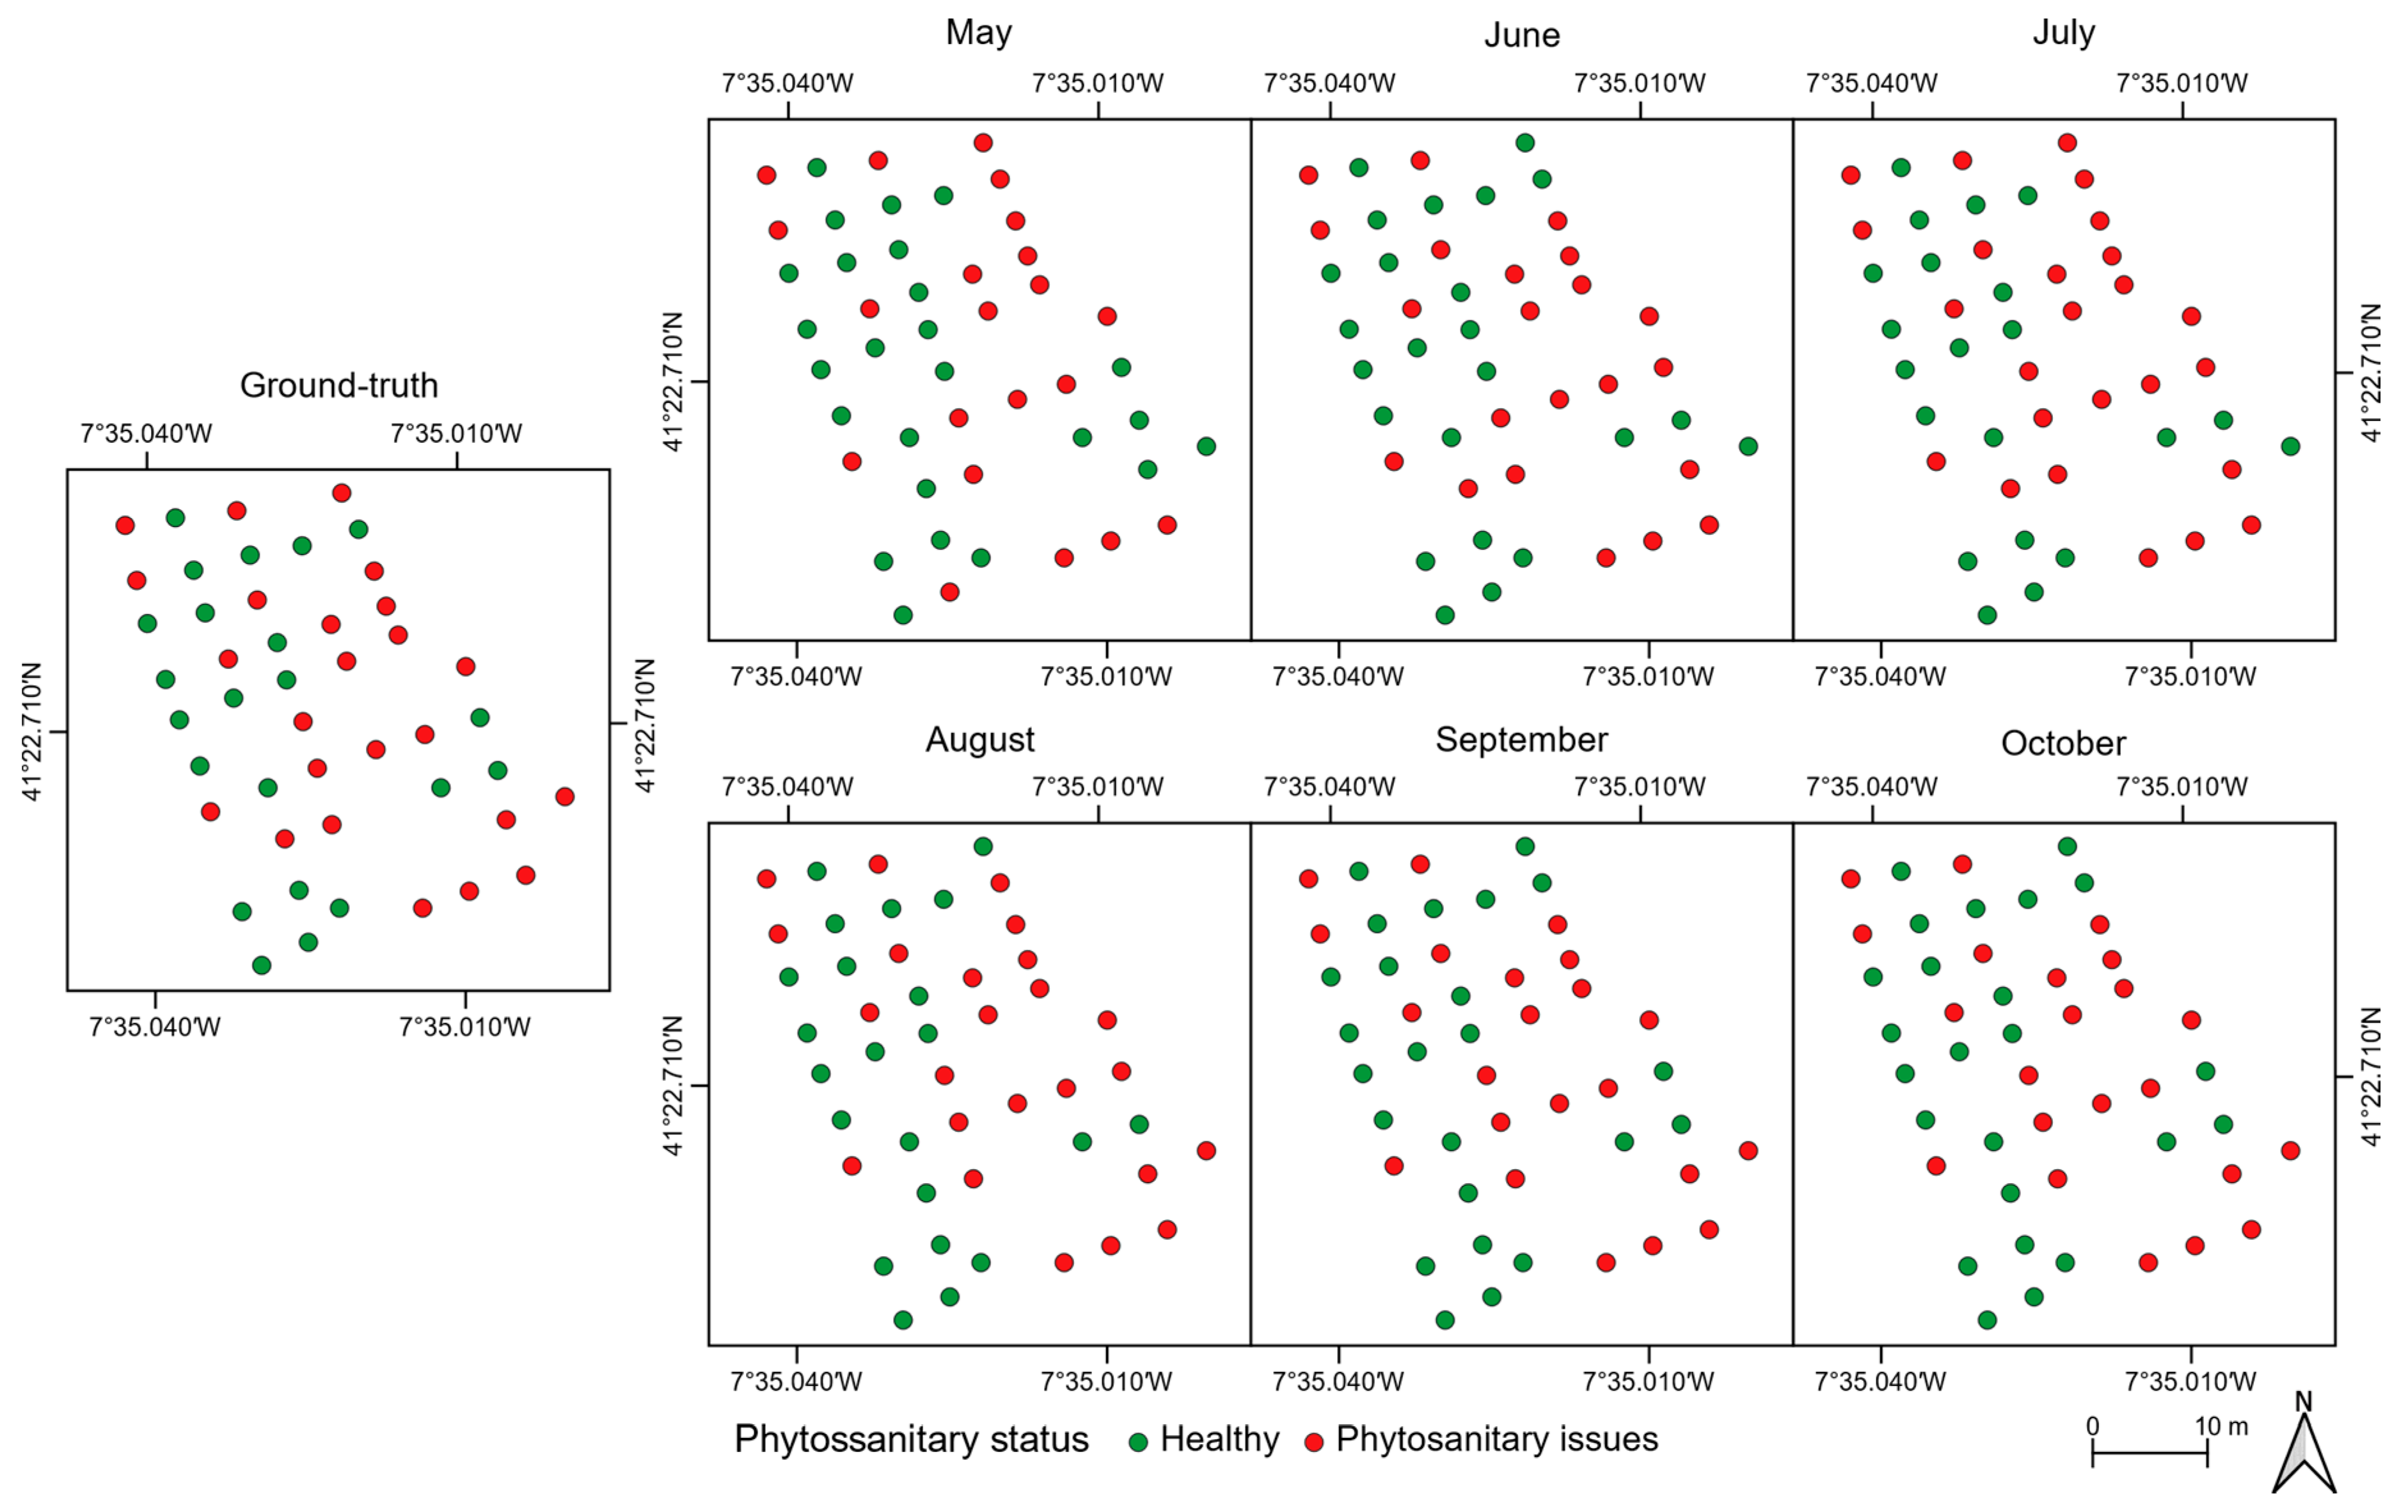
The mean value of each tree crown feature was used to assess whether it was affected by phytosanitary issues. Results are presented in Figure 11 and Figure A3a. The overall accuracy is equal to or higher than 85%. The lowest value was achieved in May (85%) and the highest in the last two flight campaigns (96%). In the remaining flight campaigns, the overall accuracy is 91% in both June and August, and 94% in July. Indeed, the earliest flight campaign in the season (May) had the most misclassifications—seven chestnut trees, representing about 15% of the total number of chestnut trees monitored (46): two healthy trees were classified as being affected by phytosanitary issues and five the exact opposite. The number of misclassified chestnut trees without visible symptoms was consistently low in the remaining flight campaigns: one in June, and two in both July and August. As for misclassified chestnut trees with phytosanitary issues, there were three in June, one in July, and two in the remaining flight campaigns.
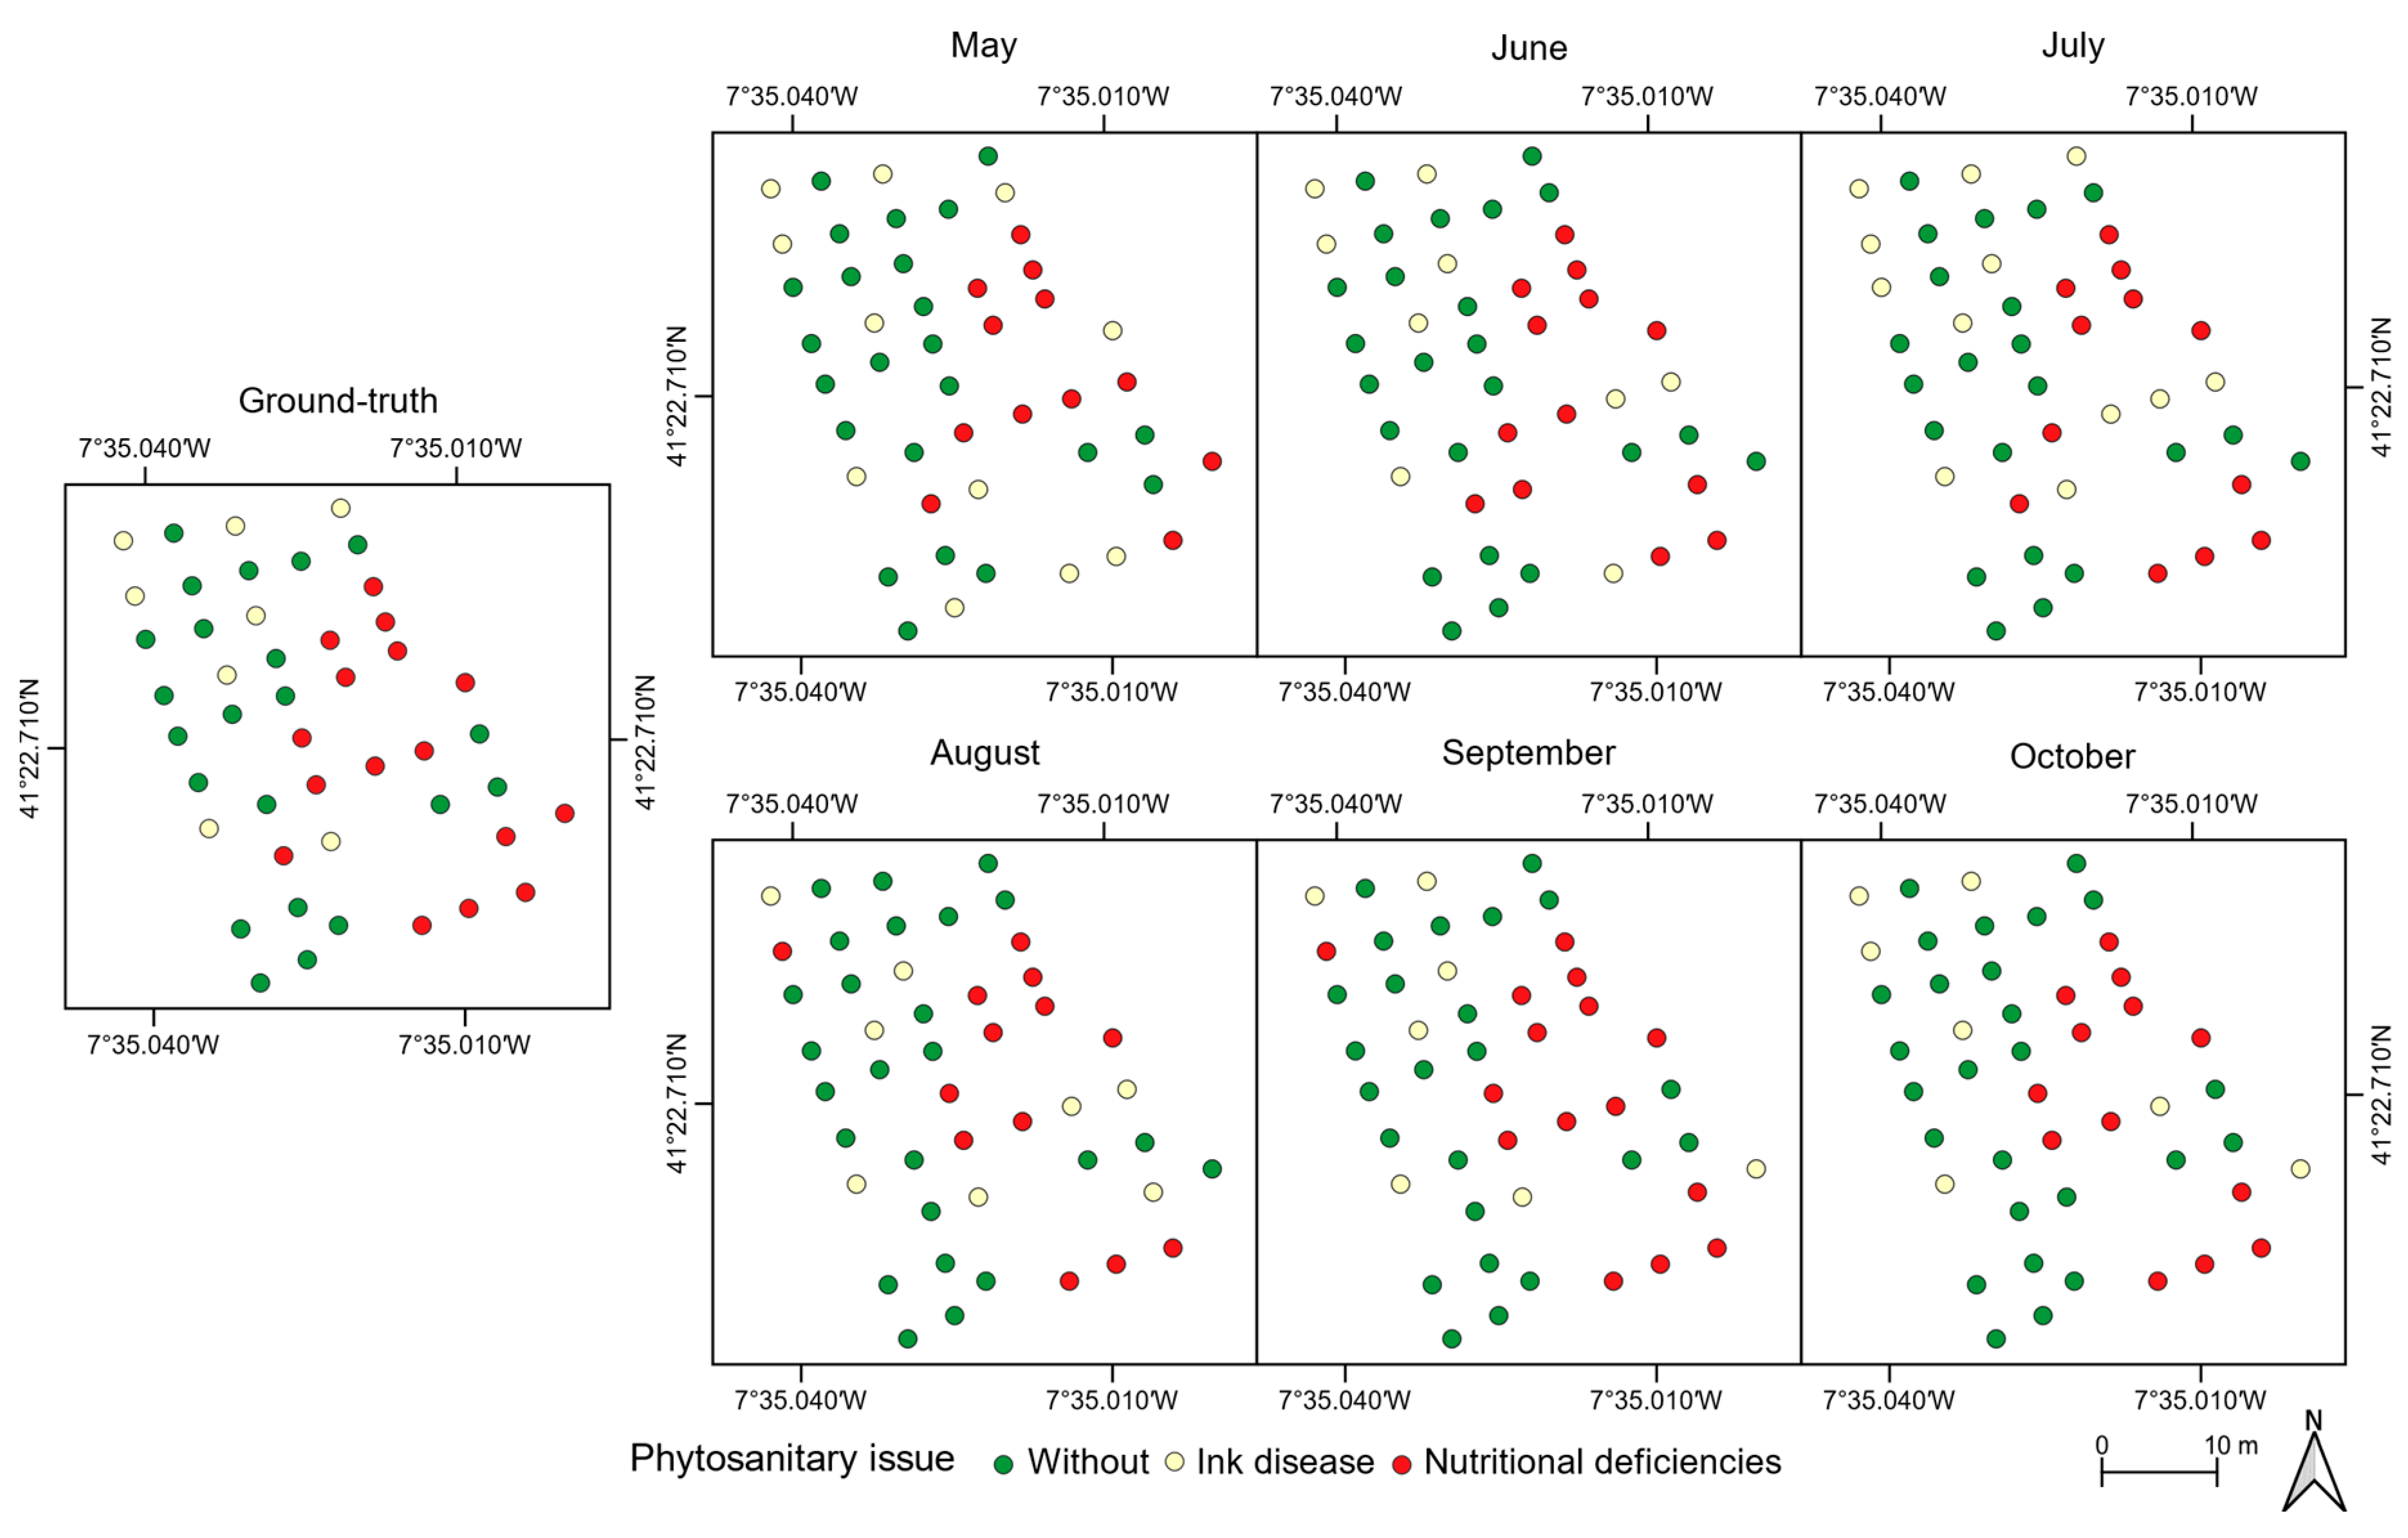
Figure 12 presents the assessment results when using three classes (no visual symptoms, ink disease, and/or nutritional deficiencies). The higher overall accuracy value is achieved in September (91%) and the lowest in May (78%); see Figure A3b. The remaining flight campaigns present a relatively stable overall accuracy value, ranging between 83% and 87%. Chestnut trees without visible symptoms present the lowest misclassification values (5% overall). No misclassifications were observed in both September and October. Moreover, in July, there were no misclassifications in chestnut trees affected by ink disease. Affected trees were mainly misclassified as having no phytosanitary issues: there were two misclassifications on average (August and October had three). Regarding chestnut trees affected by nutritional deficiencies—an average of four misclassified trees considering all flight campaigns—they were misclassified in both of the other two classes: 10 in healthy trees and 12 in trees affected by ink disease.
4. Discussion
The multi-temporal data analysis enabled characterization of both spatial and temporal variability of the studied chestnut stand. Studies on chestnut trees management rely only on yearly flight campaigns [16] to monitor the overall condition and to study vegetation decline [15], limiting the intra-seasonal monitoring of potential issues. Indeed, no intra-seasonal multi-temporal studies were found for chestnut trees, and these can be fundamental for detecting potential phytosanitary issues earlier on, which will enable timely mitigation actions. Furthermore, each tree can automatically be classified regarding its phytosanitary status as affected, ink disease or nutritional deficiencies, or healthy.
Regarding the crown area for the monitored chestnut trees throughout the season, it is of note that it increased from May to August and decreased hereinafter. This trend is verified more often in healthy chestnut trees (see Figure 7 and Figure 8). Those affected by phytosanitary issues presented a smaller crown area growth in the first three flight campaigns. The west side area of the stand had higher NDVI values throughout the analyzed period (Figure 9) while the opposite was verified in the east. Whereas the size of the chestnut trees—smaller precisely in the east area (Figure 8)—can explain this because it usually means lower foliage density, trees affected by phytosanitary issues are mostly located in that area (see Figure 6). A clear distinction between trees with and without phytosanitary problems (Figure 7c), and between phytosanitary problems can be observed.
The crown area of chestnut trees affected by ink disease are usually larger when compared to the ones from trees affected by nutritional deficiencies (Figure 7d). The latter present a small increase in crown area in August. As for NDVI, while chestnut trees affected by phytosanitary issues presented decreasing values throughout the season, this trend is less clear-cut in chestnut trees affected by ink disease. With reference to the feature selection procedure, the proposed vegetation indices were among the ones with best discrimination performance. This can be explained by the fact that spectral differences are more significant when addressing symptoms caused by the studied phytosanitary issues (Figure 3). Spectral bands can also be considered less relevant features than vegetation indices. Indeed, green, NIR, and RE bands did not perform well when compared to the VIs, which was not verified in studies using RGB-based vegetation indices [57].
The employed methodology can be regarded as accurate not only when classifying chestnut trees as affected (or not) by phytosanitary issues (Figure 7c), but also (when affected) in distinguishing which phytosanitary issue is present in each case. The crowns detection for individual trees employed in this study allow for discarding most outliers unrelated to chestnut trees, such as soil and low-height vegetation, while other studies relied on OBIA with more steps [58]. As such, an ML classification step to detect trees is not a requirement.
When considering the possibility of having a chestnut tree affected by a phytosanitary issue (Table 2, Figure 11 and Figure A3a), the obtained results show that, both in testing and detection, September’s flight campaign data had the best accuracy rates. While similar results were achieved in October, the kappa value was slightly lower. Remaining campaigns also achieved good accuracy values. May corresponds to an early phase of the chestnut’s phenological cycle, when most symptoms caused by phytosanitary issues are not yet clearly noticeable. This justifies the higher standard deviation observed in May. However, when three classes are considered—healthy, ink disease, and nutritional deficiencies—the overall accuracy generally decreases (Table 3, Figure 12 and Figure A3b). Again, September’s data outperform those of the remaining flight campaigns. Whilst the October flight campaign presented better results when distinguishing ink disease, this can be explained by environmental factors: chestnut trees were exposed to longer periods of low/no precipitation (causing low soil moisture) and higher temperatures than those registered in the summer, which result in trees having more stress and, therefore, to manifest a higher incidence of phytosanitary symptoms [59]. On the other hand, this decrease in classification can also be related to the chestnut harvesting season (and, therefore, trees start their senescence). Currently, to mitigate the occurrence of chestnut ink disease, hybrid chestnut trees are being used with good results [60].
It should be noted that some chestnut trees did not present symptoms uniformly. Indeed, some parts had similar spectral responses than healthy trees. Despite values in Figure A1 and Figure A2 having a different separation between classes in the training phase, objects formed from the OBIA procedure have similar objects in the classes, since the whole tree was considered as being affected by only one issue. In other works, different types of classes were classified as different tree species [50,61,62,63] or distinguished completely different types of classes [47,57,64,65]. Moreover, in Gini et al. [66], multispectral imagery was combined with texture features for tree species classification, increasing the overall accuracy. In this study, only Castanea sativa Mill. trees were evaluated using UAV-based multispectral data to automatically distinguish the presence (or absence) of phytosanitary issues. Therefore, it was more challenging when considering data classification into three classes since there were more spectral similarities.
When compared to traditional in-field approaches that require several days of field surveys/measurements, the whole pipeline proposed in this study can deliver the final results in a single day. Future developments would rely on data processing and results being delivered on the fly, similar to what was demonstrated from tree counting [67]. Data from sensing payloads other than multispectral imagery can help improve the differentiation between the phytosanitary issues analyzed in this study. Indeed, thermal infrared, hyperspectral, and fluorescence data [22,68,69] are options to be considered (e.g., allowing the creation of narrow-band vegetation indices). However, hyperspectral data require more complex data processing and with higher computational and financial costs compared to multispectral data. The proposed method can also be explored in other contexts such as arid and semi-arid land vegetation monitoring [70].
5. Conclusions
This study shows the suitability of image analysis and processing to automatically detect phytosanitary issues in individual chestnut trees within a chestnut stand using UAV-based multispectral data. The results demonstrate the effectiveness of the RF classifier in discriminating trees with and without phytosanitary issues and to classify according to the issue affecting the trees (ink disease and nutrient deficiency). In addition, new vegetation indices were proposed, which helped to improve the results. The obtained results also allowed us to conclude that the latter stages of the season is the optimal time (less misclassifications) for the application of the proposed methodology. This way, the dormancy period can be used to apply corrective treatments on the trees identified as having phytosanitary issues (e.g., soil nutrient corrections, biomass pruning tree optimization, tree replacement). However, the results from early and mid season (May to June) are also promising—phytosanitary issues can be detected even in cases when symptoms are not significant—and can be used to optimize field inspections, reducing the amount of work/time needed compared to manual/visual inspections. Some treatments can be directed to those trees to prevent the further development of issues. Moreover, the usage of multi-temporal data enabled the monitoring of the chestnut stand along the season.
In the near future, the proposed methodology can be applied to monitor chestnut trees at a larger scale, providing a cost-effective and less laborious alternative to field surveys to assess overall phytosanitary condition. Moreover, it can also be used in the long-term monitoring of damage caused by the chestnut gall wasp in both phytosanitary and development status of individual chestnut trees. Lastly, the greater spatial resolution provided by UAV-based data when compared to other remote sensing platforms can allow for yield estimation by automatically detecting chestnut clusters, since they tend to grow in tree branch tips and are therefore visible from an aerial perspective. Other types of sensors should also be evaluated, such as thermal and hyperspectral, increasing the variety of features that can be used for analysis and in promoting efficient and sustainable management practices.
Author Contributions
Conceptualization, L.P. and J.J.S.; methodology, L.P. and J.J.S.; software, L.P. and P.M.; validation, L.P., A.S. and E.P.; formal analysis, L.P.; investigation, L.P. and L.M.; resources, L.M., E.P. and J.J.S.; data curation, L.P.; writing—original draft preparation, L.P.; writing—review and editing, P.M., L.M., A.S., E.P. and J.J.S.; visualization, L.P.; supervision, A.S., E.P. and J.J.S.; project administration, J.J.S.; funding acquisition, J.J.S. and E.P. All authors have read and agreed to the published version of the manuscript.
Funding
This work is financed by National Funds through the Portuguese funding agency, FCT—Fundação para a Ciência e a Tecnologia within project UIDB/50014/2020. Financial support provided by the FCT (PD/BD/150260/2019) to Pedro Marques, under the Doctoral Programme “Agricultural Production Chains—from fork to farm” (PD/00122/2012) and to Luís Pádua (SFRH/BD/139702/2018).
Acknowledgments
The authors would like to thank to the owner of the chestnut stand for conceiving the authorization to conduct this study.
Conflicts of Interest
The authors declare no conflict of interest.
Appendix A
This appendix contains the results of the RFE procedure presented in Section 3.3.1. (Table A1). Moreover, boxplots of some of the vegetation indices used in this study (Figure A1 and Figure A2) are also presented. These boxplots intend to depict the distribution of mean tree crown values when considering two or three classes: (i) with or without phytosanitary issues (Figure A1); and (ii) affected by chestnut ink disease, nutritional deficiencies, or healthy (Figure A2). Data dispersion trends throughout the season can be further studied to understand the multi-temporal variations of phytosanitary issues. The overall accuracy results from the prediction stage are presented in Figure A3.

Table A1.
Recursive feature elimination results for each flight campaign, considering two classes (C2) and three classes (C3), and its overall rank. Top ten features are highlighted.
Table A1.
Recursive feature elimination results for each flight campaign, considering two classes (C2) and three classes (C3), and its overall rank. Top ten features are highlighted.
| Feature | May | Jun | Jul | Aug | Sep | Oct | Overall | |||||||
|---|---|---|---|---|---|---|---|---|---|---|---|---|---|---|
| C2 | C3 | C2 | C3 | C2 | C3 | C2 | C3 | C2 | C3 | C2 | C3 | C2 | C3 | |
| NDExNIR | 1 | 2 | 2 | 4 | 2 | 2 | 1 | 1 | 4 | 4 | 2 | 2 | 1 | 1 |
| EXNIR | 3 | 3 | 3 | 3 | 3 | 3 | 3 | 3 | 2 | 3 | 3 | 3 | 2 | 2 |
| GNDVI | 4 | 1 | 1 | 1 | 4 | 5 | 2 | 4 | 3 | 2 | 4 | 5 | 3 | 3 |
| NDRE | 8 | 6 | 7 | 10 | 1 | 1 | 6 | 7 | 1 | 1 | 1 | 1 | 4 | 4 |
| RVI | 6 | 7 | 4 | 2 | 5 | 6 | 4 | 2 | 5 | 5 | 5 | 9 | 5 | 5 |
| NDVI | 2 | 4 | 5 | 5 | 6 | 9 | 5 | 5 | 6 | 9 | 9 | 10 | 6 | 7 |
| RED | 5 | 5 | 11 | 7 | 8 | 10 | 8 | 6 | 7 | 6 | 6 | 4 | 7 | 6 |
| NDExRE | 7 | 9 | 6 | 6 | 9 | 11 | 9 | 10 | 9 | 11 | 11 | 11 | 8 | 10 |
| GRVI | 11 | 11 | 12 | 12 | 7 | 4 | 10 | 8 | 10 | 7 | 8 | 6 | 9 | 8 |
| EXRE | 10 | 8 | 10 | 8 | 11 | 8 | 13 | 11 | 8 | 8 | 7 | 7 | 10 | 9 |
| TCARI | 9 | 12 | 9 | 9 | 12 | 12 | 7 | 9 | 13 | 10 | 10 | 14 | 11 | 12 |
| SAVI | 16 | 14 | 8 | 14 | 14 | 15 | 11 | 15 | 16 | 15 | 13 | 15 | 12 | 15 |
| GREEN | 13 | 10 | 13 | 11 | 13 | 7 | 14 | 13 | 11 | 12 | 16 | 8 | 13 | 11 |
| NIR | 12 | 13 | 14 | 13 | 10 | 13 | 15 | 12 | 14 | 13 | 15 | 13 | 14 | 13 |
| RDVI | 14 | 16 | 16 | 16 | 15 | 16 | 12 | 14 | 12 | 16 | 12 | 16 | 15 | 16 |
| RE | 15 | 15 | 15 | 15 | 16 | 14 | 16 | 16 | 15 | 14 | 14 | 12 | 16 | 14 |
Figure A1.
Boxplots representing the distribution of tree crown mean values regarding the vegetation indices used for healthy chestnut trees and for those affected by phytosanitary issues.
Figure A1.
Boxplots representing the distribution of tree crown mean values regarding the vegetation indices used for healthy chestnut trees and for those affected by phytosanitary issues.

Figure A2.
Boxplots representing the distribution of tree crown mean values regarding the vegetation indices used for chestnut trees affected by ink disease, nutritional deficiencies, or healthy.
Figure A2.
Boxplots representing the distribution of tree crown mean values regarding the vegetation indices used for chestnut trees affected by ink disease, nutritional deficiencies, or healthy.

Figure A3.
Overall accuracy, per flight campaign, of the prediction for the presence of phytosanitary issues (a) and for phytosanitary issue detection (b).
Figure A3.
Overall accuracy, per flight campaign, of the prediction for the presence of phytosanitary issues (a) and for phytosanitary issue detection (b).

References
- Instituto Nacional de Estatística, I.P. Estatísticas Agrícolas 2018; Instituto Nacional de Estatística, I.P.: Lisbon, Portugal, 2019; ISBN 978-989-25-0495-7. [Google Scholar]
- Martins, L.; Castro, J.P.; Gouveia, E. Biological control of chestnut blight in Portugal. Acta Hortic. 2014, 1043, 51–56. [Google Scholar] [CrossRef] [Green Version]
- Valverde, A.; González-Tirante, M.; Medina-Sierra, M.; Rivas, R.; Santa-Regina, I.; Igual, J.M. Culturable bacterial diversity from the chestnut (Castanea sativa Mill.) phyllosphere and antagonism against the fungi causing the chestnut blight and ink diseases. Microbiology 2017, 3, 293–314. [Google Scholar] [CrossRef] [PubMed] [Green Version]
- Rigling, D.; Prospero, S. Cryphonectria parasitica, the causal agent of chestnut blight: Invasion history, population biology and disease control. Mol. Plant Pathol. 2017. [Google Scholar] [CrossRef] [PubMed] [Green Version]
- Portela, E.; Roboredo, M.; Louzada, J. Assessment and Description of Magnesium Deficiencies in Chestnut Groves. J. Plant Nutr. 2003, 26, 503–523. [Google Scholar] [CrossRef]
- Aebi, A.; Schönrogge, K.; Melika, G.; Alma, A.; Bosio, G.; Quacchia, A.; Picciau, L.; Abe, Y.; Moriya, S.; Yara, K.; et al. Parasitoid Recruitment to the Globally Invasive Chestnut Gall Wasp Dryocosmus kuriphilus. In Proceedings of the Galling Arthropods and Their Associates; Ozaki, K., Yukawa, J., Ohgushi, T., Price, P.W., Eds.; Springer: Tokyo, Japan, 2006; pp. 103–121. [Google Scholar]
- Martins, L.M.; Lufinha, M.I.; Marques, C.P.; Abreu, C.G. Small format aerial photography to assess chestnut ink disease. For. Snow Landsc. Res. 2001, 73, 357–360. [Google Scholar]
- Ambrosini, I.; Gherardi, L.; Viti, M.L.; Maresi, G.; Turchetti, T. Monitoring diseases of chestnut stands by small format aerial photography. Geocarto Int. 1997, 12, 41–46. [Google Scholar] [CrossRef]
- Vannini, A.; Vettraino, A.M.; Fabi, A.; Montaghi, A.; Valentini, R.; Belli, C. Monitoring ink disease of chestnut with the airborne multispectral system ASPIS. Acta Hortic. 2005, 529–534. [Google Scholar] [CrossRef]
- Martins, L.; Castro, J.; Macedo, W.; Marques, C.; Abreu, C. Assessment of the spread of chestnut ink disease using remote sensing and geostatistical methods. Eur. J. Plant Pathol. 2007, 119, 159–164. [Google Scholar] [CrossRef]
- Castro, J.; Azevedo, J.C.; Martins, L. Temporal analysis of sweet chestnut decline in northeastern portugal using geostatistical tools. Acta Hortic. 2010, 405–410. [Google Scholar] [CrossRef] [Green Version]
- Martins, L.; Castro, J.P.; Macedo, F.; Marques, C.; Abreu, C. Índices espectrais em fotografia aérea de infravermelho próximo na monitorização da doença tinta do castanheiro. In Proceedings of the V Congresso Florestal Nacional; Instituto Politécnico de Viseu: Viseu, Portugal, 2005. [Google Scholar]
- Montagnoli, A.; Fusco, S.; Terzaghi, M.; Kirschbaum, A.; Pflugmacher, D.; Cohen, W.B.; Scippa, G.S.; Chiatante, D. Estimating forest aboveground biomass by low density lidar data in mixed broad-leaved forests in the Italian Pre-Alps. For. Ecosyst. 2015, 2, 10. [Google Scholar] [CrossRef] [Green Version]
- Marchetti, F.; Waske, B.; Arbelo, M.; Moreno-Ruíz, J.A.; Alonso-Benito, A. Mapping Chestnut Stands Using Bi-Temporal VHR Data. Remote Sens. 2019, 11, 2560. [Google Scholar] [CrossRef] [Green Version]
- Martins, L.M.; Castro, J.P.; Bento, R.; Sousa, J.J. Chestnut health monitoring by aerial photographs obtained by unnamed aerial vehicle. Rev. Ciênc. Agrár. 2015, 38, 184–190. [Google Scholar]
- Pádua, L.; Hruška, J.; Bessa, J.; Adão, T.; Martins, L.M.; Gonçalves, J.A.; Peres, E.; Sousa, A.M.R.; Castro, J.P.; Sousa, J.J. Multi-Temporal Analysis of Forestry and Coastal Environments Using UASs. Remote Sens. 2017, 10, 24. [Google Scholar] [CrossRef] [Green Version]
- Marques, P.; Pádua, L.; Adão, T.; Hruška, J.; Peres, E.; Sousa, A.; Sousa, J.J. UAV-Based Automatic Detection and Monitoring of Chestnut Trees. Remote Sens. 2019, 11, 855. [Google Scholar] [CrossRef] [Green Version]
- Di Gennaro, S.F.; Nati, C.; Dainelli, R.; Pastonchi, L.; Berton, A.; Toscano, P.; Matese, A. An Automatic UAV Based Segmentation Approach for Pruning Biomass Estimation in Irregularly Spaced Chestnut Orchards. Forests 2020, 11, 308. [Google Scholar] [CrossRef] [Green Version]
- Pádua, L.; Marques, P.; Adáo, T.; Hruška, J.; Peres, E.; Morais, R.; Sousa, A.; Sousa, J.J. UAS-based Imagery and Photogrammetric Processing for Tree Height and Crown Diameter Extraction. In Proceedings of the International Conference on Geoinformatics and Data Analysis; ACM: New York, NY, USA, 2018; pp. 87–91. [Google Scholar]
- Pádua, L.; Vanko, J.; Hruška, J.; Adão, T.; Sousa, J.J.; Peres, E.; Morais, R. UAS, sensors, and data processing in agroforestry: A review towards practical applications. Int. J. Remote Sens. 2017, 38, 2349–2391. [Google Scholar] [CrossRef]
- Albetis, J.; Duthoit, S.; Guttler, F.; Jacquin, A.; Goulard, M.; Poilvé, H.; Féret, J.-B.; Dedieu, G. Detection of Flavescence dorée Grapevine Disease Using Unmanned Aerial Vehicle (UAV) Multispectral Imagery. Remote Sens. 2017, 9, 308. [Google Scholar] [CrossRef] [Green Version]
- Zarco-Tejada, P.J.; Camino, C.; Beck, P.S.A.; Calderon, R.; Hornero, A.; Hernández-Clemente, R.; Kattenborn, T.; Montes-Borrego, M.; Susca, L.; Morelli, M.; et al. Previsual symptoms of Xylella fastidiosa infection revealed in spectral plant-trait alterations. Nat. Plants 2018, 4, 432–439. [Google Scholar] [CrossRef]
- Shamshiri, R.R.; Hameed, I.A.; Balasundram, S.K.; Ahmad, D.; Weltzien, C.; Yamin, M. Fundamental research on unmanned aerial vehicles to support precision agriculture in oil palm plantations. Agric. Robots Fundam. Appl. 2018. [Google Scholar] [CrossRef] [Green Version]
- Balasundram, S.K.; Golhani, K.; Shamshiri, R.R.; Vadamalai, G. Precision agriculture technologies for management of plant diseases. In Plant Disease Management Strategies for Sustainable Agriculture through Traditional and Modern Approaches; Sustainability in Plant and Crop Protection; Ul Haq, I., Ijaz, S., Eds.; Springer International Publishing: Cham, Switzerland, 2020; pp. 259–278. ISBN 978-3-030-35955-3. [Google Scholar]
- Pereira, M.; Caramelo, L.; Gouveia, C.; Gomes-Laranjo, J.; Magalhães, M.; Tarquis, M.; Moratiel, R.; Vázquez, E.V. Assessment of weather-related risk on chestnut productivity. Nat. Hazards Earth Syst. Sci. 2011, 11, 2729–2739. [Google Scholar] [CrossRef] [Green Version]
- DJI Official DJI Phantom 4—Specs, FAQ, Tutorials and Downloads. Available online: https://www.dji.com/pt/phantom-4/info (accessed on 3 September 2020).
- Bergonoux, F.; Verlhac, A.; Breisch, H.; Chapa, J. Le Châtaignier, Production et Culture; Comité National Interprofessionel de la Chataigne et du Marron: Paris, France, 1978. [Google Scholar]
- Rouse, J.W., Jr.; Haas, R.H.; Schell, J.A.; Deering, D.W. Monitoring Vegetation Systems in the Great Plains with Erts. NASA Spec. Publ. 1974, 351, 309. [Google Scholar]
- Gitelson, A.A.; Kaufman, Y.J.; Merzlyak, M.N. Use of a green channel in remote sensing of global vegetation from EOS-MODIS. Remote Sens. Environ. 1996, 58, 289–298. [Google Scholar] [CrossRef]
- Tucker, C.J. Red and photographic infrared linear combinations for monitoring vegetation. Remote Sens. Environ. 1979, 8, 127–150. [Google Scholar] [CrossRef] [Green Version]
- Barnes, E.; Clarke, T.; Richards, S.; Colaizzi, P.; Haberland, J.; Kostrzewski, M.; Waller, P.; Choi, C.; Riley, E.; Thompson, T. Coincident detection of crop water stress, nitrogen status and canopy density using ground based multispectral data. In Proceedings of the 5th International Conference on Precision Agriculture and other resource management, Bloomington, MN, USA, 16–19 July 2000. [Google Scholar]
- Huete, A.R. A soil-adjusted vegetation index (SAVI). Remote Sens. Environ. 1988, 25, 295–309. [Google Scholar] [CrossRef]
- Roujean, J.-L.; Breon, F.-M. Estimating PAR absorbed by vegetation from bidirectional reflectance measurements. Remote Sens. Environ. 1995, 51, 375–384. [Google Scholar] [CrossRef]
- Birth, G.S.; McVey, G.R. Measuring the Color of Growing Turf with a Reflectance Spectrophotometer 1. Agron. J. 1968, 60, 640–643. [Google Scholar] [CrossRef]
- Haboudane, D.; Miller, J.R.; Pattey, E.; Zarco-Tejada, P.J.; Strachan, I.B. Hyperspectral vegetation indices and novel algorithms for predicting green LAI of crop canopies: Modeling and validation in the context of precision agriculture. Remote Sens. Environ. 2004, 90, 337–352. [Google Scholar] [CrossRef]
- Woebbecke, D.M.; Meyer, G.E.; von Bargen, K.; Mortensen, D.A. Color Indices for Weed Identification Under Various Soil, Residue, and Lighting Conditions. Trans. ASAE 1995, 38, 259–269. [Google Scholar] [CrossRef]
- Meyer, G.E.; Neto, J.C. Verification of color vegetation indices for automated crop imaging applications. Comput. Electron. Agric. 2008, 63, 282–293. [Google Scholar] [CrossRef]
- Kiani, S.; Jafari, A. Crop detection and positioning in the field using discriminant analysis and neural networks based on shape features. J. Agric. Sci. Technol. JAST 2012, 14, 755–765. [Google Scholar]
- Kim, D.-W.; Yun, H.S.; Jeong, S.-J.; Kwon, Y.-S.; Kim, S.-G.; Lee, W.S.; Kim, H.-J. Modeling and Testing of Growth Status for Chinese Cabbage and White Radish with UAV-Based RGB Imagery. Remote Sens. 2018, 10, 563. [Google Scholar] [CrossRef] [Green Version]
- de Marcial-Pablo, M.J.; Gonzalez-Sanchez, A.; Jimenez-Jimenez, S.I.; Ontiveros-Capurata, R.E.; Ojeda-Bustamante, W. Estimation of vegetation fraction using RGB and multispectral images from UAV. Int. J. Remote Sens. 2019, 40, 420–438. [Google Scholar] [CrossRef]
- Torres-Sánchez, J.; Peña, J.M.; de Castro, A.I.; López-Granados, F. Multi-temporal mapping of the vegetation fraction in early-season wheat fields using images from UAV. Comput. Electron. Agric. 2014, 103, 104–113. [Google Scholar] [CrossRef]
- Bradley, D.; Roth, G. Adaptive thresholding using the integral image. J. Graph. Tools 2007, 12, 13–21. [Google Scholar] [CrossRef]
- Maurer, C.R.; Raghavan, V. A linear time algorithm for computing exact Euclidean distance transforms of binary images in arbitrary dimensions. IEEE Trans. Pattern Anal. Mach. Intell. 2003, 25, 265–270. [Google Scholar] [CrossRef]
- Meyer, F. Topographic distance and watershed lines. Signal Process. 1994, 38, 113–125. [Google Scholar] [CrossRef]
- Belgiu, M.; Drăguţ, L. Random forest in remote sensing: A review of applications and future directions. ISPRS J. Photogramm. Remote Sens. 2016, 114, 24–31. [Google Scholar] [CrossRef]
- Feng, Q.; Liu, J.; Gong, J. UAV Remote Sensing for Urban Vegetation Mapping Using Random Forest and Texture Analysis. Remote Sens. 2015, 7, 1074–1094. [Google Scholar] [CrossRef] [Green Version]
- Akar, Ö. The Rotation Forest algorithm and object-based classification method for land use mapping through UAV images. Geocarto Int. 2018, 33, 538–553. [Google Scholar] [CrossRef]
- Ma, L.; Fu, T.; Blaschke, T.; Li, M.; Tiede, D.; Zhou, Z.; Ma, X.; Chen, D. Evaluation of Feature Selection Methods for Object-Based Land Cover Mapping of Unmanned Aerial Vehicle Imagery Using Random Forest and Support Vector Machine Classifiers. ISPRS Int. J. Geo-Inf. 2017, 6, 51. [Google Scholar] [CrossRef]
- Nevalainen, O.; Honkavaara, E.; Tuominen, S.; Viljanen, N.; Hakala, T.; Yu, X.; Hyyppä, J.; Saari, H.; Pölönen, I.; Imai, N.N.; et al. Individual Tree Detection and Classification with UAV-Based Photogrammetric Point Clouds and Hyperspectral Imaging. Remote Sens. 2017, 9, 185. [Google Scholar] [CrossRef] [Green Version]
- Michez, A.; Piégay, H.; Lisein, J.; Claessens, H.; Lejeune, P. Classification of riparian forest species and health condition using multi-temporal and hyperspatial imagery from unmanned aerial system. Environ. Monit. Assess. 2016, 188, 146. [Google Scholar] [CrossRef] [PubMed] [Green Version]
- Goodbody, T.R.H.; Coops, N.C.; Hermosilla, T.; Tompalski, P.; Crawford, P. Assessing the status of forest regeneration using digital aerial photogrammetry and unmanned aerial systems. Int. J. Remote Sens. 2018, 39, 5246–5264. [Google Scholar] [CrossRef]
- Michel, J.; Youssefi, D.; Grizonnet, M. Stable mean-shift algorithm and its application to the segmentation of arbitrarily large remote sensing images. IEEE Trans. Geosci. Remote Sens. 2014, 53, 952–964. [Google Scholar] [CrossRef]
- Inglada, J.; Christophe, E. The Orfeo Toolbox remote sensing image processing software. In Proceedings of the 2009 IEEE International Geoscience and Remote Sensing Symposium, Cape Town, South Africa, 12–17 July 2009; Volume 4, pp. 733–736. [Google Scholar]
- Guyon, I.; Weston, J.; Barnhill, S.; Vapnik, V. Gene Selection for Cancer Classification using Support Vector Machines. Mach. Learn. 2002, 46, 389–422. [Google Scholar] [CrossRef]
- Granitto, P.M.; Furlanello, C.; Biasioli, F.; Gasperi, F. Recursive feature elimination with random forest for PTR-MS analysis of agroindustrial products. Chemom. Intell. Lab. Syst. 2006, 83, 83–90. [Google Scholar] [CrossRef]
- McHugh, M.L. Interrater reliability: The kappa statistic. Biochem. Medica Biochem. Medica 2012, 22, 276–282. [Google Scholar] [CrossRef]
- Pádua, L.; Guimarães, N.; Adão, T.; Marques, P.; Peres, E.; Sousa, A.; Sousa, J.J. Classification of an Agrosilvopastoral System Using RGB Imagery from an Unmanned Aerial Vehicle. In Proceedings of the Progress in Artificial Intelligence; Moura Oliveira, P., Novais, P., Reis, L.P., Eds.; Springer International Publishing: Cham, Switzerland, 2019; pp. 248–257. [Google Scholar]
- Torres-Sánchez, J.; López-Granados, F.; Serrano, N.; Arquero, O.; Peña, J.M. High-Throughput 3-D Monitoring of Agricultural-Tree Plantations with Unmanned Aerial Vehicle (UAV) Technology. PLoS ONE 2015, 10, e0130479. [Google Scholar] [CrossRef] [PubMed] [Green Version]
- Camisón, Á.; Martín, M.Á.; Oliva, J.; Elfstrand, M.; Solla, A. Increased tolerance to Phytophthora cinnamomi in offspring of ink-diseased chestnut (Castanea sativa Miller) trees. Ann. For. Sci. 2019, 76, 119. [Google Scholar] [CrossRef]
- Brito, D.; Esteves, R.; Ramos, S.; Pinto, T.; Gomes-Laranjo, J. ColUTAD e Ca90, dois porta-enxertos para o combate à doença da tinta no castanheiro. Frutas Legum. E Flores 2012, 124, 38–41. [Google Scholar]
- Hill, R.A.; Wilson, A.K.; George, M.; Hinsley, S.A. Mapping tree species in temperate deciduous woodland using time-series multi-spectral data. Appl. Veg. Sci. 2010, 13, 86–99. [Google Scholar] [CrossRef]
- Melville, B.; Lucieer, A.; Aryal, J. Classification of Lowland Native Grassland Communities Using Hyperspectral Unmanned Aircraft System (UAS) Imagery in the Tasmanian Midlands. Drones 2019, 3, 5. [Google Scholar] [CrossRef] [Green Version]
- Lisein, J.; Michez, A.; Claessens, H.; Lejeune, P. Discrimination of Deciduous Tree Species from Time Series of Unmanned Aerial System Imagery. PLoS ONE 2015, 10, e0141006. [Google Scholar] [CrossRef]
- Guerrero, J.M.; Pajares, G.; Montalvo, M.; Romeo, J.; Guijarro, M. Support Vector Machines for crop/weeds identification in maize fields. Expert Syst. Appl. 2012, 39, 11149–11155. [Google Scholar] [CrossRef]
- Akcay, H.; Kaya, S.; Sertel, E.; Alganci, U. Determination of Olive Trees with Multi-sensor Data Fusion. In Proceedings of the 2019 8th International Conference on Agro-Geoinformatics (Agro-Geoinformatics), Shenzhen, China, 16–19 July 2019; pp. 1–6. [Google Scholar]
- Gini, R.; Sona, G.; Ronchetti, G.; Passoni, D.; Pinto, L. Improving Tree Species Classification Using UAS Multispectral Images and Texture Measures. ISPRS Int. J. Geo Inf. 2018, 7, 315. [Google Scholar] [CrossRef] [Green Version]
- Salamí, E.; Gallardo, A.; Skorobogatov, G.; Barrado, C. On-the-Fly Olive Tree Counting Using a UAS and Cloud Services. Remote Sens. 2019, 11, 316. [Google Scholar] [CrossRef] [Green Version]
- Calderón, R.; Navas-Cortés, J.A.; Lucena, C.; Zarco-Tejada, P.J. High-resolution airborne hyperspectral and thermal imagery for early detection of Verticillium wilt of olive using fluorescence, temperature and narrow-band spectral indices. Remote Sens. Environ. 2013, 139, 231–245. [Google Scholar] [CrossRef]
- López-López, M.; Calderón, R.; González-Dugo, V.; Zarco-Tejada, P.J.; Fereres, E. Early Detection and Quantification of Almond Red Leaf Blotch Using High-Resolution Hyperspectral and Thermal Imagery. Remote Sens. 2016, 8, 276. [Google Scholar] [CrossRef] [Green Version]
- Sankey, T.T.; McVay, J.; Swetnam, T.L.; McClaran, M.P.; Heilman, P.; Nichols, M. UAV hyperspectral and lidar data and their fusion for arid and semi-arid land vegetation monitoring. Remote Sens. Ecol. Conserv. 2018, 4, 20–33. [Google Scholar] [CrossRef]
Figure 1.
Study area overview: (a) geographic location in Portugal’s mainland; (b) aerial overview of the chestnut stand, where chestnut trees are marked (WGS84, coordinate system, EPSG:4326). Ground perspective of some of the monitored trees, showing (c) absence of visual symptoms, (d) chestnut ink disease, and (e) nutrient deficiency. Unmanned aerial vehicle during take-off (f), used sensors are highlighted.

Figure 2.
Main steps of the proposed methodology for data of a single flight campaign.

Figure 3.
Typical spectral signatures and standard error, computed using the average of 100 points, in chestnut trees with no symptoms and from trees with chestnut ink disease and nutrient deficiency. Spectral band width of the four Parrot Sequoia bands is highlighted.
Figure 3.
Typical spectral signatures and standard error, computed using the average of 100 points, in chestnut trees with no symptoms and from trees with chestnut ink disease and nutrient deficiency. Spectral band width of the four Parrot Sequoia bands is highlighted.

Figure 4.
Individual tree crown isolation process: (a) color–infrared image; (b) detected vegetation; (c) color-coded representation of the complement distance transform result; and (d) unconnected clusters from the watershed transform.
Figure 4.
Individual tree crown isolation process: (a) color–infrared image; (b) detected vegetation; (c) color-coded representation of the complement distance transform result; and (d) unconnected clusters from the watershed transform.

Figure 5.
Data augmentation procedure: (a) objects from the mean-shift algorithm; (b) objects intersecting the detected tree crowns; (c) train-test split of the objects used for training (orange for training an and grey for testing).
Figure 5.
Data augmentation procedure: (a) objects from the mean-shift algorithm; (b) objects intersecting the detected tree crowns; (c) train-test split of the objects used for training (orange for training an and grey for testing).

Figure 6.
Phytosanitary assessment of chestnut trees for (a) nutrient deficiency; (b) chestnut ink disease; and (c) global condition.
Figure 6.
Phytosanitary assessment of chestnut trees for (a) nutrient deficiency; (b) chestnut ink disease; and (c) global condition.

Figure 7.
Overall chestnut tree crown area (a), its distribution per flight campaign (b) and per class (c,d).
Figure 7.
Overall chestnut tree crown area (a), its distribution per flight campaign (b) and per class (c,d).

Figure 8.
Crown area of each analyzed chestnut tree per flight campaign, from 27 May to 16 October 2018.
Figure 8.
Crown area of each analyzed chestnut tree per flight campaign, from 27 May to 16 October 2018.

Figure 9.
Mean NDVI values for the chestnut trees analyzed throughout the flight campaigns (27 May to 16 October 2018).
Figure 9.
Mean NDVI values for the chestnut trees analyzed throughout the flight campaigns (27 May to 16 October 2018).

Figure 10.
Tree crown area and mean NDVI values of the chestnut trees analyzed throughout the flight campaigns.
Figure 10.
Tree crown area and mean NDVI values of the chestnut trees analyzed throughout the flight campaigns.

Figure 11.
Detection of phytosanitary issues in chestnut trees throughout the flight campaigns.

Figure 12.
Detection of ink disease and nutritional deficiencies in chestnut trees throughout the flight campaigns.
Figure 12.
Detection of ink disease and nutritional deficiencies in chestnut trees throughout the flight campaigns.

Table 1.
Computed vegetation indices found in the literature and their respective equations.
| Name | Equation | Ref. |
|---|---|---|
| Normalized Difference Vegetation Index | [28] | |
| Green Normalized Difference Vegetation Index | [29] | |
| Green Red Vegetation Index | [30] | |
| Normalized Difference Red Edge | [31] | |
| Soil Adjusted Vegetation Index | [32] | |
| Renormalized Difference Vegetation Index | [33] | |
| Simple Ratio | [34] | |
| Transformed Chlorophyll Absorption Reflectance Index | [35] |
G: Green; R: Red; N: NIR; RE: Red edge; L = 0.5.
Table 2.
Performance evaluation results (and its standard deviation) of OBIA objects considering two classes (1: no visual symptoms; 2: phytosanitary issues) for each flight campaign.
Table 2.
Performance evaluation results (and its standard deviation) of OBIA objects considering two classes (1: no visual symptoms; 2: phytosanitary issues) for each flight campaign.
| Month | Class | Precision | Recall | F1-score | Kappa Index | Overall Accuracy |
|---|---|---|---|---|---|---|
| May | 1 | 0.89 (0.02) | 0.92 (0.01) | 0.90 (0.01) | 0.65 (0.04) | 0.86 (0.01) |
| 2 | 0.79 (0.04) | 0.72 (0.04) | 0.75 (0.03) | |||
| Jun. | 1 | 0.88 (0.01) | 0.90 (0.01) | 0.89 (0.01) | 0.66 (0.02) | 0.85 (0.01) |
| 2 | 0.79 (0.02) | 0.75 (0.02) | 0.77 (0.02) | |||
| Jul. | 1 | 0.90 (0.01) | 0.92 (0.01) | 0.91 (0.01) | 0.72 (0.02) | 0.88 (0.01) |
| 2 | 0.83 (0.02) | 0.80 (0.02) | 0.81 (0.02) | |||
| Aug. | 1 | 0.91 (0.02) | 0.89 (0.01) | 0.90 (0.01) | 0.71 (0.02) | 0.87 (0.01) |
| 2 | 0.79 (0.02) | 0.83 (0.02) | 0.81 (0.02) | |||
| Sep. | 1 | 0.93 (0.01) | 0.94 (0.02) | 0.94 (0.01) | 0.80 (0.02) | 0.91 (0.01) |
| 2 | 0.88 (0.03) | 0.85 (0.03) | 0.86 (0.02) | |||
| Oct. | 1 | 0.91 (0.01) | 0.92 (0.01) | 0.91 (0.01) | 0.72 (0.03) | 0.88 (0.01) |
| 2 | 0.82 (0.02) | 0.81 (0.02) | 0.81 (0.02) |
Table 3.
Performance evaluation results (and its standard deviation) from OBIA objects considering three classes (1: no visual symptoms; 2: ink disease; 3: nutritional deficiencies) for each flight campaign.
Table 3.
Performance evaluation results (and its standard deviation) from OBIA objects considering three classes (1: no visual symptoms; 2: ink disease; 3: nutritional deficiencies) for each flight campaign.
| Month | Class | Precision | Recall | F1-Score | Kappa Index (STD) | Overall Accuracy (STD) |
|---|---|---|---|---|---|---|
| May | 1 | 0.88 (0.01) | 0.93 (0.01) | 0.91 (0.01) | 0.55 (0.01) | 0.80 (0.01) |
| 2 | 0.58 (0.08) | 0.53 (0.04) | 0.55 (0.04) | |||
| 3 | 0.58 (0.04) | 0.49 (0.03) | 0.53 (0.02) | |||
| Jun. | 1 | 0.88 (0.01) | 0.92 (0.02) | 0.90 (0.01) | 0.60 (0.02) | 0.81 (0.01) |
| 2 | 0.64 (0.04) | 0.55 (0.06) | 0.59 (0.03) | |||
| 3 | 0.66 (0.03) | 0.61 (0.04) | 0.64 (0.03) | |||
| Jul. | 1 | 0.89 (0.01) | 0.94 (0.01) | 0.91 (0.01) | 0.65 (0.03) | 0.83 (0.02) |
| 2 | 0.66 (0.04) | 0.63 (0.07) | 0.64 (0.05) | |||
| 3 | 0.74 (0.06) | 0.62 (0.04) | 0.67 (0.03) | |||
| Aug. | 1 | 0.89 (0.02) | 0.91 (0.01) | 0.90 (0.01) | 0.60 (0.03) | 0.80 (0.01) |
| 2 | 0.58 (0.06) | 0.58 (0.07) | 0.58 (0.05) | |||
| 3 | 0.64 (0.06) | 0.60 (0.05) | 0.62 (0.02) | |||
| Sep. | 1 | 0.92 (0.02) | 0.94 (0.01) | 0.93 (0.01) | 0.69 (0.02) | 0.85 (0.01) |
| 2 | 0.60 (0.03) | 0.57 (0.05) | 0.58 (0.03) | |||
| 3 | 0.77 (0.05) | 0.73 (0.05) | 0.75 (0.03) | |||
| Oct. | 1 | 0.90 (0.01) | 0.94 (0.01) | 0.92 (0.01) | 0.67 (0.03) | 0.85 (0.01) |
| 2 | 0.62 (0.04) | 0.60 (0.04) | 0.61 (0.03) | |||
| 3 | 0.83 (0.04) | 0.71 (0.04) | 0.76 (0.03) |
© 2020 by the authors. Licensee MDPI, Basel, Switzerland. This article is an open access article distributed under the terms and conditions of the Creative Commons Attribution (CC BY) license (http://creativecommons.org/licenses/by/4.0/).
Share and Cite
MDPI and ACS Style
Pádua, L.; Marques, P.; Martins, L.; Sousa, A.; Peres, E.; Sousa, J.J. Monitoring of Chestnut Trees Using Machine Learning Techniques Applied to UAV-Based Multispectral Data. Remote Sens. 2020, 12, 3032. https://doi.org/10.3390/rs12183032
AMA Style
Pádua L, Marques P, Martins L, Sousa A, Peres E, Sousa JJ. Monitoring of Chestnut Trees Using Machine Learning Techniques Applied to UAV-Based Multispectral Data. Remote Sensing. 2020; 12(18):3032. https://doi.org/10.3390/rs12183032
Chicago/Turabian StylePádua, Luís, Pedro Marques, Luís Martins, António Sousa, Emanuel Peres, and Joaquim J. Sousa. 2020. "Monitoring of Chestnut Trees Using Machine Learning Techniques Applied to UAV-Based Multispectral Data" Remote Sensing 12, no. 18: 3032. https://doi.org/10.3390/rs12183032
Note that from the first issue of 2016, this journal uses article numbers instead of page numbers. See further details here.