Geographic Variations of the Wood Density and Fiber Dimensions of the Persian Oak Wood


1
Department of Natural Resources and Earth Science, Shahrekord University, Shahrekord 64165478, Iran
2
Department of Wood Science, Biotechnical Faculty, University of Ljubljana, 1501 Ljubljana, Slovenia
3
Thünen Institute of Wood Research Hamburg, Leuschnerstraße 91, 21031 Hamburg-Bergedorf, Germany
*
Author to whom correspondence should be addressed.
Forests 2020, 11(9), 1003; https://doi.org/10.3390/f11091003
Submission received: 27 July 2020
/
Revised: 11 September 2020
/
Accepted: 12 September 2020
/
Published: 17 September 2020
(This article belongs to the Special Issue Wood Structure and Properties)
Abstract
:Persian oak (Quercus brantii Lindl.) is a valuable native species in Iranian forests with very limited availability of data on its wood properties. The objective of the current study was to determine the influence of altitude and slope on physical properties and fiber dimensions of Persian oak wood. In addition, the relationship among wood properties, site conditions (temperature and rainfall) and growth traits of trees (tree height, DBH, basal area, age, crown diameter, crown basal area, volume and annual diameter increment) were studied by principal component analysis (PCA). Three altitude levels (1730, 1980 and 2250 m) and three slope classes (<30%, 30–45% and >45%) were considered in the current study. It was determined that trees growing in the intermediate altitude (1980 m) showed the highest oven-dry density values, and those in the lowest altitude (1730 m) revealed the lowest ones. The results also indicate significant statistical differences between altitude levels and slope classes on the fiber length, fiber diameter and volumetric swelling at the 99% confidence interval while no significant differences were found between average values of oven-dry density among different altitudes and slopes. PCA analysis indicated that altitude and temperature are the most important factors affecting the wood properties. Knowledge of the relationship between wood properties and environmental factors are essential in terms of both forestry management and wood applications.
1. Introduction
Quercus spp. represent essential members of the family Fagaceae including more than 500 species of oaks which are distributed in the whole northern hemisphere [1]. There are eight species of Quercus naturally occurring in Iran. Oak tree species are widely spread in Arasbaran, Hyrcanian and Zagros forests in Iran. The highest species diversity of oak is documented for the Zagros forests [2]. The Zagros forests with an area of five million hectares cover approximately 40% of Iranian forests and are the widest forest areas of the country [3]. The three main oak species are Quercus brantii, Q. infectoria and Q. libani [4]. Persian oak (Quercus brantii Lindl.), which represents the dominant tree species, covers more than 50% of the Zagros forests [3]. It forms mixed stands together with the three wood species: Crataegus azarolus, Acer monspessulanum and Pistacia atlantica. Persian oak is a ring-porous species [5] and its wood can be easily recognized by large rays and solitary vessels.
Climate, biotic and edaphic conditions together with the topography of the area, altitude, aspect and slope are interacting factors, affecting wood quality [6,7,8]. There are several studies on the relationships between environmental factors and wood characteristics, especially in terms of wood density [9,10,11,12,13]. Wood density is considered as the most important index of the physical and mechanical properties of wood and is an indicator of tree growth rate in both conifers and hardwoods [14,15]. Govorcin et al. [16] indicated that wood density of Fagus sylvatica decreased with increasing altitude. Kiaei et al. [11] and Barij et al. [17] stated that there are significant associations between wood density and environmental factors for Quercus pubescens and Carpinus betulus. Noshiro et al. (1994) [18], Noshiro et al. (1995) [18] and Yılmaz et al. [19] reported that there is a significant relationship between wood anatomical properties and ecological factors for Alnus nepalensis, Rhododendron species (R. anthopogon, R. lepidotum, R. campanulatum and R. arboretum) and Quercus pontica. On the other hand, Liu and Noshiro [20], Pande et al. [21] and Hernandez and Restrepo [22] reported no significant relationship between wood oven-dry density and altitude difference for Dodonae aviscosa, Alnus acuminate and the genus Castanopsis. Topaloglu et al. [10] determined some changing anatomical properties for Fagus orientalis at different altitudes (0–200, 200–400, 400–600, 600–800 and 800–1000 m) and aspects (north and south) in Turkey. In detail, the results of the wood anatomical studies show that, with increasing altitude, vessel diameters narrowed, vessel numbers increased and vessel and fiber length decreased. Kaygin et al. [23] reported a significant relationship between wood oven-dry density and altitude difference for Scots pine (Pinus sylvestris). It worth mentioning that most studies mainly concentrated solely on wood properties on its own and ignored the relationship between wood properties and environmental growth traits. Berges et al. [24] studied the effects of ecological factors on radial growth and wood density of sessile oak (Quercus petraea Liebl.) in Northern France. They reported that there is a direct control of wood density by ecological factors. Bahmani et al. [25] inspected the influence of tree diameter classes on the wood properties of Persian oak such as basic and oven-dry density, fiber morphology and chemical compounds in Lorgedan forests, Iran. However, the relationship between wood properties and environmental growth traits was not investigated. To the best of our knowledge, there is no study on the influence of environmental conditions on the physical and fiber characteristics of Persian oak. Considering the importance of environmental factors on the wood properties and valuable position of Q. brantii for Iranian forests, the objectives of this study were to identify the changes of oven-dry density, fiber length, fiber diameter and cell wall thickness of Persian oak wood, depending on different altitude levels and slope classes as well as to explore the relationship between wood characteristics and environmental factors.
2. Material and Methods
2.1. Study Area and Sampling
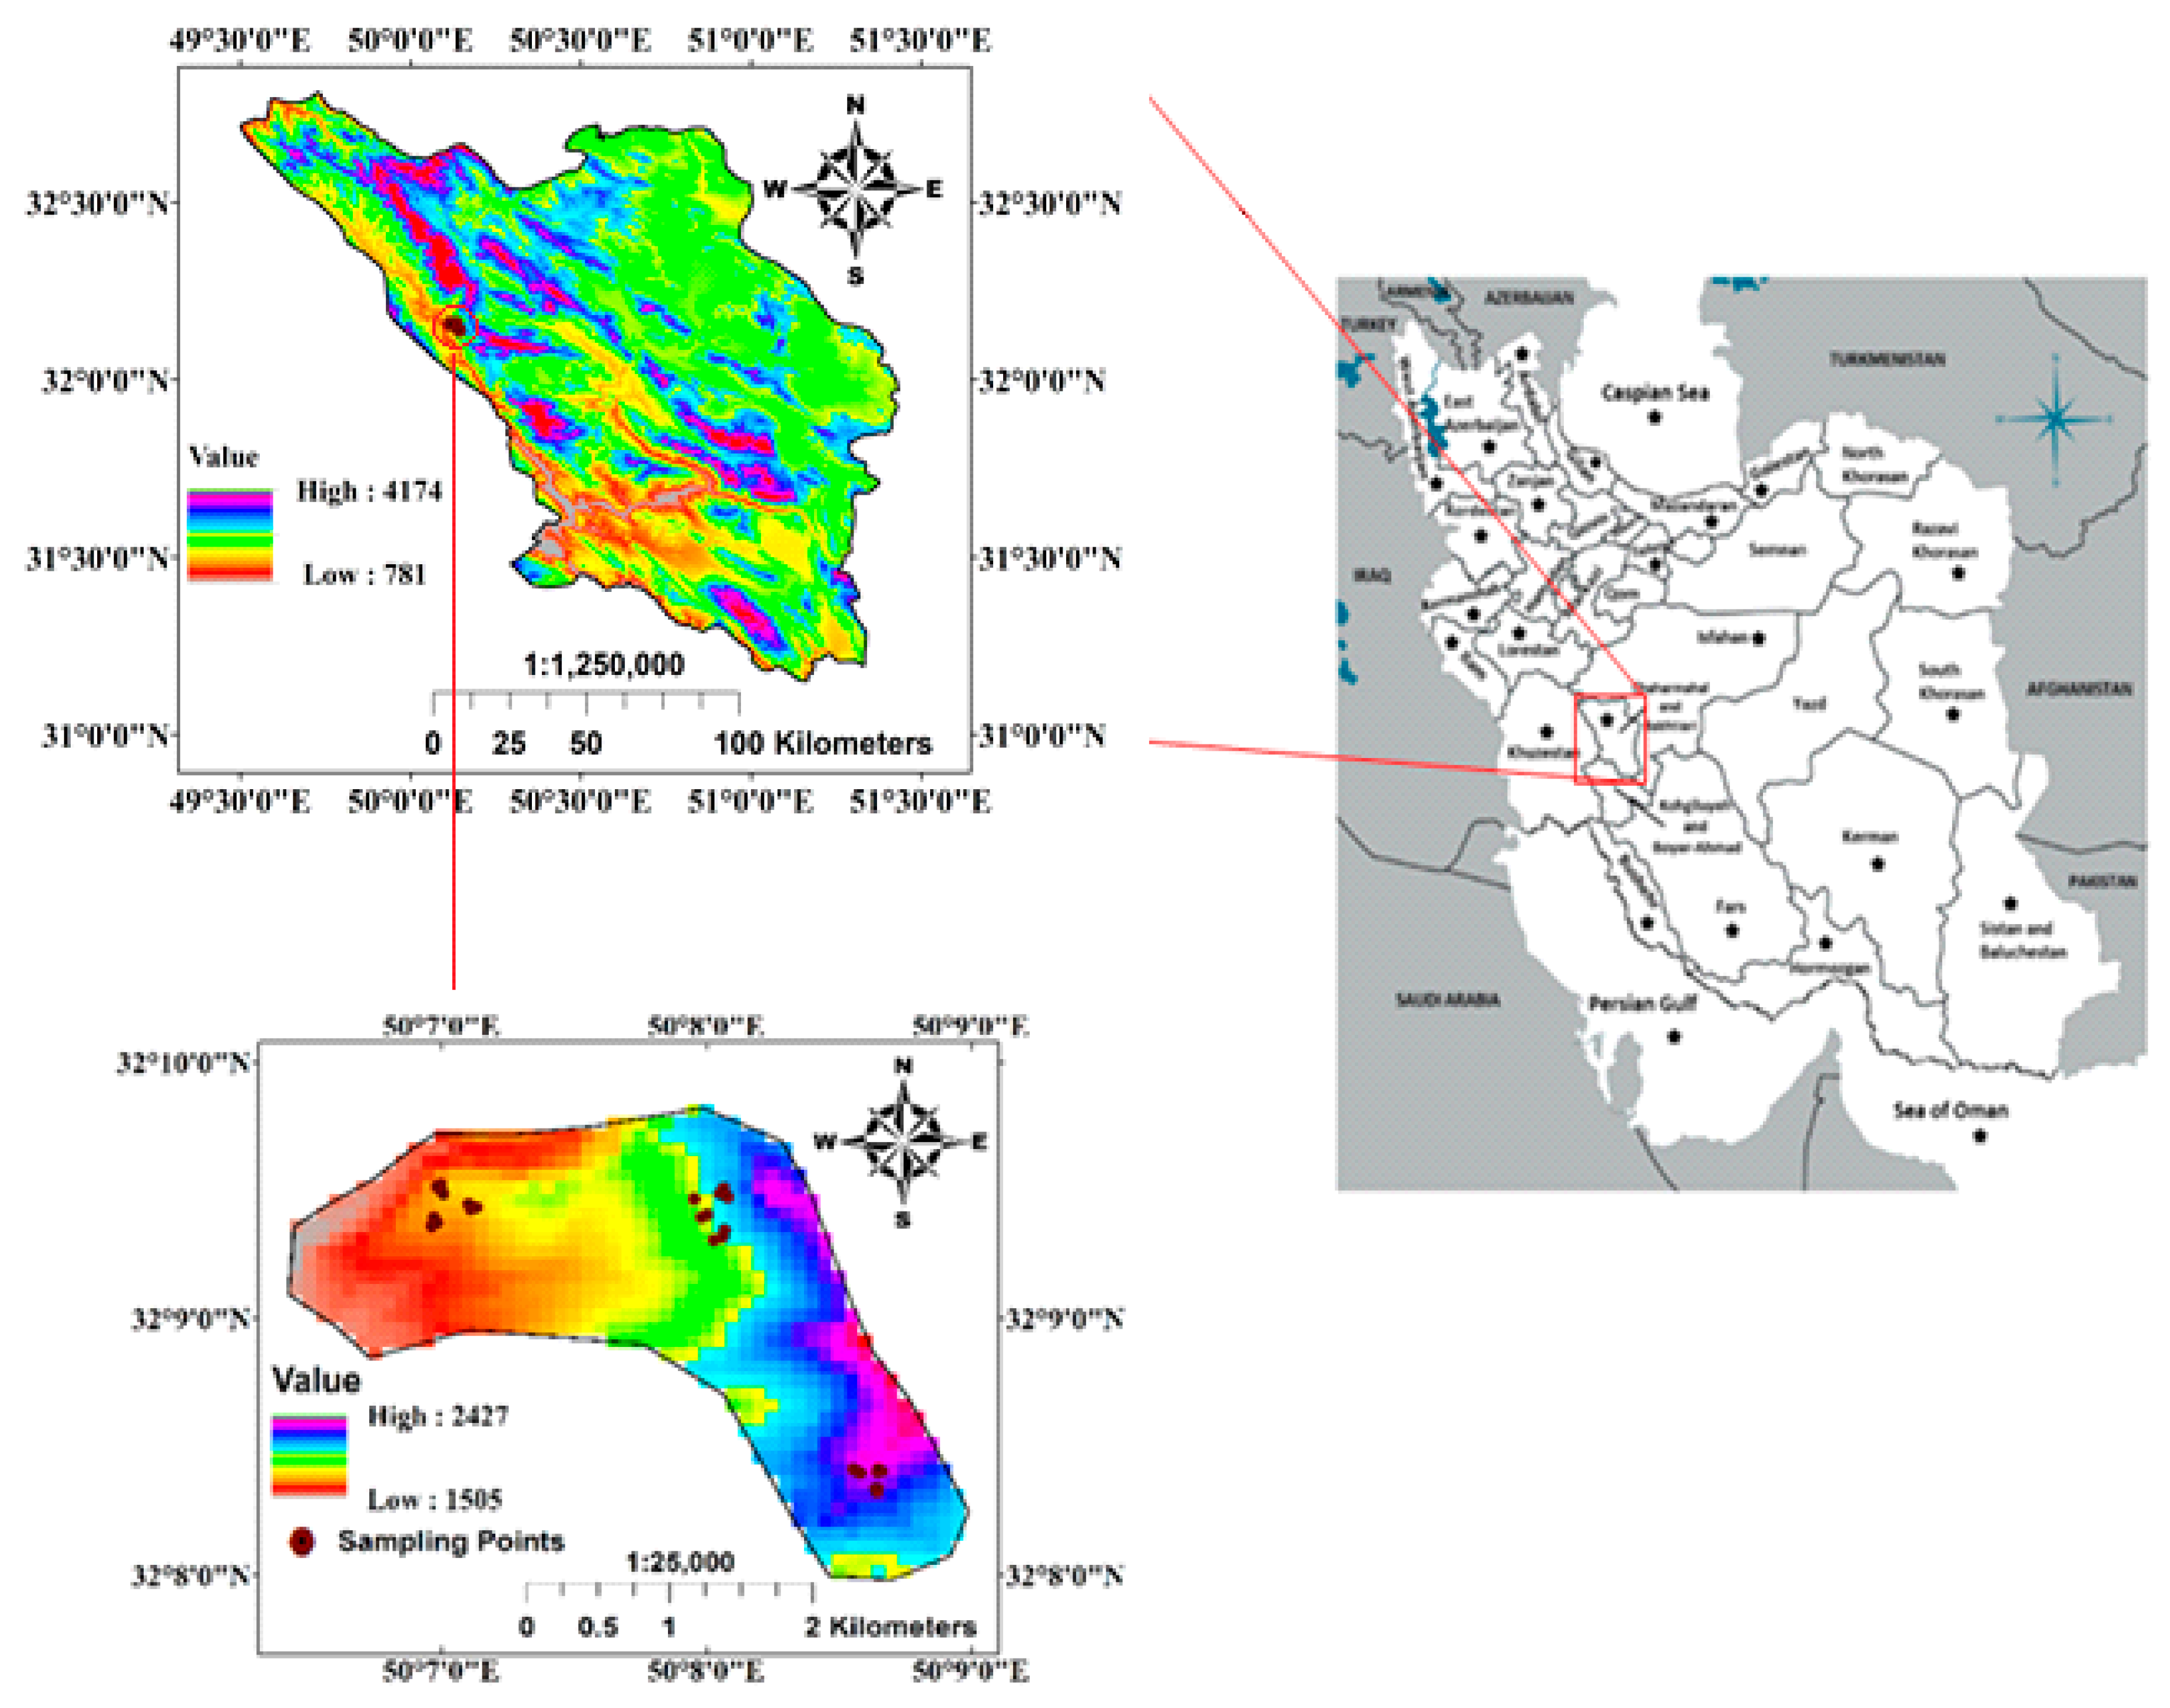
The research area is located between 49°59′43″ N and 50°15′28″ N and between 32°07′42″ E and 32°22′25″ E in the Bazoft region of Chaharmahal Va Bakhtiari, Iran (Figure 1). Persian oak forests in this study area are spread between 1500 and 2300 m in altitude. The mean annual precipitation and temperature of the study area are 330 mm and 14 °C, respectively. This study was performed on trees collected from nine ecosites (three forest sample stands along an altitudinal gradient (1730, 1980 and 2250 m a.s.l.)) × three terrain slope classes (less than 30%, 30–45% and more than 45%) in the Persian oak forests of Bazoft, creating three replicates in each ecosite (3 × 3 × 3 = 27 sampling plots, one sampled tree in each plot = 27 healthy dominant trees in total) (Figure 1). Due to their remote location and the absence of evidence of human impact, it is assumed that all stands have been developed under the influence of natural impacts and disturbances. In each ecosite, three plots were implemented. In total, 27 healthy dominant trees (3 trees × 3 altitudes × 3 slopes) were selected.
In each circular plot, all living trees of at least 7.5 cm diameter at breast height (DBH, 1.30 m above the ground) were identified, and their diameter at breast height, height, crown length and perpendicular diameters were recorded within 0.1 ha area. The caliper, vertex and diameter tape were used to measure tree diameters, height and crown diameter, respectively. Then, in each plot, one healthy dominant tree with the largest diameters at breast height (DBH) without any defects and reaction wood was sampled and one disk was taken from the tree trunk at DBH for the determination of wood properties. Then, the tree age at breast height (ABH) was obtained by counting the annual rings of the sampled disks. Finally, the mean annual diameter increment (MADI) was obtained by dividing DBH by the number of annual rings. Stand-level traits such as stand basal area, stand density and stand quadratic mean diameter (QMD) and tree-level traits such as stem basal area, stem volume, tree crown diameters and tree crown basal area in each ecosite were calculated based on 27 circular 0.1 ha sample plots data. The tree crown diameter was measured as the average crown spread is the average of the lengths of longest spread from edge to edge across the crown and the longest spread perpendicular to the first cross-section through the central mass of the crown. Tree crown basal area as tree crown area projection was calculated based on the crown area as a circle using average crown spread as its diameter. The annual records of total precipitation and mean annual temperature, the main climatic factors affecting the wood properties and growth of Brant oaks in the region, were obtained from the Koohrang Synoptic Meteorological Station (32.46° N, 50.13° E; 2365 m a.s.l.) [26].
2.2. Preparation of Samples
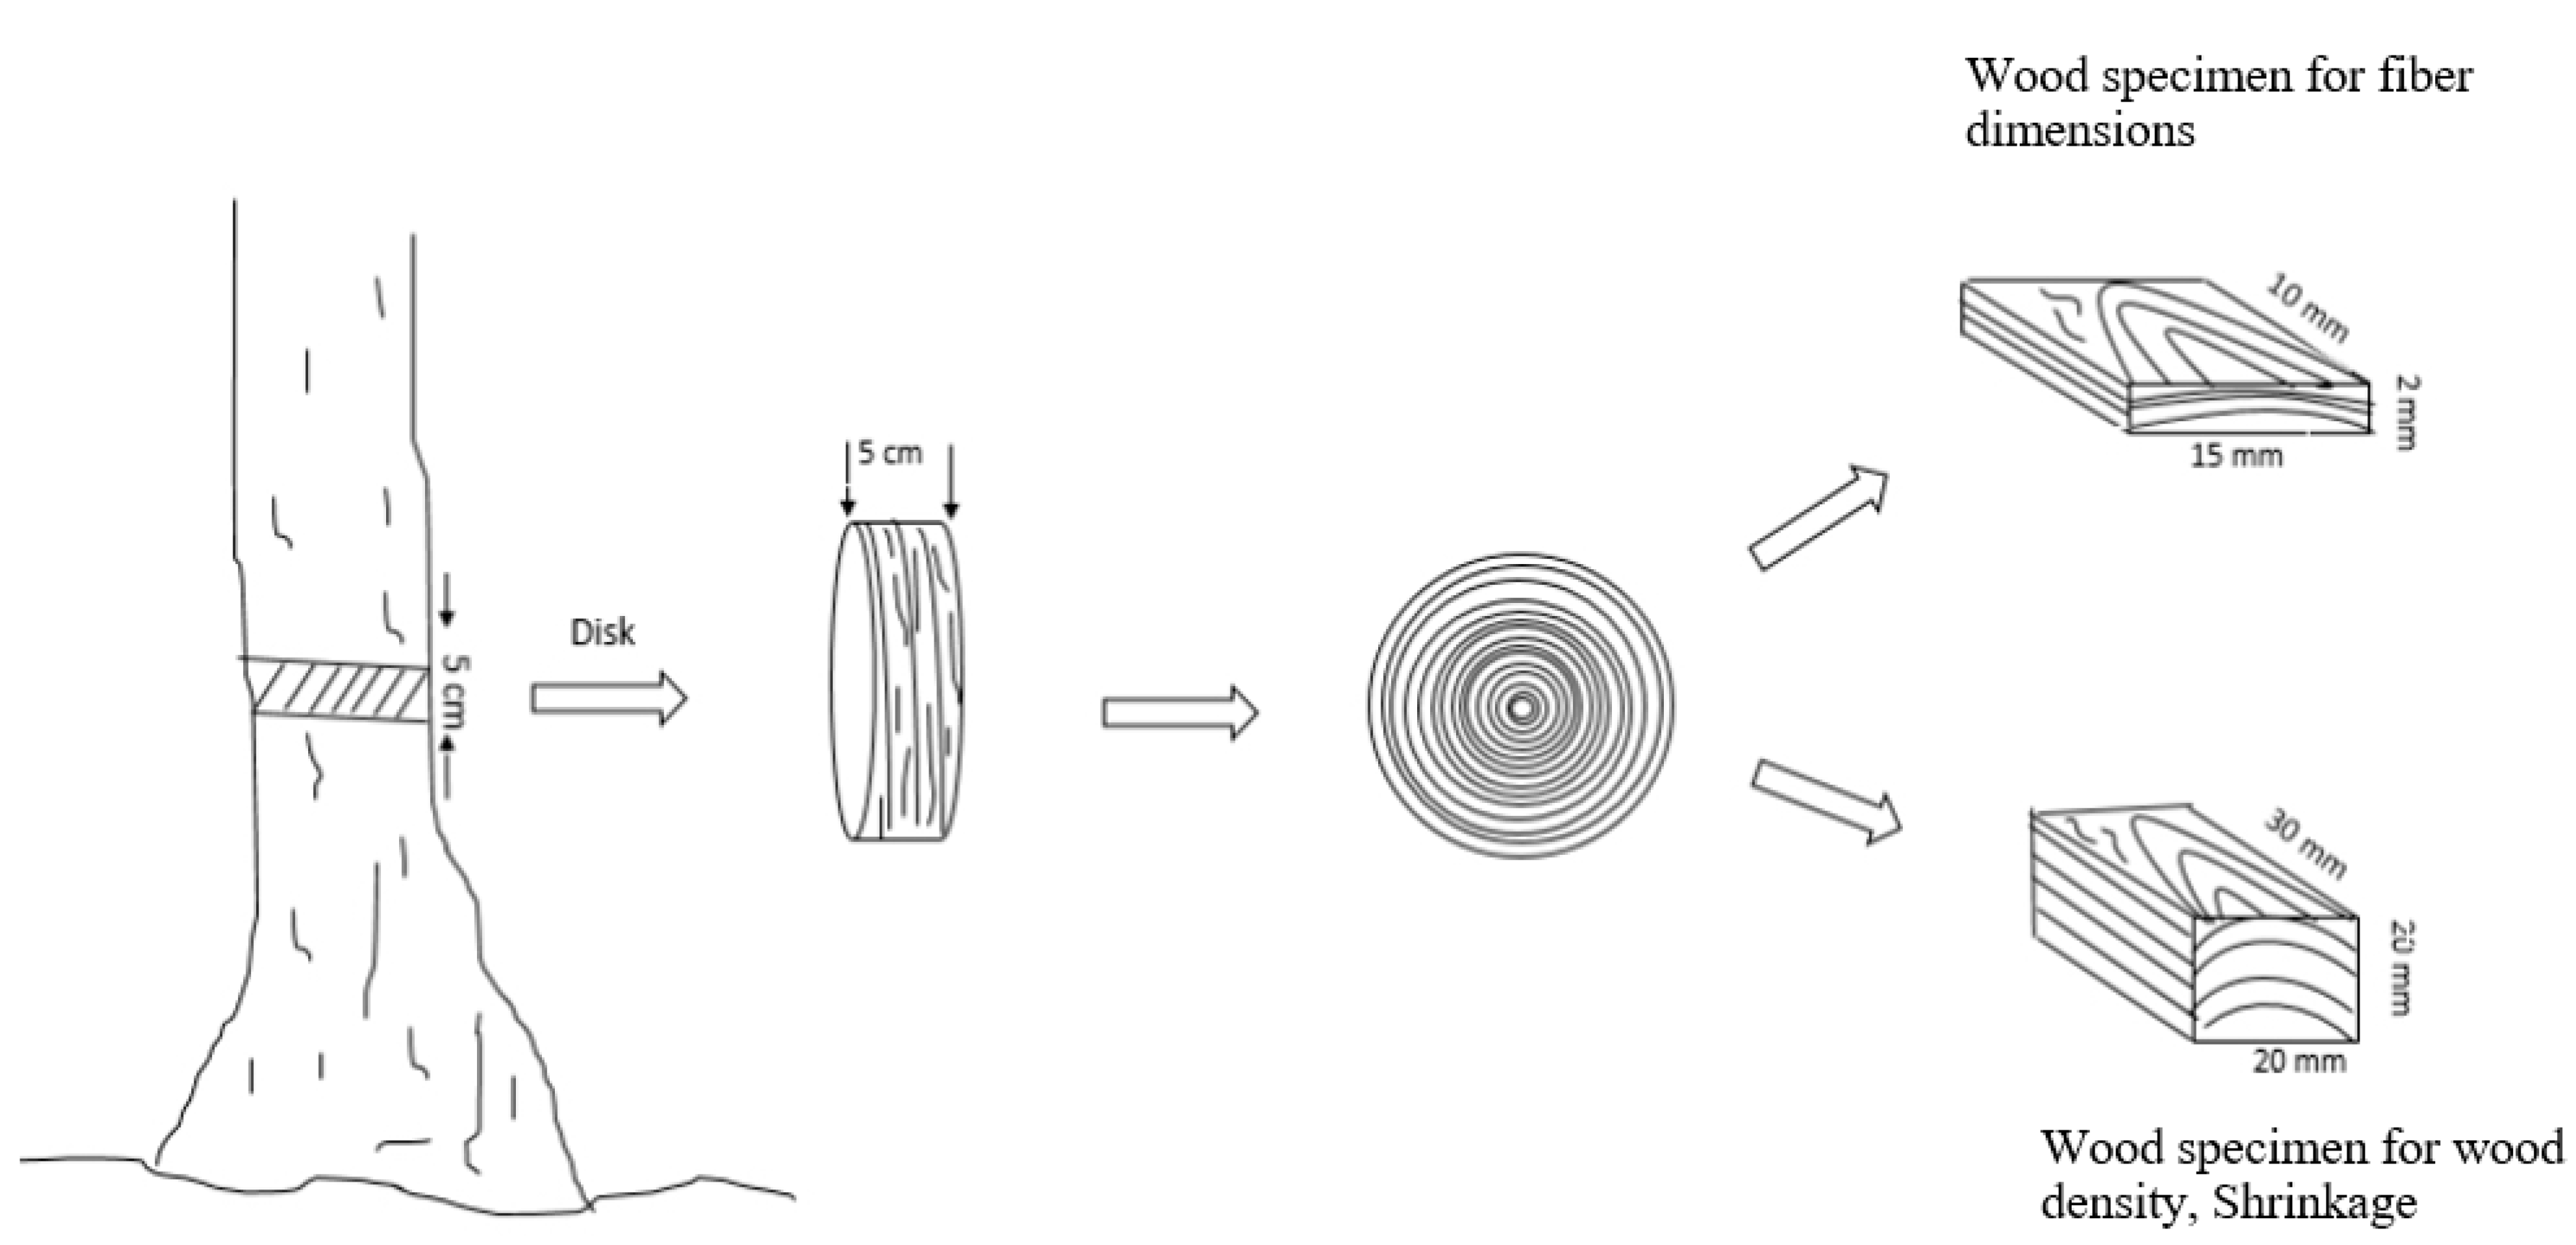
For determination of physical properties and fiber dimensions, 5-cm-thick disks were taken at 1.30 m in height. Tree sampling and specimen preparation for physical properties and fiber dimensions are shown in Figure 2.
2.3. Physical Properties
After the preparation process, specimens with dimensions of 3 cm × 2 cm × 2 cm were prepared in accordance with ISO 13061-14 [27] for the investigation of oven-dry density and volumetric swelling. In total, 270 specimens from different parts of disks (10 specimens per each disk) were prepared.
Sample dimensions were measured in green (saturated) and oven-dry condition with a slide caliper; oven-dry mass was determined with an electric balance to an accuracy of 0.01 g. Swelling was calculated using the dimensional change from the green to oven-dry condition. The physical properties were calculated according to the following equations:
where: D0 is the oven dry density (g·cm−3), αv is the volumetric swelling (%), vs. is the volume in state of saturate (cm3), V0 is the volume in state of oven-dry (cm3) and P0 is the mass in state of oven dry (g).
2.4. Wood Fiber Properties
Separation of individual wood fiber was performed using Franklin method [28]. From each disk, wood specimens with the dimension of 15 mm × 10 mm × 2 mm were saturated in a mixture (1:1) of acetic acid and oxygenized water in test tubes. Afterwards, the specimens were kept in the oven at 65 ± 3 °C for 48 h. After maceration, the specimens were washed (2–3 times) in distilled water and then they were immersed with distilled water, shacked and the fiber dimensions (fiber length, fiber diameter and cell wall thickness) were measured with the use of microscope. From each disk, at least 50 fibers were used for the measurements.
2.5. Statistical Analysis
Normal distribution of data is one of the preconditions of the multivariate analysis of variance (MANOVA). Therefore, datasets were tested for normal distribution using the Shapiro–Wilk test of normality, and then data transformation was applied for those that were not normally distributed. Levene’s test was employed to examine the homogeneity of variances. MANOVA was conducted to evaluate significant differences between mean values of studied wood properties at altitude levels and slope classes using SPPS 23 (IBM, Armonk, NY, USA). This method generated a multivariate dataset that was interpreted by using principal component analysis (PCA). The patterns of variation of the measured traits were selected and used for performing PCA based on the method of alternating least squares (PRINQUAL procedure in SAS). A Kruskal secondary least-squares monotonic transformation was applied to all variables, with the restriction that ties were preserved. The results are presented by a PCA biplot that shows the transformed variables (e.g., the measured traits) projected onto the two-dimensional plane of the analysis described by the two principal components. PCA allowed the multivariate dataset to be reduced by minimizing multicollinearity and associating the correlated traits in two principal axes [13]. This approach improved data exploration and simplified the interpretation of the results.
3. Results
Descriptive statistics for the Persian oak sample trees, studied traits and forest stands in the study area are presented in Table 1.
Data normality was checked by the Shapiro–Wilk test (the data was normal; sig > 0.05), while the homogeneity of variances was tested using the Levene’s test (the variances were homogeneous; sig > 0.05).
3.1. Oven-Dry Density
The average values of oven-dry density determined for Persian oak wood in three different altitude levels and slope classes are presented in Table 2. Multivariate analysis of variance (MANOVA) results revealed no significant differences between mean values of oven-dry density at altitude levels and slope classes (Table 3). The highest (0.83 g/cm3) and lowest (0.73 g/cm3) values of oven-dry density were identified in the intermediate altitude step on the slope of 30–45% and in the lowest altitude on the slope of <30%, respectively. Overall, a mean value of oven-dry density of 0.78 g/cm3 and a coefficient of variation of 7.84% was achieved for Persian oak wood.
3.2. Volumetric Swelling
Table 2 shows the mean values of volumetric swelling for Persian oak. From the MANOVA, it can be derived that the effects of altitude levels and slope classes on volumetric swelling are significant at the 0.01 significance level (Table 3). The highest (21.74%) and lowest (10.92%) values of volumetric swelling were found in the intermediate altitude level on the slope of 30–45% and in the lowest altitude step on the slope of >45%, respectively. Overall, a mean value of volumetric swelling of 17.34% and a coefficient of variation of 23.80% were determined.
3.3. Fiber Length
The highest (0.96 mm) and lowest (0.70 mm) values of fiber length were found in the lowest altitude step on the slope of 30–45% and in the high altitude on the slope of >45%, respectively (Table 4). Average values of fiber length (0.87 mm) and coefficient of variation (2.05%) were achieved in total. According to the results of MANOVA, altitude and slope have a significant statistical effect on the fiber length at the 99% confidence interval (Table 3).
3.4. Fiber Diameter
A maximum value of 23.30 μm and a minimum value of 19.70 μm for fiber diameter were determined in the lowest altitude level on the slope of 30–45% and in the highest altitude level on the slope of <30%, respectively (Table 4). Overall, average values of fiber diameter of 20.49 μm and coefficient of variation of 9.42% were determined. MANOVA test results indicate significant differences between average values of fiber diameter between three altitude and slope groups at the 99% confidence interval (Table 3).
3.5. Cell Wall Thickness
The maximum value of the parameter cell wall thickness (6.02 μm) as well as the minimum (5.55 μm) were determined for the selected oak trees in the lowest altitude level on the slope of <30% and in the lowest altitude level on the slope of 30–45%, respectively (Table 4). In total, average values of cell wall thickness of 5.77 μm and coefficient of variation of 3.95% were achieved. MANOVA results in Table 3 reveal that both altitude and slope have no effect on the parameter cell wall thickness.
3.6. Principal Component Analysis
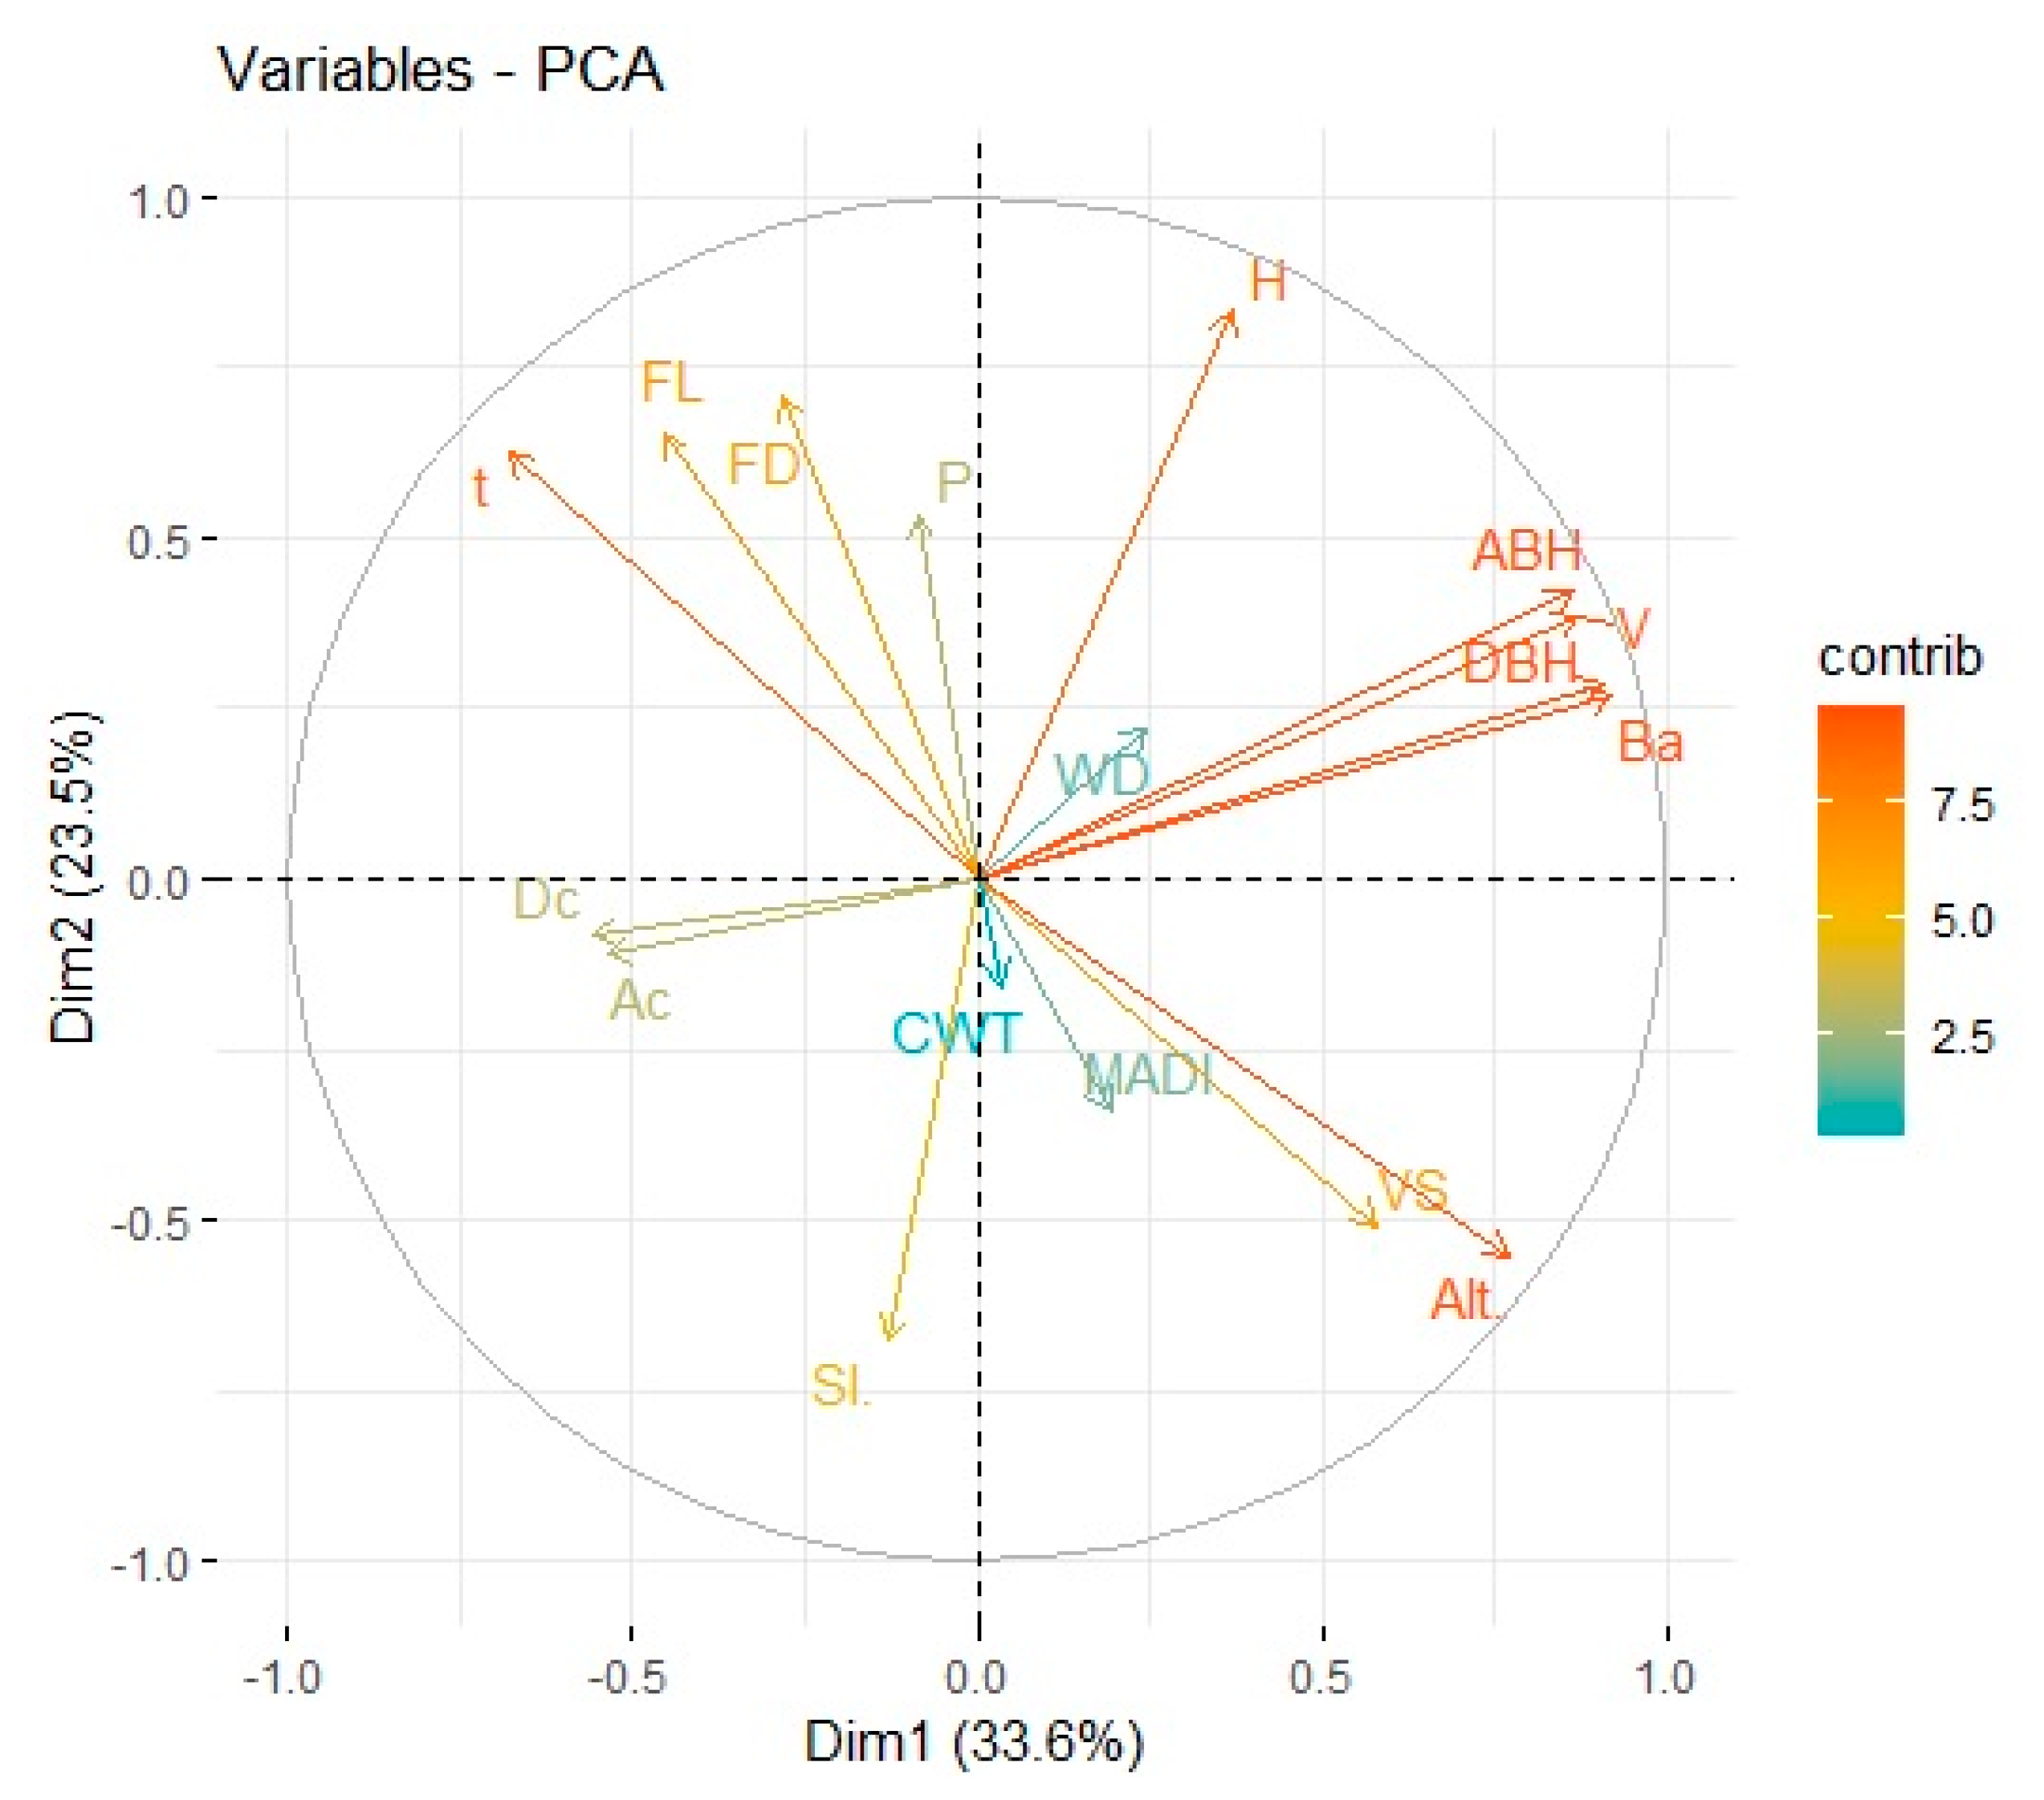
The results of Kaiser–Meyer–Olkin (KMO = 0.57) and Bartlett’s test of sphericity (p < 0.01) confirmed the adequacy of dataset for PCA. The transformed parameters of the measured traits were projected onto two dimensional planes generated by the first two canonical axes (Figure 3). Graph of study parameter and biplot of sample plots as well as study parameter based on first and second components are presented in Figure 3 and Figure 4 Canonical Axis 1 represented 33.62% of the variability, while the variance accounted for by Canonical Axes 2 and 3 represented 23.52% and 12.33% of the variability, respectively (Figure 3 and Table 5). The analysis of the PCA shows that three components explain 69.47% of the total variance (Table 5). Similar directions with respect to the origin revealed high correlations between the parameter of the measured traits. This is related to the volumetric swelling, fiber diameter and fiber length. Total variance explained by five principal components is 85.68% (Table 5).
The first component explains 33.62% of the total variance and is most highly correlated with the following study variables: tree volume, DBH, tree basal area, tree age and tree height. These traits are not particularly correlated with the other principal components. The second component describes 23.52% of the variance mainly influenced by the volumetric swelling, altitude, temperature, fiber diameter and fiber length. The third component explains 12.33% of the total variance relating to the tree crown diameter and tree crown basal area. The fourth component describes 9.64% of the variance influenced by the tree annual diameter increment, slope and precipitation. The fifth component explains 6.57% of the variance influenced by the settings cell wall thickness and oven-dry wood density (Table 5 and Table 6).
4. Discussion
Denser woods are characterized by higher mechanical properties and are more resistant to (mechanical) failures. Wood density is generally a complex variable and is related to many factors such as anatomical characteristics, e.g., vessel and fiber morphology, ecological site, moisture content and chemical constitutes [29,30]. In the present study, the density of Q. brantii is higher than that of Q. robur [31], Q. cerris [32] and Q. rubra L. [33]. However, oven-dry density values of Q. brantii evaluated for the Lordegan site in Iran (1.01 g/cm3, [25]) are significantly higher as compared to values of the Bazoft region in this study. This difference could be related to the site effects and stand age. Regarding the impact of site factors, there are no significant differences for average values of oven-dry density between altitudes and slope groups. This agrees well with findings by Guilley et al. [34] for Q. petraea. Overall, the highest average value of oven-dry density was found in the intermediate altitude. These findings are in line with previous findings of Sopushynskyy et al. [35] for F. sylvatica L and Kaygin et al. [17] for P. sylvestris L. However, Berges et al. [24] indicated that wood density decreased with increasing altitude for sessile oak.
Furthermore, the volumetric swelling is mainly affected by wood density (Guler et al. [36]). In the current study, the high altitude corresponds to the higher volumetric swelling, while the lowest altitude level had the lowest volumetric swelling. As is well known, the relationship between wood density and volumetric swelling is positive [29]. A similar finding was reported by Kiaei [37] for Carpinus betulus.
Fiber morphology and orientation are the primary elements responsible for the strength of wood and play an important role in determining the qualitative and quantitative wood properties and specific utilization of lignocellulosic materials [38,39]. The statistical evaluation of the wood fiber dimensions show that the altitude affects fiber length and fiber diameter of Persian oak but it is not influencing cell wall thickness. The average value of fiber length and fiber diameter declined while cell wall thickness increased with increasing altitude. Similar observations were previously reported by Kieai et al. [11] for Carpinus betulus, Noshiro et al. [18] for Alnus nepalensis and Yılmaz et al. [19] for Quercus pontica.
According to Wheeler et al. [40], fibers are classified into three groups: (1) short fibers with a length less than 0.90 mm; (2) fibers of medium length between 0.90 and 1.90 mm, including Persian oak with an average fiber length of 0.95 mm; and (3) fibers longer than 1.90 mm.
The measured average fiber length of Persian oak is lower than that reported, e.g., for Cork oak [41] and most hardwoods [42].
Fiber diameter and cell wall thickness depend on exogenous growth conditions and annual ring width [30]. The average value of fiber diameter of Persian oak wood at different attitude and slopes amounts to 20.49 µm, which is in agreement with those values reported for other hardwood fibers [43]. Plomion et al. [44] reported that the variations in the fiber diameter depend on molecular and physiological changes occurring in the vascular cambium as well as in the wood cell walls throughout the tree growth.
Cell wall thickness plays a key role in wood quality and its strength properties. Basically, this important anatomical parameter is variable among species and sites, between and within trees, and it is as well highly correlated with wood density. A positive correlation between wood density and cell wall thickness is described by many researchers (e.g., [10,45]). According to the results of the present study, the highest average values of wood density and cell wall thickness were obtained at the altitude of 1800–2000 m. The increased density at the representative altitudes can be explained with higher fiber cell wall thickness and content of cellulose, lignin and extractives [11]. For comparable oak species of Q. acutissima, Q. dealbata, Q. fenestrate, Q. lanceofolia and Q. semiserrata, cell wall thicknesses of fibers in the range of 7.49–18.26, 5.30–19.86, 6.49–17.05, 7.52–27.42 and 6.37–14.92 μm were described, respectively, by Sharma et al. [46]. The values of these oak species are slightly higher as compared to the results of our own measurements for Q. brantii, which can be explained by individual genetic, physiological and silvicultural impacts.
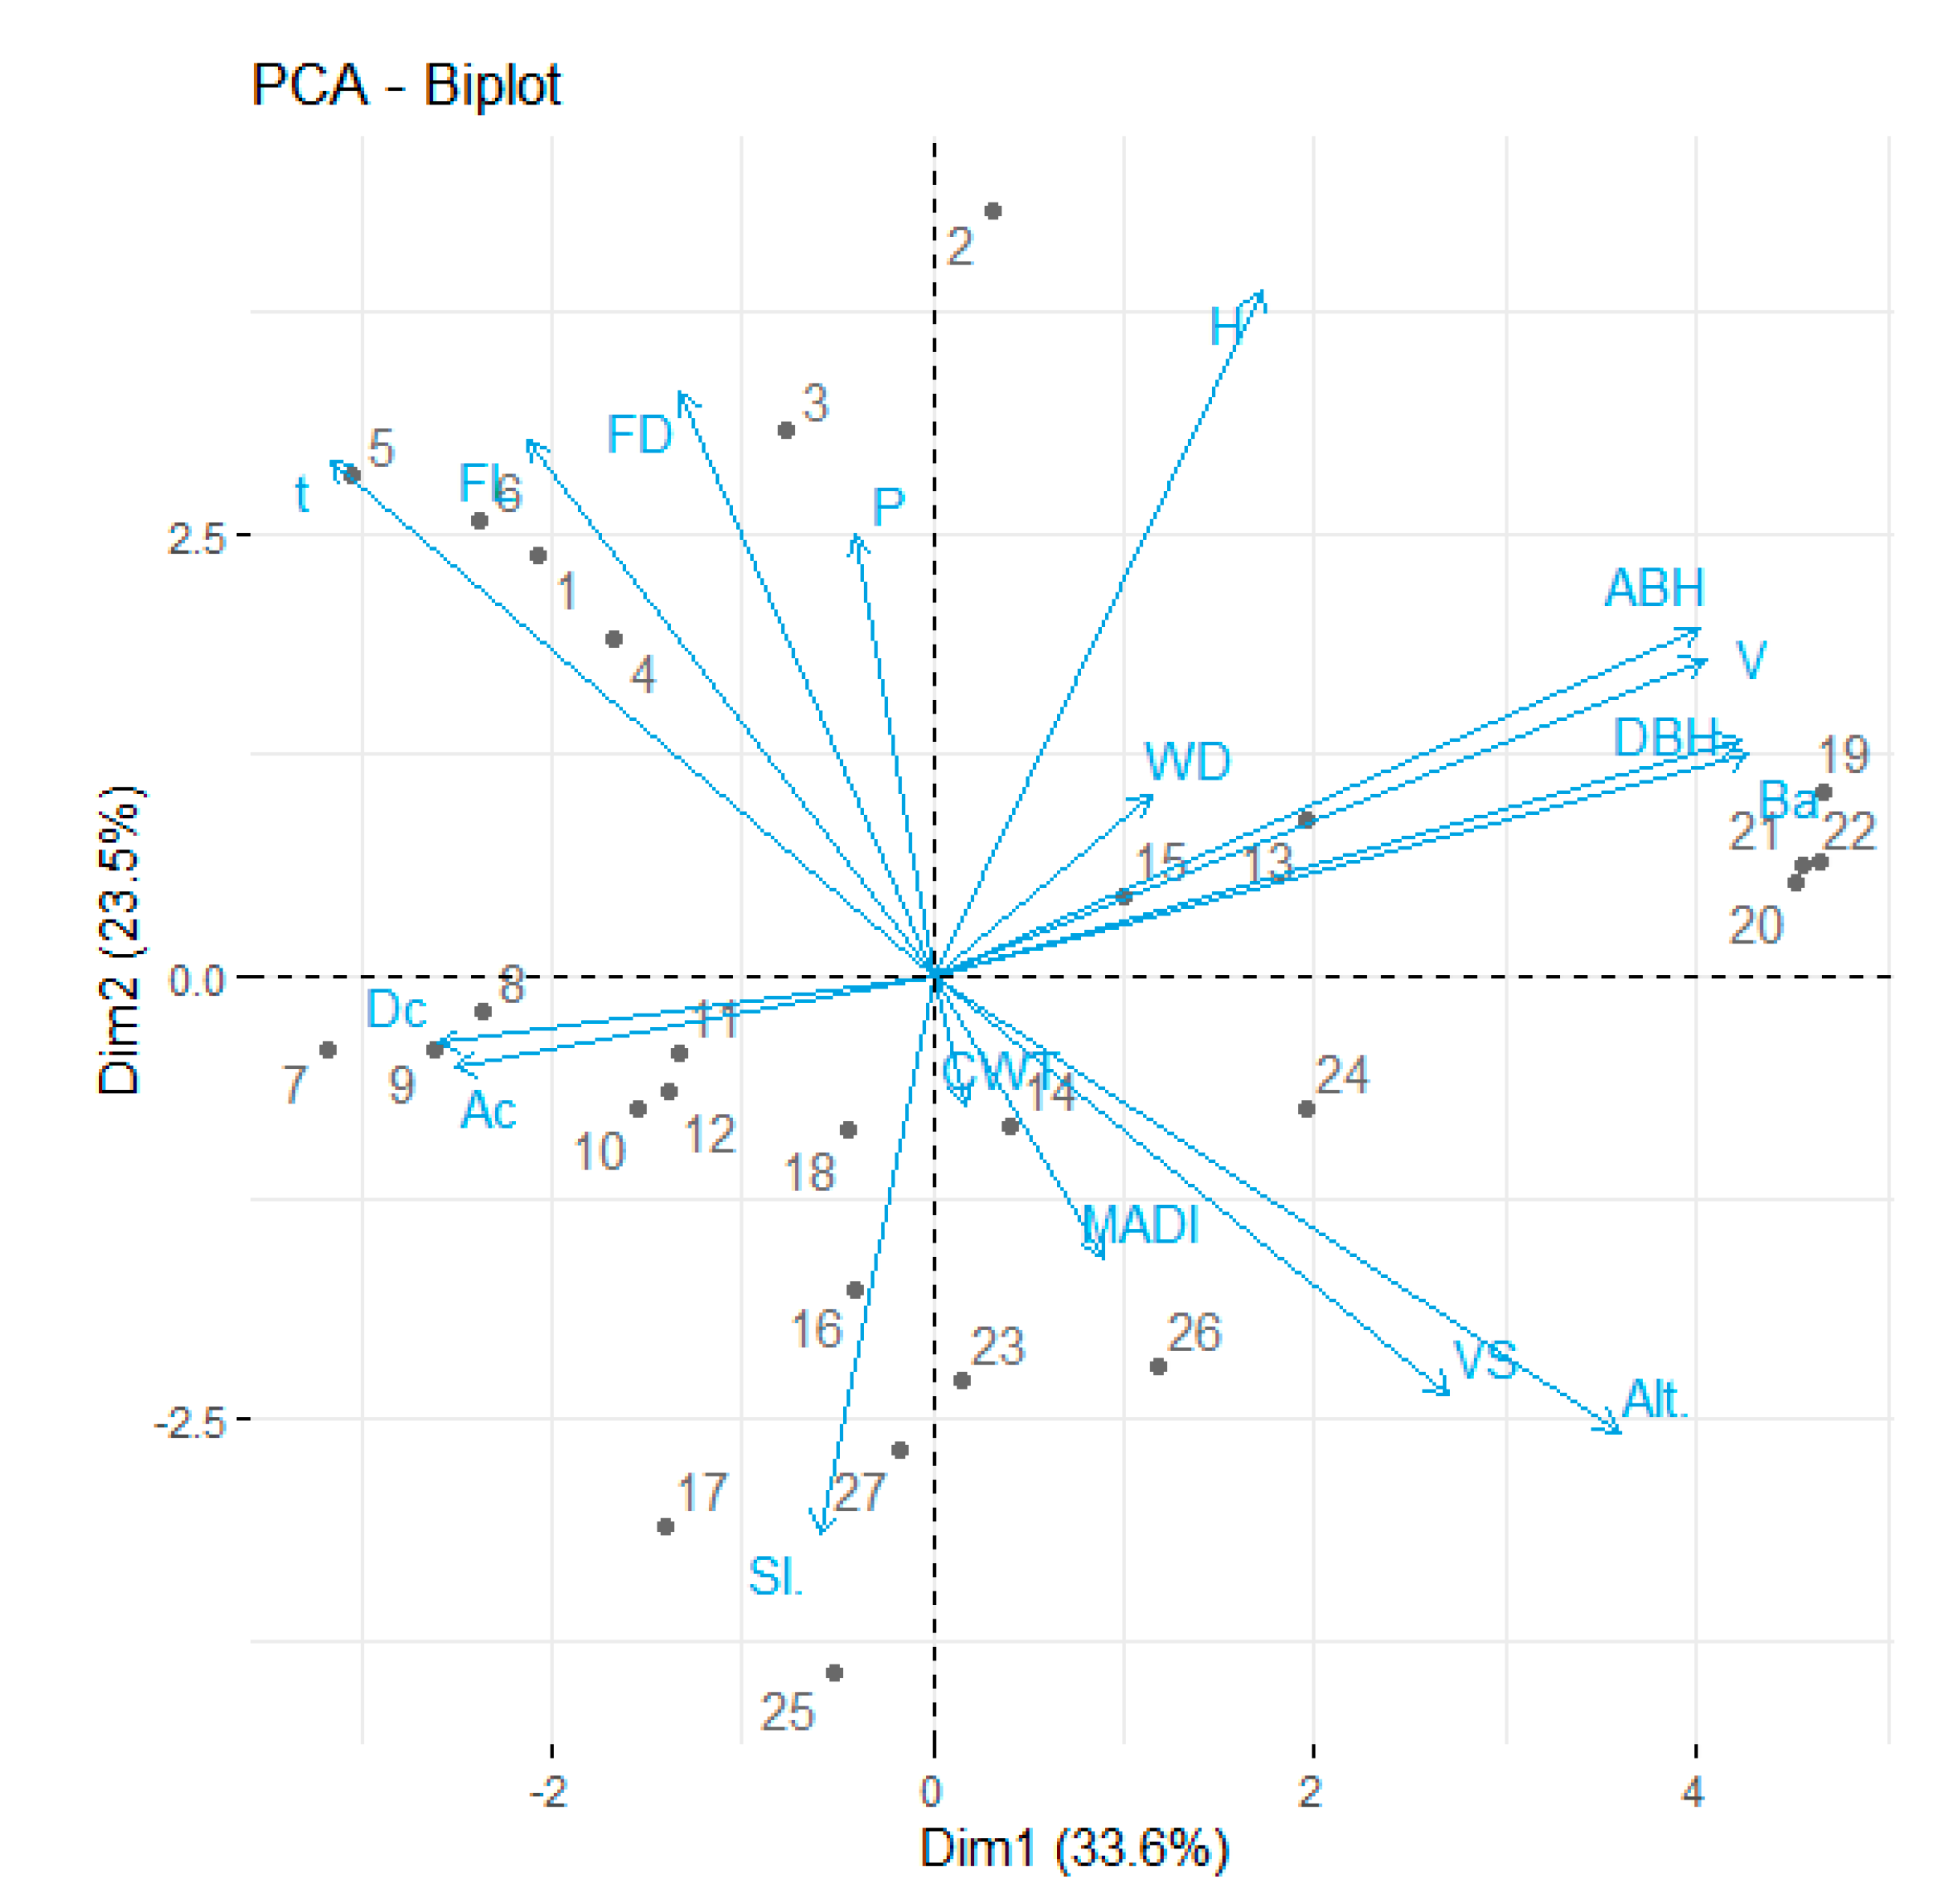
By using PCA, not only the number of comparisons between treatment means is reduced, but also the meaningfulness of these comparisons is enhanced. In the present study, multivariate analysis was used to identify obvious differences in wood properties and the selected traits. The results show that the first axis has the highest correlation with tree-level traits and the second axis has the highest correlation with the traits wood properties, altitude and temperature. Comparable results were reported by Kiaei et al. [11], Noshiro et al. [18], Yılmaz et al. [19] and Kaygin et al. [23].
As mentioned above, the location of the traits wood properties, tree characteristics and forest stand in different regions of PCA axes is based on correlation coefficients between the traits. Therefore, the location of the traits in the diagram (Figure 3) is significant and important. For example, the traits forest stands and wood properties that occupied a specific region and are close to each other have several similar characteristics between each other and consequently the correlation coefficient between those characteristics occupying opposites places in the diagram (Figure 3); for example, opposite directions of an axis show distinct variations. According to the PCA results, altitude and temperature are the most important traits affecting the wood properties. Rossi et al. (2015) [13] and Van Der Maaten-Theunissen et al. (2013) [47] pointed that variations in the wood properties are anticipated, especially in terms of latitude and altitude, which are inherently related to temperature and rainfall. Summarizing, PCA shows noticeable variations of wood properties in the study area across altitude and slope gradient. Since this method is of high accuracy and has different abilities, it could be used for a habitat analysis and determination of effective ecological factors. Analyzing ecological data using ordination methods provides a simpler understanding of the complex relationship among growth traits, wood properties and environmental gradients. In addition, this method is impaired by the existence of ineffective factors and the data complexity of ecological methods. Further work is needed to investigate the anatomical properties (fibers proportions, rays, vessels and parenchyma), ring width and cambial age changes with geographic variations.
5. Conclusions
In the present study, physical and wood fiber properties of Persian oak wood were investigated at different altitudes above the sea level and slopes. The results indicate that there is a significant statistical effect of altitude and slope on the fiber length, fiber diameter and volumetric swelling of Persian oak wood. In contrast, no significant differences were found between average values of oven-dry density. The results also show that altitude and temperature are the most important factors affecting the wood properties, as shown by PCA analysis. Respective study can be used for predication of wood quality due to climate change. The properties of the wood from higher altitude will become similar to the wood from lower altitudes.
Author Contributions
N.N., data curation; M.B., designing and performing experiments and writing the original paper; S.K., analyzing data and editing; M.H., review and editing; and G.K., review and editing. All authors have read and agreed to the published version of the manuscript
Funding
This research received no external funding.
Acknowledgments
We thank Shahrekord University and Gesellschaft der Förderer und Freunde des Zentrums Holzwirtschaft der Universität Hamburgfor financial support.
Conflicts of Interest
The authors declare no conflict of interest.
References
- Willis, J.C.A. Dictionary of the Flowering Plants and Ferns, 6th ed.; CUP Archive; Cambridge University Press: Cambridge, UK, 1978; pp. 1–245. [Google Scholar]
- Panahi, P.; Jamzad, Z.; Pourmajidian, M.R.; Fallah, A.; Pourhashemi, M. Folliar Epidermis Morphology in Quercus (Subgenus Quercus, Section Quercus) in Iran. Acta Bot. Croat. 2012, 71, 95–113. [Google Scholar] [CrossRef] [Green Version]
- Sagheb-Talebi, K.; Sajedi, T.; Yazdian, F. Forests of Iran. Research Institute of Forests and Rangelands. Forest Res. Div. 2004, 339, 28. [Google Scholar]
- McPherson, B.A.; Mori, S.R.; Wood, D.L.; Kelly, M.; Storer, A.J.; Svihra, P.; Standiford, R.B. Responses of Oaks and Tanoaks to the Sudden Oak Death Pathogen after 8y of Monitoring in Two Coastal California Forests. J. Environ. Econ. Manag. 2010, 259, 2248–2255. [Google Scholar] [CrossRef]
- Olfat, O.A.; Pourtahmasi, K. Anatomical characters in three oak species (Q. libani, Q. brantii and Q. infectoria) from Iranian Zagros Mountains. Aust. J. Basic Appl. Sci. 2010, 4, 3230–3237. [Google Scholar]
- Gava, J.L.; Goncalves, J.L.M. Soil attributes and wood quality for pulp production in plantations of Eucalyptus grandis clone. J. Agric. Sci. 2008, 65, 306–313. [Google Scholar] [CrossRef] [Green Version]
- Murphy, G.; Brownlie, R.; Kimberley, M.; Beets, P. Impacts of forest harvesting related soil disturbance on end-of-rotation wood quality and quantity in a New Zealand Radiata Pine Forest. Silva Fenn. 2009, 43, 147–160. [Google Scholar] [CrossRef] [Green Version]
- De Micco, V.; Campelo, F.; De Luis, M.; Bräuning, A.; Grabner, M.; Battipaglia, G.; Cherubini, P. Intra-annual density fluctuations in tree rings: How, when, where, and why? IAWA J. 2010, 37, 232–259. [Google Scholar] [CrossRef]
- Rigatto, P.A.; Dedecek, R.A.; Monteiro de Matos, J.L. Influence of soil attributes on quality of Pinus taeda wood for cellulose Kraft production. Rev. Arvore. 2004, 28, 267–273. [Google Scholar] [CrossRef]
- Topaloglu, E.; Ay, N.; Altun, L.; Serdar, B. Effect of altitude and aspect on various wood properties of Oriental beech (Fagus orientalis Lipsky) wood. Turk. J. Agric. For. 2016, 40, 397–406. [Google Scholar] [CrossRef]
- Kiaei, M.; Moosavi, V.; Ebadi, S.E. Effects of altitude on density and biometric properties of hornbeam wood (Carpinus betulus). Forest Syst. 2019, 28, e011. [Google Scholar] [CrossRef] [Green Version]
- Sousa, V.B.; Louzada, J.L.; Pereira, H. Variation of ring width and wood density in two unmanaged stands of the Mediterranean Oak Quercus faginea. Forests 2018, 9, 44. [Google Scholar] [CrossRef] [Green Version]
- Rossi, S.; Cairo, E.; Krause, C.; Deslauriers, A. Growth and basic wood properties of black spruce along an alti-latitudinal gradient in Quebec, Canada. Ann. For. Sci. 2015, 72, 77–87. [Google Scholar] [CrossRef]
- King, D.A.; Davies, S.J.; Tan, S.; Noor, N.S.M. The role of wood density and stem support costs in the growth and mortality of tropical trees. J. Ecol. 2016, 94, 670–680. [Google Scholar] [CrossRef]
- Kiaei, M.; Kord, B.; Chehalmardian, A.; Moya, R.; Farsi, M. Mineral content in relation to radial position, altitude, chemical properties and density of Persian ironwood. Maderas Cienc. Tecnol. 2015, 17, 657–672. [Google Scholar] [CrossRef] [Green Version]
- Govorcin, S.; Sinkovic, T.; Trajkovic, J. Some physical and mechanical properties of beech wood grown in Croatia. Wood. Res. Slovak. 2003, 48, 39–52. [Google Scholar]
- Barij, N.; Stokes, A.; Bogaard, T.; Van Beek, R. Does growing on a slope affect tree xylem structure and water relations? Tree Physiol. 2007, 27, 757–764. [Google Scholar] [CrossRef] [Green Version]
- Noshiro, S.; Joshi, L.; Suzuki, M. Ecological wood anatomy of Alnus nepalensis (Betulaceae) in east Nepal. J. Plant Res. 1995, 108, 1–9. [Google Scholar] [CrossRef]
- Yılmaz, M.; Serdar, B.; Altun, L.; Usta, A. Relationship between environmental parameters and wood anatomy of Quercus pontica C. Koch (Fagaceae). Fresenius Environ. Bull. 2008, 17, 902–910. [Google Scholar]
- Liu, J.; Noshiro, S. Lack of latitudinal trends in wood anatomy of Dodonaea viscosa (Sapindaceae), a species with a worldwide distribution. Am. J. Bot. 2003, 90, 532–539. [Google Scholar] [CrossRef]
- Pande, P.K.; Chauhan, L.; Singh, M. Wood anatomical variations within the genus Castanopsis. J. Trop. For. Sci. 2005, 17, 366–371. [Google Scholar]
- Hernandez, R.E.; Restrepo, G. Natural variation in wood properties of Alnus acuminate H.B.K. grown in Colombia. Wood Fiber Sci. 1995, 27, 41–48. [Google Scholar]
- Kaygin, B.; Esnaf, S.; Aydemir, D. The effect of altitude difference on physical and mechanical properties of Scots Pine wood grown in Turkey-Sinop province. Drvna. Ind. 2016, 67, 393–397. [Google Scholar] [CrossRef]
- Berges, L.; Nepveu, G.; Franc, A. Effects of ecological factors on radial growth and wood density components of sessile oak (Quercus petraea Liebl.) in Northern France. For. Ecol. Manag. 2008, 567–579. [Google Scholar] [CrossRef]
- Bahmani, M.; Saeedi, S.; Humar, M.; Kool, F. Effect of tree diameter classes on the properties of Persian oak (Quercus brantii lindl.) wood. Wood Res. Slovak. 2018, 63, 755–762. [Google Scholar]
- Chaharmahal and Bakhtiari Meteorological Administration. Koohrang Synoptic Meteorological Station. Partly. 2020. Available online: http://www.chbmet.ir/st_koohrang.asp (accessed on 15 June 2020).
- International Organization for Standardization. ISO 13061-14. In Determination of Volumetric Shrinkage; International Organization for Standardization: Geneva, Switzerland, 2016; p. 5. [Google Scholar]
- Franklin, G.L. Preparation of thin sections of synthetic resins and wood-resin composites, and a new macerating method for wood. Nature 1945, 155, 51. [Google Scholar] [CrossRef]
- Zobel, B.J.; Van Buijtenen, J.P. Wood Variation: Its Causes and Control; Springer: Berlin, Germany, 1989. [Google Scholar] [CrossRef]
- Preston, K.A.; Cornwell, W.K.; De Noyer, J.L. Wood density and vessel traits as distinct correlates of ecological strategy in 51 California coast range angiosperms. New Phytol. 2006, 170, 807–818. [Google Scholar] [CrossRef]
- Wagenführ, R.; Scheiber, C. Holzatlas. 2nd edition 720 p, 850 figs., 59 tab. Leipzig, VEB Fachbuchverlag. Cloth DM 18. -W. Liese. Wood Sci. Technol. 1985, 21, 110. [Google Scholar]
- Pásztory, Z.; Börcsök, Z.; Ronyecz, I.; Mohácsi, K.; Molnár, S.; Kis, S. Oven dry density of sessile oak, turkey oak and hornbeam in different region of Mecsek Mountain. Wood Res. Slovak. 2014, 59, 683–694. [Google Scholar]
- Zeidler, A.; Borůvka, V. Wood density of northern red oak and pedunculate oak grown in former brown coal mine in the Czech Republic. Bioresource 2016, 11, 9373–9385. [Google Scholar] [CrossRef] [Green Version]
- Guilley, E.; Hervé, J.C.; Nepveu, G. The influence of site quality, silviculture and region on wood density mixed model in Quercus petraea Liebl. For. Ecol. Manag. 2004, 189, 111–121. [Google Scholar] [CrossRef]
- Sopushynskyy, I.; Vintoniv, I.; Teischinger, A.; Michalak, R. The influence of site factors on wood density and moisture content of beech in the Ukrainian Carpathians. Wood Res. Slovak. 2005, 50, 43–49. [Google Scholar]
- Guler, C.; Copur, Y.; Akgul, M.; Buyuksari, U. Some chemical, physical and mechanical properties of juvenile wood from black pine (Pinus nigra Arnold) plantations. J. Appl. Sci. 2007, 7, 755–758. [Google Scholar] [CrossRef] [Green Version]
- Kiaei, M. Effect of site and altitude on wood density and shrinkage and their relationships in Carpinus betulus. Forest Stud. China 2012, 14, 229–234. [Google Scholar] [CrossRef]
- Panshin, A.J.; Zeeuw, C.D. Textbook of wood technology. In Volume I. Structure, Identification, Uses, and Properties of the Commercial Woods of the United States and Canada, 3rd ed.; McGraw-Hill: New York, NY, USA, 1980. [Google Scholar]
- Gryc, V.L.; Vavrčík, H.A. Effect of the position in a stem on the length of tracheids in spruce (Picea abies [L.] Karst.) with the occurrence of reaction wood. J. For. Sci. 2005, 51, 203–212. [Google Scholar] [CrossRef] [Green Version]
- Wheeler, E.A.; Baas, P.; Gasson, P.E. IAWA list of microscopic features for hardwood identification. In IAWA Bulletin n.s. 10 (3): 219–332 [4th Printing 2007]; International Association of Wood Anatomists at the National Herbarium of the Netherlands: Leiden, The Netherlands, 1989; pp. 219–332. [Google Scholar]
- Leal, S.; Sousa, V.B.; Pereira, H. Within and between-tree variation in the biometry of wood rays and fibres in cork oak (Quercus suber L.). Wood Sci. Technol. 2006, 40, 585–597. [Google Scholar] [CrossRef]
- Horn, R.A. Morphology of Pulp Fiber from Hardwoods and Influence on Paper Strength [Research Paper FPL 312]; US Department of Agriculture, Forest Service, Forest Products Laboratory: Madison, WI, USA, 1978. [Google Scholar]
- Atchison, J.E. Data on Non-Wood Plant Fibers. In The Secondary Fibers and Non-Wood Pulping; Hamilton, F., Leopold, B., 3rd, Eds.; TAPPI Press: Atlanta, GA, USA, 1987. [Google Scholar]
- Plomion, C.; Leprovost, G.; Stokes, A. Wood Formation in Trees. Plant Physiol. 2001, 127, 1513–1523. [Google Scholar] [CrossRef]
- Bahmani, M.; Fathi, L.; Koch, G.; Kool, F.; Aghajani, H.; Humar, M. Heartwood and sapwood features of Sorbus torminalis grown in Iranian forests. Wood Res. Slovak. 2020, 65, 195–204. [Google Scholar] [CrossRef]
- Sharma, M.; Sharma, C.L.; Kharkongor, B.M.; Carter, M.J. Wood anatomical variations in some species of Quercus of Meghalaya. J. Indian Acad. Wood Sci. 2011, 8, 152–157. [Google Scholar] [CrossRef]
- Van Der Maaten-Theunissen, M.; Boden, S.; Van Der Maaten, E. Wood density variations of Norway spruce (Picea abies L. Karst.) under contrasting climate conditions in southwestern Germany. Ann. For. Sci. 2013, 56, 91–103. [Google Scholar] [CrossRef]
Figure 1.
Location of the study area, the three forest stands and 27 sampling plots at nine study ecosites in the Bazoft region forest of Chaharmahal Va Bakhtiari, Iran.
Figure 1.
Location of the study area, the three forest stands and 27 sampling plots at nine study ecosites in the Bazoft region forest of Chaharmahal Va Bakhtiari, Iran.

Figure 2.
Diagram of specimen preparation from a disk of Q. brantii to measure the physical properties and fiber dimensions.
Figure 2.
Diagram of specimen preparation from a disk of Q. brantii to measure the physical properties and fiber dimensions.

Figure 3.
Graph of study variables based on first and second components. Notes: 1 Dc, crown diameter, crown width in m measured from below the tree in the field; 2 population level mean of tree-level mean fiber length weighted by Basal Area; 3 population level mean of tree-level standard deviation of fiber length calculated from a weighted variance function; 4 population level mean of tree-level coefficient of variation ((St. Dev/Mean) × 100)) calculated from a weighted variance function; 5 H, tree height (m); 6 DBH, tree diameter at breast height (cm); 7 ABH, tree age at breast height (year); 8 MADI, mean annual diameter increment (mm); 9 Ba, stem basal area (m2); 10 V, stem volume (m3); 11 Ac, crown basal area (m2); 12 Alt., altitude (m a.s.l); 13 Sl., slope (%); 14 P, mean annual precipitation (mm); 15 t, mean annual temperature (°C); 16 WD, wood oven-dry density (g/cm3); 17 VS, volumetric swelling (%); 18 FD, fiber diameter (μm); 19 FL, fiber length (mm); 20 CWT, cell wall thickness (μm); 21 Dim1, first component; 22 Dim1, second component; 23 contrib, variance explained by traits on first and second components; 24 PCA, principal component analysis.

Figure 4.
Biplot of sample plots and study variables based on first and second components. Notes: Dc, crown diameter; H, tree height (m); DBH, tree diameter at breast height (cm); ABH, tree age at breast height (year); MADI, mean annual diameter increment (mm); Ba, stem basal area (m2); V, stem volume (m3); Ac, crown basal area (m2); Alt., altitude (m a.s.l); Sl., slope (%);P, mean annual precipitation (mm); t, mean annual temperature (°C); WD, wood oven-dry density (g/cm3); VS, volumetric swelling (%); FD, fiber diameter (μm); FL, fiber length (mm); CWT, cell wall thickness (μm).


Table 1.
Descriptive statistics for the sample population of Persian oak representing nine different ecosites collected in the Bazoft region forest of Chaharmahal Va Bakhtiari, Iran.
Table 1.
Descriptive statistics for the sample population of Persian oak representing nine different ecosites collected in the Bazoft region forest of Chaharmahal Va Bakhtiari, Iran.
| Ecosites | E1S1 | E1S2 | E1S3 | E2S1 | E2S2 | E2S3 | E3S1 | E3S2 | E3S3 | |
|---|---|---|---|---|---|---|---|---|---|---|
| Latitude (N) m | 3,558,132 | 3,558,227 | 3,558,354 | 3,558,250 | 3,558,120 | 3,558,137 | 3,556,272 | 3,556,280 | 3,556,299 | |
| Longitude (W) m | 416,662 | 416,867 | 416,680 | 418,209 | 418,248 | 418,284 | 419,180 | 419,165 | 419,138 | |
| Altitude (m a.s.l) | 1717 | 1726 | 1742 | 1980 | 1987 | 1968 | 2280 | 2244 | 2232 | |
| Mean annual precipitation (mm) | 331 | 330 | 329 | 330 | 329 | 328 | 329 | 330 | 330 | |
| Mean annual temperature (°C) | 15.3 | 15.2 | 15.3 | 14.5 | 13.9 | 13.0 | 12.8 | 12.9 | 12.9 | |
| Tree-Level variables | Height (m) | 11.34 (2.15) | 10.14 (0.06) | 8.28 (0.60) | 6.63 (0.68) | 8.89 (0.24) | 6.91 (1.04) | 11.28 (0.11) | 7.98 (3.20) | 6.44 (2.74) |
| 1 DBH (cm) | 105.00 (8.00) | 73.00 (7.00) | 75.00 (1.00) | 65.67 (2.52) | 108.00 (16.00) | 83.00 (9.54) | 157.33 (2.52) | 119.00 (41.00) | 82.67 (20.65) | |
| 2 ABH (year) | 1164 (148) | 767 (30) | 649 (17) | 755 (15) | 1089 (80) | 847 (177) | 1417 (4) | 1146 (386) | 813 (257) | |
| Stem basal area (m2) | 0.87 (0.13) | 0.42 (0.08) | 0.44 (0.01) | 0.34 (0.03) | 0.93 (0.28) | 0.55 (0.12) | 1.95 (0.06) | 1.20 (0.77) | 0.56 (0.25) | |
| Stem volume (m3) | 5.02 (1.68) | 2.13 (0.40) | 1.83 (0.09) | 1.12 (0.20) | 4.15 (1.32) | 1.86 (0.36) | 10.99 (0.25) | 5.60 (5.14) | 2.03 (1.38) | |
| Crown basal area (m2) | 22.22 (10.07) | 19.71 (3.14) | 27.24 (7.31) | 20.38 (0.36) | 13.04 (0.48) | 24.03 (6.60) | 14.89 (0.31) | 13.71 (1.48) | 21.73 (14.79) | |
| 3 Crown diameter (m) | 5.23 (1.23) | 5.00 (0.40) | 5.86 (0.80) | 5.10 (0.05) | 4.08 (0.08) | 5.50 (0.74) | 4.36 (0.05) | 4.18 (0.23) | 5.07 (1.73) | |
| 4 MADI (mm) | 0.91 (0.05) | 0.95 (0.06) | 1.16 (0.02) | 0.87 (0.02) | 0.99 (0.08) | 1.01 (0.21) | 1.11 (0.02) | 1.04 (0.01) | 1.04 (0.10) | |
| Stand-Level variables | Basal Area (m2) | 109.89 | 72.23 | 57.70 | 89.24 | 103.34 | 109.95 | 110.66 | 69.52 | 113.23 |
| Stand Density (N/ha) | 160 | 120 | 120 | 90 | 115 | 77 | 150 | 105 | 123 | |
| 5 QMD (cm) | 93.54 | 87.57 | 78.26 | 112.39 | 106.99 | 135.17 | 96.94 | 91.84 | 108.14 | |
Notes: 1 DBH, diameter at breast height; 2 ABH, age at breast height. 3 Crown width in m measured from below the tree in the field. 4 MADI, mean annual diameter increment; 5 QMD, quadratic mean diameter. Standard deviations are displayed in parentheses.
Table 2.
The average (standard deviation) of physical properties in three different altitudes and slope classes of Persian oak in the Bazoft region forest of Chaharmahal Va Bakhtiari, Iran.
Table 2.
The average (standard deviation) of physical properties in three different altitudes and slope classes of Persian oak in the Bazoft region forest of Chaharmahal Va Bakhtiari, Iran.
| Wood Properties | Altitude (m) | ||||||||
|---|---|---|---|---|---|---|---|---|---|
| 1730 m (Low) | 1980 m (Intermediate) | 2250 m (High) | |||||||
| Slope <30% | Slope 30–45% | Slope >45% | Slope <30% | Slope 30–45% | Slope >45% | Slope <30% | Slope 30–45% | Slope >45% | |
| Oven-dry density (g/cm3) | 0.73 (0.05) | 0.80 (0.01) | 0.78 (0.02) | 0.78 (0.01) | 0,83 (0.16) | 0.78 (0.09) | 0.81 (0.01) | 0.78 (0.05) | 0.74 (0.03) |
| Volumetric swelling (%) | 12.53 (0.69) | 12.58 (1.23) | 10.92 (1.50) | 19.91 (0.07) | 21.74 (0.39) | 20.01 (1.91) | 19.33 (1.12) | 19.13 (2.07) | 19.91 (2.67) |
Standard deviations are displayed in parentheses.
Table 3.
Multivariate analysis of Variance (MANOVA) results of wood properties.
| Source of Variation | Wood Properties | Sum of Squares | DF | Mean Square | F | Sig. |
|---|---|---|---|---|---|---|
| Altitude | Oven-dry density | 0.003 | 2 | 0.001 | 0.332 | 0.722 ns |
| Volumetric swelling | 388.719 | 2 | 194.360 | 84.531 | 0.000 ** | |
| Fiber length | 0.136 | 2 | 0.068 | 168.064 | 0.000 ** | |
| Fiber diameter | 18.025 | 2 | 9.012 | 23.417 | 0.000 ** | |
| Cell wall thickness | 0.021 | 2 | 0.010 | 0.216 | 0.808 ns | |
| MADI | 0.052 | 2 | 0.026 | 3.684 | 0.046 * | |
| Slope | Oven-dry density | 0.007 | 2 | 0.003 | 0.828 | 0.453 ns |
| Volumetric swelling | 3.490 | 2 | 1.745 | 0.759 | 0.483 ns | |
| Fiber length | 0.014 | 2 | 0.007 | 17.239 | 0.000 ** | |
| Fiber diameter | 6.778 | 2 | 3.389 | 8.805 | 0.002 ** | |
| Cell wall thickness | 0.225 | 2 | 0.112 | 2.320 | 0.127 ns | |
| MADI | 0.052 | 2 | 0.026 | 3.645 | 0.047 * |
DF: Degree of Freedom, F: F-test, * Significant (Sig.) at the 0.05 significance level, ** significant at the 0.01 significance level, ns not significant. Mean annual diameter increment (MADI).
Table 4.
The average values of fiber dimensions in three different altitudes and slope of Persian oak in the Bazoft region forest of Chaharmahal Va Bakhtiari, Iran.
Table 4.
The average values of fiber dimensions in three different altitudes and slope of Persian oak in the Bazoft region forest of Chaharmahal Va Bakhtiari, Iran.
| Wood Properties | Altitude (m) | ||||||||
|---|---|---|---|---|---|---|---|---|---|
| 1730 m (Low) | 1980 m (Intermediate) | 2250 m (High) | |||||||
| Slope <30% | Slope 30–45% | Slope >45% | Slope <30% | Slope 30–45% | Slope >45% | Slope <30% | Slope 30–45% | Slope >45% | |
| Fiber length (mm) | 0.94 (0.02) | 0.96 (0.03) | 0.92 (0.01) | 0.87 (0.01) | 0.92 (0.01) | 0.91 (0.02) | 0.81 (0.02) | 0.82 (0.02) | 0.70 (0.04) |
| Fiber diameter (μm) | 21.54 (1.71) | 23.30 (0.40) | 20.09 (0.10) | 19.70 (0.01) | 20.09 (0.19) | 19.82 (0.26) | 20.06 (0.06) | 20.00 (0.12) | 19.81 (0.52) |
| Cell wall thickness (μm) | 6.02 (0.03) | 5.55 (0.15) | 5.71 (0.05) | 5.84 (0.02) | 5.95 (0.06) | 5.82 (0.63) | 5.78 (0.03) | 5.83 (0.02) | 5.83 (0.08) |
Standard deviations are displayed in parentheses.
Table 5.
Total variance explained and calculated eigenvalues for the principal components.
| Component | Total Variance Explained Initial Eigenvalues | ||
|---|---|---|---|
| Total | Percent of Variance | Cumulative Percent | |
| 1 | 5.715 | 33.615 | 33.615 |
| 2 | 3.999 | 23.522 | 57.136 |
| 3 | 2.096 | 12.330 | 69.466 |
| 4 | 1.639 | 9.639 | 79.105 |
| 5 | 1.117 | 6.570 | 85.675 |
| 6 | 0.916 | 5.390 | 91.065 |
| 7 | 0.661 | 3.891 | 94.956 |
| 8 | 0.358 | 2.104 | 97.060 |
| 9 | 0.228 | 1.340 | 98.400 |
| 10 | 0.121 | 0.712 | 99.112 |
| 11 | 0.087 | 0.514 | 99.626 |
| 12 | 0.029 | 0.170 | 99.796 |
| 13 | 0.021 | 0.125 | 99.921 |
| 14 | 0.010 | 0.062 | 99.983 |
| 15 | 0.002 | 0.014 | 99.996 |
| 16 | 0.001 | 0.003 | 99.999 |
| 17 | 9.669 × 10⁻⁵ | 0.001 | 100.000 |
Table 6.
Factor load traits in each of the principal components.
| Component | ||||||
|---|---|---|---|---|---|---|
| 1 | 2 | 3 | 4 | 5 | ||
| Precipitation | 0.130 | 0.282 | 0.022 | −0.628 * | −0.192 | |
| Temperature | −0.201 | 0.820 * | 0.266 | −0.267 | 0.066 | |
| Altitude | 0.297 | −0.859 * | −0.282 | 0.152 | −0.067 | |
| Slope | −0.321 | −0.246 | 0.134 | 0.772 * | 0.175 | |
| DBH | 0.963 * | −0.212 | −0.120 | 0.046 | 0.019 | |
| Tree Height | 0.788 * | 0.469 | 0.010 | −0.214 | 0.119 | |
| Tree crown diameter | −0.197 | 0.159 | 0.943 * | 0.082 | −0.073 | |
| Tree basal area | 0.958 * | −0.225 | −0.137 | 0.067 | 0.025 | |
| Tree crown basal area | −0.190 | 0.134 | 0.941 * | 0.105 | −0.097 | |
| Tree Volume | 0.975 * | −0.106 | −0.144 | 0.017 | 0.007 | |
| Tree Age | 0.915 * | −0.184 | −0.168 | −0.219 | 0.081 | |
| Tree annual diameter increment | 0.244 | −0.031 | 0.124 | 0.840 * | −0.268 | |
| Oven-dry Density | 0.288 | −0.019 | 0.079 | 0.013 | 0.827 * | |
| Fiber length | −0.040 | 0.739 * | 0.136 | −0.216 | 0.269 | |
| Fiber diameter | 0.045 | 0.784 * | −0.266 | −0.195 | 0.024 | |
| Cell wall thickness | 0.120 | −0.164 | 0.303 | −0.075 | −0.833 * | |
| Volumetric swelling | 0.120 | −0.869 * | −0.109 | −0.092 | 0.181 | |
* Features that contributed most for Axes 1–5. Extraction Method: Principal Component Analysis. Rotation Method: Varimax with Kaiser Normalization. a. Rotation converged in 5 iterations.
© 2020 by the authors. Licensee MDPI, Basel, Switzerland. This article is an open access article distributed under the terms and conditions of the Creative Commons Attribution (CC BY) license (http://creativecommons.org/licenses/by/4.0/).
Share and Cite
MDPI and ACS Style
Nazari, N.; Bahmani, M.; Kahyani, S.; Humar, M.; Koch, G. Geographic Variations of the Wood Density and Fiber Dimensions of the Persian Oak Wood. Forests 2020, 11, 1003. https://doi.org/10.3390/f11091003
AMA Style
Nazari N, Bahmani M, Kahyani S, Humar M, Koch G. Geographic Variations of the Wood Density and Fiber Dimensions of the Persian Oak Wood. Forests. 2020; 11(9):1003. https://doi.org/10.3390/f11091003
Chicago/Turabian StyleNazari, Noorollah, Mohsen Bahmani, Saleh Kahyani, Miha Humar, and Gerald Koch. 2020. "Geographic Variations of the Wood Density and Fiber Dimensions of the Persian Oak Wood" Forests 11, no. 9: 1003. https://doi.org/10.3390/f11091003
Note that from the first issue of 2016, this journal uses article numbers instead of page numbers. See further details here.