Article

Analysis of Pollination Services Provided by Wild and Managed Bees (Apoidea) in Wild Blueberry (Vaccinium angustifolium Aiton) Production in Maine, USA, with a Literature Review

by
Sara L. Bushmann
1,* and
Francis A. Drummond
2
1
George Stevens Academy, Blue Hill, ME 04614, USA
2
School of Biology and Ecology, University of Maine, Orono, ME 04469, USA
*
Author to whom correspondence should be addressed.
Agronomy 2020, 10(9), 1413; https://doi.org/10.3390/agronomy10091413
Submission received: 17 August 2020 / Revised: 11 September 2020 / Accepted: 15 September 2020 / Published: 17 September 2020
(This article belongs to the Special Issue Pollinator Diversity and Pollination in Agricultural Systems)

Abstract

:
Maine is the largest producer of wild blueberry (Vaccinium angustifolium Aiton) in the United States. Pollination comes from combinations of honey bees (Apis mellifera (L.)), commercial bumble bees (Bombus impatiens Cresson), and wild bees. This study addresses (1) previous research addressing wild-blueberry pollination, (2) effects of wild-bee and honey-bee activity densities on fruit set, yield, and crop value, (3) the economic value of wild-bee communities, and (4) economic consequences of pollinator loss. Bee communities were sampled in 40 fields over three years (2010–2012) and bee activity densities were estimated for bumble bees, honey bees, and other wild bees. These data were applied to an economic model to estimate the value of bee taxa. Bumble bees and honey bees predicted fruit set and reduced its spatial heterogeneity. Other wild bees were not significant predictors of fruit set. Yield was predicted by fruit set and field size, but not pest management tactics. Our analysis showed that disruption in supply of honey bees would result in nearly a 30% decrease in crop yield, buffered in part by wild bees that provide “background” levels of pollination. Honey-bee stocking density and, thus, the activity density of honey bees was greater in larger fields, but not for wild bees. Therefore, a decrease in crop yield would be greater than 30% for large fields due to the proportionally greater investment in honey bees in large fields and a relatively lower contribution by wild bees.

1. Introduction

Lowbush blueberry (Ericaceae: Vaccinium angustifolium Aiton), the dominant plant in the wild blueberry species complex (see Appendix A), contributes prominently to Maine’s economy. Maine is the largest producer of wild blueberry in the United States [1], a crop that, from 2012–2018, averaged 39.3 ± 9.2 (SD) million kg berries/year and was worth an average of USD 3.85/kg [2]. With over 8000 harvested hectares each year [2], blueberry crop production values are only exceeded by northern Maine’s potato industry [3].
Wild blueberry is primarily an outcrossing native North American fruit crop that relies on insects to vector pollen from one clone (genetically unique individual plant) to another [4]. Bees are the primary pollinators of wild blueberry (see Appendix A). Bushmann and Drummond [5] documented more than 120 bee species associated with wild-blueberry fields. This is approximately 43% of the total 278 bee species recorded in Maine [6]. On the basis of a single bee flower visit, bumble-bee queens (Bombus) are the most efficient pollinator of wild blueberry, followed in efficiency by bees of the genera Andrena and Osmia [7,8]. Before 1960, most wild-blueberry farmers relied upon resident wild bees for pollination [9]. Honey bees (Apis mellifera (L.), which are not native to North America, were evaluated as pollinators in the 1950s–1980s [9] and are currently used by the majority of wild-blueberry farmers in the US and Canada despite many growers relying on wild bees for at least part of their pollination [10,11,12] (also see Appendix A). The commercially available common eastern bumble bee (Bombus impatiens Cresson) and the alfalfa leafcutting bee (Megachile rotundata Fabr) also provide pollination that supplements that provided by wild bees [13,14,15,16,17]. Currently, in Maine, a substantial proportion of farmers employ these alternative commercial bees or simply rely on resident wild pollinators [10,11,12].
A few studies compared the field-level pollination efficacy of wild bees and the managed honey bee. Asare et al. [18] found that, on a per bee basis, honey bees and wild bees increase fruit set by 0.8% and 11.0%, respectively, for each increase in a unit bee. On a field basis, they estimated that honey bees contribute more to fruit set than wild bees owing to their greater numbers. An economic analysis of pollination by Hoshide et al. [19] showed that the net income for Maine wild blueberry farmers attributable to wild bees was USD 613/ha and that for honey bees was USD 923/ha. They also estimated attributable net income per bee, calculated using observed wild-bee densities and honey-bee hive bee counts. For rented honey bees, pollination value was USD 0.012/bee. Wild-bee pollination value per bee was estimated at USD 0.311/bee. Attributable net income values per wild bee were greater than those for rented honey bees due to wild bees’ greater pollination efficiency.
In Section 1 and Appendix A, we review published studies on wild-blueberry reproductive biology, pollination, and bee communities. Despite all of these studies (>80), there is only limited knowledge of the role that the wild-bee community plays in wild-blueberry pollination. Our study of wild-bee communities in blueberry fields conducted between 2010 and 2012 will expand understanding of wild-blueberry pollination. Specifically, we ask the following questions: (1) How does wild-bee abundance (bumble-bee queens and other wild bees) and species richness affect mean fruit set and its variance and fruit yield, relative to the honey bee? (2) Can we estimate the economic value of the wild native bee community as a whole, and which taxonomic group(s) most contributes to this value?
We ask these questions about a production system that depends on commercial pollinators while wild bees forage freely in fields. Given adequate populations, wild pollinators can provide sufficient pollination services for wild-blueberry production [18,20] or serve as additional pollinators in fields that use commercial bees [14,17,18]. However, given the past, current, and predicted future decline of wild-bee populations, densities sufficient for primary or even background pollination services cannot be assumed in the future [21,22]. What is the economic value of wild bees for an insect-dependent crop? The answer to that question will help us understand the value or cost of considering pollination strategies [23,24,25].

2. Materials and Methods

2.1. Fields

With this study, we chose 40 Maine wild-blueberry fields located in Hancock and Washington Counties in 2010–2012. Nearly 88% of the wild blueberries produced in Maine originate from these two counties [2]. These are the northeastern counties that comprise Maine’s “Downeast” region, created by retreating glaciers and characterized by sand and silt glacial deposits [26,27,28]. Fields were visited over a three-year period: 2010 (12 fields), 2011 (12 fields), and 2012 (16 fields). Fields ranged from 0.5 to 16.3 ha with a median field size of 3.4 ha. Several field characteristics were related to field size (see Section 3); thus, in addition to using the continuous measure of field size, fields were categorized as small and large in relation to the estimated median field size (n = 40) in order to minimize correlation among predictor variables. Small fields (n = 22) included fields less than or equal to the median field size, while large fields (n = 18) were those that exceeded the median. Fields of both size categories were included in all years. The 2010 and 2011 fields were located in Hancock County. In 2010, fields ranged from 0.2 to 19.0 km (mean = 8.6 km) between fields. In 2011, fields ranged from 0.1 to 22.3 km (mean = 6.2 km) between fields. In 2012, the study area included northern regions of Hancock County and Washington County, which increased the distance between the fields. The 2012 fields ranged from 0.9 to 77.0 km (mean = 30.8 km) between fields. The distances between fields were measured on Google Earth (©2013 Google, https://www.google.com/earth/versions/#download-pro) from points originating in the middle of the field, without compensation for curvature of the earth.
Most of the fields were distinct, isolated blueberry fields surrounded by boreal spruce/fir forest [29] or non-crop open land, with two exceptions. In one case, a field opened on one edge to a non-study blueberry field that was in a different production cycle (i.e., bordering field was pruned and not in bloom) and, in the second case, a road separated two study fields that were under different management regimes.
Pollination management for most fields relied on honey bees rented by farmers (24 fields). Six fields were stocked with commercial bumble bees (Bombus impatiens) purchased by farmers, whereas seven relied on wild bees including rental honey bees stocked in neighboring fields (see [18] for prevalence). One field used a combination of rental honey bees and commercial bumble bees and two fields were serviced by two colonies of stationary, resident honey bees.
Each study year, we obtained yield measures (kg berries/field) from the cooperating farmers. For all unharvested fields (n = 2), we harvested berries by hand, raking in a measured area of the field and estimated kg berries from these subsamples of harvested yield. We determined field size from digitized records using ArcGIS version 10 [30]. With these data, we estimated kg berries/ha for 34 of the 40 fields. For all analyses pertaining to yield or crop value, the six fields without yield data were omitted.

2.2. Fruit Set

In early to mid-May of each year, nine representative clones (genetically distinct plants, see Appendix A) were selected. Clones typically range in size from <1 m2 to >500 m2, mean = 43.3 m2 [31]. Three clones were selected near the center of the field, three about halfway between the edge and center, and three near the field edge. In order to compensate for microregional differences in growth, clones were selected throughout the field, although no clone was selected directly adjacent to honey-bee hives. Four stems were randomly chosen and tagged in each clone. Stems were visited three times. The first visit resulted in a count of the flowers per stem. The second visit took place in early June during which the ripening fruit was counted as a measure of fruit set, which we refer to as early fruit set. The last visit occurred in late June for a final count of developing fruit. The proportion of fruit at the final count that developed from the initial flowers is a measure of late fruit set, after some of the premature fruit drop has occurred [32]. Late fruit set is not necessarily a measure of harvestable fruit as harvest typically occurs 3–6 weeks later, a time period during which environmental conditions can further reduce fruit number. We also estimated the coefficient of variation (CV) of late fruit set for each field. This metric was used to measure the evenness of pollination between the nine selected clones [33]. Using least-squares linear multiple regression, we examined the influence of bee activity densities for all three bee groups (see Section 2.8) on measures of fruit set [34].

2.3. Economic Modeling

Losey and Vaughan [35] developed a mathematical expression to estimate the economic value of wild bees as pollinators of vegetable and fruit crops produced nationwide. Their formula is based upon United States Department of Agriculture reported national monetary values of vegetable and fruit crops, the reported dependency of that crop on insect pollination for fruit set, and the proportion of pollinating insects that are wild bees in order to calculate the level of pollination services attributable to wild bees.
Their equation states
Vnp = Σ [V × D × (1 − P)],
where Vnp is the annual value of the crop attributable to native pollinators, V is the annual value of the crop as determined by the US Department of Agriculture, D is the dependency of each crop on insect pollination, and 1 − P is the proportion of the effective insect pollinators (in abundance) that are wild native bee species.
We used the Losey and Vaughan [35] model by considering that, for wild blueberry, D = 1, since it is assumed no wild-blueberry fruit is produced without insect pollinators [4,9] (see also Appendix A). Therefore, D was eliminated from the equation. We also changed Vnp and V to be equal to the value in US dollars found per blueberry field, not as a total of the entire blueberry industry, and we used the representation Vbee instead of Vnp to stand for any bee taxon or group.
The modified equation states, for each field,
Vbee = V × (1 − P),
where Vbee is the value in US dollars of the blueberry crop for a given field for a given year that is attributable to a target bee group, V is the annual gross value in US dollars of the blueberry crop for a given field for a given year, 1 − P is the proportion of bee abundance represented by the target bee group found in a given field and year, and P is the proportion of bee abundance that belongs to the non-target bee groups. The gross value of crop (V) was farmer-reported and the proportions of bee groups were determined as described in Section 2.4.
We chose to consider three target bee groups: honey bees (HB), bumble bees (BB), and other wild bees (OB). The OB group includes all non-Apis, non-Bombus bee genera which are not commercially managed, including the cleptoparasitic bees (e.g., Sphecodes) and species that may not be native to North America [36], but these non-native species are not common in Maine wild-blueberry fields [6]. We did not consider pollinating insects other than bees in our assessments of total pollinator community, which excludes suspected but undocumented pollination by some Lepidoptera, Diptera, Coleoptera, and Formicidae [37,38].
We initially calculated the value of the three bee groups by giving equal weight to the pollination ability of honey bees vs. wild bees. This likely underestimates the value of the wild-bee community, as those are shown to be more efficient pollinators of blueberry than honey bees [7,8,18]. We then recalculated the value of each bee group by adjusting the proportions of the groups by pollination equivalencies determined by Javorek et al. [7] (see Section 2.6).

2.4. Determining Proportions of Bee Groups

The proportion of each bee group was based on timed activity-density counts of foraging bees observed in the field. For all three study years, over the course of blueberry bloom (early May–early June) and up to 10 days beyond bloom, each of the 40 fields was visited 3–4 times for measuring bee activity density. Observations were made only when bees were most likely to be active and foraging: mostly sunny conditions, with wind speeds below 1.6 kph and temperature above 12° C [8]. The activity-density counts of all three bee groups were obtained on the same visit.
In all years of the study, a bumble-bee (Bombus spp.) activity-density measure was obtained by one observer, working in a randomly chosen section of the field, counting foraging bumble bees while walking through the field along a straight line at a slow pace for 15 min. Care was taken to make sure bees were not recounted as they moved from one foraging spot to another or were disturbed by the observer. As wild-blueberry plants are less than one-half meter tall and queens (usually >1.5 cm in length) mostly forage near the top of the plant, this method of observation is likely to reveal all bees in the vicinity. The bumble bees were not identified to species, but workers from fields that stocked with Bombus impatiens were not counted. Workers of other species (determined by visual inspection without capturing the bees) and B. impatiens from fields not stocked with commercial colonies were counted when they appeared toward the end of bloom.
In 2011, foraging honey-bee activity density was assessed by trapping single bees in individual lidded cups during a 5–10 min period. The bees were released after counting. In 2012, honey-bee activity density was measured by placing a quadrat, 0.9 m per side, around a blooming patch and, after waiting one minute to allow the bees to settle, counting the number of bees foraging on flowers in one minute. This was done for 15 randomly chosen locations in the field. Field assessments of honey-bee activity densities were not recorded in 2010, but estimated from our observations in 2011 and 2012 (see Section 2.5).
In all years of the study, wild-bee collection involved groups of 2–3 people hand-catching bees found foraging on flowers. Each collection bout lasted 15 min. During the bouts, any non-Bombus bee found foraging on any flower in the field (including non-blueberry) was collected in a clean, lidded cup and placed on ice in a cooler until transfer to a freezer (−20 °C) where they were stored until pinning. Bumble bees were specifically avoided as only queens forage during blueberry bloom. All bees were identified to genus using the online key at Discover Life (https://www.discoverlife.org/bees/) and later identified to species [5]. From this collection, we calculated the numbers of bees caught per minute for each non-Apis and each non-Bombus genus. These measures include bees caught during bloom and those caught on non-crop flowers as bloom ended.
The activity-density measures for all three bee groups, expressed as bees/minute, account for all bee taxa found in the fields. From these activity-density measures, we calculated the proportion of honey bees (HB), bumble bees (BB), and other wild bees (OB) foraging in the field.

2.5. Determining Honey-Bee Activity and the Proportion of Honey Bees Foraging for 2010

We used linear regression to estimate values for honey-bee activity and the proportion of honey bees foraging in 2010 (see Section 3.1). The number of honey-bee hives placed in the fields was known for 2010. This model, described by Equation (4) (see Section 3), assumes a background proportion of 0.519 honey bees/field (y-intercept). This proportion was then used to calculate the value of the bee groups for 2010 fields.

2.6. Adjusting the Economic Value of the Bee Groups on the Basis of a Pollination Equivalency

Javorek et al. [7] calculated a pollination equivalency, i.e., the number of wild-blueberry flowers pollinated in the time it takes a honey bee to pollinate one flower, for five genera including Bombus (bumble bees) and Andrena. They determined that, for each flower pollinated by a honey bee, bumble bees pollinate 5.9 flowers and that an Andrena pollinates 3.6 flowers. This pollination equivalency for bumble bees reflects an average of values presented for queens and workers [7]. We used this average since a few workers can appear at the end of bloom, even though most foraging bees during blueberry bloom in Maine are queens. Using the pollination equivalencies, field measures of bees per minute for both Bombus and Andrena were recalculated, and then the proportions of honey bees, bumble bees, and “other bees” foraging in each field were recalculated. We considered pollination equivalency for Andrena because species of this genus were common in our collection and several species carried high levels of Vaccinium pollen [5]. We only considered the 34 fields from the full dataset for which we had yield values. For this analysis, we used the estimated honey-bee activity densities for 2010.

2.7. Determining Species Richness

The hand-caught solitary bee collection was supplemented with solitary bees caught in bowl traps during blueberry bloom and with a summer bumble bee collection that occurred after bloom. Details of this collection can be found in Bushmann and Drummond [5]. With this larger collection of bees, a measure of species richness defined as the total number of species was determined for all 40 fields.

2.8. Statistical Analysis

Data from all 40 fields were used for most analyses. All statistical tests were performed with JMP 14.0 [34]. We were not able to obtain yield for six fields (four fields from 2010, two from 2012). These fields are excluded from all analyses of yield and crop value. Linear Pearson correlation analysis was used to assess the association between the activity density of bee groups and measures of fruit set (early, late, and CV) over all years. To explicitly model the effect of year on bee group activity density and our three measures of fruit set, we used general linear models with year as a categorical independent variable. General linear models were constructed with year as a categorical independent variable and field size as both a categorical and a continuous independent variable to assess the effect of field size on bee group activity density, fruit set, and yield.
Using generalized linear mixed models, the influence of bee activity density was examined for all three bee groups (BB, HB, OB) and bee species richness on the three fruit set measures on yield. In these models, year was considered a random effect and all bee group activity density and bee richness predictors were considered fixed effects. The marginal r2 (proportion of total variance explained by fixed effects only) was calculated to determine the total variance explained by the predictors. Model fit and appropriateness was evaluated with the chi-square convergence test. Fixed effects were tested for significance using Satterthwaite’s method for estimating denominator degrees of freedom in fixed effects F-tests in a mixed model [39].
Predicting Fruit Set—Two general linear models were constructed to examine wild-bee activity density in conjunction with honey-bee activity-density measures on the influence of percentage late fruit set and fruit set CV. For the first set of models, all wild bees were combined into a total wild-bee (WB) activity-density measure (“other bees” + bumble bees) and, in the second set of models, bumble bees and “other bees” as separate bee groups were used. These models were constructed both with and without the estimated honey-bee activity density of 2010.
Predicting Crop Yield—Using a general linear model, we constructed a predictive relationship of yield (kg berries/ha) by assessing the potential predictors of late fruit set, pest management, and field size (ha) as fixed effects and year and its interaction with fixed effects as random effects. We did not use any of the bee activity-density measures to model yield as we previously showed that bee activity densities were significant predictors of late fruit set. Fields were categorized into two types of pest management. Management category 1 consisted of those fields not treated with pesticides during the spring (May–June) of the study year (n = 16) and management category 2 included those that were treated with pesticides during the five months (May–September) of the study year (n = 24). Both pest management category fields were included in all study years.
Predicting Value of Bees—To determine the effect of field size on honey-bee and bumble-bee monetary value, we used a Wilcoxon nonparametric test because of heterogeneity and non-normality of the data.

3. Results

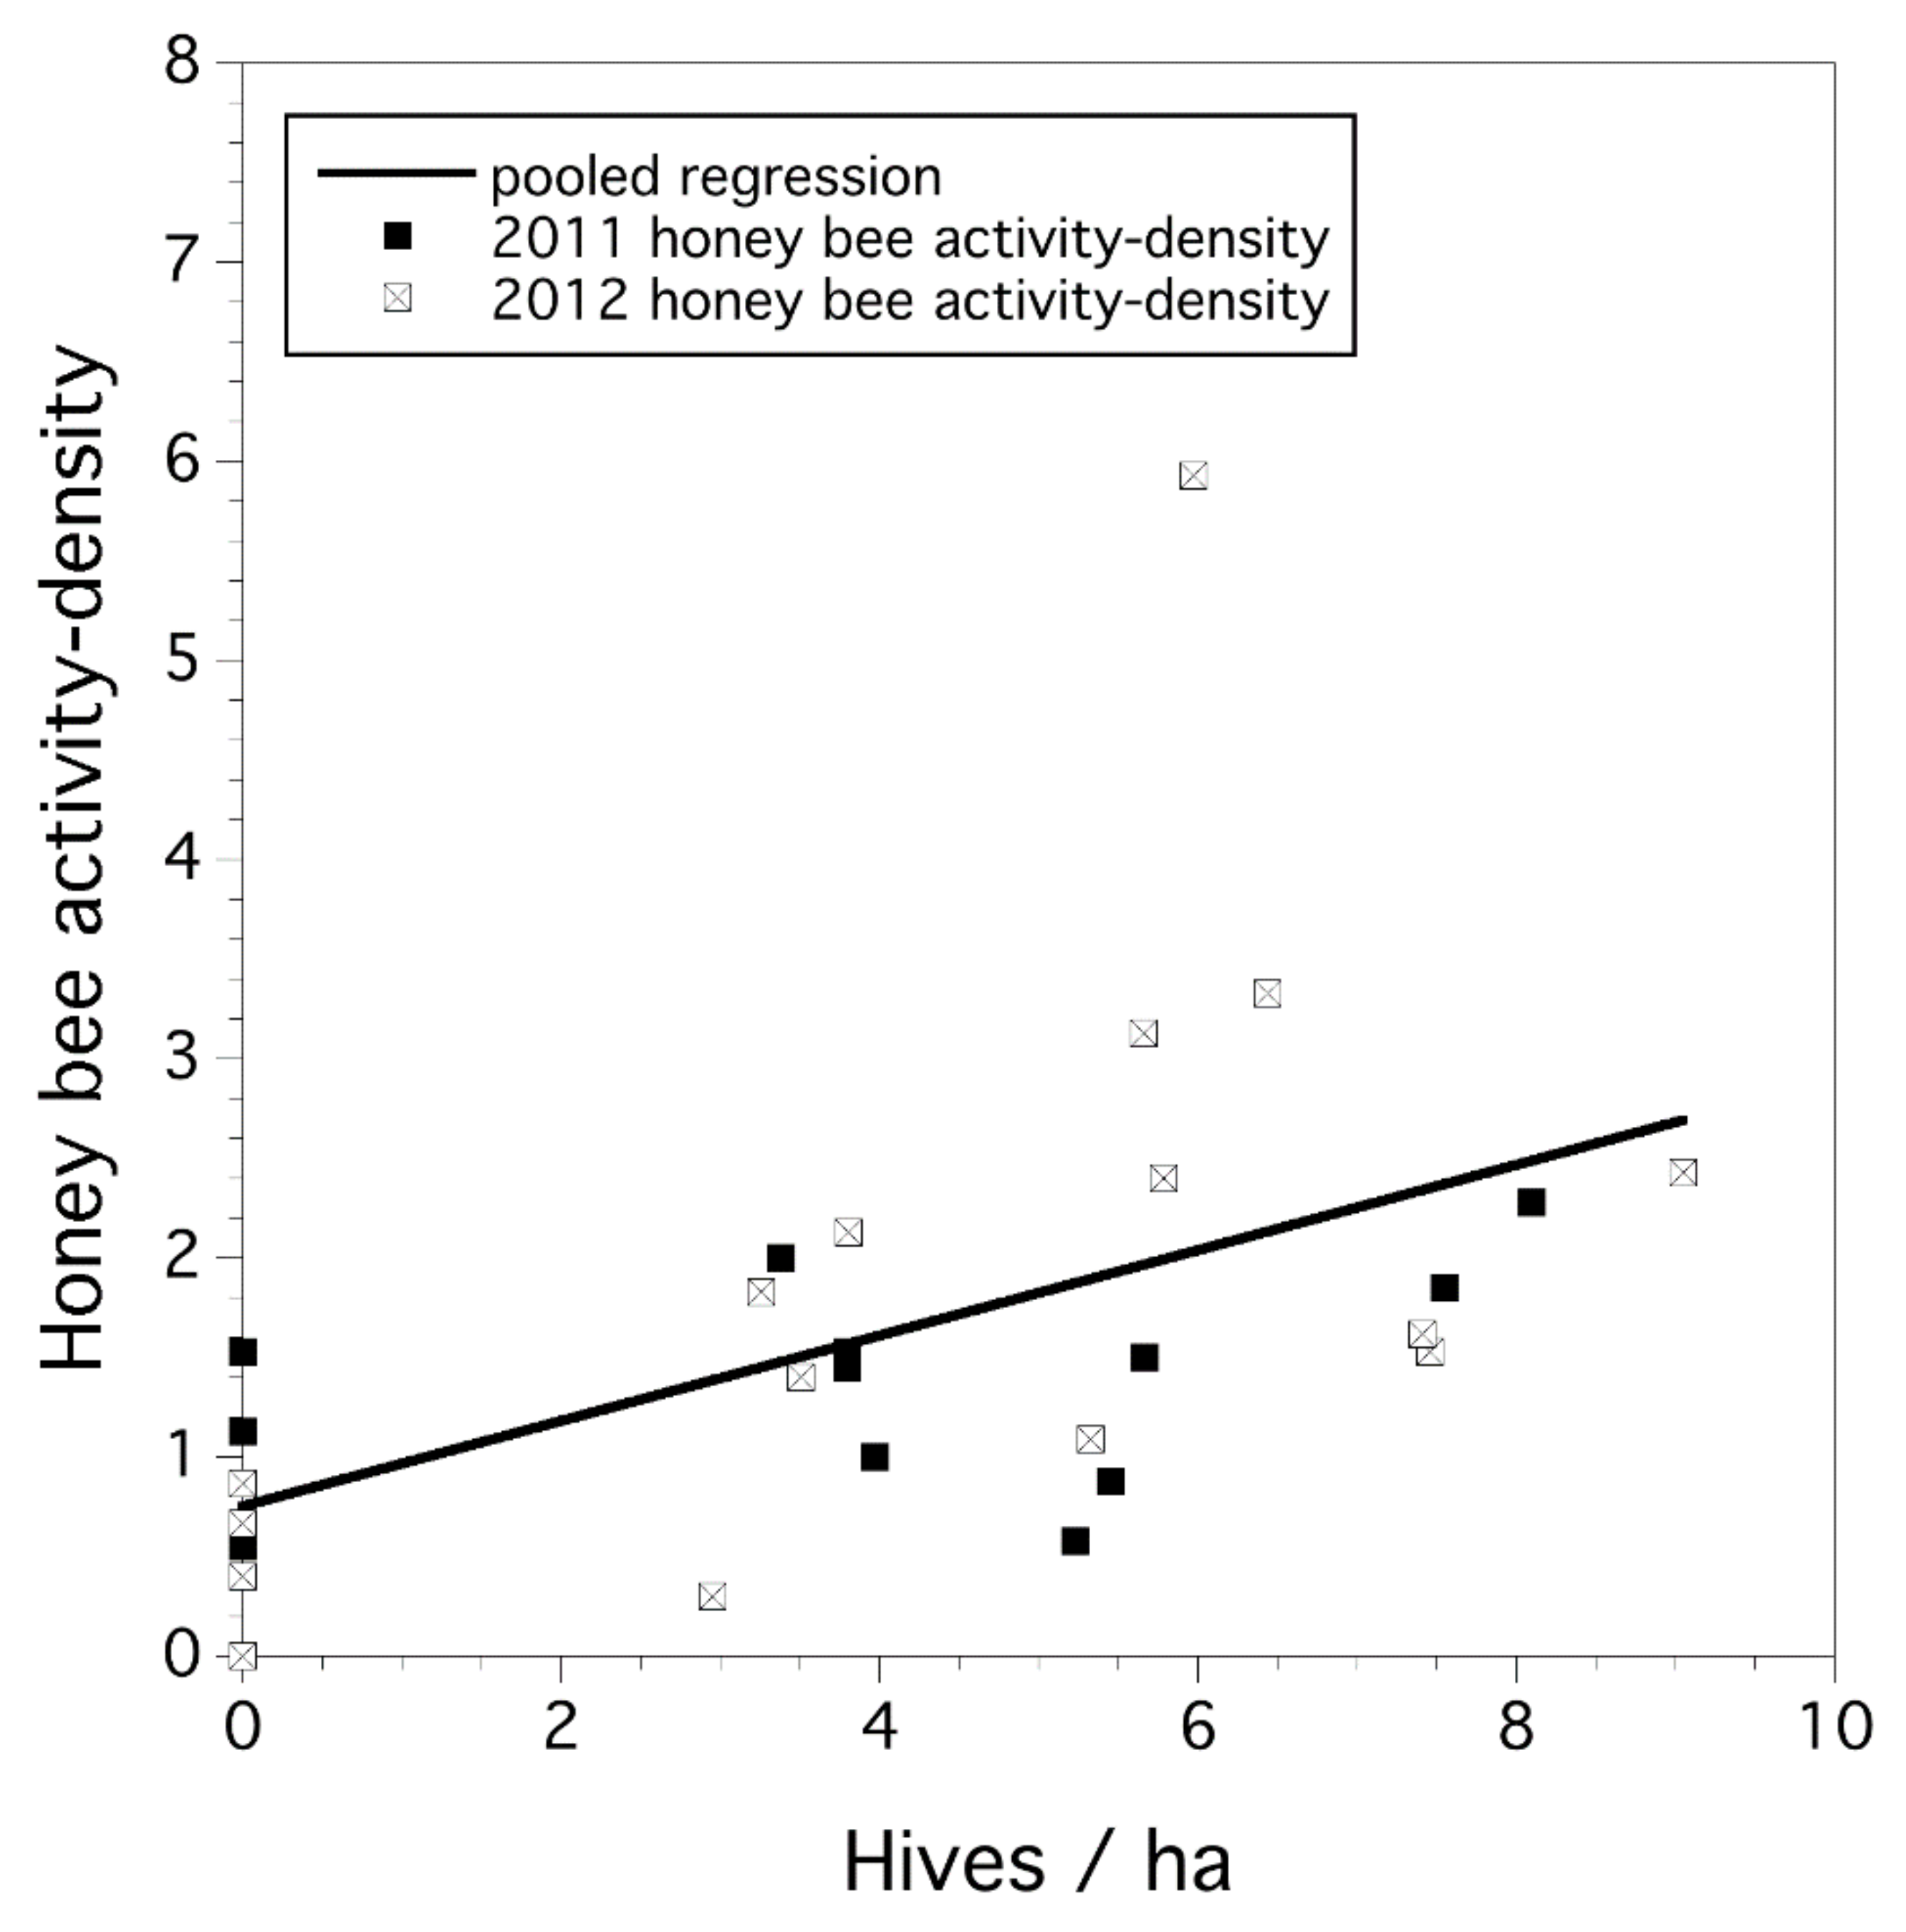
3.1. Honey-Bee Activity Density and Hive Stocking Rate

The different honey-bee counting protocols of 2011 and 2012 did not reveal significantly different mean values of bee activity density among years (t(20.1) = 1.150, p = 0.264). When considering 2011 and 2012 fields for these two years, we found a positive relationship between numbers of honey bee hives in fields and honey-bee activity density with 27% of the variation in honey bee foraging explained by the model (F(1,26) = 9.532, p = 0.005, r2 = 0.27). The relationship shown in Figure 1 is
HB/min = 0.750 + 0.214 × HB hives/ha.
Similarly, we found that, in 2011 and 2012, the proportion of foraging honey bees and the number of honey-bee hives in the field exhibited a positive relationship with 26% of the variation in proportion of honey bees explained by the model (F(1,26) = 8.942, p = 0.006, r2 = 0.26). This linear relationship is
Proportion HB = 0.519 + 0.036 × HB hives/ha.

3.2. Study-Year Variation in Bee Activity Density

Figure 2 illustrates the distribution of the activity density for all three bee groups for all 40 fields for the three years of the study. Mean bumble bee (BB) activity density differed significantly between years (F(2,37) = 25.248, p < 0.001). Activity density of BB declined in 2012, with a mean of 0.05 BB sightings per minute, compared to a mean of 0.27 bees/minute in both 2010 and 2011. Likewise, OB (other bees) activity density differed between years, but with an opposite trend; OB activity density significantly increased in 2012 compared to 2010 and 2011 (F(2,37) = 11.66, p < 0.001). Honey-bee (HB) activity density did not vary between the years 2011 and 2012, the only years with HB activity-density measures recorded. Across all three years, BB activity density was weakly negatively correlated to OB activity density (Pearson’s r = −0.295, p = 0.066), but independent of HB activity. Activity density of OB was weakly positively correlated with HB activity density at the α = 0.10 significance level (Pearson’s r = 0.322, p = 0.095). There were no indications of a bee activity density by year interaction (p > 0.05).

3.3. Species Richness and Bee Activity Density

Total bee species richness averaged 29.3 ± 1.2/field (range = 17–50 species). Total bee species richness was positively correlated with OB activity density (r = 0.572, p < 0.001) and HB activity density (r = 0.398, p < 0.036). Total bee species richness was negatively correlated with BB activity density (r = −0.474, p < 0.002).

3.4. Field Size

Seventeen of the 18 large fields were stocked with honey bees, and only one field relied upon background (“other bees” + bumble bees) wild pollinators. The pollination of smaller fields was evenly distributed: six fields with bumble bees, six fields relying on background bees, and seven fields with honey bees. When considering field size as a continuous measure and not as a categorical variable, then bumble-bee stocked fields and background-bee fields were of similar sizes (mean size = 2.08 and 2.34 ha, respectively), which differed significantly from the honey-bee stocked fields (mean size = 6.68 ha) (F(2,34) = 8.041, p = 0.001). Yield (kg berries/ha) was different for each size category. Smaller fields (n = 18) had lower yields than larger fields (F(1,32) = 4.669, p = 0.038, r2 = 0.13). Mean yield for small fields was 1914.3 kg/ha, while, for larger fields, it was 3201.0 kg/ha. Therefore, larger fields have a greater likelihood of honey-bee use for pollination and higher yield.
Total wild-bee (WB) activity-density measures (BB + OB) did not vary with field size class, and neither did BB or OB considered separately (WB: F(1,38) = 0.155, p = 0.696). Activity density of HB, however, was significantly lower in the smaller fields (F(1,26) = 10.871, p = 0.003, r2 = 0.29), when only considering the 28 fields of 2011 and 2012. This relationship did not change when the estimated honey-bee activity measures of 2010 were included (F(1,37) = 15.499, p < 0.001, r2 = 0.30).

3.5. Fruit Set

Fruit set (all measures) did not vary according to field size (early fruit set: F(1,38) = 0.612, p = 0.439; late fruit set: F(1,38) = 0.416, p = 0.523; CV late fruit set: F(1,38) = 0.551, p = 0.463). Early fruit set and the CV of late fruit set were determined by year (early fruit set: F(2,37) = 1.32, p = 0.002, r2 = 0.28; CV fruit set: F(2,37) = 3.28, p = 0.049, r2 = 0.15). In 2012, early fruit set was lower than the two previous years, while the CV of late fruit set was higher in this same year. Late fruit set followed the same annual pattern as did early fruit set (lowest value in 2012), but the year effect was not statistically supported at the α = 0.05 level (F(2,37) = 2.356, p = 0.109, r2 = 0.11). Late fruit set for fields relying solely on wild bees for pollination was 43.8%. Late fruit set for all fields (n = 40) was 48.3%. Early fruit set was highly correlated to late fruit set (r = 0.669, p < 0.001). Therefore, we only looked at late fruit set and fruit set CV as measures of pollination to interpret the effectiveness of the three bee groups that we observed (HB, BB, and OB).
The summary of analyses in Table 1 indicates that the random effect of year in the four predictive models for the two fruit set measures was significant, but none of the year × bee activity-density measures or bee richness were significant. The predictive model of late fruit set with HB, WB, and bee richness suggests that HB along with WB explained 33.6% of the variance in late fruit set. In this model, bee richness was marginally significant (α = 0.10), but with a negative coefficient. However, the model with all three bee groups (HB, BB, OB) and bee species richness was the best predictor of late fruit set explaining 39.8% of the total variance in late fruit set. In this model, only HB and BB were significant, while bee species richness was again only marginally significant with a negative coefficient (α = 0.10).
The bee group OB was not a good predictor of late fruit set except when combined with BB as WB. The poor performance of OB as a predictor may be due to its correlation with bee species richness and BB; thus, much of the variance explained by OB is already accounted for by BB. A similar pattern was observed with CV of fruit set. The mode with HB, BB, OB, and bee species richness was the best predictive model, explaining 27.8% of the variance in the CV of fruit set. In this model, only HB and BB were significant and both had negative coefficients, suggesting that the presence of these two bee taxa reduced the spatial variation in fruit set across a field, providing a more uniform potential yield.

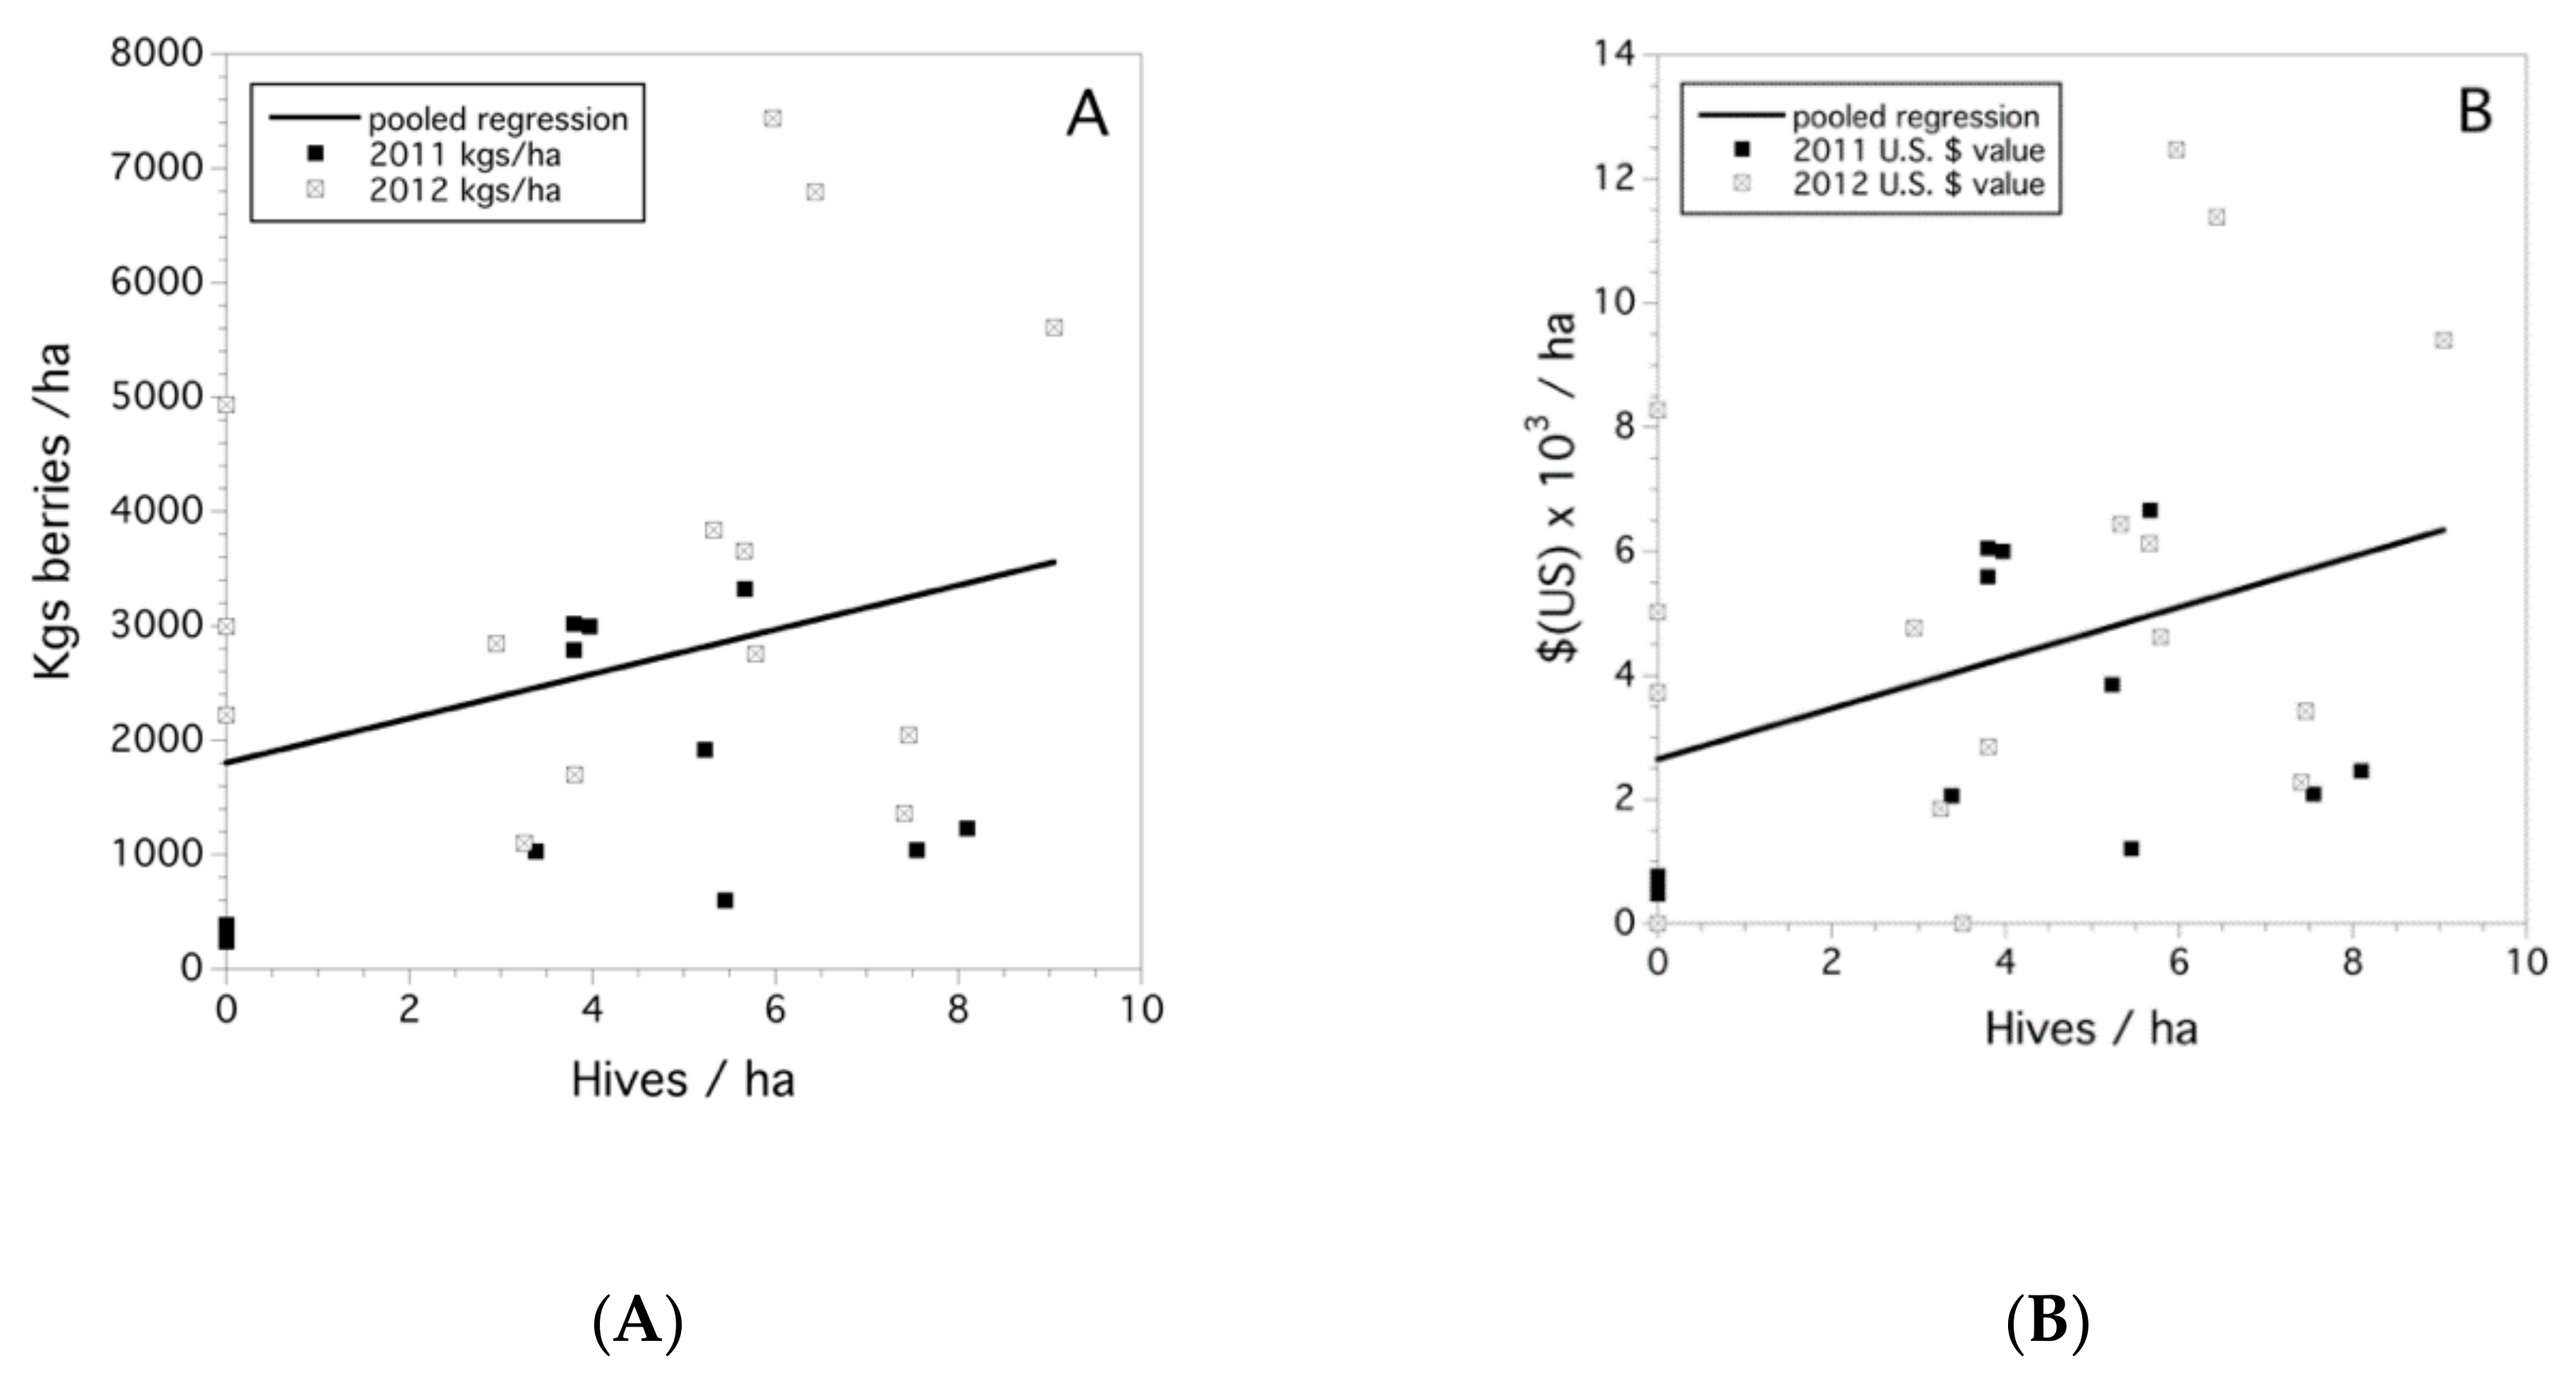
3.6. Yield and Crop Value

The two measures of crop success, yield (kg berries/ha) and the crop value per hectare, were strongly correlated (r = 0.826, p < 0.001) as expected. Additionally, both measures were affected by year (crop value: F(2,31) = 4.32, p = 0.022, r2 = 0.22; kg/ha: F(2,31) = 4.725, p = 0.016, r2 = 0.23). The year 2012 was characterized by the greatest yield (3522 kg/ha), followed by 2010 (2189 kg/ha) and 2011 (1571 kg/ha). Similarly, 2012 experienced the greatest value per hectare even though, in that year, the price of berries was not the highest of the three years [40].
Table 2 summarizes the predictive model of yield (kg berries/ha). These results indicate that late fruit set and field size were significant predictors of yield. Field pest management was not a significant predictor. The variance in yield explained by pest management may have been masked by the annual variation in yield and would have been accounted for by the random year effect. No indication of an interaction between late fruit set, field size, or management and year was detected (p > 0.05). The CV of fruit set was not included as a predictor because it was negatively correlated with late fruit set (r = −0.911, p < 0.001). Although, if the CV of fruit set was used as a predictor variable, we found it to be a significant predictor of yield (F(1,12410) = 8.577, p = 0.003) and, thus, crop value. The negative coefficient (−35.49 ± 12.11) indicates that, as the clonal variation in fruit set decreases, the total field yield increases. Because crop value is an annual price multiplier of yield, we did not attempt to develop a predictive model for crop value.

3.7. Economic Value of Wild Bees and Honey Bees

Following the modified Losey and Vaughan [35] model defined in Equation (2), the value of a bee group is related to the proportion in which that group is found in the field. As shown above, the activity density of all bees (commercial and wild) predicts fruit set and fruit set predicts yield and, thus, crop value. We determined that the mean proportion of total wild bees (WB) found in all 40 study fields was 0.36. With application of the model, this suggests that WB, as a large group encompassing multiple taxa, are on average related to up to 36% of the value of the wild-blueberry crop.
Table 3 reports the mean value of pollination and the percentage of the value of the crop attributable to pollination for the three target bee groups as determined by application of the Losey and Vaughan model [35]. The values given reflect two conditions: when the bee groups are considered equally effective pollinators and when the pollinating power is adjusted by pollination equivalencies as determined by Javorek et al. [7]. The OB group includes the genus Andrena whose abundance was adjusted by a factor of 3.6 (see Section 2.6).

3.8. Pollination without Rental Honeybees

Using the data from 34 of our study fields, we built a model that describes the relationship between yield (kg/berries/ha) and HB hives/ha (F(1,32) = 4.310, p = 0.046, r2 = 0.12).
kg/ha = 1754.85 + 216.39 × HB hives/ha.
Another model illustrates the relationship between the value of the crop and the density of HB stocking (F(1,32) = 6.102, P = 0.019, r2 = 0.16).
USD crop value/ha = 2759.12 + 417.80 × HB hives/ha.
Both of these models (see Figure 3A,B) can be used to estimate the effect of the absence of rental HB in wild-blueberry production, given that all other aspects of production and market forces remain the same. However, the intercepts can be seen as the strength of background pollination which is mostly due to wild bees (WB) or the fruit set in the absence of stocked HB. As the number of hives/acre drops to zero, the expected yield is 1754.9 kg berries/ha (95% confidence interval (CI) = 966.1) and the expected value attains USD 2759/ha (95% CI = USD 1567.6). This represents nearly a 30% decrease in comparison to the mean yield.
For all three years, one isolated field in this study had no honey-bee activity. Since this field was not harvested by the manager, we estimated yield by hand-raking berries. The estimated yield was 2222 kg/ha with an associated value of USD 3742/ha.

4. Discussion

4.1. Bee Abundance

In this study, we provide an analysis of the wild and managed bee community that influences fruit set, yield, and, ultimately, economic value of the wild-blueberry crop in Maine. We measured bumble-bee (BB) and other wild-bee (OB) activity in all 40 study fields and found that, on average, the WB abundance (OB + BB) made up 36% of the total bee abundance in fields, although, as seen in Figure 2, the abundance is not consistent across fields.
In our study, BB activity density dropped dramatically in 2012 to a mean of 0.05 bees/min from a mean of 0.27 bees/min recorded for the two previous years. We suspect this drop is due to unusually warm weather in March 2012 that triggered abnormally early queen foraging activity. By the time wild blueberry came into bloom, the temperatures were more normal, but bumble-bee queens were not commonly found in fields. Our study revealed six fields that registered 0.0 BB/min, all of which occurred in 2012. While the sample size is too small for significance tests of a reliable power, late fruit set for these six fields was among the lowest recorded in this study.
The OB activity density significantly increased during 2012, although the overall activity of OB was only weakly negatively associated with BB activity. We do not know why the OB abundance increased in 2012, but this may have been an artefact of sampling methodology. The activity-density measure derives from active bee-hunting with visual scans on flowers. It is possible that the lower BB abundance changed the visual environment such that the OB were easier to detect. However, taken together, the activity-density measure indicates that wild-blueberry fields have a persistent wild-bee (WB) community that varies over time and space.

4.2. Bee Abundance and Crop Fruit Set, Yield, and Crop Value

This persistent abundance of wild bees positively relates to late fruit set, which is a key predictor of the harvestable berry measure of yield (Table 2). In our strongest model, 39.8% of the variance in late fruit set was due to HB, BB, and OB activity, as well as species richness (Table 1). Honey-bee and BB abundance were strongly significantly associated with increased fruit set and negatively associated with the CV of fruit set, which suggests that these bee groups reduce spatial variation in fruit set across the field. Other wild-bee abundance (OB) and species richness were not significantly related to fruit set. One might expect OB abundance to have a positive relationship with fruit set, as many of the bees we collected were known pollinators of wild blueberry and were often carrying pure loads of ericaceous pollen [5]. The lack of a relationship could be due to the fact that this group includes all wild bees, including many (e.g., Sphecodes) suspected as being weak pollinators at best [5]. Furthermore, while most of the bees we caught were actively foraging on wild-blueberry flowers, representatives of other flower taxa located within the fields were examined for bees and those bees were a component of the OB activity-density measure.
Honey-bee and BB relationships with fruit set were shown in other studies. In a two-year study, Eaton and Murray [41] documented a significant relationship between both HB and BB activity densities and fruit set, with a strong relationship for HB during both years of the study and a relationship for BB during one year. Unlike our study, they also found a strong correlation between OB activity densities and yield in one year of the study, indicating that non-Bombus wild bees can significantly contribute to the value of a crop, but not consistently. Assessing fruit set during a wild-blueberry study in fields stocked either with commercial BB or with HB, Drummond [17] found a positive relationship between BB foraging density and fruit set. Eaton and Nams [42] showed yield and fruit set to increase with greater activity densities of honey bees and fruit-set measures to improve with increasing densities of non-Apis wild bees. However, unlike our study, their research indicated an interaction between HB and OB, such that evidence of competition for floral resources emerged at high honey-bee activity densities. Considering wild bees in general, in a long-term study, Asare et al. [18] assessed HB and WB activity densities on 162 wild-blueberry fields from 1993–2015 and found that both HB and WB activity densities were related to fruit set. They found that fruit set was impacted on a per bee basis 1.6 times more by wild bees than honey bees. Similar to Eaton and Nams [42], a negative interaction was observed between HB and WB activity densities on fruit set (but at p = 0.089), also indicating a potential competition effect for floral resources between the two bee groups.
One field from our study illustrates the power of wild pollinators as this field was not stocked with any commercial bees and was isolated from human activity such that we did not record any HB at any time in the field. Final fruit set for this field was 42%, which we can assume was due primarily to WB pollination, although other pollinating insect taxa cannot be discounted [38]. Pollination research at the University of Maine in the 1950s suggests a similar level of fruit set due to WB visits [43]. Researchers at this time were interested in determining the efficacy of HB as pollinators and compared fruit set in cages with trapped HB to the fruit set in adjacent open areas without HB but with WB visitors. At two sites in 1959, the research documented an average of 30% fruit set outside the HB cages. Desjardins and De Oliveira [44] documented a fruit set of 42% for wild blueberry due to native, “background” pollinators. Drummond [17] found a fruit set of 28% for wild-blueberry fields in Maine without commercial pollinators, and Stubbs and Drummond [14] found the fruit set due to wild bees in 10 wild-blueberry fields in the absence of commercial pollinators to be 55.5% ± 6.5% (standard error, SE). Asare et al. [18] found that fields with only wild bees had an average fruit set of 33.7% and, for every unit (bees/m2/min) increase of wild bee density, fruit set increased by 11%. Similarly, we recorded the mean final fruit set for fields relying on background pollination (some of which may be provided by honey bees placed on nearby farms) to be 43.8%. Taken together, our data along with previous research indicate that wild-bee pollination achieves 30–55% fruit set in wild blueberry without the addition of commercial pollinators. It must be acknowledged, however, that other factors including environmental conditions [40,45], genotype [4], bloom phenology [46], and possibly nectar production [47] also affect fruit set. Asare et al. [18] presented a conceptual model for the multitude of factors that affect fruit set and yield including stem density, flowers/stem, bee species community diversity, bee species efficiency, bee density, weather conditions, clone genotype, frost, fertility, pruning, weeds, disease, and insect pests.
Yield and crop value are also related to factors beyond pollination. In wild-blueberry production, inputs from farmers include, among others, resources needed for pruning, fertilizing, pest monitoring, pest control, and harvesting, in addition to pollination purchases. For a farmer seeking an average yield, complete costs (fixed and variable) are estimated at USD 3370/ha [48], and those inputs are not trivial compared to total crop value, which in our study ranged from about USD 1000 to USD 10,000/ ha. However, given that no berries will result without pollinators [9], the value of these non-pollination inputs can be seen as a “risk avoidance” investment to enhance the likelihood of developing fruit becoming an economically viable fruit.
Therefore, our study suggests that farmers might expect increased fruit set and yield and, thus, crop value, with increasing abundance of wild bees generally and bumble bees specifically. Applying the Losey and Vaughan [35] model to our data suggests that Maine farmers can expect up to 36% of crop value to be due to WB activity density if all pollinators are considered equivalent in terms of power of pollination. However, research indicates that many species of WB and especially BB are far more efficient pollinators (on a per bee basis) than HB [7,8,17,31,44]. Therefore, the value of wild pollinators, according to our modified Losey and Vaughan [35] model, suggests WB value may approach 57% of the crop even when rental HBs are used in the field (Table 3).

4.3. Bee Abundance and Field Size

Neither BB nor WB activity density varied by field size. Given that none of our study fields exceeded 17 hectares, we cannot speak directly on the role of WB in fields larger than those we examined. Our study fields were small compared to the “blueberry barrens” of Downeast Maine where many fields are larger than 200 ha. However, more than 75% of farmers harvest less than 20 ha per year, suggesting that our data represent field sizes typical of the blueberry agroecosystem in Maine [10]. Given the size of Maine BB queens and workers measured from our collections [5], we expect Bombus ternarius Say queens (the most common species) to forage up to 5.8 km from the nest site and B. ternarius workers to travel up to 0.9 km [49,50]. We would, therefore, expect the proportions to diminish only with field sizes approaching double that of our study’s largest field size. Considering that foraging bumble-bee queens (which are predominant during blueberry bloom) are also engaged in nest site selection, we cannot say that queen foraging is constrained by distance to the nest.
Honey-bee activity density decreased significantly with decreasing field size, due to fewer hives/hectare for the smaller fields. Why do farmers of fields the size of our large fields increasingly rely upon HB when we recorded no differences in WB or BB activity density within larger and smaller fields, and given the superior pollinating abilities of WB or BB? We first suggest that different survey methods could reveal a greater WB abundance along the field edges as reported in other studies [51,52] even in fields limited to those of the size we sampled [53,54]. If this were the case, increased reliance upon imported HB in larger fields approaching 20 ha would be justified. Additionally, HB may ensure pollination at field interior regions, especially if the hives are not placed along the field edge. Aras et al. [55] showed that HBs initially forage close to where the hives are placed in wild-blueberry fields, but quickly expand their foraging distance until they move across even the largest of fields. In wild-blueberry fields in Canada, Cutler et al. [52] found that most wild bees decreased in abundance as the distance from the field edge approached 200 m; however, larger-bodied bees were found further from the field edges than the smaller bees. Therefore, BB [17,44] and WB such as Andrena spp. that nest within blueberry fields [56] may be responsible for much of the pollination in a field interior. Validation of this hypothesis that HBs play a role in increasing pollination toward field interiors would suggest that farmers wishing to decrease reliance on imported bees could use wild-bee habitat plantings [57] and adjust crop rotation cycles so that larger fields function effectively as smaller fields [1].

4.4. Conclusions

Our estimates of the percentage of crop value attributable to a given bee group is analogous to a measure of “vulnerability” [58] and indicates vulnerability for both the decline of WB and the lack of HB. It is not unrealistic to consider what a pollination regime would look like given a lack of HB or a decline in the abundance of WB [23,59,60]. Our results indicate that, all else being equal, a farmer could expect a little over 1755 kg/ha without HB (Figure 3A), although this value can also be considered as the strength of WB pollination. If WB and HB pollination services are complementary and not interchangeable [33], then declines in wild pollinators may result in farmers losing 1755 kg/ha of berries that cannot be recovered with increasing HB colonies. If the pollination services of wild bees can be compensated for by honey bees, then the pollination costs to farmers will increase with a loss of WB populations. For each additional HB hive/ha, a farmer can expect an additional 1971.39 kg of berries/ha (Equation (5)), which, at a current value of USD 100–150/hive (F.A. Drummond, pers. com.), will increase costs for larger fields substantially.
We applied our analysis to wild blueberry in Maine. Our goal was to illustrate how WB pollinators, especially BB, are related to increased wild-blueberry yield through increasing fruit set. Our hope is that a farmer who understands the economic value of WB may be motivated to alter management regimes in order to conserve this natural resource, especially if the bee’s presence in the field provides a sufficient economic value. Following this reasoning, it could be argued that low economic value of a wild resource or changing economic values associated with land use may motivate a farmer to not conserve a resource [61,62]. However, given the dependency of most fruits and vegetables on pollination [61,63], we feel that sufficient evidence exists to conclude that significant levels of pollination are performed by WB [33], which would, therefore, provide a financial boon for farmers in the form of a highly valuable ecosystem service. This finding also provides a strong justification for bee and bee-habitat conservation by all wild-blueberry farmers.

Author Contributions

Conceptualization, S.L.B.; methodology, S.L.B.; formal analysis, S.L.B and F.A.D.; investigation, S.L.B.; writing—original draft preparation, S.L.B and F.A.D.; writing—review and editing, S.L.B. and F.A.D.; funding acquisition, S.L.B. and F.A.D. All authors have read and agreed to the published version of the manuscript.

Funding

Funding was provided by a USDA AFRI Specialty Crop Grant to F. Drummond (no. 12-007005-B-00) and a USDA NIFA Predoctoral Fellowship to S. Bushmann (no. 2011-67011-30657).

Acknowledgments

We would first and foremost thank cooperating Maine wild-blueberry producers for allowing Sara Bushmann to sample their fields for bee abundance, fruit set, and yields. We would also like to thank anonymous reviewers for their thorough review of this manuscript and important contributions. We thank S. Wheatley, K. Zucker, M. McCollough, C. Cunningham, W. Woods, and M. Mathiasson for help in the field. This research was made possible through support from the USDA National Institute of Food and Agriculture, Hatch project number #ME0-21505, the Maine Agricultural and Forest Experiment Station. In addition, support was also received from a USDA/NIFA Specialty Crop research Initiative Grant 2011-01389 and the Wild-Blueberry Commission of Maine. This is Maine Agricultural and Forestry Experiment Station Journal number 3758.

Conflicts of Interest

The authors declare no conflict of interest. The funders had no role in the design of the study; in the collection, analyses, or interpretation of data; in the writing of the manuscript, or in the decision to publish the results.

Appendix A. Literature Review of Wild-Blueberry Reproductive Biology and Pollination

Wild blueberry is a mixture of ericaceous perennial shrub species best categorized as early colonizers or pioneer plants whose reproduction follows environmental disturbance such as fire, high wind, or ice storm events. Wild-blueberry communities vary in the number of Vaccinium berry species present. Five species and hybrids can be found in Maine including Vaccinium angustifolium Aiton, V. myrtilloides Michx., V. angustifolium × V. corymbosum hybrids, V. boreale I.V. Hall and Alders, and V. pallidum Aiton [28]. However, the most abundant species are V. angustifolium, the sweet lowbush blueberry, and V. myrtilloides, the velvetleaf or sour top blueberry [28], and many commercial fields comprise just these two species.
Wild blueberry is a forest understory plant community that is shade-intolerant, growing vegetatively under light-deprived conditions [28,64]. Wild blueberry is found from North Carolina to Quebec and to the west in Michigan and Indiana [28,65]. The species complex of wild blueberry occurs mainly in acidic granitic soils in Maine. Because V. angustifolium is the most studied of all the “lowbush” or “wild-blueberry” species, the remainder of this review focuses upon this one species that occurs in wild-blueberry fields. The species is highly polymorphic at the morphological, physiological, and molecular levels [4,64,66]. The woody fruit-bearing shrub is capable of significant regrowth after managed burning or mowing [67]. With the cutting and clearing of forest, blueberry plants grow as visually and genetically distinct clones (individual plants) [4], forming a blanket of low-growing clumps that fill the open landscape through vegetative growth via underground rhizomes [1,45,68]. These clones undergo selection in cleared areas and have less genetic variation than clones in adjacent forest understory [65]. What makes wild blueberry unique amongst other food crops grown commercially is that as it is a native North American species complex, it has not been improved through breeding, and it is not planted; thus, the spatial mixture of clones with respect to relatedness varies between fields [69]. Fields are derived from spread of the naturally occurring forest understory of ericaceous plants once the forest is removed, but they are facilitated by use of burning and herbicides to remove competitive plant species [1,4].
Wild-blueberry reproductive biology was discussed by Drummond [70]. Phenology of bloom is based upon degree-days and models were developed by White et al. [71] and Drummond [70]. In Maine, bloom begins at 100 degree-days (air temperature, base 4.4 °C) after 1 April and ends at approximately 500 degree-days for a period of three to four weeks. Individual flower viability is 8–10 days with maximum stigma receptivity at 1–3 or 4 days, depending upon the year [70]. In this hermaphroditic species, flowers have an average of 63.4 ± 6.9 (SD) ovules and 2150.7 ± 965.0 pollen tetrads [72]. There is no correlation between the number of ovules and the number of pollen tetrads in a flower and, on the basis of frequency distributions of ovule and pollen counts, it appears that a shift toward female gender and, thus, gender dimorphism is occurring in wild blueberry [68,72]. Clones exhibit self-incompatibility and require outcrossing [31,73,74,75], although Bell et al. [75] found that 20% of clones have high levels of self-compatibility and that outcrossing was non-reciprocal. This means that a given amount of pollen from clone “A” placed on clone “B” might result in 30% fruit set, but the transfer of pollen from “B” to “A” might result in 80% fruit set. They also found that self-compatible clones were “universal mothers”, accepting pollen from any sire with subsequent high levels of fruit set. Drummond [70] found that placement of pollen upon receptive stigmas determined that fruit set occurs with as little as a single pollen tetrad, while 12 tetrads result in a 50% likelihood of fruit set. He also found that the more ovules fertilized with compatible pollen, the more viable seeds/berry resulted, and that more seeds/berry resulted in berries of greater mass (g). In addition, percentage fruit set was directly related to the average viable seeds/berry in the field.
Fruit set is dependent on insect pollination [9,70,74]. Bees, both commercially available and wild, are the most prominent insect pollinators of wild blueberry [5,18], but nocturnal insects may also provide some level of pollination services [38]. Bushmann and Drummond [5] documented more than 120 wild-bee species associated with 40 wild-blueberry fields in Maine. These communities tend to be dominated in species richness by andrenids and halictids, although Bombus spp. queens were found to be a common feature across these landscapes. Drummond et al. [76] found that bee communities fluctuate greatly in abundance (>8×) and species composition from year to year in blueberry fields. They also found that the fluctuations in abundance of andrenids, megachilids, and halictids were due to both stochastic events such as weather conditions and density-dependent factors such as disease and parasites.
Several recent studies identified factors that influence wild-bee communities of blueberry fields. Landscape analyses showed that habitats surrounding wild-blueberry fields are a significant determinant of bee community abundance within fields [50] and that blueberry fields imbedded in coniferous and deciduous forest tend to be associated with low bee community diversity [5,77]. Although quite variable among two growing regions in Maine, Du Clos et al. [77] found that landcover heterogeneity increased the diversity of bees outside of wild-blueberry fields and that, in general, habitats that supported the greatest abundance and diversity of floral resources supported the greatest diversity and abundance of wild native bees.
At the within-field scale, Drummond et al. [78] found that wild-blueberry fields with greater diversity and abundance of flowering plants along field edges had higher wild-bee abundance and diversity. Similarly, Moisan-deSerres et al. [79] and Cutler et al. [52] found highest bee abundance associated with forested edges of fields. In contrast, in New Brunswick, Canada wild-blueberry fields, McKechnie et al. [80] found a greater abundance of pollen-carrying wild bees along deforested edges of fields compared to forested edges. The deforested edges, while not different from forested edges in terms of non-crop plant diversity, did show increased light levels and decreased overhanging canopy levels, which suggests that these environmental conditions influence bee foraging patterns. Interestingly, this study [80] did not reveal significant differences in the diversity of wild bees along the forested and non-forested field edges when considering only pollen-carrying bee species. Any diversity differences between the two edge types were driven by the increased presence of kleptoparasitic bees along forested fields edges.
The floral bee associations within wild-blueberry fields in Maine were documented by Bushmann and Drummond [5] and Drummond et al. [78]. Further exploration of plant resources includes a four-year study conducted by Dibble et al. [81,82] that tested attraction of over 85 plant taxa to bees. They found that, out of 61 species of bees that visited their plots, honey bees and bumble bees overlapped in many of their preferred plant taxa and that, collectively, wild bees had higher visitation rates on native plant taxa while honey bees visited both native and introduced species. They uncovered plant morphological traits associated with bee visitation and provided lists of attractive plant taxa for the common bee taxa in Maine wild-blueberry fields. Using floral plantings or pollinator reservoirs to enhance the abundance and richness of wild native bee communities was studied in wild blueberry [20]. The highly acidic soils in wild-blueberry fields can be a challenge to establishing wild-flower communities. Venturini et al. [83,84] developed methods for planting and establishing annual and perennial herbaceous plant species specifically selected for Maine wild-blueberry landscapes. Tolerance to soil conditions, winter hardiness, timing of bloom (not to coincide with blueberry bloom), and non-weediness were characteristics used to select species for the seed mixture [57]. When these plantings were established at the edge of commercial wild-blueberry fields, increases in bee visitation to blueberry bloom and increases in fruit set were observed four years after planting [57]. The annualized costs of establishing pollinator reservoirs in Maine wild-blueberry fields were attained by the fourth year after planting on the basis of the measured increase in pollination services.
Bumble bees are noted for their efficacy as pollinators [8,17,44], with Bombus queens shown to deliver on a stigma up to 4–8 times the pollen of a honey bee, Apis mellifera (L.), per visit [7,8]. Pollen loads of bumble bees foraging in wild-blueberry fields carry over 60% Vaccinium pollen [17,85], which suggests high fidelity to wild blueberry, a trait necessary for a species to function as an agent of outcrossing [15]. On the basis of examination of pollen in femoral loads and carried along the bee body hairs, a few species within the genus Andrena show levels of fidelity to Vaccinium that suggest oligolecty, at least during blueberry bloom [5,85]. Other genera commonly found in blueberry fields, notably, Halictus, Megachile, and Osmia, show fidelity to blueberry flowers and can also be highly efficient pollinators of the crop [5,7,14,17,53,86]. In addition, the presence of wild bees can enhance the efficiency of the honey bee as a blueberry pollinator. Drummond [8] found that, when a honey bee visited a flower following a B. impatiens queen, the honey bee’s pollen deposition on the stigma of the flower it next visited was increased by up to two times that deposited without following a bumble-bee queen.
Efficiency of bee pollination in blueberry was found to be a function not only of bee species efficiency of pollen deposition on stigmas, the overall bee density within a field, and fidelity, as previously stated, but also the rate at which individual bees manipulate flowers during visitation [8], flower size [8], bee foraging pattern [8,31], and spatial clone genetic structure and its possible interaction with bee foraging patterns. Rowland et al. [87] tracked pollen-mediated gene flow by investigating maternity due to pollination. They found that 0% of wild-blueberry progeny were due to self-pollination (autogamy) and that only 3–9% of pollen came from sire clones that were adjacent to the mother clones. Most pollen came from non-neighboring outcrossing clones. This suggests that bees routinely move pollen from distances greater (jump dispersal) than the adjacent neighbors of the clones receiving the pollen. Bajcz et al. [88], through simulation modeling, found that fruit set declined as average genetic load of a clone’s neighbors increased and as self-pollination rate increased, with the latter effect being 20% stronger than the former. Clone size (area) also appears to have an impact on yield as a function of pollinator foraging interacting with the self-incompatibility of 80% of clones occurring in fields [75]. Simulation modeling by Qu and Drummond [31] provided evidence that fruit set and yield declined as mean clone size in a field increased. This was due to the reduction in outcrossed pollen vectored by a bee as a function of time spent in visiting flowers within single clone.
Weather affects pollination and subsequent yields. Rainy and/or cold weather reduces bee activity during bloom [8] and increases flower death both directly and indirectly by enhancing disease incidence [89]. Since 1990, climate change has resulted in an increased prevalence of wet spring weather in Maine wild-blueberry-growing regions, causing a reduction in the average number of pollination days (days in which bees will fly) by almost 50% compared to historical weather data [76]. Simulation suggests that this increased precipitation results in a reduction in the level of pollination given a typical average density of bees in fields [90]. Unusual hot spring weather can also have an effect on pollination. It can reduce bee activity by bumble-bee queens [8], as well as increase the development rate of wild blueberry, thereby reducing the number of days flowers are available for pollination [70]. Osbie et al. [90] also found that hot wet weather during bloom reduced pollination, but that the effect was not equal among bees. Fruit set attributed to bumble bees declined most as a result of a combination of a shorter flowering period and foraging behavior that exhibited fewer of the jump dispersal events that result in outcrossing.
Since the mid-1950s, an intensification of agricultural practices has resulted in increased reproductive potential of managed blueberry plants [41,43,91]. Consequently, pollination services provided by communities of wild bees are no longer considered adequate, especially in larger high-intensity farming operations [9,41,92], resulting in an increasing reliance upon commercial pollinators [17,18,93]. Much early research effort focused on exotic pollinator species such as the European honey bee, Apis mellifera (L.) [94,95,96]; the alfalfa leafcutting bee, Megachile rotundata Fabr. [13,14]; the fuzzy foot bee, Anthophora pallipes villosula Fourrée [97]; and the exotic mason bee, Osmia ribifloris biedermannii Michener [98] to augment pollination provided by wild pollinators. However, there has also been research on two native species with a focus on commercial pollination, the common eastern bumble bee, Bombus impatiens Cresson [15,16,17], and the Maine blueberry bee, Osmia atriventris Cresson [8,14]. This early research was some of the first to show an increase in wild-blueberry fruit set in field cages and the open field when wild pollinator communities were supplemented with imported commercial bees. Recently, Fulton et al. [99], in an intensive pollination study, showed that fruit set increased by supplementing the wild-bee fauna in Canadian wild-blueberry fields with commercial honey bees, bumble bees, and alfalfa leafcutting bees.
Surveyed wild-blueberry farmers support the idea that wild bees are important, but that uncertainty associated with annual wild-bee densities requires investment in commercial bees [10,11]. For some, this belief has been an obstacle to farmer-implemented conservation of wild native bees [12]. However, many farmers engage in conservation tactics such as planting pollinator reservoirs (reviewed above), providing nest sites for Osmia mason bees [100], burning fields as a pruning practice to enhance andrenid nesting [56], and minimizing pesticide exposure to wild bees [101]. All of these practices are based upon measuring the background wild-bee abundance and fruit set with methods developed for farmer use [102]. Despite the shift to heavy reliance on commercial pollinators, almost one-third of Maine farmers still rely exclusively on wild bees, although these farmers tend to manage lower-yielding operations [12].
Currently, rental honey bees and, to a lesser extent, the commercially reared bumblebee (B. impatiens) native to the eastern US, and the alfalfa leafcutting bee are rented (honey bees) or purchased (bumble bees and alfalfa leafcutting bees) by many farmers for pollination. For most farmers, the costs of rented or purchased bees can constitute the greatest financial input for the year [48]. The recommended honey-bee hive stocking for wild blueberry in Maine is 10 hives/hectare (range 4.5–12.5) [93] with some farmers stocking at densities exceeding 19.8 hives/hectare [18]. The stocking recommendation for commercial bumble bees in wild blueberry is 7–9 colonies (200 workers per colony)/hectare [16,17,103]. Alfalfa leafcutting bees are stocked at 20,000–50,000 bees/ha depending upon the fruit set desired [13,14,104]. The alfalfa leafcutting bee exhibits adult mortality below freezing air temperatures (<−5 °C) and, thus, higher stocking densities may be warranted in climates that frequently have frosts during wild-blueberry bloom [105].
Fruit set, defined as the proportion of flowers that have the potential after pollination to develop into marketable fruit, increases with increasing density of pollinators [18,41,44,78]. An increase in fruit set results in an increase in yield [90,106], which is the direct economic measure for farmers. Measured by Asare et al. [18], a 1% increase in fruit set will result in a 44.1 kg/ha increase in yield, and 60% of the variance in yield can be explained by fruit set and production practices. Increased levels of pollination also result in increased numbers of fertile seeds per berry, increased berry size and weight, and reduced premature fruit drop [4,32,44,55,70,107].
Wild-blueberry fruit set and yield is highly dependent upon bee pollination, and high-input wild-blueberry production systems are almost totally reliant on honey-bee importation [18]. A one-unit increase in foraging density of honey bees and wild bees will increase fruit set by 0.8% and 11.0%, respectively, although the marginal impacts on fruit set and yield suggest that honey bees contribute more to fruit set than wild bees owing to their greater numbers outweighing their lower pollination efficiency on a per bee basis [18]. In Canadian wild-blueberry production systems, Eaton and Nams [42] showed that the fruit set and yield benefits from honey bees level off at high bee densities, suggesting that farmers should limit the number of hives/field. Similarly, in Maine, diminishing marginal returns on fruit set, yield, and profit result from adding more honey-bee hives beyond what the University of Maine Extension recommends (4.5–12.5 hives/ha) [93]. In years with ideal weather conditions for pollination, overstocking honey-bee hives increases costs while not having an appreciable impact on fruit set, crop yield, and revenue [18,19]. However, there may be certain years and situations where having higher than recommended stocking densities of honey-bee hives can be worthwhile. This may be especially true with the recent weather conditions that reduce the number of good pollination days in May [76]. Stocking higher than recommended densities of rented honey bees may have more positive impacts on wild-blueberry profitability in the future if trends in poor weather conditions continue.
A recent economic analysis showed that the net income for Maine wild-blueberry farmers attributable to wild native bees is USD 613/ha [19]. However, farmers are only willing to invest USD 140–188/ha in conservation or pollinator reservoirs for enhancing wild-native-bee abundance, even though consumers are willing to pay 6.7 times more than this in the purchase of fruit (USD 888/ha [19]). This increased willingness to pay by consumers almost meets the annualized cost of installing pollinator reservoirs, which is USD 974/ha [57]. Consumer willingness might even exceed the cost of pollinator reservoirs, as Stevens et al. [108] found that the average consumer in the US was willing to pay USD 0.51–0.74/dry liter of wild blueberries, which is estimated at 1.75–2.5 times the annualized cost of installing a pollinator reservoir.
To support the economic viability of pollination decisions in wild blueberry, there have been several guides and tools developed for farmers over the past two decades. General pollination guides were produced to describe wild-blueberry pollination biology [4,93,109], wild-native-bee biology and conservation [109,110], and conservation of wild native Osmia mason bees [111]. Manuals for stocking fields with honeybees [93], commercial bumble bees [16], and alfalfa leafcutting bees [14] were produced. Guides were also written for estimating the potential honey-bee and wild-native-bee foraging force with resultant fruit set [102,112], planting of pollinator reservoirs [83], and minimizing exposure of pesticides to both commercial bees and wild native bees [101]. Du Clos et al. [113] developed a web-based software package for farmers that can be used to estimate the wild-native-bee community abundance in their wild-blueberry field on the basis of the research conducted by Groff et al. [50], who showed that the resident wild-native-bee abundance in a wild-blueberry field can be predicted by the adjacent landscape surrounding the field.
In summary, wild blueberry is a native North American fruit crop grown almost entirely in northeastern North America. Vaccinium angustifolium occurs in the highest proportion of the ericaceous species that make up the wild-blueberry community. It is a hermaphroditic plant species that is mostly self-infertile and requires insects for pollination. Bees are the dominant pollinators, and over 120 species are associated with Maine’s wild-blueberry fields. While this pollinator network is characterized by redundancy with different bee species occurring at different times of the day and at different periods of bloom (early, mid, late bloom), they also have different levels of pollination efficiency and floral constancy. Pollination accounts for 25% of the variance in wild-blueberry harvestable yield and, because commercial pollinators constitute one of the highest production costs for farmers, wild bees that provide an important ecosystem service need to be protected and conserved. In order to justify investment in conservation practices in the future, information such as that which we provided on the economic value of wild bees as pollinators is critical.

References

  1. Yarborough, D.E. Wild Blueberry Culture in Maine; Cooperative Extension: Maine Wild Blueberries Fact Sheet 220; The University of Maine: Orono, ME, USA, 2009; Available online: http://umaine.edu/blueberries/factsheets/production/wild-blueberry-culture-in-maine/ (accessed on 30 April 2020).
  2. Calderwood, L.; Yarborough, D.E.; Tooley, B. Maine Wild Blueberry Production Statistics; Cooperative Extension: Maine Wild Blueberries Fact Sheet; The University of Maine: Orono, ME, USA, 2019; Available online: https://extension.umaine.edu/blueberries/factsheets/statistics-2/crop-production-statistics-2019/ (accessed on 30 April 2020).
  3. NASS National Agricultural Statistics Service. Maine Agricultural Overview. 2019. Available online: http://www.nass.usda.gov/Statistics_by_State/Maine/ (accessed on 30 April 2020).
  4. Bell, D.J.; Rowland, L.J.; Smagula, J.; Drummond, F.A. Recent Advances in the Biology and Genetics of Lowbush Blueberry; Techical Bulletin 203; Maine Agricultural & Forest Experiment Station, University of Maine: Orono, ME, USA, 2009; p. 36. [Google Scholar]
  5. Bushmann, S.L.; Drummond, F.A. Abundance and Diversity of Wild Bees (Hymenoptera: Apoidea) Found in Lowbush Blueberry Growing Regions of Downeast Maine. Environ. Entomol. 2015, 44, 975–989. [Google Scholar] [CrossRef] [PubMed]
  6. Dibble, A.C.; Drummond, F.A.; Stubbs, C.; Veit, M.; Ascher, J.S. Bees of Maine, with a State Species Checklist. Northeast. Nat. 2017, 24, 1–48. [Google Scholar] [CrossRef] [Green Version]
  7. Javorek, S.K.; MacKenzie, K.E.; Kloet, S.P.V. Comparative Pollination Effectiveness among Bees (Hymenoptera: Apoidea) on Lowbush Blueberry (Ericaceae: Vaccinium angustifolium). Ann. Entomol. Soc. Am. 2002, 95, 345–351. [Google Scholar] [CrossRef]
  8. Drummond, F.A. Behavior of bees associated with the wild blueberry agro-ecosystem in the USA. Int. J. Entomol. Nematol. 2016, 2, 27–41. [Google Scholar]
  9. Lee, W.R. Pollination Studies on Low-Bush Blueberries. J. Econ. Entomol. 1958, 51, 544–545. [Google Scholar] [CrossRef]
  10. Rose, A.; Drummond, F.A.; Yarborough, D.E.; Asare, E. Maine Wild Blueberry Farmers: A 2010 Economic and Sociological Analysis of a Traditional Downeast Crop in Transition; Miscellaneous Report; Maine Agricultural & Forest Experiment Station, University of Maine: Orono, ME, USA, 2013; p. 445. [Google Scholar]
  11. Hanes, S.P.; Collum, K.; Hoshide, A.K.; Drummond, F.A.; Asare, E. Farmer perceptions of native pollinators and pollination strategies in the lowbush blueberry industry. Renew. Agric. Food Syst. 2013, 28, 1–8. [Google Scholar] [CrossRef]
  12. Hanes, S.; Collum, K.; Drummond, F.; Hoshide, A. Assessing Wild Pollinators in Conventional Agriculture: A Case Study from Maine’s Blueberry Industry. Hum. Ecol. Rev. 2018, 24, 97–113. [Google Scholar] [CrossRef]
  13. MacKenzie, K.; Rogers, D.; Javorek, S. The alfalfa leafcutting bee, Megachile rotundata Fabr.: An alternative managed pollinator of lowbush blueberry. Acta Hortic. 1997, 446, 87–90. [Google Scholar] [CrossRef]
  14. Stubbs, C.S.; Drummond, F.A. Management of the alfalfa leafcutting bee, Megachile rotundata (Hymenoptera: Megachilidae), for pollination of wild lowbush blueberry. J. Kans. Entomol. Soc. 1997, 70, 81–93. [Google Scholar]
  15. Whidden, T.L. The fidelity of commercially reared colonies of Bombus impatiens Cresson (Hymenoptera: Apidae) to lowbush blueberry in southern New Brunswick. Can. Entomol. 1996, 128, 957–958. [Google Scholar] [CrossRef]
  16. Stubbs, C.S.; Drummond, F.A. Bombus impatiens (Hymenoptera: Apidae): An alternative to Apis mellifera (Hymenoptera: Apidae) for lowbush blueberry production. J. Econ. Entomol. 2001, 94, 609–616. [Google Scholar] [CrossRef] [PubMed]
  17. Drummond, F.A. Commercial bumble bee pollination of lowbush blueberry. Int. J. Fruit Sci. 2012, 12, 54–64. [Google Scholar] [CrossRef]
  18. Asare, E.; Hoshide, A.K.; Drummond, F.A.; Chen, X.; Criner, G.K. Economic risk of bee pollination in Maine wild blueberry, Vaccinium angustifolium Aiton. J. Econ. Entomol. 2017, 110, 1980–1992. [Google Scholar] [CrossRef] [PubMed] [Green Version]
  19. Hoshide, A.K.; Drummond, F.A.; Stevens, T.H.; Venturini, E.M.; Hanes, S.P.; Sylvia, M.M.; Loftin, C.S.; Yarborough, D.E.; Averill, A.L. What is the value of wild bee pollination for wild blueberries and cranberries and who values it? Environments 2018, 5, 98. [Google Scholar] [CrossRef] [Green Version]
  20. Venturini, E.M.; Drummond, F.A.; Hoshide, A.K.; Dibble, A.C.; Stack, L.B. Pollination reservoirs for wild bee habitat enhancement: A review. Agroecol. Sustain. Food Syst. 2017, 41, 101–142. [Google Scholar] [CrossRef]
  21. Goulson, D.; Lye, G.C.; Darvill, B. Decline and conservation of bumble bees. Annu. Dev. Entomol. 2008, 53, 191–208. [Google Scholar] [CrossRef]
  22. Goulson, D.; Nicholls, E.; Botias, C.; Rotheray, E.L. Bee declines driven by combined stress from parasites, pesticides, and lack of flowers. Science 2015, 347, 1255957. [Google Scholar] [CrossRef]
  23. Allen-Wardwell, G.; Bernhardt, P.; Bitner, R.; Burquez, A.; Buchmann, S.; Cane, J.; Allen Cox, P.; Dalton, V.; Feinsinger, P.; Ingram, M.; et al. The potential consequences of pollinator declines on the conservation of biodiversity and stability of food crop yields. Conserv. Biol. 1998, 12, 8–17. [Google Scholar]
  24. Kevan, P.G. Pollinators as bioindicators of the state of the environment: Species, activity and diversity. Agric. Ecosys. Environ. 1999, 74, 373–393. [Google Scholar] [CrossRef]
  25. Winfree, R. Pollinator-dependent crops: An increasingly risky business. Curr. Biol. 2008, 18, R968–R969. [Google Scholar] [CrossRef] [Green Version]
  26. Borns, H.W. Changing paradigms of surficial geology in Maine: From the biblical flood to glaciation. In Deglacial History and Relative Sea-level Changes, Northern New England and Adjacent Canada; Special Paper 351; Geological Society of America: Boulder, CO, USA, 2001; Volume 351, pp. 1–7. [Google Scholar]
  27. Drummond, F.A.; Smagula, J.; Annis, S.; Yarborough, D.E. Organic Wild Blueberry Production; Techincal Bulletin 852; Maine Agricultural & Forest Experiment Station, University of Maine: Orono, ME, USA, 2009; p. 43. [Google Scholar]
  28. Jones, M.S.; Vanhanen, H.; Peltola, R.; Drummond, F.A. A global review of arthropod-mediated ecosystem-services in Vaccinium berry agroecosystems. Terr. Arthropod Rev. 2014, 7, 41–78. [Google Scholar] [CrossRef]
  29. Gawler, S.; Cutko, A. Natural Landscapes of Maine: A Guide to Natural Communities and Ecosystems; Maine Natural Areas Program: Augusta, ME, USA, 2010; p. 347. [Google Scholar]
  30. ArcGIS; Version 10.0; Environmental Systems Research Institute Inc.: Redlands, CA, USA, 2011.
  31. Qu, H.; Drummond, F.A. Simulation-based modeling of wild blueberry pollination. Comput. Electron. Agric. 2018, 144, 94–101. [Google Scholar] [CrossRef]
  32. Drummond, F.A. Wild blueberry fruit drop: A consequence of seed set? Agronomy 2020, 10, 939. [Google Scholar] [CrossRef]
  33. Garibaldi, L.A.; Steffan-Dewenter, I.; Winfree, R.; Aizen, M.A.; Bommarco, R.; Cunningham, S.A.; Kremen, C.; Carvalheiro, L.G.; Harder, L.D.; Afik, O.; et al. Wild Pollinators Enhance Fruit Set of Crops Regardless of Honey Bee Abundance. Science 2013, 339, 1608–1611. [Google Scholar] [CrossRef] [PubMed]
  34. SAS Institute. JMP®; Version 14; SAS Institute Inc.: Cary, NC, USA, 2017. [Google Scholar]
  35. Losey, J.E.; Vaughan, M. The economic value of ecological services provided by insects. BioScience 2006, 56, 311–323. [Google Scholar] [CrossRef] [Green Version]
  36. Cane, J.H. Exotic non-social bees (Hymenoptera: Apoidea) in North America: Ecological implications. In For Nonnative Crops, Whence Pollinator for the Future? Strickler, K., Cane, J.H., Eds.; Thomas Say Publications in Entomology: Lanham, MD, USA, 2003. [Google Scholar]
  37. Stubbs, C.S.; Drummond, F.A.; Ginsberg, H. Effects of Invasive Plant Species on Pollinator Service and Reproduction in Native Plants at Acadia National Park; Technical Report NPS/NER/NRTR- 2007-096; National Park Service: Boston, MA, USA, 2007.
  38. Cutler, G.C.; Reeh, K.W.; Sproule, J.M.; Ramanaidu, K. Berry unexpected: Nocturnal pollination of lowbush blueberry. Can. J. Plant Sci. 2012, 92, 707–711. [Google Scholar] [CrossRef]
  39. Kuznetsova, A.; Brockhoff, P.V.; Christensen, R.H.B. Lmertest Package: Tests in linear mixed effects models. J. Stat. Software 2017, 88, 1–26. [Google Scholar] [CrossRef] [Green Version]
  40. Yarborough, D.E. Improving Your Wild Blueberry Yields; Cooperative Extension: Maine Wild Blueberries Fact Sheet; The University of Maine: Orono, ME, USA, 2013; Available online: https://extension.umaine.edu/blueberries/factsheets/wild-blueberry-production/ (accessed on 12 July 2020).
  41. Eaton, L.J.; Murray, J.E. Relationships of pollinator numbers in blueberry fields to fruit development and yields. Acta Hortic. 1997, 446, 181–188. [Google Scholar] [CrossRef]
  42. Eaton, L.J.; Nams, V.O. Honeybee stocking numbers and wild blueberry production in Nova Scotia. Can. J. Plant Sci. 2012, 92, 1305–1310. [Google Scholar] [CrossRef]
  43. Boulanger, L.W. Blueberry pollination and solitary bees. Maine Farm Res. 1964, 12, 5–11. [Google Scholar]
  44. Desjardins, E.; de Oliveira, D. Commercial bumble bee Bombus impatiens (Hymenoptera: Apidae) as a pollinator in lowbush blueberry (Ericale: Ericaceae) fields. J. Econ. Entomol. 2006, 99, 443–449. [Google Scholar] [CrossRef] [PubMed]
  45. Smagula, J.M.; Litten, W.; Chen, Y.; Dunham, S. Variation of fruit set and fruit characteristics of wild lowbush blueberries (Vaccinium angustifolium Ait.) in a managed field. Acta Hortic. 1997, 446, 109–115. [Google Scholar] [CrossRef]
  46. Schut, L.; Tyedmers, P.; Cutler, G.C.; Melathopoulos, A. Is early pollination to lowbush blueberry an ecosystem service or disservice? Agric. Ecosys. Environ. 2017, 239, 368–375. [Google Scholar] [CrossRef]
  47. Wood, G.W.; Wood, F.A. Nectar production and its relation to fruitset in the lowbush blueberry. Can. J. Bot. 1963, 41, 1675–1679. [Google Scholar] [CrossRef]
  48. Yarborough, D. Blueberry Enterprise Budget; Cooperative Extension: Maine Wild Blueberries Fact Sheet 260; The University of Maine: Orono, ME, USA, 2016; Available online: https://extension.umaine.edu/blueberries/factsheets/marketing-and-business-management/260-blueberry-enterprise-budget/ (accessed on 11 July 2020).
  49. Greenleaf, S.; Williams, N.; Winfree, R.; Kremen, C. Bee foraging ranges and their relationship to body size. Oecologia 2007, 153, 589–596. [Google Scholar] [CrossRef]
  50. Groff, S.C.; Loftin, C.S.; Drummond, F.A.; Bushmann, S.; McGill, B. Spatial prediction of lowbush blueberry native bee pollinators in Maine, USA. Environ. Model. Soft. 2016, 79, 1–9. [Google Scholar] [CrossRef] [Green Version]
  51. Drummond, F.A.; Stubbs, C.S. Sampling bee populations in lowbush blueberry in Maine. Acta Hortic. 1997, 446, 101–108. [Google Scholar] [CrossRef]
  52. Cutler, G.C.; Nams, V.O.; Craig, P.; Sproule, J.M.; Sheffield, C.S. Wild bee pollinator communities of lowbush blueberry fields: Spatial and temporal trends. Basic Appl. Ecol. 2014, 16, 73–85. [Google Scholar] [CrossRef]
  53. Stubbs, C.S.; Jacobson, H.A.; Osgood, E.A.; Drummond, F.A. Alternative forage plants for native (wild) bees associated with lowbush blueberry, Vaccinium spp., in Maine; Technical Bulletin 148; Maine Agricultural & Forest Experiment Station, University of Maine: Orono, ME, USA, 1992. [Google Scholar]
  54. Isaacs, R.; Kirk, A.K. Pollination services provided to small and large highbush blueberry fields by wild and managed bees. J. Appl. Ecol. 2010, 47, 841–849. [Google Scholar] [CrossRef]
  55. Aras, P.; De Oliveira, D.; Savoie, L. Effect of a honey bee (Hymenoptera: Apidae) gradient on the pollination and yield of lowbush blueberry. J. Econ. Entomol. 1996, 89, 1080–1083. [Google Scholar] [CrossRef]
  56. Venturini, E.M.; Drummond, F.A.; Ballman, E. Native Andrena response to burning in the wild blueberry agroecosystem. J. Kans. Entomol. Soc. 2017, 90, 131–145. [Google Scholar] [CrossRef]
  57. Venturini, E.M.; Drummond, F.A.; Hoshide, A.K.; Dibble, A.C.; Stack, L.B. Pollination Reservoirs in Lowbush Blueberry (Ericales: Ericaceae). J. Econ. Entomol. 2017, 110, 333–346. [Google Scholar] [CrossRef] [PubMed] [Green Version]
  58. Gallai, N.; Salles, J.; Settele, J.; Vaissiere, B.E. Economic valuation of the vulnerability of world agriculture confronted with pollinator decline. Ecol. Econ. 2009, 68, 810–821. [Google Scholar] [CrossRef]
  59. Aizen, M.A.; Garibaldi, L.A.; Cunningham, S.A.; Klein, A.M. Long-term global trends in crop yield and production reveal no current pollination shortage but increasing pollinator dependency. Curr. Biol. 2008, 18, 1572–1575. [Google Scholar] [CrossRef] [Green Version]
  60. Calderone, N.W. Insect pollinated crops, insect pollinators and US agriculture: Trend analysis of aggregate data for the period 1992–2009. PLoS ONE 2012, 7, e37235. [Google Scholar] [CrossRef] [Green Version]
  61. McCauley, D.J. Selling out on nature. Nature 2006, 443, 27–28. [Google Scholar] [CrossRef]
  62. Winfree, R. The conservation and restoration of wild bees. Ann. N. Y. Acad. Sci. 2010, 1195, 169–197. [Google Scholar] [CrossRef]
  63. Klein, A.; Vaissiere, B.E.; Cane, J.H.; Steffan-Dewenter, I.; Cunningham, S.A.; Kremen, C.; Tscharntke, T. Importance of pollinators in changing landscapes for world crops. Proc. R. Soc. B 2007, 274, 303–313. [Google Scholar] [CrossRef] [Green Version]
  64. Vander Kloet, S.P. The Genus Vaccinium in North America; Agriculture and Agri-Food Canada: Ottawa, ON, Canada, 1988; Volume 1828.
  65. Beers, L.; Rowland, L.J.; Drummond, F.A. Genetic diversity of lowbush blueberry throughout its U.S. native range in managed and non-managed populations. Agriculture 2019, 9, 113. [Google Scholar] [CrossRef] [Green Version]
  66. Bell, D.J.; Rowland, L.J.; Polashcock, J.J.; Drummond, F.A. Suitability of EST-PCR markers developed in highbush blueberry for genetic fingerprinting and relationship studies in lowbush blueberry and related species. J. Am. Soc. Hortic. Sci. 2008, 133, 1–7. [Google Scholar] [CrossRef] [Green Version]
  67. DeGomez, T. Pruning Lowbush Blueberry Fields; Cooperative Extension: Maine Wild Blueberries Fact Sheet 229 UMaine Extension Number 2168; The University of Maine: Orono, ME, USA, 1988; Available online: https://extension.umaine.edu/blueberries/factsheets/production/pruning-lowbush-blueberry-fields/ (accessed on 30 April 2020).
  68. Myra, M.; MacKenzie, K.; Vander Kloet, S.P. Investigation of a possible sexual function specialization in the lowbush blueberry (Vaccinium angustifolium Aiton. Ericaceae). Small Fruits Rev. 2004, 3, 313–324. [Google Scholar] [CrossRef]
  69. Bell, D.J.; Rowland, L.J.; Drummond, F.A. Fine-scale spatial genetic structure associated with Vaccinium angustifolium Aiton (Ericaceae). Int. J. Bot. 2012, 2, 72–82. [Google Scholar] [CrossRef]
  70. Drummond, F. Reproductive Biology of Wild Blueberry (Vaccinium angustifolium Aiton). Agriculture 2019, 9, 69. [Google Scholar] [CrossRef] [Green Version]
  71. White, S.N.; Boyd, N.S.; van Acker, R.C. Growing degree-day models for predicting lowbush blueberry (Vaccinium angustifolium Ait.) ramet emergence, tip dieback, and flowering in Nova Scotia, Canada. HortScience 2012, 47, 1014–1021. [Google Scholar] [CrossRef] [Green Version]
  72. Bell, D.J.; Drummond, F.A.; Rowland, J.L. Evidence of functional gender polymorphisms in a population of the hermaphroditic lowbush blueberry (Vaccinium angustifolium Ait.). Botany 2012, 90, 393–399. [Google Scholar] [CrossRef]
  73. Aalders, L.E.; Hall, I.V. Pollen incompatibility and fruit set in lowbush blueberries. Can. J. Genet. Cytol. 1961, 3, 300–307. [Google Scholar] [CrossRef]
  74. Usui, M.; Kevan, P.G.; Obbard, M. 2005. Pollination and breeding system of lowbush blueberries, Vaccinium angustifolium Ait. and V. myrtilloides Michx (Ericacaeae), in the boreal forest. Can. Field Nat. 2005, 119, 48–57. [Google Scholar] [CrossRef] [Green Version]
  75. Bell, D.J.; Rowland, L.J.; Stommel, J.; Drummond, F.A. Yield variation among clones of lowbush blueberry as a function of kinship and self-compatibility. J. Am. Soc. Hortic. Sci. 2010, 135, 1–12. [Google Scholar]
  76. Drummond, F.A.; Dibble, A.C.; Stubbs, C.; Bushmann, S.; Ascher, J.; Ryan, J. A natural history of change in native bees associated with lowbush blueberry in Maine. Northeast. Nat. 2017, 24, 49–68. [Google Scholar] [CrossRef]
  77. Du Clos, B.; Loftin, C.; Drummond, F.A. Non-crop habitat use by wild bees in a mixed-use agricultural landscape. Environ. Entomol. 2020, 49, 502–515. [Google Scholar] [CrossRef]
  78. Drummond, F.A.; Ballman, E.; Collins, J. Are They Weeds or a Life Force? Or Sustainability on the Edge. Spire Maine J. Conserv. Sustain. 2017. Available online: https://umaine.edu/spire/2017/05/04/drummond-et-al/ (accessed on 10 July 2020).
  79. Moisan-DeSerres, J.; Chagnon, M.; Fournier, V. Influence of windbreaks and forest borders on abundance and species richness of native pollinators in lowbush blueberry fields in Québec, Canada. Can. Entomol. 2014, 147, 432–442. [Google Scholar] [CrossRef]
  80. McKechnie, I.M.; Thomsen, C.J.; Sargent, R.D. Forested field edges support a greater diversity of wild pollinators in lowbush blueberry (Vaccinium angustifolium). Agric. Ecosys. Environ. 2017, 237, 154–161. [Google Scholar] [CrossRef]
  81. Dibble, A.C.; Berg Stack, L.; Drummond, F.A. Bee visitation on flowers in Maine, United States, reveals the relative attractiveness of plants through space and time: Part I. Environ. Entomol. 2020, 49, 726–737. [Google Scholar] [CrossRef]
  82. Dibble, A.C.; Berg Stack, L.; Drummond, F.A. Plant origin and other attributes impact bee forage patterns in a common garden study in Maine, United States; Part, II. Environ. Entomol. 2020, 49, 738–752. [Google Scholar] [CrossRef]
  83. Venturini, E.; Berg-Stack, L.; Dibble, A.C.; Drummond, F.A.; Hoshide, A.K. Enhancing Native Bees for Wild Lowbush Blueberry Crop Pollination: Bee Pasture; Cooperative Extension: Maine Wild Blueberries Fact Sheet; The University of Maine: Orono, ME, USA, 2015; p. 9. Available online: http://umaine.edu/blueberries/files/2010/05/2015-Bee-Pasture-Fact-Sheet.pdf (accessed on 10 July 2020).
  84. Venturini, E.M.; Drummond, F.A.; Hoshide, A.K. Organic establishment of pollination reservoirs in the lowbush blueberry (Ericales: Ericaceae) agroecosystem. Open Agric. 2018, 3, 393–403. [Google Scholar] [CrossRef] [Green Version]
  85. Moisan-Deserres, J.; Girard, M.; Chagnon, M.; Fournier, V. Pollen loads and specificity of native pollinators of lowbush blueberry. J. Econ. Entomol. 2014, 107, 1156–1162. [Google Scholar] [CrossRef]
  86. Stubbs, C.S.; Drummond, F.A. Blueberry and cranberry (Vaccinium spp.) pollination: A comparison of managed and native bee foraging behavior. Acta Hortic. 1997, 437, 341–344. [Google Scholar] [CrossRef]
  87. Rowland, L.J.; Ogden, E.L.; Bell, D.J.; Drummond, F.A. Pollen-mediated gene flow in managed fields of lowbush blueberry. Can. J. Plant Sci. 2019, 100, 95–102. [Google Scholar] [CrossRef]
  88. Bajcz, A.; Hiebeler, D.; Drummond, F.A. Grid-Set-Match, an agent-based simulation model, predicts fruit set for the Maine lowbush blueberry (Vaccinium angustifolium) agroecosystem. Ecol. Model. 2017, 361, 80–94. [Google Scholar] [CrossRef]
  89. Yarborough, D.E.; Drummond, F.A.; Annis, S.; D’Appollonio, J. Maine Wild blueberry systems analysis. Acta Hortic. 2017, 1180, 151–160. [Google Scholar] [CrossRef]
  90. Obsie, E.Y.; Qu, H.; Drummond, F. Wild blueberry yield prediction using a combination of computer simulation and machine learning algorithms. Comput. Electron. Agric. 2020, 178, 105778. [Google Scholar] [CrossRef]
  91. Boulanger, L.W.; Wood, G.W.; Osgood, E.A.; Dirks, C.O. Native Bees Associated with the Lowbush Blueberry in Maine and Eastern Canada; Technical Bulletin 26; Maine Agricultural & Forest Experiment Station, University of Maine: Orono, ME, USA, 1967; p. 22. [Google Scholar]
  92. Osgood, E.A. Soil Characteristics of Nesting Sites of Solitary Bees Associated with the Low-Bush Blueberry in Maine; Technical Bulletin 59; Maine Agricultural & Forest Experiment Station, University of Maine: Orono, ME, USA, 1972. [Google Scholar]
  93. Drummond, F.A. Honeybees and Blueberry Pollination; Cooperative Extension: Maine Wild Blueberries Fact Sheet 629; The University of Maine: Orono, ME, USA, 2002; Available online: http://umaine.edu/blueberries/factsheets/bees/629-honey-bees-and-blueberry-pollination/ (accessed on 30 April 2020).
  94. Wood, G.W. The influence of honey bee pollination on fruit set of the lowbush blueberry. Can. J. Plant Sci. 1961, 41, 332–335. [Google Scholar] [CrossRef] [Green Version]
  95. Wood, G.W. Evidence of increased fruit set in lowbush blueberry by using honey bees. HortScience 1969, 4, 211–212. [Google Scholar]
  96. Lomond, D.; Larson, D.J. Honey bees, Apis mellifera (Hymenoptera: Apidae), as pollinators of lowbush blueberry, Vaccinium angustifolium, on Newfoundland coastal barrens. Can. Entomol. 1983, 115, 1647–1651. [Google Scholar] [CrossRef]
  97. Stubbs, C.S.; Drummond, F.A. Pollination of lowbush blueberry by Anthophora pallipes villosula and Bombus impatiens (Hymenoptera: Anthophoridae and Apidae). J. Kans. Entomol. Soc. 2000, 72, 330–333. [Google Scholar]
  98. Stubbs, C.S.; Drummond, F.A.; Osgood, E.A. Osmia ribifloris biedermannii and Megachile rotundata (Hymenoptera: Megachilidae) introduced into the lowbush blueberry agroecosystem in Maine. J. Kans. Entomol. Soc. 1994, 67, 173–185. [Google Scholar]
  99. Fulton, M.; Jesson, L.K.; Bobiwash, K.; Schoen, D.J. Mitigation of pollen limitation in the lowbush blueberry agroecosystem: Effect of augmenting natural pollinators. Ecosphere 2015, 6, 1–19. [Google Scholar] [CrossRef] [Green Version]
  100. Stubbs, C.S.; Drummond, F.A.; Allard, S.L. Bee conservation and increasing Osmia spp. in Maine lowbush blueberry fields. Northeast. Nat. 1997, 4, 133–144. [Google Scholar] [CrossRef]
  101. Calderwood, L.; Drummond, F. IPM Tactics to Reduce Pesticide Exposure to Honey and Native Bees; Cooperative Extension: Maine Wild Blueberries Fact Sheet; The University of Maine: Orono, ME, USA, 2019; Available online: https://extension.umaine.edu/blueberries/wp-content/uploads/sites/41/2019/01/2009e.pdf (accessed on 16 August 2020).
  102. Drummond, F.A. Estimating Fruit Set and Pollinator Force in Wild Blueberry; Cooperative Extension: Maine Wild Blueberries Fact Sheet 2019; The University of Maine: Orono, ME, USA, 2020; Available online: https://extension.umaine.edu/blueberries/estimating-the-strength-of-your-pollinator-force-in-wild-blueberry/ (accessed on 12 July 2020).
  103. Drummond, F.A.; Yarborough, D. Commercial Bumble Bee Management (Bombus impatiens) for Wild Blueberry Pollination; Cooperative Extension: Maine Wild Blueberries Fact Sheet 302 UMaine Extension Number 2421; The University of Maine: Orono, ME, USA, 2002; Available online: https://extension.umaine.edu/blueberries/factsheets/bees/302-commercial-bumble-bee-bombus-impatiens-management-for-wild-blueberry-pollination/ (accessed on 12 July 2020).
  104. Stubbs, C.S.; Drummond, F.A. Pollination of wild lowbush blueberry, Vaccinium angustifolium by the alfalfa leafcutting bee, Megachile rotundata. Acta Hortic. 1997, 446, 189–196. [Google Scholar] [CrossRef]
  105. Sheffield, C.S. Summer bees for spring crops? Potential problems with Megachile rotundata (Fab.) (Hymenoptera: Megachilidae) as a pollinator of lowbush blueberry (Ericaceae). J. Kans. Entomol. Soc. 2008, 81, 276–287. [Google Scholar] [CrossRef]
  106. Drummond, F.A. Factors that affect yield in wild blueberry, Vaccinium angustifolium Aiton. Agric. Res. Tech. 2019, 22, 556212. [Google Scholar] [CrossRef]
  107. Bell, H.P. The development of the blueberry seed. Can. J. Botany 1957, 35, 139–153. [Google Scholar] [CrossRef]
  108. Stevens, T.; Hoshide, A.K.; Drummond, F.A. Willingness to pay for native pollination of blueberries: A conjoint analysis. Int. J. Agric. Market. 2015, 2, 68–77. [Google Scholar]
  109. Jesson, L.; Schoen, D.; Cutler, C.; Bates, S. Pollination in Lowbush Blueberry; A summary of research findings from the Canadian Pollination Initiative; NSERC-CANPOLIN School of Environmental Sciences, University of Guelph: Guelph, ON, Canada, 2014. [Google Scholar]
  110. Drummond, F.A.; Stubbs, C.S. Wild Bee Conservation for Wild Blueberry Fields; Cooperative Extension: Maine Wild Blueberries Fact Sheet 630; The University of Maine: Orono, ME, USA, 2003; p. 12. Available online: https://extension.umaine.edu/blueberries/factsheets/bees/630-wild-bee-conservation-for-wild-blueberry-fields/ (accessed on 12 July 2020).
  111. Stubbs, C.S.; Drummond, F.A.; Yarborough, D. Field Conservation Management of Native Leafcutting and Mason Osmia Bees; Cooperative Extension: Maine Wild Blueberries Fact Sheet 301 UMaine Extension No. 2420; The University of Maine: Orono, ME, USA, 2000; p. 6. Available online: https://extension.umaine.edu/blueberries/factsheets/bees/301-field-conservation-management-of-native-leafcutting-and-mason-osmia-bees/ (accessed on 12 July 2020).
  112. Skinner, J.; Wilson, M.; Asare, E.; Bajcz, A.; Bickerman, K.; Chapin, S.; Dibble, A.C.; du Clos, B.; Collum, K.; Hanes, S. How to Estimate Native Bee Abundance in the Field; The University of Maine: Orono, ME, USA, 2014; Available online: https://extension.umaine.edu/blueberries/factsheets/pollination/ (accessed on 12 July 2020).
  113. Du Clos, B.; Loftin, C.; Drummond, F.A. BeeMapper Tool Quick Reference Guide. 2017. Available online: https://umaine.edu/beemapper/wp-content/uploads/sites/353/2017/07/BeeMapper-Quick-Guide-for-Web.pdf (accessed on 5 May 2020).
Figure 1. Relationship between honey-bee stocking rate in a field (hives/ha) and the activity density of honey bees (bees foraging/minute) in a field (2011 and 2012).
Agronomy 10 01413 g001
Figure 2. Frequency distributions of honey-bee (HB) (A), bumble-bee (BB) (B), and other bee (OB) (C) activity densities over the fields sampled during the three years (2010–2012).
Agronomy 10 01413 g002
Figure 3. The effects of HB stocking levels in wild-blueberry fields on yield and crop value. Stocking rate is presented as number of HB hives per hectare, yield is presented as kg/ha, and crop value is presented as thousands of USD/ha (n = 34 fields, 2011–2012). (A) kg berries/ha resulting from HB stocking rates; (B) value of crop (USD × 103/ha) resulting from HB stocking rates.
Agronomy 10 01413 g003
Table 1. Predictive models for percentage late fruit set and coefficient of variation (CV) of fruit set describing relationship between late fruit set and CV of fruit set, and bee activity density for honey bees, two wild-bee groups, total wild native bee activity density, and bee species richness. Activity density was measured as bees/minute; WB = total wild bees (bumblebees + “other bees”), BB = bumble bees), HB = honey bees.
Fruit Set ModelPredictorsDegrees of FreedomF RatioProbability 1Coefficient
Late fruit set
HB, WB, Richness
Fixed effects
Marginal r2: 0.336
HB
WB
Richness
1, 24
1, 24
1, 24
6.604
6.416
4.046
0.017
0.018
0.056
5.18 ± 2.02
28.56 ± 11.28
−0.75 ± 0.37
Random effectsYear
Year × HB
Year × WB
Year × Richness
<0.001
0.164
0.133
0.376
Late fruit set
HB, BB, OB, Richness
Fixed effects
Marginal r2: 0.398
HB
BB
OB
Richness
1, 23
1, 23
1, 23
1, 23
5.982
18.523
2.098
3.029
0.023
<0.001
0.161
0.095
5.14 ± 2.10
28.45 ± 6.61
29.37 ± 20.28
−0.77 ± 0.44
Random effectsYear
Year × HB
Year × BB
Year × OB
Year × Richness
<0.001
0.210
0.311
0.402
0.719
CV of fruit set
HB, WB, Richness
Fixed effects
Marginal r2: 0.203
HB
WB
Richness
1, 24
1, 24
1, 24
3.328
4.493
1.115
0.086
0.045
0.301
−6.25 ± 3.43
− 40.62 ± 19.16
0.67 ± 0.64
Random effectsYear
Year × HB
Year × WB
Year × Richness
<0.001
0.095
0.115
0.299
CV of fruit set
HB, BB, OB, Richness
Fixed effects
Marginal r2: 0.278
HB
BB
OB
Richness
1, 22
1, 22
1, 22
1, 22
159.366
2731.374
0.119
0.102
<0.001
<0.001
0.733
0.752
−8.15 ± 0.65
−52.26 ± 5.98
−31.22 ± 90.50
0.32 ± 0.35
Random effectsYear
Year × HB
Year × BB
Year × OB
Year × Richness
<0.001
0.177
0.226
0.326
0.564
1 Probabilities for fixed effects are based upon Satterthwaite’s F statistic, and probabilities for random effects are based upon Wald’s statistic. Bold entries are significant at p < 0.05.
Table 2. Mixed model results for prediction of yield (kg berries/ha). Yield is a farmer reported value, based on 34 fields, 2010–2012.
Fruit Set ModelPredictorsDegrees of FreedomF RatioProbability 1Coefficient
Yield (kg/ha)
Late fruit set,
field size (ha),
field management
Fixed effects
Marginal r2: 0.238
Late fruit set
Field size
Management
1, 22040
1, 100771
1, 385689
6.555
4.023
0.887
0.011
0.049
0.346
48.72 ± 19.03
−549.46 ± 198.08
−301.89 ± 320.56
Random effectsYear
Year × Late fruit set
Year × Field size (ha)
Year × Management
<0.001
0.764
0.589
0.677
1 Probabilities for fixed effects are based upon Satterthwaite’s F statistic and probabilities for random effects are based upon Wald’s statistic. Bold entries are significant at P ≤ 0.05.
Table 3. Mean value of the pollination services provided by three bee groups when (A) each group is considered to be an equally efficient pollinator of wild blueberry and (B) the activity density of wild bees is adjusted for efficiency in pollination using the pollination rate equivalency developed by Javorek et al. [7]. HB = honeybees, BB = bumblebees, OB = other wild bees (i.e., all non-Bombus) bees; n = 34 fields.
Bee GroupMean Value of Pollination (USD)Mean Value of Pollination
(Percentage of Gross in USD)
A: bee groups considered as equivalent pollinators
HB$19,370.5564%
BB$2033.8514%
OB$4239.1522%
B: bee group activity density adjusted by pollination equivalencies
HB$15,024.6143%
BB$5614.4933%
OB$5016.9624%

