
Abstract
Capacity design, according to the modern seismic building codes, requires the application of specific rules and construction details in order to prevent brittle failure modes at material, element and structural level. In particular, with reference to single-story precast reinforced concrete structures with columns joined by pinned beams, the Italian seismic building code, following the Eurocode 8 general principles, requires that beam-to-column connection should be designed in order to avoid the connection failure before the formation of the plastic hinge at the column base. However, no specific details are provided in order to reach such a performance. Recent European earthquakes showed that seismic performance of beam-to-column dowel connections can be very poor. Hence, for European typical dowel beam-to-column connections, this study aims to investigate: (a) possible connection configurations obtained according to seismic design; (b) possible failure modes involving connection elements (steel dowel, transversal steel reinforcement, dowel concrete cover); (c) how available formulations are able to describe such failure modes and the related shear strength; (d) influence of connection failure on the global seismic safety at collapse of new designed single-story RC precast buildings. The reference buildings and beam-to-column connections are designed considering different geometrical layouts of the primary structure and different seismic hazard levels, i.e. four sites and two soil types. Structural capacity is estimated considering global, i.e. related to column plastic hinge degradation measured in terms of top lateral displacements, and local, i.e. related to connection shear strength, failure modes. Nonlinear multi-stripe analyses are performed for the seismic assessment.
1 Introduction
Recent earthquakes have shown that collapse of single-story RC precast buildings can cause large direct and indirect losses, i.e. casualties, damage to installations and downtime (Belleri et al. 2015; Faggiano et al. 2009; Ghosh and Cleland 2012; Liberatore et al. 2013; Savoia et al. 2017). This is related to their use, mainly industrial, sometimes commercial, rarely educational and/or sportive. The structures of this type of buildings in Mediterranean countries are generally made of socket foundations, columns pinned to beams covered by roof tiles (Bellotti et al. 2014).
Some research studies have been performed on the seismic assessment of industrial single-story RC precast buildings, focusing either stock of structures through parametric analyses (Babič and Dolšek 2016; Casotto et al. 2015; Demartino et al. 2017a, b) or specific reference buildings (Clementi et al. 2016; Ercolino et al. 2016; Magliulo et al. 2008; Pierdicca et al. 2016). Most of these studies concern existing structures, often underdesigned for seismic loads. Furthermore, some of them assume that building capacity only depends on column base capacity (Palanci et al. 2017).
If research studies on single-story industrial RC precast buildings designed according to modern seismic codes are investigated (Biondini and Toniolo 2009), very few of them are focused on the seismic intensity measures (IMs) corresponding to the actual attainment of the collapse (Ercolino et al. 2018; Kramar et al. 2010; Magliulo et al. 2018), denoting a lack of knowledge on this topic. This is a fundamental step to evaluate if code provisions actually lead to the assumed probability of exceedance of the collapse limit state (CEN 2002).
The performance-based approach of modern seismic building codes requires the definition of limit states which correspond to boundary conditions of the structural and nonstructural response, under a given intensity level of the seismic action. However, different analysis and modelling methodologies used for the structural capacity or the seismic demand assessment could lead to different analytical definitions of the limit state attainment.
When referring to the collapse limit state, existing seismic codes do not specify analytical conditions which can be related to the collapse. In the current Italian building code (D. M. 17/01/2018 2018) the collapse limit state corresponds to heavy damage for structural components, which leads to residual safety with regards to gravity loads and very limited residual safety with respect to lateral loads. Eurocode 8 (CEN 2005) does not provide a definition of collapse limit state, stating that ultimate limit states are those associated with collapse or with other forms of structural failure, which might endanger the safety of people.
In order to quantify the structural response at the collapse stage, in terms of local or global parameters, numerical analyses should be performed. Refined analysis methods and sophisticated models allow a more realistic structural response prediction, but, on the other hand, they require computational efforts and detailed information to be defined in the structural model (Raghunandan and Liel 2013; Vamvatsikos and Cornell 2002). For this reason, simplified numerical analyses have been developed to investigate the structural response at the collapse limit state (Adam and Jäger 2012; Mwafy and Elnashai 2001). However, due to modelling assumptions during the assessment phase, the effective structural response under seismic actions can be misunderstood and apparently safe structures can reveal to be prone to suffer major damage or even total collapse.
Furthermore, different types of structures may require different earthquake demand parameters (EDPs) to be monitored to define the structural collapse, due to their peculiar features (Jäger and Adam 2013).
Recent earthquakes and experimental tests have shown that most of the collapses of industrial single-story RC precast buildings are related to beam-to-column connection and roof-to-beam connection collapses (Arslan et al. 2006; Magliulo et al. 2014b; Ozden et al. 2014), even though, in some cases, these buildings were designed for seismic loads. For this reason, in the last years, experimental studies have been performed to determine the capacity of the more spread connection types (Dal Lago et al. 2017; Magliulo et al. 2014a, 2015a; Psycharis and Mouzakis 2012a, b), related numerical models have been developed (Sousa et al. 2020; Titi et al. 2018; Zoubek et al. 2013) and new connections have been proposed (Belleri et al. 2013, 2017; Magliulo et al. 2017). As a consequence, new design formulae (Zoubek et al. 2015) for these connections have been provided, which are not yet included in code provisions and spread design guidelines (Fischinger et al. 2014). Recently Beilic et al. (2017) performed a comprehensive study on the fragility of single-story RC precast structures, designed according to old and current Italian codes: both column flexural collapse and beam-to-column connection collapse were taken into account, with a refined structural modelling, considering both frictional (old) and doweled beam-to-column connections. However, design and related shear capacity of doweled beam-to-column connections were provided according to EOTA (TR029 2007; TR045 2013), which do not represent the current design practice in Italy.
The study described in the following sections addresses to the seismic collapse assessment of industrial single-story RC precast structures, designed according to the recent seismic Italian building code (D. M. 14/01/2008 2008) which mostly complies with the Eurocode provisions. The original aspect of the presented research is the attention paid to beam-to-column connections: they are designed according to the current European, in particular Italian, provisions and practice, and their capacity is determined according to recent models. This allows a more realistic evaluation of the intensity measures (IMs) corresponding to the collapse of this type of structures. Different geometries of the buildings and seismic prone areas are considered. Multi-stripe analyses (Baker 2015; Jalayer and Cornell 2009) are performed in order to associate the demand/collapse capacity ratio to the reference spectral acceleration and to the return period associated to the considered seismic prone areas.
2 Geometry and design of case studies
The reference structure (Fig. 1) consists of precast columns fixed at the base with socket foundations: the sockets are connected in both directions by RC beams. The columns are connected, by means of dowel connections, to the main precast prestressed beams in the transversal direction, and to the girders in the longitudinal direction. The main precast beams show variable cross-section width and height, with a 10% slope in the vertical plane. The longitudinal girder beams are assumed to have a rectangular cross section. The roof consists of precast adjacent π-shaped elements (tiles) joined by a cast in situ concrete slab, 5 cm thick. Vertical precast panels (specific weight equal to 4 kN/m2) make the cladding system: they are connected to the main beams along the transversal direction and to the girders along the longitudinal direction.

Geometry of the reference structures: a vertical view, b plan view, c cross section details (measures in mm)
The presence of a crane is considered, assuming the industrial use of the building: the crane moves on HEA400 steel beams, supported by precast corbels in the internal side of the columns.
Two different geometries are analyzed, varying the length of the spans (Fig. 1): H = 9 m, H1 = 7.5 m, one span (L1) in the transversal direction, four spans (L2) in longitudinal direction, (L1, L2) equal to (15 m, 6 m) for the first geometry (SS) and equal to (20 m, 8 m) for the second geometry (LS).
The precast structures are designed according to the Italian building code (D. M. 14/01/2008 2008) (for more details see also Ercolino et al. 2018), which complies with the Eurocodes. Regarding the seismic forces, four different seismic prone zones are considered: L’Aquila (AQ) for a high level seismic intensity, Naples (NA) for a medium level intensity, Rome (RM) for a low level intensity and Milan (MI) for a very low level intensity. The design is made against two limit states: damage limit state (DLS, return period TR = 50 years) and ultimate limit state (ULS, TR = 475 years); the corresponding accelerations at bedrock are: 0.104 g (AQ-DLS), 0.261 g (AQ-ULS), 0.060 g (NA-DLS), 0.168 g (NA-ULS), 0.055 g (RM-DLS), 0.123 g (RM-ULS), 0.024 g (MI-DLS) and 0.050 g (MI ULS). Two soil types are also considered: A (the average velocity of S waves in the upper 30 m, Vs,30, is larger than 800 m/s) and C (Vs,30 is in the range 180–360 m/s).
In short, 2 geometries by 4 sites by 2 soil types, i.e. 16 buildings, are designed. Medium ductility class (B) provisions are followed, with a q factor equal to 2.5. A concrete class C45/55, with a cylindrical characteristic compressive strength fck = 45.65 N/mm2, and a steel B450C, having a characteristic yielding strength fyk = 450 N/mm2, are used.
In the following, details of the elements carrying seismic forces, i.e. columns, are reported, with particular reference to the base sections. Figure 1c shows an example of column cross section, listing longitudinal reinforcement, stirrups and ties for the industrial building sited in L’Aquila, soil C, geometry SS. In Table 1 column design details are reported: dimension of the column square section (Bcol), longitudinal reinforcement geometric ratio (ρ = As/Ac), and transversal reinforcement, i.e. number of legs (stirrups and ties) for each direction (equal in X and Z direction) and step. It is interesting to note that in the case of soil type A seismic forces do not affect the design and, consequently, the column geometry and reinforcement are equal for sites with different seismic intensity level (see also Ercolino et al. 2018).
3 Capacity assessment
The structural capacity assessment is performed using two different approaches. The first one takes into account the global structural capacity in terms of lateral displacements: this approach assumes the presence of strong connections which avoids connection failures and leads to a global failure mechanism, involving the formation of rotational plastic hinge at the column base. The second approach takes into account possible shear failures at the beam-to-column connection level. Indeed, the goal of this study is to understand if, even in the case of seismic design of dowel connections which should prevent the connection failure before the formation of the column plastic hinges, the presence of poor details and/or unfavorable geometrical layouts can cause brittle shear failure of the connections. This would lead to low shear strength values, which do not guarantee the design global structural capacity.
In the following, the main nonlinear modelling assumptions are described and the assumed capacity assessment approaches are presented in terms of methodology and results.
3.1 Nonlinear modelling
In order to reproduce the actual building nonlinear response, a numerical structural model is created by OpenSees software (McKenna and Fenves 2013). Considering the geometrical description of Sect. 2, the structural model includes the following elements.
-
Columns fixed at the base due to the effective restraint provided by the socket foundation.
-
Elastic horizontal elements to represent the main beams and the girders, pinned to the columns and joined in their own plane by a rigid diaphragm, due to the presence of a cast in situ concrete slab (5 cm depth).
-
Rigid links representing geometrical eccentricities of the structural elements.
-
The cladding panels are not considered in the model in terms of lateral stiffness: they are considered only in terms of masses and loads applied to the main structure. It is well known that the presence of cladding panels can affect the dynamic response of the main structure (Magliulo et al. 2015b) and that the panel-to-structure connections are often not able to allow relative displacements during the seismic event. However, due to the low shear strength of the commonly adopted panel-to-structure connections and to the large forces they absorb if they are hinge connections, they collapse in the early steps of the analysis, even for low seismic intensity, so that the presence of the cladding panels lightly influences the structural collapse limit state (Ercolino et al. 2017). Furthermore, in the last years a large effort has been made (Negro and Tornaghi 2017; Toniolo and Dal Lago 2017) to deepen this issue and to develop reliable panel-to-structure connections: their functioning is based on avoiding panel-to-structure interaction, which is in agreement with the model proposed herein.
-
The column nonlinear behavior is modeled considering a lumped plasticity approach, coupling a plastic hinge at the base, where nonlinear behavior is lumped, and an elastic element which describes the elastic flexural response of the column (Fig. 2). A mean value of the concrete compressive strength equal to fcm = 59.75 N/mm2 and of the steel yielding strength equal to fym = 490.3 N/mm2 are adopted (Ercolino et al. 2018). Curvature and yielding moment are obtained from a fiber analysis of the column cross-section and the moment-rotation backbone curve is obtained, according to Fischinger et al. (2008), using the formulations provided in Fardis and Biskinis (2003) and Haselton (2006), as shown in Fig. 2. The hysteretic behavior is modelled according to Ibarra et al. (2005) and it is implemented in OpenSees through the modified Ibarra-Medina-Krawinkler deterioration model with peak-oriented hysteresis response.
Fig. 2 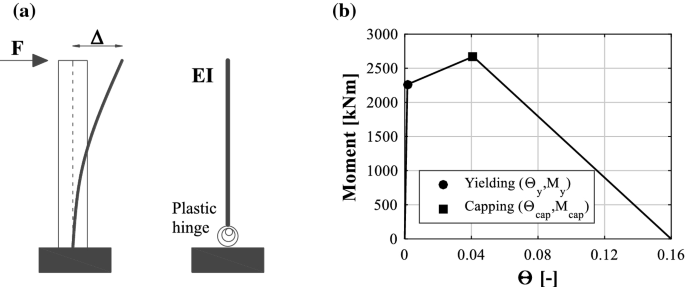
a Column modelling and b M–Θ backbone curve for column plastic hinge in AQ soil C, SS

Table 2 lists the modal properties of the case studies nonlinear models, i.e. the traslational masses along X and Z direction and the traslational fundamental periods along Z direction (T1) and X direction (T2).
3.2 Structural displacement capacity depending on column behavior
In order to obtain the structural capacity in terms of lateral displacements, nonlinear static (pushover) analyses are performed in both the main horizontal directions of the building.
The structural capacity corresponds to the drift at 50% reduction of the maximum building base shear (Ercolino et al. 2018; Workgroup 2017). Consequently, building capacity depends on the column nonlinear behavior, i.e. on the skeleton curve assigned to the base plastic hinges. Table 3 shows the ultimate displacements of the analyzed buildings along both the main horizontal directions.
3.3 Connection design and capacity
A beam-to-column dowel connection is assumed in this study, because it is the most common connection for single-story European industrial RC buildings (Fig. 3). The most spread configuration consists of vertical steel dowels, embedded in the column and passing through or inserted in holes in the beam. Dowels are assumed to be threaded bars, made of steel with yielding strength equal to fy= 649 N/mm2. The connection becomes effective thanks to high strength mortar injected in the holes, and, in the former solution (dowels passing through), thanks to nuts and washers which fix the dowel on the top of the beam surface (Fig. 3). A neoprene bearing is placed between beam and column, in order to better spread the vertical load: it is 1 cm thick, large as the beam base, while in beam axis direction it is placed from the column edge for a length such that the two dowels are placed in its middle. Neoprene bearings are verified according to Italian practice (CNR10018 1989). The beam base width is equal to 25 cm in the case of SS geometry, 50 cm for LS geometry.

Beam-to-column connection details for SS building in AQ, soil C: a horizontal view, b vertical view (measures in cm)
With reference to a typical connection layout (Fig. 3), it is assumed that the beam end is supported by almost half (minus 1 cm) column cross section, and the vertical dowels are symmetric with respect to the beam longitudinal axis, with a minimum distance between them provided according to CEN (2004).
For each connection, two different c/D ratios are investigated, \(c/D \cong 8\) and \(c/D \cong 4\), where c is the dowel cover in the column along the beam axis direction, and D is the dowel (nominal) diameter (Fig. 3). According to Vintzeleou and Tassios (1987) the former ratio leads to a connection shear failure involving the simultaneous dowel yielding and concrete crushing, the latter ratio leads to a failure depending on the concrete splitting.
Beam-to-column connections are designed according to Italian building code (D. M. 14/01/2008 2008) and practice (CNR10025/84 1985). Design forces are the maxima provided by all the design combinations, where seismic actions are computed according to the capacity design rules, i.e. as the minimum between the column base resisting moment/column height ratio by the factor γRd= 1.20 and the value given by the seismic analysis assuming the behavior factor q = 1. According to the design practice, for each building, the maximum shear force in all the connections, provided by all the design combinations, is assumed as connection design force, for both the horizontal directions. Then only one beam-to-column connection is designed. According to CNR10025/84 (1985), if the eccentricity of the shear force (equal to half of the neoprene bearing thickness (Magliulo et al. 2014a)) is lower than half of the dowel diameter, connection design shear strength is equal to:
where n = 2 is the number of dowels, α = 1.6 is a coefficient taking into account the confinement provided by the beam-column mutual pressure, db is the dowel resistant diameter, fyd= fy/γS= 564 N/mm2 is the steel design yielding strength and fcd = αccfck/γc= 25.87 N/mm2 is the concrete design strength. Dowels are embedded in concrete for a length eight times their diameter (hd, in the following). Italian code and guidelines, as well as Eurocodes, do not give any provision regarding the c/D ratio. Stirrups at the connection (Fig. 3) are computed according to Italian practice (CNR10025/84 1985), i.e. considering horizontal forces given by vertical pressure and horizontal actions: they are placed in beams and columns for a maximum depth not larger than the embedment of the dowels. Dowel nominal diameter (D) and resistant one (db), along with stirrups number at each connection side, diameter and step (St) are reported in Table 4 for each building: stirrups at the beam side are equal to the stirrups at the column side, because they mainly depend on connection shear force. It is noteworthy that connection design actions are seismic actions unless in case of very low intensity level seismic prone zones (MI), for soil type A, as indicated by (W) in Table 4.
The shear capacity of the designed connections, considering X and Z direction, is evaluated according to available formulae, also published in recent studies performed within European projects. They can be grouped in two main families: the first one includes formulae assuming the connection ductile failure due to yielding of the steel dowels and crushing of the surrounding concrete (mode I in Vintzeleou and Tassios 1987); the second one includes formulae assuming the connection brittle failure due to the concrete cracking and the cover splitting (mode II in Vintzeleou and Tassios 1987). Given the beam and column cross sections and the two assumed layouts, depending on the c/D ratio of the designed connection, ductile or brittle failure can be activated at the connection beam-side and column-side. When the available c/D ratio is not able to ensure failure mode I, the contribution of transversal reinforcement in the connection zone is taken into account, according to Zoubek et al. (2015). At each connection side and for each horizontal direction (X, Z), the capacity can be assumed as the minimum value between the shear strength corresponding to ductile and brittle failure (Eq. (2)). Then, the connection capacity in each direction can be assumed as the minimum value between the capacity at the beam-side and at the column-side (Eq. (3)).
The applied shear strength formulae do not take into account the favorable action of the fork in providing confinement at the beam side. However, in Sect. 5, two different conditions will be analyzed: (i) possible failure at both beam and column sides, that represents the case in which the fork is not able to contribute to the connection shear strength; (ii) possible failure on column-side only, taking into account the fork favorable action on the beam side, which reduces the concrete cracking and, then, the connection brittle failure at beam-side. Furthermore, the shear capacity of the connections neglects the contribution of the friction action, which can be relevant mainly when the connection shows a large beam-to column contact surface. This simplifying assumption is supported by the following motivations: (i) it largely simplifies the nonlinear modelling of the structure; (ii) friction action is generally much lower than the dowel connection strength, then, if the latter is exceeded, the contribution of the friction action is generally little; (iii) the contribution of the friction strength is related to the beam-to-column contact surface, which is generally little in the case of little cover (\(c/D \cong 4\)); (iv) high uncertainties affect the value of the friction action when the connection fails, considering that the connection failure involves the beam-to-column contact surface.
3.3.1 Ductile failure
In this section, capacity along both the directions of the designed connections is computed according to available formulae assuming a connection ductile failure, because a connection layout with \(c/D \cong 8\) is considered. In the following, fy and fu represent the mean values of yielding and ultimate strength of the steel dowels, fy= 816 N/mm2 and fu= 913 N/mm2 (Magliulo et al. 2014a) respectively, fc represents the concrete mean compression strength (fc= 59.75 N/mm2) and n is the number of steel dowels (i.e. two dowels for each connection).
According to the selected literature formulae for ductile failures, connection shear strength does not depend on the considered direction. Moreover, considering that beam and column have the same mean values of concrete and steel mechanical properties, the same shear strength results at beam- and column-side.
Experimental studies performed by Vintzeleou and Tassios (Vintzeleou and Tassios 1986, 1987) provided the connection shear strength under monotonic and cyclic loads (Eqs. (4) and (5)).
Other possible contemporary effects on the dowel are taken into account by the SAFECAST guidelines formula (Eq. (6)) (Psycharis and Mouzakis 2012b; SAFECAST 2012) through the coefficient \(\alpha = {\sigma \mathord{\left/{\vphantom {\sigma {f_{y}}}} \right. \kern-0pt} {f_{y}}}\), where σ is the normal tensile stress acting on dowels. If the rotation of the joint is prevented by the stiffness of the connected elements, which is not the case analyzed in this study, the numerical coefficient (0.9) can be taken equal to 1.0.
As the resistance to shear loads is concerned, EOTA provisions for design of bonded anchors in concrete (TR029 2007; TR045 2013) assume different modes of failure: steel failure is considered in this section, according to Eqs. (7) and (8), where As is the dowel cross section area, αgap= 1.0 in case of no hole clearance between anchor and fixture and αseism= 0.85 is the reduction factor to take into account the influence of large cracks in case of anchor group.
Figure 4 shows the connection shear strength values computed according to Eqs. (1), (4), (5), (6), (7) and (8), for the cases AQ, soil type C, geometries SS and LS. The design shear force values are also reported, with horizontal dot-dashed and dashed line, for SS and LS geometry respectively.

Connection shear strength for ductile failure mode, cases AQ soil C, SS and LS
It can be seen that, in the case of ductile failure mode:
-
the shear strength values computed according to CNR10025/84 (1985) (Eq. (1)) are higher than the design shear values, because of the difference between design and mean mechanical properties values; the difference between the SS and LS geometries is related to the different dowel diameters (Table 4);
-
Vintzeleou and Tassios (1987) provide large connection shear capacity when monotonic load is considered (Eq. (4)), while a reduction to half assumed for cyclic loads (Eq. (5)) seems too conservative considering recent tests on dowel connections (Magliulo et al. 2015a);
-
TR029 (2007) (Eq. (7)) and TR045 (2013) (Eq. (8)) formulae show high shear strength values, but they do not take into account the concrete crushing around the dowels, only considering the dowel shear failure;
-
neglecting the connection shear strength provided by Vintzeleou and Tassios (1987) for cyclic actions (Eq. (5)), which is too conservative, the minimum shear strength is provided by SAFECAST (2012) (Eq. (6)), which in this study is assumed to be the connection shear strength for ductile failure mode;
-
the assumed connection shear strength values (Eq. (6)), for both the SS and LS buildings, are larger than the design values, i.e. satisfy the code minimum strength requirements.
3.3.2 Brittle failure
When connection brittle failure for concrete splitting is expected, i.e. \(c/D \cong 4\), in addition to the already described parameters, the available formulae depend on \(f_{ctm} = 0.30 \cdot f_{ck}^{2/3} = 3.83\;{\text{N/mm}}^{2}\) (CEN 2004; D. M. 14/01/2008 2008), which is the mean tensile strength for concrete, and c, which is the bottom concrete cover.
According to experimental and numerical investigations provided by Vintzeleou and Tassios (1986, 1987), connection shear strength values which refer to concrete cover splitting in the direction of the shear force (i.e. bottom cover splitting) and in the orthogonal direction (i.e. side cover splitting) are provided by Eqs. (9) and (10), respectively, where bct is the net width of the element, i.e. the width subtracting the dowel diameters.
In SAFECAST (2012), the connection shear strength (Eq. (11)) also depends on the effective embedment of the dowels (hd in Eqs. (11) and (12)), on the presence of edge reinforcement (ψre = 1 is assumed, because there is not specific reinforcement limiting concrete cover splitting), and on the side splitting [using the coefficient k (Eq. (14)), which depends on the ratio between the concrete element width b and the concrete bottom cover).
TR029 (2007) and TR045 (2013) provide the connection shear strength value due to the concrete edge failure through Eqs. (15) and (16), under monotonic and cyclic loads, respectively. In Eq. (15), k1 is equal to 2.4 for applications in non-cracked concrete, \(A_{c,V}\), \(A_{c,V}^{0}\) and ψs,V are obtained according to TR029 (2007).
The connection shear strength formulae presented above, taking into account the concrete brittle failure, neglect the activation of the transversal reinforcement generally placed at the column top and beam end against horizontal forces given by vertical pressure and horizontal actions (Fig. 3b). In this study their contribution (\(V_{R}^{Zoubek}\)) is considered according to Zoubek et al. (2015), where fsy is assumed to be the mean yielding stress of the transversal reinforcement (fsy = 490 N/mm2), e1 and e2 are the distances of the dowels from the two stirrup legs parallel to the shear force, and α is the angle shown in Fig. 5, which is αx or αz if the shear strength is evaluated in X or in Z direction, respectively.

Layout of the beam-to-column dowel connection (L’Aquila, soil C): a SS building and b LS building
Figures 6 and 7 show the connection shear strength values along X and Z direction, respectively, computed according to the presented formulae for brittle failures at column- (col subscript) and beam-side (beam subscript), for buildings SS and LS, at L’Aquila, soil type C. In Z direction (Fig. 7) the strength provided by the side splitting according to Vintzeleou and Tassios (1986, 1987) Eq. (10) is not reported, considering that the parameter bct is almost equal to the longitudinal beam length, resulting in a very high strength.

Connection shear strength for brittle failure mode—X direction

Connection shear strength for brittle failure mode—Z direction
The results confirm, as expected, that in both the directions and for both the geometries the connections, characterized by a low dowel cover and designed according to Italian practice, are underdesigned, i.e. their strength is lower than the required design strength. This could be avoided providing details for connections (regarding concrete cover and transversal reinforcement arrangement) and suggesting adequate design formulae in case fragile failures are unavoidable. It is also evident that increasing the dowel diameter does not provide any beneficial effect, if a fragile failure is expected.
At column-side, the strength always depends on the cover in X direction, obviously unless in the case of Zoubek et al. (2015) formulae, always depending on transversal reinforcement. In X direction the 3 formulae (Eqs. (9), (11) and (16)) depending on bottom splitting provide similar strength, denoting a good agreement between them; on the contrary, in Z direction the 3 formulae taking into account the side splitting, i.e. Equations (10), (11) and (16), provide different strength, due to the different way of taking into account the side splitting itself: explicitly (Eq. (10)), depending on parameter k defined in Eq. (14) and depending on \(A_{c,V}/A_{c,V}^{0}\) ratio (Eq. (15)), respectively. Side splitting in X direction (Eq. (10)) and bottom splitting in Z direction show high strength, because at column-side in Z direction the dowel concrete cover is large. The contribution of the transversal reinforcement provided by Zoubek et al. (2015) formulae is larger than the contributions related to the bottom splitting (Eqs. (9), (11) and (16)) in X direction because the position of the transversal reinforcement is favorable (Fig. 5), whilst it is very low in Z direction because e1z is very large. At the column-side the difference between SS and LS geometry are low and they are mainly related to the different dowel diameter for concrete splitting and to the different transversal reinforcement in terms of geometry, step and diameter for Zoubek et al. (2015) formulae.
At beam-side it is evident the difference between SS and LS geometries, due to the different dimensions of the beam base, i.e. 25 cm for SS geometry and 50 cm for LS geometry, which is always the parameter conditioning the maximum strength for cover splitting: obviously, this type of failure will be side splitting in X direction and bottom splitting in Z direction. It is interesting to note that in both the cases, the strength formulae, above all for SS geometry, do not provide very different results, showing a quite good agreement among them. As expected, bottom splitting strength in X direction is high. The strength given by the transversal reinforcement at beam-side is very similar in X direction for SS and LS geometry, because a larger quantity of stirrups for LS geometry compensate their worse configuration; conversely, it is quite different in Z direction, where for SS geometry the lower number of stirrups and the worse configuration sum their negative effects. For these reasons, in X direction for both the building geometries the strength provided by the stirrups is significantly larger than the strength related to the side splitting, while in Z direction this statement is still true only for LS geometry; for SS geometry the strengths related to the two different failure modes are similar.
Comparing failures at beam- and column-side, in order to see what is the critical side determining the connection failure, it can be stated that for SS geometry the beam-side is always critical in Z direction, due to the lower beam base, as already observed; in X direction the beam-side side splitting shows a very low strength, but the strength based on transversal reinforcement yielding is lightly larger than at column-side, leading to a critical column-side. For LS geometry, the strengths at column- and beam-side are comparable in X direction with the strength at beam-side lightly lower both in the case of side splitting and in the case of transversal reinforcement yielding; in Z direction, even though the column-side side splitting is lightly larger than the beam-side one, the beam-side transversal reinforcement yielding is much larger than the column-side one, leading to a critical column-side.
Results commented in this section for buildings SS and LS, at L’Aquila, soil type C are summarized for all other buildings in Table 5, where the connection failure mode is reported for each direction at column-side (Col.), beam-side (Beam) and for the connection (Conn.), in this case considering the lower strength between beam-side and column-side. The following assumption is made: for each direction, at both sides, strength is related to cover splitting if the lower cover splitting strength is larger than the strength related to the transversal reinforcement yielding, otherwise strength depends on transversal reinforcement yielding (Y): in the former case, C/B means that the cover splitting is a bottom splitting, while C/S means that it is a side splitting.
Results commented for buildings SS and LS, at L’Aquila, soil type C are generally confirmed for all case studies.
In X direction, for SS geometry at column-side the strength depends on either bottom splitting or transversal reinforcement yielding, while at beam-side the strength always depends on the transversal reinforcement yielding; the lowest strength is always at column-side. For LS building generally the strength depends on the transversal reinforcement yielding both at column-side and beam-side, in few cases at column-side it depends on bottom cover splitting, at beam-side on side cover splitting; the connection failure is related in all cases to beam-side failure, unless in the case of the lowest seismic intensity site (MI), where the transversal reinforcement is reduced and the column X direction cover is smaller than the beam Z direction cover.
In Z direction the results are the same for all sites and soils of the SS buildings and for all sites and soils of the LS buildings. In the former case, at the column-side the failure is always due to the side cover splitting (because the transversal reinforcement yielding is very low), while at the beam-side it is due to the transversal reinforcement yielding (because the cover splitting strength is very low); the beam-side is always the critical one. In the case of LS buildings, again the column-side failure depends on the side cover splitting and the beam-side failure depends on the transversal reinforcement yielding; however, the connection strength depends on the column-side strength (the weakest), because (beam-side) αz significantly increases with respect to SS buildings, while the column Z direction cover lightly increases: the concrete cover is always four times the dowel diameter, which is generally lightly larger than in the case of SS buildings.
4 Seismic input
Nonlinear dynamic multi-stripe analysis (Jalayer 2003; Jalayer and Cornell 2009) are performed for the seismic assessment of the selected case studies. In particular, ten increasing intensity levels are considered, corresponding to ten increasing values of the return period. Twenty pairs of records (ground motion horizontal components) are provided for each intensity level, according to Iervolino et al. (2017). In this study, the conditional spectrum (Baker 2011; Jayaram et al. 2011; Lin et al. 2013) approach is applied for the record selection: for each intensity level, i.e. for each return period (ordered in columns of Table 6), the distribution of Sa is obtained, conditional on a given value of Sa, which is the Sa at the fundamental period of the structure (T1) resulting from the probabilistic hazard study at the base of the Italian seismic code (D. M. 14/01/2008 2008). For the selected case studies, the reference period T1 = 2 s is assumed: the Sa(T1) values, for each considered site and soil type, are reported in Table 6. A set of 20 nonlinear dynamic analyses is carried out (Ercolino et al. 2018) for each intensity level, using both the horizontal components of a suite of ground motion records: the component of the two horizontal ones having the largest PGA is assumed as the maximum horizontal component of a ground motion; the maximum horizontal components of the 20 ground motions have the same Sa(T1) either naturally or, more often, artificially via amplitude scaling (e.g. Fig. 8). The selected records were extracted from the Italian accelerometric archive (http://itaca.mi.ingv.it, (Luzi et al. 2008)) and from NGAwest2 database (http://peer.berkeley.edu/ngawest2/, (Ancheta et al. 2014)).

Maximum horizontal component for AQ, soil C—TR = 100,000 years: a accelerograms and b spectra
5 Nonlinear dynamic analysis results
Capacity computed in Sect. 3 and demand computed in Sect. 4 are compared in this section, in order to make a vulnerability analysis of the analyzed buildings: for each direction (X and Z), top displacements and shear at beam-to-column dowel connections are considered as earthquake demand parameters. Column capacity in terms of maximum top displacement for each direction is determined according to Sect. 3.2, while demand, for each direction and for each return period, is the top displacement recorded during the time history analysis. Capacity at the connection, as already written, for each direction is provided by Eqs. (2) and (3), where \(V_{R}^{ductile}\) is the minimum strength provided by Eqs. (1), (4), (6) and (8), while \(V_{R}^{brittle}\) is the minimum strength provided by Eqs. (9), (10), (11) and (16) if such a minimum is larger than the strength provided by transversal reinforcement according to Zoubek et al. (2015), otherwise Zoubek et al. (2015) formulae are assumed as \(V_{R}^{brittle}\). Demand at the connection is, for each direction and for each return period, the maximum shear value at the building beam-to-column connections recorded during the time history analysis.
Figure 9 shows the demand/capacity ratios in terms of connection shear in X and Z direction, for SS and LS geometries, in L’Aquila, soil type C, for each of the twenty earthquakes of each intensity level (w beam results, square markers). In the figure, demand/capacity ratios are also reported neglecting the failure at beam-side (w/o beam results, circle marker), for taking into account the fork favorable action, if effective. The demand/capacity ratios for all the selected twenty ground motions at each stripe are plotted versus the return periods (TR), corresponding to the stripe intensity levels.

Demand/capacity ratios in terms of connection shear strength, for L’Aquila soil C
For both the geometries and both the directions, demand is larger than capacity (D/C > 1) for some records corresponding to return periods 100 years and, obviously, for larger intensities, confirming that the analyzed buildings do not satisfy the minimum performance requirements: they are designed at life safety limit state for seismic actions having a return period equal to 475 years and should not collapse for records with return periods lower than 1000 years. For both the buildings along both the directions the performance is similar, unless for the geometry SS, Z direction: for records corresponding to the design intensity level, TR = 500 years, the maximum D/C values are lower than 3, and, at the largest intensity level, TR = 100,000 years, they are about equal to 3; the lowest intensity where D/C = 1 is observed is TR = 100 years. The geometry SS, Z direction, shows failures at beam-side for records corresponding to a very low intensity level, i.e. TR = 50 years, maximum D/C = 7 for the design intensity level and D/C larger than 8 for the largest intensity level; the low capacity of the SS geometry at the beam-side in Z direction, shown in Fig. 7, is due to the reduced thickness of the beam, which leads to a reduced cover and to a poor performance of the transversal reinforcement (Sect. 3.3).
In the following, for the sake of brevity, the beam-to-column connection failure at beam-side is not taken into account, because, for the assumed connection configuration, it is generally prevented.
In Fig. 10, demand/capacity ratios obtained considering the shear failure of the beam-to-column connections for each of the 20 earthquakes of each intensity level (connection, circle markers) are compared with the demand/capacity ratios obtained considering the collapse due to the exceedance of the maximum lateral displacement (column, square markers), in both X and Z direction, for SS and LS geometries in L’Aquila soil C. Comparison shows that, if brittle failures at the beam-to-column connections are expected due to the connection details and they are not taken into account, collapses of single-story RC precast buildings can be largely underestimated: only few collapses are recorded for very high return periods (TR = 100,000 years) if the reaching of the ultimate roof displacement is considered (Ercolino et al. 2018), while, if the connection brittle failure is taken into account, some collapses can be recorded at TR = 100 years.

Demand/capacity ratios in terms of connection shear strength (“connection”) and in terms of roof displacement (“column”), for L’Aquila soil C
Figures 11 and 12 show the median and the standard deviation of the twenty demand/capacity ratios in terms of connection maximum shear at column-side computed for each earthquake, at each intensity level, along X and Z direction respectively, for SS (circle markers) and LS (square markers) geometries, soil type A and C, at all the considered sites.

Median and standard deviation of D/C ratios in terms of connection maximum shear, X direction

Median and standard deviation of D/C ratios in terms of connection maximum shear, Z direction
Figures 11 and 12 generally confirm the interesting conclusion found taking only into account the building collapse due to the degradation of the column plastic hinges (Ercolino et al. 2018): as the site seismicity level increases, the vulnerability of the buildings (demand/capacity ratio) increases, even though each building is obviously designed according to the seismicity of the site where it is placed. This is fully confirmed in Z direction (Fig. 12), while in X direction few exceptions can be observed, as reported in the following. SS geometry, soil C, NA site, D/C median ratios are larger than AQ ones for almost all return periods; this is due to the much lower dowel diameter in NA site (M22, Table 4) than in AQ site (M30), which leads to a lower bottom cover (\(c/D \cong 4\)) in NA site than in AQ site, where transversal reinforcement provides a significant contribution (Table 5). For the same reason, SS geometry, soil C, RM D/C median ratios are larger than AQ ones for some return periods (TR = 10 years, TR = 50 years, TR = 100,000 years). SS geometry, soil A, NA D/C median ratios are larger than AQ ones at TR = 100,000 years and TR = 50 years: indeed, also in this case, NA site dowel diameter (M20) is lower than AQ site one (M22), leading to a lower bottom cover (Table 5). For the same reason, LS geometry, soil C, NA D/C median ratio (dowel diameter M27) is larger than AQ one (dowel diameter M33) at TR = 10,000 years: in the latter case transversal reinforcement provides a larger contribution than in the former case (Table 5).
Concerning the failures at column-side, in X direction (Fig. 11), the median value of the D/C ratio is larger than 1 at TR = 500 years for geometry SS, soil A site AQ, soil C sites AQ and NA, and for geometry LS soil C site AQ. Median value of the D/C larger than 1 can be observed at RM site for geometry SS at TR = 2500 years, and for geometry LS at TR = 5000 years (soil C); at MI site it can be observed for LS geometry at TR = 10,000 years and for SS geometry at TR = 100,000 years (soil C). The analysis results confirm that connection failures, i.e. involving the concrete splitting, if not taken into the design, may lead to structural collapse at earthquake intensities lower than the expected ones (e.g. TR = 500 years instead of TR = 1000 years). In Z direction (Fig. 12) the vulnerability of the connection is generally slightly lower, because the bottom cover is larger and the sensitivity of the connections to the side cover splitting, which is the cause of the failure at column-side (Table 5), is lower: the lowest intensity showing median D/C > 1 is TR = 500 years for AQ site, LS geometry, soil C, while for NA site median D/C > 1 can be observed for TR = 2500 (LS geometry, soil C), and for RM site median D/C > 1 can be observed for TR = 10,000 years (LS geometry, soil C); for MI site, median D/C ratio equal to one is never reached. Then, in Z direction, considering connection failures at column-side only, results better agree with the structural behavior expected according to the performed design.
Furthermore, it can be observed that, along the X direction, the seismic vulnerability of the SS geometry is generally higher or equal than the one of the LS geometry, above all for medium/high seismic hazard levels (i.e. AQ, NA and RM, soil A; NA and RM, soil C), because, in the latter case, connection stirrups increase the strength (Table 5); the opposite happens for the lowest seismic hazard level (i.e. MI, soil A and C). In the Z direction, the seismic vulnerability of the two geometries is similar, with the SS geometry vulnerability generally slightly smaller than the one of the LS geometry, for all the considered hazard levels, due to the occurrence of the same brittle failure mode on the column side, i.e. cover side splitting (Table 5).
Figure 13 shows the cumulative probability of failure (F(x)), for each horizontal direction, in terms of multi-stripe reference spectral acceleration (Sa(g)) at T = 2 s (Table 6), for SS and LS geometries in L’Aquila, obtained considering the connection shear capacity at column-side. The fragility curves are obtained according to Baker (2015) and Jalayer et al. (2017); median (μ) and standard deviation (σ) values are reported in Table 7.

Fragility curves for L’Aquila site obtained considering weak connection shear capacity
Comparison with the fragility curves obtained considering the lateral displacement capacity, taking into account the column plastic hinge degradation as reported in Sect. 3.2 (according to Ercolino et al. 2018) clearly shows much higher vulnerability of single-story RC precast buildings if weak connections, made according to current practice, are taken into account: at L’Aquila site, for soil A, fragility curve median Sa(T1) values are reduced of about 15 times and 10 times for SS and LS geometry, respectively; for soil C, fragility curve median Sa(T1) values are reduced of about 15 times for both the geometries. Furthermore, for reference spectral acceleration Sa(T1) = 0.5 g, the cumulative probability of failure of the analyzed single-story precast buildings, assuming very strong connections, is almost zero (Ercolino et al. 2018), while, considering weak connections which are made according to the current practice, it is almost one (Fig. 13).
The selected structural typology is supposed to have a rigid diaphragm thanks to a concrete topping. The diffused situation without perfectly rigid diaphragm, e.g. without concrete topping and other cover effective constraints, could add load to the dowel connections (Dal Lago and Ferrara 2018) and thus even increase the computed fragility.
6 Conclusions
The study presented in this paper aims to determine the attainment of the collapse limit state of single-story RC precast buildings considering two main failure modes: (1) column failure, related to a large degradation of column base plastic hinge, which is evaluated in terms of maximum top displacements; (2) beam-to-column dowel connection failure, which is related to the reaching of its maximum strength, evaluated at beam- and column-side and considering, according to the current practice, two connection configurations: large dowel concrete cover, i.e. cover/dowel diameter ratio equal to 8, and poor dowel cover, i.e. cover/dowel diameter ratio equal to 4. Building performance is also reported excluding the connection failure at the beam-side, for taking into account the fork favorable action, if effective.
Sixteen single-story RC precast buildings, designed according to European seismic codes and practice, are analyzed. Beam-to column connections are also designed according to the current Italian and European seismic code provisions and practice: it is noteworthy that, while the column design of the analyzed buildings in medium and low seismicity zones depends on the wind load combination, all the connections, unless in the case of very low seismicity level for rigid soil, are designed according to the seismic capacity design.
Analyzing the available formulae providing beam-to-column dowel connection shear strength, the following conclusions can be drawn.
-
Formulae assuming local ductile connection failure (cover/dowel diameter ratio equal to 8), provide a connection strength larger than the minimum strength required by the seismic codes; the reduction coefficient equal to 0.5 assumed by Vintzeleou and Tassios for cyclic loads seems too conservative, while EOTA formulae provide a large strength, because they do not take into account the concrete crushing around dowels.
-
Available formulae for bottom cover splitting failure provide similar strength: this increases their reliability; the opposite happens for side cover splitting available formulae.
-
Connections with a low value of dowel cover, i.e. equal to 4 times the dowel diameter, and designed according to the spread practice, are underdesigned, i.e. their strength is lower than the required design strength, which is computed according to the capacity design.
-
Connection transversal reinforcement can significantly increase the connection strength, when the connection layout is characterized by low values of the dowel concrete cover.
Demand/capacity ratios in terms of top maximum displacement and connection strength are reported, in order to show the reaching of the collapse limit state, where the demand is provided by multi-stripe analysis. The following conclusions can be drawn.
-
Comparing fragility curves, in terms of multi-stripe reference spectral acceleration values Sa(T1), of single-story RC precast buildings with strong beam-to column connections (dowel covers equal to 8 times the dowel diameter) to fragility curves of the same buildings with weak beam-to-column connections, which can be found in the current European practice (dowel covers equal to 4 times the dowel diameter), it can be seen that: in the latter case median Sa(T1) values are lower up to 15 times; for Sa(T1) = 0.5 g, the cumulative probability of failure in the former case is almost zero, in the latter case is almost one. This outcome of the nonlinear analyses collides with the recent post-earthquake observations in Italy, e.g. after the 2009 L’Aquila earthquake, where a few dowel connection failures were reported, despite the strong PGAs recorded. This mismatch was generally due to the good practice, providing, despite the discussed code gap, adequate concrete covers and transversal reinforcement at the dowel connections.
-
In high seismicity zones, the strength provided at column-side by dowel connections in case of low dowel covers, like covers equal to 4 times the dowel diameter, leads to high demand/capacity ratios for earthquake intensities corresponding to design levels. For this reason, seismic design codes and guidelines should provide details leading to a local, ductile, connection collapse, which shows an acceptable strength: suitable details are dowel covers equal or larger than 8 times the dowel diameter, well anchored steel hooks restraining the dowels, and external steel wrapping or plates confining the connection zone.
-
Low beam base thickness leads to demand/capacity ratios larger than one even for very low seismic intensities (in Italy corresponding to return periods equal to 50y), if connection layouts are made of little dowel covers, and restraining systems, like effective column top fork, are not provided.
References
Adam C, Jäger C (2012) Simplified collapse capacity assessment of earthquake excited regular frame structures vulnerable to P-delta. Eng Struct 44:159–173
Ancheta TD et al (2014) NGA-West2 database. Earthq Spectra 30:989–1005. https://doi.org/10.1193/070913eqs197m
Arslan M, Korkmaz H, Gulay F (2006) Damage and failure pattern of prefabricated structures after major earthquakes in Turkey and shortfalls of the Turkish Earthquake code. Eng Fail Anal 13:537–557
Babič A, Dolšek M (2016) Seismic fragility functions of industrial precast building classes. Eng Struct 118:357–370
Baker JW (2011) Conditional mean spectrum: tool for ground-motion selection. J Struct Eng 137:322–331. https://doi.org/10.1061/(asce)st.1943-541x.0000215
Baker JW (2015) Efficient analytical fragility function fitting using dynamic structural analysis. Earthq Spectra 31:579–599
Beilic D, Casotto C, Nascimbene R, Cicola D, Rodrigues D (2017) Seismic fragility curves of single storey RC precast structures by comparing different Italian codes. Earthq Struct 12:359–374
Belleri A, Torquati M, Riva P (2013) Seismic performance of ductile connections between precast beams and roof elements. Mag Concr Res 66:553–562
Belleri A, Brunesi E, Nascimbene R, Pagani M, Riva P (2015) Seismic performance of precast industrial facilities following major earthquakes in the Italian territory. J Perform Constr Facil 29:04014135. https://doi.org/10.1061/(asce)cf.1943-5509.0000617
Belleri A, Marini A, Riva P, Nascimbene R (2017) Dissipating and re-centring devices for portal-frame precast structures. Eng Struct 150:736–745
Bellotti D et al (2014) Single-storey precast buildings: probabilistic distribution of structural systems and subsystems from the sixties. Progettazione Sismica 5:41–70
Biondini F, Toniolo G (2009) Probabilistic calibration and experimental validation of the seismic design criteria for one-story concrete frames. J Earthq Eng 13:426–462
Casotto C, Silva V, Crowley H, Nascimbene R, Pinho R (2015) Seismic fragility of Italian RC precast industrial structures. Eng Struct 94:122–136. https://doi.org/10.1016/j.engstruct.2015.02.034
CEN (2002) Eurocode 0—basis of structural design—EN 1990:2002. Belgium, Brussels
CEN (2004) Eurocode 2—design of concrete structures—EN 1992. Brussels, Belgium
CEN (2005) Eurocode 8—design of structures for earthquake resistance - EN 1998-1. Belgium, Brussels
Clementi F, Scalbi A, Lenci S (2016) Seismic performance of precast reinforced concrete buildings with dowel pin connections. J Build Eng 7:224–238
CNR10018 (1989) Apparecchi di appoggio per le costruzioni. Istruzioni per l’impiego, vol 190. Bollettino Ufficiale del CNR (in Italian)
CNR10025/84 (1985) Istruzioni per il progetto, l’esecuzione ed il controllo delle strutture prefabbricate in conglomerato cementizio e per le strutture construite con sistemi industrializzati, vol 107. Bollettino Ufficiale del CNR (in Italian)
D. M. 14/01/2008 (2008) Norme Tecniche per le Costruzioni. G.U. n. 29 4 febbraio 2008 (in Italian)
D. M. 17/01/2018 (2018) Aggiornamento delle “Norme Tecniche per le Costruzioni”. G.U. n. 42 20 febbraio 2018 (in Italian)
Dal Lago B, Ferrara L (2018) Efficacy of roof-to-beam mechanical connections on the diaphragm behaviour of precast decks with spaced roof elements. Eng Struct 176:681–696
Dal Lago B, Toniolo G, Felicetti R, Lamperti Tornaghi M (2017) End support connection of precast roof elements by bolted steel angles. Struct Concr 18:755–767
Demartino C, Monti G, Vanzi I (2017a) Seismic loss-of-support conditions of frictional beam-to-column connections. Struct Eng Mech 61:527–538
Demartino C, Vanzi I, Monti G, Sulpizio C (2017b) Precast industrial buildings in Southern Europe: loss of support at frictional beam-to-column connections under seismic actions. Bull Earthq Eng 16:259–264
Ercolino M, Magliulo G, Manfredi G (2016) Failure of a precast RC building due to Emilia-Romagna earthquakes. Eng Struct 118:262–273. https://doi.org/10.1016/j.engstruct.2016.03.054
Ercolino M, Magliulo G, Manfredi G (2018) Seismic performance of single-story precast buildings: effect of cladding panels. J Struct Eng 144:04018134
Ercolino M, Bellotti D, Magliulo G, Nascimbene R (2018) Vulnerability analysis of industrial RC precast buildings designed according to modern seismic codes. Eng Struct 158:67–78
Faggiano B, Iervolino I, Magliulo G, Manfredi G, Vanzi I (2009) Post-event analysis of industrial structures behavior during L’Aquila earthquake. Progettazione Sismica (English Special Edition) 0:203–208
Fardis MN, Biskinis D (2003) Deformation capacity of RC members, as controlled by flexure or shear. University of Tokyo
Fischinger M, Kramar M, Isaković T (2008) Cyclic response of slender RC columns typical of precast industrial buildings. Bull Earthq Eng 6:519–534. https://doi.org/10.1007/s10518-008-9064-7
Fischinger M, Zoubek B, Isaković T (2014) Seismic response of precast industrial buildings. In: Perspectives on European earthquake engineering and seismology. Springer, pp 131–177
Ghosh S, Cleland N (2012) Observations from the February 27, 2010, earthquake in Chile. PCI J 57
Haselton C (2006) Assessing seismic collapse safety of modern reinforced concrete moment-frame buildings. Department of Civil Engineering California State University, Chico
Ibarra LF, Medina RA, Krawinkler H (2005) Hysteretic models that incorporate strength and stiffness deterioration. Earthq Eng Struct Dyn 34:1489–1511. https://doi.org/10.1002/eqe.495
Iervolino I, Spillatura A, Bazzurro P (2017) RINTC project: assessing the (implicit) seismic risk of code-conforming structures in Italy. In: COMPDYN 2017 6th ECCOMAS thematic conference on computational methods in structural dynamics and earthquake engineering
Jäger C, Adam C (2013) Influence of collapse definition and near-field effects on collapse capacity spectra. J Earthq Eng 17:859–878
Jalayer F (2003) Direct probabilistic seismic analysis: implementing non-linear dynamic assessments. Ph.D. Dissertation, Stanford University
Jalayer F, Cornell C (2009) Alternative non-linear demand estimation methods for probability-based seismic assessments. Earthq Eng Struct Dyn 38:951–972
Jalayer F, Ebrahimian H, Miano A, Manfredi G, Sezen H (2017) Analytical fragility assessment using unscaled ground motion records. Earthq Eng Struct Dyn 46:2639–2663. https://doi.org/10.1002/eqe.2922
Jayaram N, Lin T, Baker JW (2011) A computationally efficient ground-motion selection algorithm for matching a target response spectrum mean and variance. Earthq Spectra 27:797–815. https://doi.org/10.1193/1.3608002
Kramar M, Isakovic T, Fischinger M (2010) Seismic collapse risk of precast industrial buildings with strong connections. Earthq Eng Struct Dyn 39:847–868. https://doi.org/10.1002/eqe.970
Liberatore L, Sorrentino L, Liberatore D, Decanini LD (2013) Failure of industrial structures induced by the Emilia (Italy) 2012 earthquakes. Eng Fail Anal 34:629–647
Lin T, Haselton CB, Baker JW (2013) Conditional spectrum-based ground motion selection. Part I: hazard consistency for risk-based assessments. Earthq Eng Struct Dyn 42:1847–1865. https://doi.org/10.1002/eqe.2301
Luzi L, Hailemikael S, Bindi D, Pacor F, Mele F, Sabetta F (2008) ITACA (ITalian ACcelerometric Archive): a web portal for the dissemination of Italian strong-motion data. Seismol Res Lett 79:716–722. https://doi.org/10.1785/gssrl.79.5.716
Magliulo G, Fabbrocino G, Manfredi G (2008) Seismic assessment of existing precast industrial buildings using static and dynamic nonlinear analyses. Eng Struct 30:2580–2588. https://doi.org/10.1016/j.engstruct.2008.02.003
Magliulo G, Ercolino M, Cimmino M, Capozzi V, Manfredi G (2014a) FEM analysis of the strength of RC beam-to-column dowel connections under monotonic actions. Const Build Mater 69:271–284. https://doi.org/10.1016/j.conbuildmat.2014.07.036
Magliulo G, Ercolino M, Petrone C, Coppola O, Manfredi G (2014b) Emilia earthquake: the seismic performance of precast RC buildings. Earthq Spectra 30:891–912. https://doi.org/10.1193/091012eqs285m
Magliulo G, Ercolino M, Cimmino M, Capozzi V, Manfredi G (2015a) Cyclic shear test on a dowel beam-column connection of precast buildings. Earth Struct 9:541–562
Magliulo G, Ercolino M, Manfredi G (2015b) Influence of cladding panels on the first period of one-story precast buildings. Bull Earthq Eng 13:1531–1555. https://doi.org/10.1007/s10518-014-9657-2
Magliulo G, Cimmino M, Ercolino M, Manfredi G (2017) Cyclic shear tests on RC precast beam-to-column connections retrofitted with a three-hinged steel device. Bull Earthq Eng 15:3797–3817. https://doi.org/10.1007/s10518-017-0114-x
Magliulo G, Bellotti D, Cimmino M, Nascimbene R (2018) Modeling and seismic response analysis of RC precast Italian code-conforming buildings. J Earthq Eng 22:140–167
McKenna F, Fenves GL (2013) OpenSees manual. http://opensees.berkeley.edu. Pacific Earthquake Engineering Research Center. Accessed 27 Feb 2013
Mwafy A, Elnashai A (2001) Static pushover versus dynamic collapse analysis of RC buildings. Eng Struct 23:407–424
Negro P, Tornaghi ML (2017) Seismic response of precast structures with vertical cladding panels: the SAFECLADDING experimental campaign. Eng Struct 132:205–228
Ozden S, Akpinar E, Erdogan H, Atalay H (2014) Performance of precast concrete structures in October 2011 Van earthquake, Turkey. Mag Concr Res 66:543–552
Palanci M, Senel SM, Kalkan A (2017) Assessment of one story existing precast industrial buildings in Turkey based on fragility curves. Bull Earthq Eng 15:271–289
Pierdicca A, Clementi F, Maracci D, Isidori D, Lenci S (2016) Damage detection in a precast structure subjected to an earthquake: a numerical approach. Eng Struct 127:447–458
Psycharis IN, Mouzakis HP (2012a) Assessment of the seismic design of precast frames with pinned connections from shaking table tests. Bull Earthq Eng 10:1795–1817. https://doi.org/10.1007/s10518-012-9372-9
Psycharis IN, Mouzakis HP (2012b) Shear resistance of pinned connections of precast members to monotonic and cyclic loading. Eng Struct 41:413–427. https://doi.org/10.1016/j.engstruct.2012.03.051
Raghunandan M, Liel AB (2013) Effect of ground motion duration on earthquake-induced structural collapse. Struct Saf 41:119–133
SAFECAST (2012) Design guidelines for connections of precast structures under seismic actions. Luxembourg. https://doi.org/10.2777/37605
Savoia M, Buratti N, Vincenzi L (2017) Damage and collapses in industrial precast buildings after the 2012 Emilia earthquake. Eng Struct 137:162–180
Sousa R, Batalha N, Rodrigues H (2020) Numerical simulation of beam-to-column connections in precast reinforced concrete buildings using fibre-based frame models. Eng Struct 203:109845
Titi A, Biondini F, Toniolo G (2018) Seismic assessment of existing precast structures with dry-friction beam-to-column joints. Bull Earthq Eng 16:2067–2086
Toniolo G, Dal Lago B (2017) Conceptual design and full-scale experimentation of cladding panel connection systems of precast buildings. Earthq Eng Struct Dyn 46:2565–2586
TR029 (2007) Design of Bonded Anchors. EOTA
TR045 (2013) Design of metal anchors for use in concrete under seismic actions. EOTA
Vamvatsikos D, Cornell CA (2002) Incremental dynamic analysis. Earthq Eng Struct Dyn 31:491–514. https://doi.org/10.1002/eqe.141
Vintzeleou EN, Tassios TP (1986) Mathematical-models for dowel action under monotonic and cyclic conditions. Mag Concr Res 38:13–22
Vintzeleou EN, Tassios TP (1987) Behavior of dowels under cyclic deformations. ACI Struct J 84:18–30
Workgroup R (2017) Research Project DPC-ReLUIS/EUCENTRE 2014–2018 technical report and deliverables. ReLUIS, Naples, Italy
Zoubek B, Isakovic T, Fahjan Y, Fischinger M (2013) Cyclic failure analysis of the beam-to-column dowel connections in precast industrial buildings. Eng Struct 52:179–191. https://doi.org/10.1016/j.engstruct.2013.02.028
Zoubek B, Fischinger M, Isakovic T (2015) Estimation of the cyclic capacity of beam-to-column dowel connections in precast industrial buildings. Bull Earthq Eng 13:2145–2168
Acknowledgements
This research study has been funded by the Italian Department of Civil Protection, in the framework of the national project DPC-ReLUIS-EUCENTRE RINTC 2017–2019. The contribution of Marianna Ercolino, Roberto Nascimbene and Davide Bellotti for interesting discussions is gratefully acknowledged.
Funding
Open access funding provided by Università degli Studi di Napoli Federico II within the CRUI-CARE Agreement.
Author information
Authors and Affiliations
Corresponding author
Additional information
Publisher's Note
Springer Nature remains neutral with regard to jurisdictional claims in published maps and institutional affiliations.
Rights and permissions
Open Access This article is licensed under a Creative Commons Attribution 4.0 International License, which permits use, sharing, adaptation, distribution and reproduction in any medium or format, as long as you give appropriate credit to the original author(s) and the source, provide a link to the Creative Commons licence, and indicate if changes were made. The images or other third party material in this article are included in the article's Creative Commons licence, unless indicated otherwise in a credit line to the material. If material is not included in the article's Creative Commons licence and your intended use is not permitted by statutory regulation or exceeds the permitted use, you will need to obtain permission directly from the copyright holder. To view a copy of this licence, visit http://creativecommons.org/licenses/by/4.0/.
About this article

Cite this article
Cimmino, M., Magliulo, G. & Manfredi, G. Seismic collapse assessment of new European single-story RC precast buildings with weak connections. Bull Earthquake Eng 18, 6661–6686 (2020). https://doi.org/10.1007/s10518-020-00952-7
Received:
Accepted:
Published:
Issue Date:
DOI: https://doi.org/10.1007/s10518-020-00952-7