

Abstract
Present work explores graphene-coated vanadium pentoxide (G-V2O5) as novel electrosorption material for the desalination of low molarity saline/brackish water. During the desalination cycles, along with the electrical double layer formation at the graphene layer, ion intercalation is observed in the honeycomb structure of the hydrothermally grown V2O5 layer leading to an improvement in Na+ and Cl− ion removal from the brackish water. The conventional capacitance tests by pairing G-V2O5 electrodes in a three-electrode cell shows a remarkable capacitance value of 500 F g−1, and the capacitive deionization process over 50 cycles at 5, 10 and 15 mM concentration (NaCl) gives a maximum salt adsorption capacity of 12.5 mg of NaCl per gram of electrode. Utilizing the faradaic and non-faradaic process for electrosorption desalination paves a way towards exploring alternative materials and their hybrids for water purification applications.
Export citation and abstract BibTeX RIS
1. Introduction
Clean water is a key technological, social, and economic challenge facing the 21st Century [1, 2]. Climate change associated with an increase in population has intensified the pressure on existing water resources [3]. According to the medium- variant projection of the United Nations, "global population could grow from 7.7 billion in 2019 to around 8.5 billion in 2030, 9.7 billion in 2050 and 10.9 billion in 2100 (World Population Prospects 2019 Highlights, eISBN: 978–92-1-004235-2). A water scarcity associated with an increase in global population growth could be catastrophic in the coming years. Depleting usable water supply has turned the human race into exploring other resources such as desalination of brackish water to meet the demand for water. The water-starved areas could find new sources by removing salt from sources such as brackish water that has much lower salinity than saltwater. Qualitatively, brackish water has a salinity that falls between fresh and seawater [4] and quantitatively fresh, brackish, and saline waters contain <0.5, 0.5 to 30, and >30 ppt (parts per thousand) salt respectively [5].
Desalination is the removal of salt ions from saltwater. Traditional methods of desalination technologies include multistage flash (MSF), reverse osmosis (RO), multistep distillation, and electro-deionization [6]. Other emerging innovative solutions include nonporous graphene [7], graphene oxide [8], BN and MoS2 membranes [9, 10], electrodialysis [11], RO that uses graphene grafted antifouling membranes [12] and capacitive deionization (CDI). CDI is an energy and cost-efficient technology for removing low amounts of salt from water [6, 9, 13–16]. CDI focuses on removing small amounts of salt ions (minority compounds) from the water, making it more energy-efficient at low salinities because it removes salt from the water, and the energy consumption is proportional to the amount of salt removed [17]. Although CDI falls into an energy-efficient technique category, the energy requirement in CDI is a strong function of the concentration of salt ions in the feed, unlike a weak relationship observed in other desalination techniques such as RO and MSF [6]. Traditionally, CDI uses high surface area conductive electrodes capable of adsorbing the ions through an electrical field during charging, and ions are retained at an electrical double layer at electrodes surface [18, 19]. During discharge, the ions can be released back into the solution resulting in a brine solution. A portion of the stored energy is recovered as electrical energy, reducing the net energy [20, 21]. High adsorption capacity is a preferred characteristic, and to achieve that, conventionally an active material with high surface area is utilized [22]. Carbon-based materials are of interest for CDI due to its high surface area and low fabrication cost [23] Using electrodes facilitating intercalation of ions in the same potential window of desalination could improve the efficiency of desalination to a greater extent [14]. The amount of energy required for desalination could be decreased by using an electrode that can form both an electric double layer as well as intercalation of ions leading to pseudocapacitance at a low potential window.
Vanadium pentoxide (V2O5), with its various coordination numbers and oxidation states, is a promising material for hosting large ions such as sodium [24]. Herein, we report graphene-coated vanadium pentoxide on stainless steel (SS) mesh as an electrode for capacitive desalination, which removes salt through the faradaic and non-faradaic processes. But the application of V2O5 as a CDI electrode is hindered by the fade in capacity [25, 26] due to low active surface area and electronic and ionic conductivities. To overcome these issues, our work is directed towards creating a high surface area binder-free electrode made of V2O5 and later coated with graphene to enhance the electronic conductivity.
2. Results and discussion
2.1. Structural and surface morphology
The sample preparation protocol, including hydrothermal cell and chemical vapor deposition (CVD) setup, is graphically represented in figure 1. Later the x-ray diffraction (XRD) spectra of the V2O5 powder, as-grown V2O5 honeycomb (V2O5-SS mesh), and graphene-coated (G-V2O5-SS mesh) structures are depicted in figure 2(a). Signature diffraction peaks corresponding to (110), (301), (310), (020) diffraction planes are omnipresent in all the three samples [27]. This observation implies the structural integrity of the V2O5 structure in all the three samples where the heat treatment during graphene coating hardly harms the honeycomb-like V2O5 structure. In addition to pristine V2O5 diffraction peaks, the graphene-coated V2O5 (G-V2O5)sample shows a feeble diffraction peak centered at 23° and a shoulder by strong peak at 43°, thus proving the presence of graphene coating [28] on V2O5 structure. Intense peaks at 45° and around 83° corresponds to the SS substrate.
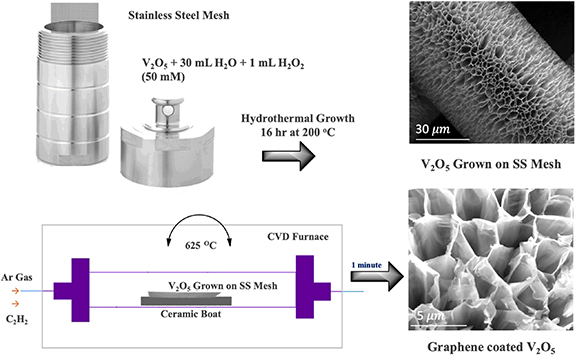
Figure 1. Preparation protocol: a hydrothermal process achieves the growth of V2O5 on SS mech, and later the coating of a few layers of graphene is accomplished by chemical vapor deposition. The surface morphology at each step is displayed on the right.
Download figure:
Standard image High-resolution image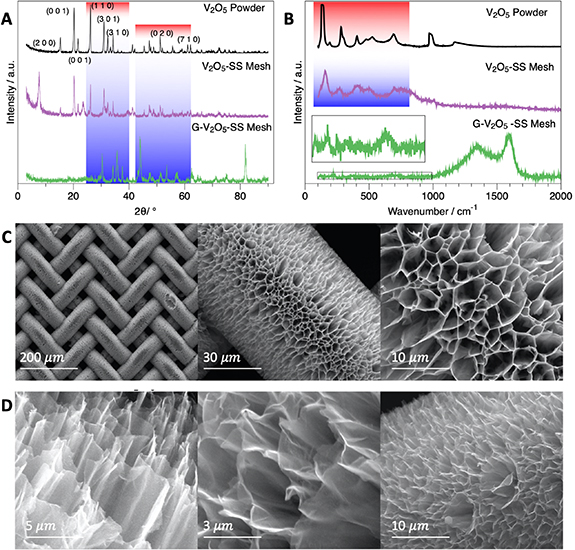
Figure 2. (a) x-ray diffraction (XRD) patterns of the V2O5 powder, V2O5 grown on stainless steel mesh and V2O5 grown on SS and coated with graphene (b) Raman peaks of V2O5 powder, V2O5 grown on SS and V2O5 grown on SS mesh and coated with graphene (c) SEM images of V2O5 grown on SS mesh at different magnifications. Hollow cylinders like morphology are very clear, offering a very high surface area. (d) Graphene coated on top of the V2O5 hollow cylinders. The conductivity of the material is quite improved from 0.001–0.01 S cm−1 to 0.05 S cm−1 with the graphene coating.
Download figure:
Standard image High-resolution imageRaman spectra of V2O5 powder, V2O5 grown on SS mesh, and G-V2O5 on SS mesh is presented in figure 2(b). Raman modes present in the V2O5 structures such as 149 cm−1(B1 g), 310 cm−1(Ag), 403 cm−1(Ag), 532 cm−1(Ag), 700 cm−1(B1 g) and 983 cm−1(B3 g) are observed in all the three samples [29]. The characteristic D-band and G-band of thin graphite-like structures are seen at 1348 and 1592 cm−1 respectively, and two-dimensional band at 2650 2 cm−1 that corresponds to a few layers' graphene (see figure S1 (available at stacks.iop.org/2DM/7/045025/mmedia)) is also visible for the G-V2O5 sample. In short, the XRD and Raman spectra validated the structure of grown V2O5 and G-V2O5. High-magnification SEM images of the V2O5 grown on SS mesh are shown in figure 2(c). The SEM images show a uniform honeycomb-like structure that grew vertically from the surface of each strand of the SS mesh. The SEM images in figure 2(d) show graphene covering the V2O5 structure grown on SS mesh. The coating of graphene improves the conductivity of the active material.
The transmission electron microscopy (TEM) results of the samples before (figure 3(b)) and after (figure 3(c)) desalination process is summarized in figure 3. The entire structure of V2O5 coated in graphene before desalination is shown in figure 3(b) (larger image). The following two images in figure 3(b) are the clear identification of the respective constituents: the upper image is V2O5, and the lower image is graphene. The particle embedded in graphene is a single crystal, and the respective d-spacing for both agrees with the phases. A similar set of images presented in figure 3(c) is taken after the adsorption desalination process. It is essential to elucidate that following the adsorption desalination process, the V2O5 is no longer a single crystal, but rather poly-crystals with a large number of defects. In the graphene, areas are sections with d-spacing of approximately 0.33 nm, whereas in other sections, the d-spacing can be as large as 0.42 nm. This is a potential indication that the Na atoms diffuse within the carbon and expand it more than 25%. Similar effects are observed in other regions, proving that it is not characteristic of this specific location. Similar effects are observed in the V2O5; yet, the most visible one is the poly-crystal frameworks. This combination of results demonstrates the presence of sodium and its detrimental effects on both graphene and V2O5. A complimentary demonstration of the presence of sodium is given in figure 3(a) (EDS results). This set of images shows the presence of all the constituents of the composite, but what is relevant is the presence of sodium that clearly shows its distribution. The EDS maps show a higher density in Vanadium(V), Carbon (C), Oxygen (O) when compared to Sodium (Na), implying a difference in concentration. Therefore, this proves that sodium is present in the composite after the adsorption desalination cycle.
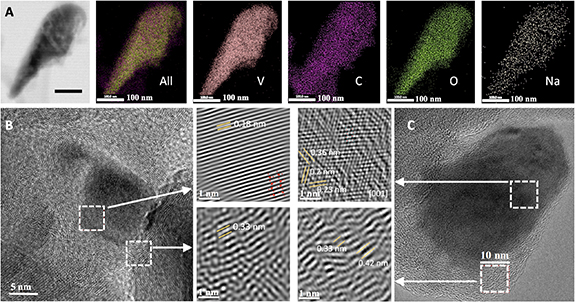
Figure 3. Transmission electron microscopy results for the (a) EDS test/analysis of the G-V2O5 after the adsorption cycle.(b) G-V2O5 before the desalination process, (c) G-V2O5 after the adsorption cycle.
Download figure:
Standard image High-resolution image2.2. Electrochemical characterizations
V2O5 is considered as one of the best performing anode materials for Na ion battery owing to the interlayer spacing and crystallography that can accommodate Na ion as graphite does for Li-ions [24]. However, the Na intercalation redox reaction in Na-ion batteries is a sluggish process which may not occur at high rate voltage sweep cyclic voltammetry (CV) testing for supercapacitors. For this reason, no redox peaks are expected in CV for the pristine powder sample (figure 4(a)). Hence, to make a more electrochemically active surface area that can facilitate high rate adsorption-desorption kinetics, we employed a hydrothermal process to grow high surface area honeycomb like V2O5 structures on SS steel mesh (see figure 2(d)). The results show that even at high sweep rates, the adsorption associated oxidation peaks start to appear in the CV (discussed in the next section).
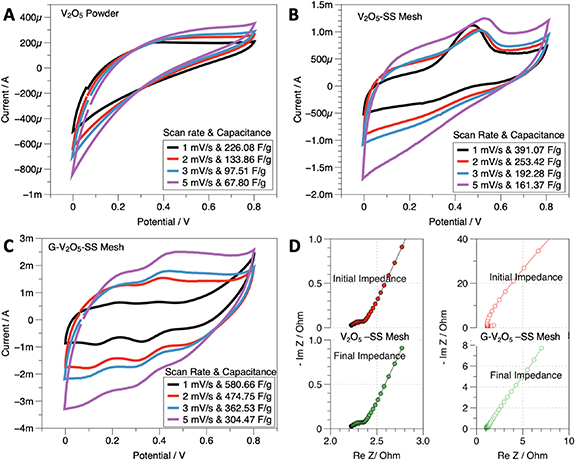
Figure 4. Cyclic voltammograms and capacitance values (a) V2O5 powder (b) V2O5 SS mesh (c) G-V2O5, and (d) Nyquist plots of the capacitor device before cycling and after cycling. The impedance values are very low, which shows the efficacy of the sample in capacitive desalination.
Download figure:
Standard image High-resolution imageGrowth of V2O5 in a honeycomb structure over a substrate and coating with graphene to increase its conductivity allows us to investigate their electrochemical performance as supercapacitors. The capacitive behavior and reversibility of the electrode materials are studied using CV. A three-electrode system using a platinum spring as the counter electrode, Ag/AgCl as a reference electrode, and sodium chloride as the electrolyte were used for the electrochemical tests. For a comprehensive analysis, CV was performed for pure V2O5 powder (figure 4(a)), grown V2O5 on SS Mesh(figure 4(b)), and G-V2O5 (figure 4(c)). CV was performed on pure SS steel mesh as well to evaluate the contribution towards the total capacitance of the electrode, and it was found to be negligible (See SI figure 2). The CV's were performed at scan rates of 1 mV s−1, 2 mV s−1, 3 mV s−1, and 5 mV s−1 within the potential window of 0–0.8 V. The V2O5 powder showed capacitance of 67.80 F g−1, while the grown V2O5 shows a capacitance of 161.37 F g−1 at 5 mV s−1. Furthermore, coating graphene increased the capacitance to 304.47 F g−1 at 5 mV s−1, which is a 55% increase from the as-grown V2O5 SS Mesh samples.
Both (figures 4(b) and (c)) cyclic voltammograms showed the oxidation and reduction peaks, although the reduction peak is very clearly visible in the G-V2O5 sample. The G-V2O5 sample shows two oxidation and reduction peaks. The peaks are due to adsorption occurring individually both at the carbon and V2O5, which in turn improves the capacitance. Both samples show the pseudocapacitance characteristics and the symmetric cycling curves indicative of the stability of the electrodes. The initial and final impedance curves (figure 4(d)) of both V2O5 and G-V2O5 showed very low impedance values, which is one of the primary criteria to act as a supercapacitor electrode. The impedance of the G-V2O5 electrode system is lower than that of the pristine V2O5 electrode, which is an indication of the improved electrical conductivity of the electrodes. The excess surface area offered by graphene improves the capacitance to the next level by incorporating the non-faradaic capacitance and the faradaic processes that happen at the V2O5 electrodes.
2.3. Density functional theory calculations
Density functional theory (DFT) calculations were performed to better understand the interaction between the V2O5 and graphene surfaces. All the simulations were completed using VASP [30–35]. Here we considered a 14-atom unit cell of V2O5 (four—vanadium atoms and ten—oxygen atoms) with lattice parameters (a = 3.61 Å, b = 11.55 Å, c = 4.79 Å) [36]. VASP simulations were performed using PAW-PBE potential with the following settings ISMEAR = 0 (Gaussian smearing), IDIPOL = 3, and ISPIN = 2 (spin-polarized calculation). Vander Waals contributions were included to account for the carbon atom interactions in the graphene. Vander Waals corrections were computed using Grimme D2 method (i.e. IVDW = 1). The cut-off energy (ENCUT) was set at 520 eV and EDIFF = 1.0 × 10⁵, EDIFFG = −0.02. Remaining input simulation parameters are listed for sake of reproducibility ALGO = Fast, ISMEAR = 0, MAGMOM = 48*5.0 120*0.6 192*1.0, PREC = N, SIGMA = 0.1.
The structure considered is orthorhombic since, at low-to-moderate temperatures, this is the most prevalent crystal phase [37, 38]. The bulk structure was relaxed, and cut planes along directions (010, 001, 100) were generated (figure 5(a)). The surface energy of the 001 face was lowest of three calculated surfaces (E010 = 1.38 J m−2, E100 = 0.41 J m−2, E001 = 0.033 J m−2, table 1).
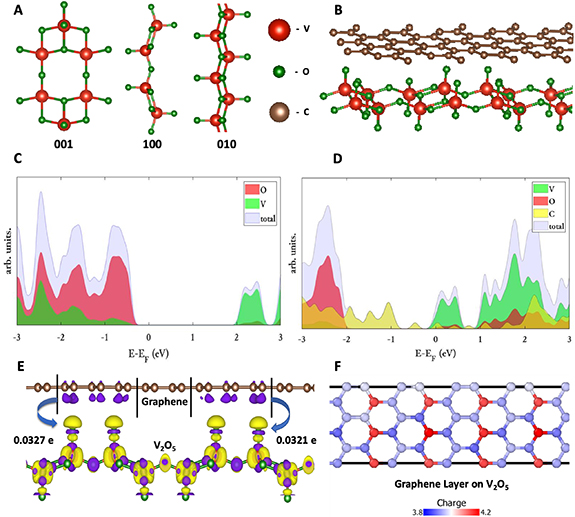
Figure 5. (a) The different faces of the V2O5 (viewed from the top along c-axis) and (b) the supercell of V2O5—graphene interface with dimensions a = 7.24 Å, b = 69.16 Å, c = 23.04 Å. It consists of 48—vanadium atoms (red), 120—oxygen atoms (green), and 192—carbon atoms (brown). The projected density of states of the (c) V2O5 (001 face) and (d) V2O5—graphene interface showing the new valence states introduced by graphene (yellow) and shifted conduction states of V2O5 (green, red) near Fermi level with color-coded contribution from each atom type. (e) charge density difference plot of G-V2O5 at iso-level 0.00134 (yellow color—positive, blue color- negative) and (f) the Bader charge distribution of the graphene layer.
Download figure:
Standard image High-resolution imageTable 1. The effect of the number of layers on the surface energy was studied for various faces of the V2O5 structure. As seen from the table, the 001 face is most stable with minimal surface energy variation for multiple layers.
| No. of layers | No. of atoms | Free surface energy (eV) | E surface (Jm–2) | |
|---|---|---|---|---|
| 100 face | Layer_4 | 28 | −205.466 | 0.412189 |
| Layer_6 | 42 | −309.104 | 0.487531 | |
| Layer_8 | 56 | −413.112 | 0.509291 | |
| 001 face | Layer_1 | 14 | −103.988 | 0.03281 |
| Layer_2 | 28 | −208.157 | 0.030741 | |
| 010 face | Layer_1 | 14 | −101.152 | 1.387369 |
The stability of (001) surface is also confirmed by preferential crystal growth seen along this direction, as inferred from XRD data in figure 2(a). This agrees with earlier reported literature observations as well [22, 23]. Further, the surface energies for (001) surface were calculated with additional layers. A bilayer (001) surface had Esurf = 0.031 J m−2 (a difference of 0.2% compared to single-layer structure). The difference is small since V2O5 has a layered structure along [001] direction leading to weak interlayer interactions [39, 40]. Hence an interface with a single layer (001) face V2O5 as a substrate with a layer of graphene deposited on top was prepared, see figure 5(b). A supercell was constructed by minimizing the lattice vector mismatch of less than 1% between the V2O5 and graphene layers. Since V2O5 and graphene have different crystal symmetries, orthorhombic and hexagonal respectively, a fairly large supercell consisting of 360 atoms (48—vanadium, 120—oxygen, 192—carbon atoms with dimensions a = 7.24 Å, b = 69.16 Å, c = 23.04 Å) was needed to achieve the desired lattice mismatch threshold (See SI S3). The thickness of the vacuum layer is 15.98 Å and interlayer spacing of ∼3 Å. The thickness of the electrode is 7.06 Å.
The electronic density of states for both the V2O5 (001 surface) and the V2O5—graphene interface is plotted in figures 5(c) and (d). V2O5 surface exhibits a very clear bandgap with a value of about 1.91 eV, suggesting semiconducting behavior (figure 5(c)), while the V2O5–graphene interface has minor states populated near Fermi level EF suggesting semi-metallic nature (figure 5(d)). We further analyzed the DOS by calculating the individual elemental contributions of V2O5, and C atoms. From figure 5(d), it can be seen that the conduction bands of bare V2O5 have shifted near to Fermi level states, and new valence states are introduced due to carbon atoms (i.e. graphene). Thus, the deposition of graphene on V2O5 leads to higher conductivity and an electroactive surface, which is in line with the electrochemical measurements of previous sections.
The surface charge distributions were studied by calculating charge density difference plots. It was obtained by subtracting the charge densities of the individual graphene and V2O5 components from the G-V2O5 composite. Figure 5(e) shows the iso-surface of the charge density difference at iso-level 0.00134 (yellow color—positive, blue color- negative). It can be seen that charge transfer happens from carbon to V2O5, particularly at the O sites near the graphene layer. Bader charge analysis was done to calculate the amount of charge accumulated at each atomic location. For the graphene, we observed a net charge transfer of 0.0118 e from graphene to the V2O5 surface. Bader charge of the graphene atoms in the surface can be seen varying between 3.8 and 4.2 e with a mean charge of 3.9882 e compared to the bare carbon valence charge of 4 e. Locally, we see Bader charge transfer of 0.0321–0.0327 e as shown in figure 5(f). This further confirms the charge transfer from graphene to V2O5, and similar behavior has been observed in the literature [41].
2.4. Desalination tests
The performance parameters, salt adsorption capacity, charge efficiency, coulombic efficiency, and energy per ion removed, were calculated and plotted with respect to time/cycle numbers. The following equations were used to calculate the performance parameters. Salt adsorption capacity (SAC) represents the amount of the salt removed (mg) during the adsorption cycle per unit weight (g) combined with both the electrodes.
Where  is the flow rate in ml min−1,
  and
and  are the cycle initiation and adsorption cycle completion times,
  and
and  are the instantaneous effluent concentration and feed concentration respectively in mg l−1 and
  is the combined electrode weight in grams. For an adsorption cycle, the ratio of the moles of the salt removed per unit mole of the electrical charge supplied during the adsorption cycle is termed as charge efficiency.
Where,  is the molecular weight of the salt (58.44 g mol−1 NaCl), and F is Faraday's constant (96 485 C eq–1). The coulombic efficiency represents the roundtrip charge efficiency. It is calculated as the ratio of electrical charge released during the desorption stage to the electrical charge supplied during the adsorption stage.
Energy consumption (J) during the adsorption stage was calculated by integrating the current supplied during the adsorption cycle and multiplying with the applied voltage. Furthermore, the calculated number was divided by the number of moles of the salt removed, a factor of two (to convert from moles to number of ions for NaCl) and a factor of 2480 J mol−1 (RT = 2.48 kJ mol−1) to convert the calculated value into the 'Energy per ion removed (KT)' units [2]
3. Deionization data
Several desalination tests were conducted using the same electrode sample and three different feed concentrations, and the overall data is presented in figure 6. Desalination tests were conducted for 50 continuous cycles and three different concentrations (5, 10, 15 mM NaCl) and the effluent concentration data plotted w.r.t. the cycle numbers as shown in figure 6(a). The concentration trends demonstrate that qualitatively the desalination performance (amplitude of initial and final cycles) was maintained without any noticeable performance degradation. Fluctuation in the effluent concentration trend was noticed. This could be due to the SS mesh which is the base material corroding under the given operating conditions and leading to the generation of gaseous and metallic species, which in turn disturbs the reading of the conductivity meter used to read the effluent composition. This phenomenon is especially pronounced for 10 and 15 mM concentration. Also, since the initial and final SAC values for all the three cases are consistent, we believe that the interfering phenomena is not affecting the V2O5 material. Furthermore, the slightly lower but stable coulombic efficiency values indicate that electrically the system is running smoothly but due to the possibility of the above-mentioned phenomena, conductivity sensor readings are not stable and that affects the calculation of all the other parameters. Such corrosion events can be mitigated by optimizing the growth protocol to get a pinhole-free growth of V2O5 growth as well as getting a complete graphene coating.

Figure 6. Desalination performance of V2O5/graphene hybrid faradic deionization (a–d) concentration profiles of 5, 10, and 15 mM NaCl; (a) Concentration profile over time, (b) Salt adsorption capacity, (c) charge efficiency, and (d) energy consumption per ion removal.
Download figure:
Standard image High-resolution image3.1. Salt adsorption capacity
Quantitatively, the salt removal performance was evaluated in terms of SAC, and the results are shown in figure 6(b). The average salt adsorption capacity for 5 mM feed concentration is around 6.7 mg g−1. Further increasing the feed concentration leads to the saturation of SAC at 8.5 and 12.5 mg g−1 for 10 and 15 mM NaCl feed solution respectively. Again, the fluctuation in the SAC values is probably because of the fluctuating baseline of the effluent concentration curves.
3.2. Charge efficiency
Charge efficiency (CE) is calculated to evaluate the extent of energy utilization towards the salt removal process. The results are shown in figure 6(c). The CE trend for 5 mM indicates a slightly lower charge efficiency (∼75%) than at the (∼85%) 10 and 15 mM feed concentration tests. Probably, at a lower concentration, the solution resistance in the spacer channel has high transport resistance leading to the increased solution resistive losses. These factors combined might have led to lesser charge efficiency at low feed concentration. This indicates that to evaluate the desalination performance selecting an appropriate feed concentration is very important.
3.3. Coulombic efficiency
The coulombic efficiency was calculated to evaluate the possibility and extent of any faradaic reactions. As shown in figure 6(c), the coulombic efficiency is approximately 86%, 80% and 85% for 5, 10 and 15 mM feed concentrations respectively. These high columbic efficiencies indicate that there is very little faradaic loss in this system. Furthermore, it should be noted here that the coulombic efficiency values are stable indicating that there was no intermittent noise within the desalination process.
3.4. Energy per ion removed
Energy consumption per ion removed is calculated and presented in figure 6(d). As was seen in the charge efficiency case, the energy consumption in the case of 5 mM feed concentration (∼27 units) was higher than the other two cases (∼23 and ∼20 units for 10 and 15 mM feed concentration respectively). The important thing to be noted here is that the energy consumption for 10 and 15 mM feed concentration is very competitive as compared to the values reported in the various CDI literatures [2].
Later the SAC and specific capacitance values and other relevant parameters are tabulated and compared with the existing literature. The as developed G-V2O5 samples prevail most of the reported materials on feed conductivity, second-best in SAC, energy-efficient in terms of adsorption voltage and second highest in specific capacitance. More details are provided in the supplementary information, see SI S4 & S5. All these studies used a composite electrode based on graphene or graphene oxide materials. One major difference is that we used slightly higher feed water salinity, but this is due to our previous experience that low salinities (<200 us cm−1) are quite far from practical use. More importantly, solution resistance becomes very high leading to higher specific energy consumption and side reactions. We reported the charge efficiency and specific energy consumption values for several cycles which is not the case for previous studies which in turn rendering them difficult to implement.
4. Conclusion
Our investigation demonstrates that graphene coating significantly affects the capacitive behavior of V2O5 cylindrical structures. Interestingly, during the desalination cycles, along with the electrical double layer formation at the graphene layer, ion intercalation is observed in the honeycomb structure of the hydrothermally grown V2O5 layer leading to an improvement in Na+ and Cl– ion removal from the brackish water. Our first-principles based density functional theoretical (DFT) modeling unravels the origin of the observed properties in terms of the interaction between the V2O5 and graphene surfaces, which in turn leads to higher conductivity and electroactive surfaces. The Graphene coated V2O5 system showed a maximum salt removal capacity of 12.5 mg g−1 in 15 mM NaCl. Higher charge efficiencies up to 85% were obtained, which were similar to the values reported in the literature [42]. Higher columbic efficiency of up to 85% indicates least faradaic losses, and most of the energy was used in the ion removal process. Finally, the energy per ion removed was found to be the lowest energy consumed per ion removed (20 units). This is similar to or lower than the values reported in the literature [43].
5. Materials and methods
5.1. Sample preparation
Vanadium pentoxide was prepared using a hydrothermal setup, and a layer of graphene was coated on the surface. A low purity V2O5 as a raw material was used to make this process more cost-effective. The primary solution was prepared by using a 0.1 g of V2O5 dissolved in 30 ml of double-distilled water followed by 1 ml of hydrogen peroxide. The mixture was stirred well for 4 h before adding it into an autoclave containing 5 × 1 cm vertical strips of SS mesh. The SS mesh was sonicated in an isopropanol medium and air-dried for 10 min. The mesh was weighed and transferred into a hydrothermal setup. The mixture was heated to 205 °C for 16 h to obtain a uniform growth. Later the SS mesh was removed from the autoclave and repeatedly washed with water and ethanol to remove impurities and weakly grown particles. The mesh was vacuum dried at 90 °C for 12 h before using a CVD technique to coat a few layers of graphene on the surface of the as-grown V2O5 honeycomb-like structure. The coating of graphene is expected to improve electrical conductivity. Ultra-pure acetylene (99.99%) was used at a flow rate of 100 sccm to grow a few layers of graphene at 625 °C for 3 min. The V2O5 grown on SS mesh and the V2O5 grown on SS mesh and coated with graphene were taken for several characterizations.
5.2. Characterization
A field emission JEOL JSM 7500 F FE-SEM operating at 5 kV was used to image the surface morphology of the sample at micrometer length scales. TEM images were recorded in a Jeol 2010 F system operated at 200 kV. The TEM is equipped with an Energy-dispersive x-ray for chemical analysis. A Renishaw in Via Raman microscope with an excitation wavelength of 532 nm was used to record the Raman spectra. An autolab potentiostat under three-electrode configurations was employed to run the CV. Here the G-V2O5 acts as a working electrode, Ag/AgCl as reference electrode platinum spring as counter electrode and 1 M Na2SO4 as the electrolyte. The voltage window with which the experiments were done is 0–0.8 Volts.
5.3. Capacitive desalination
A 'flow by' type CDI cell configuration (as shown in figure 7) was used to conduct desalination tests on a 1 cm × 5 cm electrode. The same bench-scale test set up was used as in the previous work [13]. In brief, the setup included a feed and effluent container, a peristaltic pump, a CDI reactor unit, an electrochemical analyzer unit for voltage supply, and a pH and conductivity probe at the exit of the CDI reactor. Additionally, a computer system interfacing with the electrochemical analyzer, pH, and conductivity probe to control the applied voltage, desalination cycle time, record current, pH, and conductivity data. The CDI unit assembly mentioned above consisted of a cathode and anode electrodes of the same material and a 1 mm thick (61% porosity) spacer. Desalination tests were conducted using NaCl (5, 10, 15 mM) feed solutions. Desalination cycles consisted of 1000 s each adsorption and desorption, with 1.2 V applied during adsorption and 0.0 V during the desorption cycle. Additionally, before starting the desalination cycles, the samples were equilibrated with the feed solution for one hour. Conductivity values were recorded every 1 s and converted to the concentration (mg l−1 NaCl) using an initial concentration-conductivity relationship (10 mM, 1.13 ms cm−1).

Figure 7. Flow by" type CDI cell configuration.
Download figure:
Standard image High-resolution image
Acknowledgments
We acknowledge the generous support provided by Shell. Anand B Puthirath thanks the Science & Engineering Research Board (SERB) and Indo-US Science and Technology Forum (IUSSTF) for financial support in the form of postdoctoral fellowship. The authors (Duraivelan Palanisamy and Janakiraman Balachandran) thank Dr Somil Gupta and Dr Amar Deep Pathak for their valuable advice on DFT simulations. Amit Jain acknowledges the financial support from the National Science Foundation through the Nanotechnology-Enabled Water Treatment Engineering Research Center (EEC-1449500).