
Abstract
Nanosecond plasmas in liquids are an important method to trigger the water chemistry for electrolysis or for biomedical applications in plasma medicine. The understanding of these chemical processes relies on knowing the variation of the temperatures in these dynamic plasmas. This is analyzed by monitoring nanosecond pulsed plasmas that are generated by high voltages at 20 kV and pulse lengths of 15 ns applied to a tungsten tip with 50 μm diameter immersed in water. Plasma emission is analyzed by optical emission spectroscopy ranging from UV wavelengths of 250 nm to visible wavelengths of 850 nm at a high temporal resolution of 2 ns. The spectra are dominated by the black body continuum from the hot tungsten surface and line emissions from the hydrogen Balmer series. Typical temperatures from 6000 K up to 8000 K are reached for the tungsten surface corresponding to the boiling temperature of tungsten at varying tungsten vapor pressures. The analysis of the ignition process and the concurrent spectral features indicate that the plasma is initiated by field ionization of water molecules at the electrode surface. At the end of the pulse, field emission of electrons can occur. During the plasma pulse, it is postulated that the plasma contracts locally at the electrode surface forming a hot spot. This causes a characteristic contribution to the continuum emission at small wavelengths.
Export citation and abstract BibTeX RIS

Original content from this work may be used under the terms of the Creative Commons Attribution 4.0 licence. Any further distribution of this work must maintain attribution to the author(s) and the title of the work, journal citation and DOI.
1. Introduction
Discharges in liquids gained a huge interest over the last few decades as they can be used for example for wastewater treatment [1–4], for nanoparticle formation [5, 6] as well as for biomedical applications [7]. These types of discharges are appealing, because they produce a range of reactive species like OH and H2O2 inside water.
The in-liquid discharges are usually ignited in a pin-to-pin or pin-to-plane configuration [8, 9] using a high voltage (HV) pulse applied to an electrode. The mechanism responsible for breakdown in liquids was initially associated with the breakdown of vapor in previously formed bubbles which are created at the tip of the powered electrode [10]—such an ignition environment is more gaseous than a direct liquid environment.
In comparison to that, nanosecond (ns) pulsed discharges with short rising times of the voltage of a few ns in water are assumed to ignite directly inside water [11]. The ignition may occur via the Townsend mechanisms in the gas phase of vapor that is trapped in small nanovoids. Such nanovoids may be created by the high electric fields that cause ruptures in the liquid. Alternatively, ignition may also occur by field emission and/or field ionization at the liquid solid interface [12]. Due to the high electric field at the electrode tip, the potential barrier between the metal and adjacent water molecules is modified so that electrons are able to tunnel through the potential barrier [13]. In case of a positive potential, this tunneling causes the formation of positive water ions by field ionization. In case of a negative voltage, tunneling causes the acceleration of electrons into the liquid, that may cause impact ionization of water molecules.
The understanding of the ignition process is crucial to understand the evolution of the chemistry of water dissociation. For example, if a bubble is present prior to ignition, a plasma from vapor is created and the dissociation products would then dissolve into the water at the end of the pulse. On the other hand, if the discharge is created directly inside water, aqueous electrons would be created and dissociation may occur directly in a very high pressure environment.
The ignition phase of the plasma is often studied using emission spectroscopy. Several authors observed a broadband continuum in time-averaged [14] and time-resolved [15–18] optical emission spectroscopy measurements. The time-resolved studies showed that a continuum is rising in the beginning of ns-pulsed discharges in water [17]. Šimek et al [17] postulated that free–free and bound–free radiative transitions are responsible for this continuum in the very beginning of a 6 ns pulsed plasma in a pin-to-plane configuration inside distilled water. They reported two phases of an initial rising continuum followed by line emission. This could also be reproduced in our latest measurements [19]. In the study of Šimek et al, no spectral lines were visible for the continuum phase, which would hint to bound-bound radiative transitions or free–bound transitions, since the recombination of an electron with an ion may cause Bremsstrahlung, but also line radiation, when the electron that is captured in the higher states of an atom or molecule decays to the ground state. Nevertheless, it is still possible that spectral lines could be hidden by the broadband continuum or that the spectral lines are so broad due to the extreme conditions that they cannot easily be separated from the background continuum. For example, Marinov et al suggested that the continuum is caused by strongly broadened lines of the hydrogen Balmer series and atomic oxygen lines [14]. This seems unlikely since a shift of the continuum from the vis–NIR to the UV during the initial phase of the plasma pulse had been reported [17], which should not appear for strongly broadened atomic lines with fixed line positions. As an alternative, one might also regard hydrogen molecular continua. Fantz et al [20] compared model and experiment of a low-pressure H2 ECR plasma and reported the shape of the continuum created by bound–free ( ) transitions depending on the vibrational temperature Tvib and the electron temperature Te. Such a molecular continuum, however, extends only over a limited wavelength range, which is smaller than the observed range of the continuum. The major drawback of the spectral studies so far, is often the poor temporal resolution, which makes the analysis of line shapes almost impossible, because these may change significantly the development of the nanosecond plasma being faster than the acquisition time of the spectroscopy.
Therefore, the understanding of the source of the continuum requires measurements with a high temporal resolution, but also a wavelength range which extends into the UV to unambiguously identify the shape of the continuum. For example, Bremsstrahlung and black body radiation exhibit very similar shapes of the continua at long wavelengths, but differ significantly toward smaller wavelengths. Whereas black body radiation eventually decreases toward smaller wavelengths at temperatures of a few 1000 K, Bremsstrahlung shows a strong increase toward smaller wavelengths for high electron temperatures. In addition, the proper determination of the shape of the continuum radiation also allows a robust separation of the continuum from broadened lines. For this, a high temporal resolution of the spectra is absolutely necessary, because even a simple emission line shape varies strongly in time due to the dynamic behavior of the plasma inducing various line broadening effects. Finally, the understanding of the continuum radiation may impose bounds on the estimates of the temperature in the system. In our previous study [19], we connected the dynamics of the plasma to cavitation theory and found good agreement between the bubble expansion at later phases of the process and the initial energy that is dissipated due to plasma ignition. This initial energy was expressed as initial pressure p0,gas times volume V0. The conversion of this volume energy p0,gas × V0 into species densities and temperatures is not unique, and any independent information on the temperatures is strongly needed.
In this paper, we employ such fast emission spectroscopy extended into the UV range to investigate plasma ignition and the continuum radiation. This paper is the first part in a series. In the second part, the line radiation of the broadened hydrogen Balmer series will be discussed and linked to the propagation of the plasma after ignition.
2. Experimental setup
Figure 1 shows a schematic of the experimental setup used for time-resolved optical emission spectroscopy of the nanosecond pulsed plasma. The HV pulses are generated by a pulse generator FPG 30-01NK10 (FID Technology GmbH). The pulses have rising times of 2–3 ns and a pulse width of approximately 15 ns. A frequency of 15 Hz is applied as well as a pulse generator output voltage of 20 kV. A 12 m long coaxial cable (RG217) connects the power supply and the tungsten tip electrode with a back current shunt (BCS) mounted at a central position in the cable (a = b = 6 m in figure 1). The BCS consists of 11 × 3.3 Ω resistors welded into the cable shield. The electrodes consist of copper rods insulated by glass tubes. Stainless steel cannulas are inserted in the copper rods to clamp a tungsten wire (diameter 50 μm) as electrode. The electrodes are connected to the HV cable using HV plugs. The electrical circuitry powering the nanosecond plasma can have a significant influence on the plasma. Several groups working with FID nanosecond pulse generators [14, 16, 18, 21] reported reflections and oscillations of the HV pulse inside the cable, if the plasma load is not matched to the impedance of the cable. In most cases an electrical matching of the system is favored as it creates only one plasma pulse. In the presence of these reflections and oscillations, however, electrical power is dissipated into the plasma at periodic time intervals. This was discussed in our previous study [19]. The length of the cable connecting power supply and plasma electrode is a crucial parameter to distinguish between the forward and backward traveling pulses in the BCS signal. In the case of the 12 m long cable, the separation between the forward (initial) and backward (reflected) traveling pulse is approximately 60 ns and therefore, the voltage waveform at the electrode can unambiguously be determined. This reflected pulse travels back to the power supply before it is reflected there as well and propagates toward the plasma electrode again where it is partly dissipated after 120 ns.
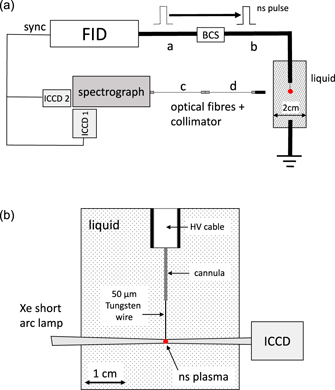
Figure 1. Sketch of the experimental setup showing the chamber from the side (a) and the front view of the chamber illustrating the electrode configuration and the ICCD imaging and shadowgraphy setup in detail (b).
Download figure:
Standard image High-resolution imageThe plasma chamber is made of PMMA and three quartz windows are mounted, two from the sides for (shadowgraphic and ICCD) imaging and one at the front for the collection of light emission during optical emission spectroscopy. The electrodes are positioned at the center of the chamber approximately 10 mm apart. The chamber has a width of 2 cm as illustrated in figure 1(a). Distilled water with an electrical conductivity of 1 μS cm−1 and a pH of approximately 5.5 is used as the liquid. The plasma chamber and the FID pulser are both surrounded by a common Faraday cage so that electromagnetic interference (EMI) cannot escape the system.
For optical diagnostics an Andor iStar DH734-18U-03 camera is used. The spatial resolution of the ICCD imaging setup is approximately 2.5  . For optical emission spectroscopy measurements, the camera is mounted to a triple-grating SpectraPro 750 spectrograph from Acton research, which used a 50
  grating, blazed at 600 nm. The camera is synchronized to the discharge via the synchronization output of the FID pulser and a defined delay time to compensate for the cable length was set. The maximum jitter of the synchronization signal is 0.5 ns and can, therefore, be neglected. The spectroscopic system has a linear dispersion and a resolution of 26
  and 0.35
  , respectively. Combined with a slid width of 25 μm and electronic crosstalk of the camera this finally results in an effective resolution of approximately 2 nm. Due to the limited size of the CCD chip, which results in a wavelength coverage of about 350 nm only, the complete spectrum is composed of three different spectra. With the central wavelengths (CWs) set to 400 nm, 550 nm and 850 nm, respectively, an overall wavelength range of approx. 600 nm could be recorded. A high pass filter is used for the measurements with CW of 550 nm and 850 nm to suppress the 2nd diffraction order of the grating. The light is collected by two UV suitable optical fibers from CeramOptec GmbH that are connected in series via an optical fiber connector to each other for optical emission spectroscopy (denoted as c and d in figure 1). Thereby, EMI is prevented from escaping the Faraday cage and influencing electronics outside. Fiber c is a custom made bundle of fibers with a core diameter of 100 μm with a surrounding metal shielding and is connected directly to the spectrograph. On the other side it is linked to fiber d which has a core of 600 μm and no shielding, that transports the light emitted by the plasma out of the Faraday cage. Both fibers have a numerical aperture NA = 0.22. A collimator at the end of fiber d collects the emitted light of the plasma into the optical system. The distance between the collimator and the electrode tip is approximately 4 cm. Therefore, the fibers collect the light from the plasma integrating over several millimeters.
The system is calibrated with a broadband D-Halogen lamp. The measurements are performed with a gate time of tgate = 2 ns and time steps of tstep = 2 ns between the spectra. Like this, a time span of about 30 ns could be resolved from ignition to the end of the initial pulse. Each spectrum is averaged over 1000 discharges. The data are then background subtracted and further processed with an MATLAB script for merging the spectra with different CW for each step in time.
3. Spectral features
In the following, the spectral features in the emission spectra are introduced and exemplified with the spectrum of the discharge 16 ns after ignition as shown in figure 2. The ICCD gate is 2 ns and each spectrum is averaged over 1000 discharges. Due to reducing sensitivity of the system the spectra get noisier in the short and long wavelength regions. The increase in the signal at wavelengths above 800 nm is an artifact caused by the low quantum efficiency of <3% at >800 nm of the camera. This leads to a specific amplification of noise in this particular region when subtracting the background from a small overall signal. Consequently, these artifacts are much smaller for that spectra that are measured during the intense phase of the plasma when the background signal is much smaller in comparison to the plasma signal. The emission spectrum consists of a continuum and of broadened emission lines. This makes the identification of the individual species and their contributions to the spectrum very difficult. In the following, the continuum will be analyzed in more detail whereas the emission lines will be discussed in part II of this paper series.
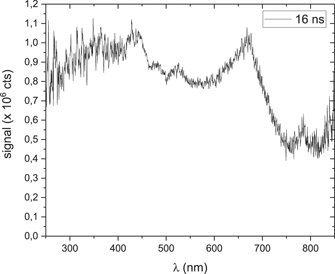
Figure 2. Emission spectrum 16 ns after ignition with an ICCD gate of 2 ns and averaged over 1000 discharges.
Download figure:
Standard image High-resolution imageThe continuum may originate from five different processes: (i) line emissions of atoms with a significant broadening due to the Stark effect or due to van der Waals broadening, (ii) molecular bands of molecules, (iii) the creation of the continuous spectrum by the radiative dissociation continuum of molecules such as H2 ( ) or H2O, (iv) the generation of the continuum by free–bound and free–free radiative transitions and (v) black body radiation. The individual contributions are discussed in the following.
(i) Line emissions
The plasma is ignited directly in distilled water and line emissions of only H and O containing atoms and molecules are expected. Especially the Balmer series of hydrogen is visible in the spectra as e.g. Hα at 656 nm in figure 2. These lines are significantly broadened due to the Stark effect, which is dominant at very high electron densities. In addition, the hydrogen line profiles are modified due to self absorption causing a reversal of the center of the line [22]. A detailed analysis of the hydrogen Balmer series will be discussed in part II of this paper series.
(ii) and (iii) Line and continuum emission from molecules
Furthermore, molecular bands of, for example, water and OH molecules may contribute to the spectrum. These emissions, however, may either also be broadened. Such molecular line series usually extend over a wide spectral range, which makes the identification in the spectra challenging.
The continuum may also originate from the radiative dissociation continuum of H2 ( ) as the transition from an upper bound state to the lower dissociative state. This continuum was discussed in depth by Lavrov et al [23] for non-equilibrium hydrogen capillary-arc and H2:Ar microwave discharges. Furthermore, this radiative dissociation continuum was modeled and compared to experiments of a low-pressure ECR plasma by Fantz et al [20]. Both groups calculated the continuum including several vibrational levels. The wavelength range of that radiative dissociation continuum is, however, limited to wavelengths between 180–400 nm only.
(iv) Continuum emission from free–free and free–bound radiation
Free–bound radiative transitions describe the capturing of a free electron by an ion (2-body recombination). Due to the high pressure of a few GPa in the beginning of the discharge [19], dissociation and the consecutive recombination is very likely to occur. Free–free radiation is created by the change of momentum of an electron during a collision with an ion or a neutral species (Bremsstrahlung). The emission coefficient of the resulting continuum radiation is described by equation (1) [24]:

with

the emission due to recombination of an ion with an electron and

the emission due to collisions between electron and ions and
the emission due to collisions between electrons and neutrals. The constants are C1 = 1.632 × 10−43 J m4 K0.5 s−1 sr−1 and C2 = 1.026 × 10⁻³⁴ J m2 K3/2 s−1 sr−1 [24]. ne, ni, and na are the densities of electrons, ions, neutrals. λ is the wavelength, Te the electron temperature, h Plancks' constant, c the speed of light, kB the Boltzmann constant and  being the Biberman factors for free–bound and free–free transitions. These Biberman factors are a correction term for non-hydrogenic behavior [25]. Since, we regard hydrogen as a prominent collision partner, we set these factors to unity for simplicity. Q(Te) is the cross section for electron neutral collisions, which we set to a typical value of 10−20 m2.
The individual contribution to a continuum emission following the  ,
,  and
and  for electron temperatures of 12 000 K are shown in figure 3 for an electron density of 1023 m−3 (black lines) and of 1025 m−3 (red lines). The neutral density is set to the density of liquid water of 3 × 1028 m−3. One can see that the continuum emission is dominated by electron neutral collisions for low electron densities rendering a maximum in emission around 300 nm. At higher electron densities, recombination radiation at short wavelengths dominates.

Figure 3. Continuum emission  cont as a sum of the contributions due to free–free transitions of electrons colliding with ions (
 ) or neutrals (
 ) and due to free–bound transitions of electrons recombining with ions (
 ). An electron density of 1023 m−3 (black lines) and of 1025 m−3 (red lines) for an electron temperature of 12 000 K are assumed. The neutral density is set to the density of liquid water of 3 × 1028 m−3.
Download figure:
Standard image High-resolution image(v) Continuum emission from black body radiation
In addition to this, black body radiation may be present due to the emission of the plasma or of the hot tungsten electrode during the plasma pulse. Although the tungsten tip is more likely a gray body emitter, black body radiation is here assumed as an estimate. The black body radiation can be estimated by Plancks' law according to:

However, the allowed temperature range of the tungsten electrode is limited. Tungsten exhibits a melting temperature of 3695 K and a boiling temperature of 5828 K. The latent heat of melting is 52 kJ mol−1 and of evaporation is 774 kJ mol−1. Therefore, the energy input by the nanosecond plasma onto the tungsten tip may eventually lead to melting and evaporation. It is conceivable to assume that the heating of the tungsten surface occurs up to the temperature of the phase transition between liquid and vapor at 5828 K. Any further increase in dissipated power by the plasma current will then lead to an additional evaporation rather than an overheating of the liquid tungsten surface. This is consistent with the observation that a slow erosion of the tungsten electrode occurs with a rate of typically 1 mm during one hour of operation.
4. Results
4.1. Voltage characteristics and ICCD imaging
The nanosecond plasma evolution is observed by ICCD imaging shown in figure 4(a) where the position of the electrode is indicated by gray lines. The position is taken from a shadowgraphic image as shown in the top left image of this figure. The corresponding temporal variation of the electrode voltage is shown in figure 4(b). The temporal evolution of the electrode voltage and of the light emission is adjusted in time by aligning the rising edges of both signals.
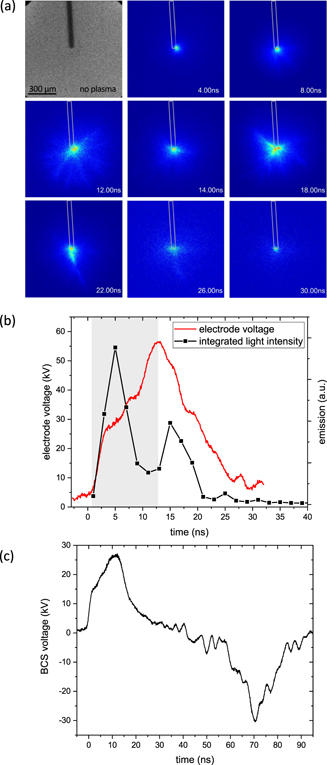
Figure 4. Shadowgraphic image of the electrode without discharge (top left) and ICCD images of plasma ignition and evolution (a), reconstructed electrode voltage waveform and correlating light emission (b) and BCS voltage showing the initial and reflected pulse (c). The gray area in (b) indicates the time span of increasing voltage at the electrode.
Download figure:
Standard image High-resolution imageThe voltage curve is calculated from the line current I measured at the BCS according to the following equations. The voltage drop over the BCS can be written as:

with the current I inside the coaxial cable and R the total resistance of the shunt with Rshunt = 0.3 Ω. We derive a line current according to:

With that, the actual voltage pulse can be determined according to Ohm's law:

with the cable resistance Rcoax = 50 Ω.
The quantification of the signals from the oscilloscope is similar to the reference [11], although here the impedances of the cables as well as the oscilloscope are all matched to 50 Ω. The BCS measures the voltage signal of the traveling HV pulse in the middle of the cable. After reflection at the electrode it travels back along the BCS cable with the opposite sign resulting from the different direction of traveling (data not shown). The real sign of the pulse changes only during its second reflection at the pulser. The difference between the shape of the forward and backward traveling pulses is often used to estimate the absorbed power in the plasma. This absorption originates from the fraction of the HV pulse that travels to the grounded electrode and dissipates in the plasma and in the liquid. The voltage curve shown in figure 4(b) represents the voltage pulse at the electrode reconstructed from the initial and the reflected voltage pulses detected at the BCS (shown in figure 4(c)). Due to the constructive interference between the forward and backward traveling pulse with itself directly upon reflection at the electrode tip, the actual voltage at the tip can be up to twice the value that is measured at the BCS depending on the actual reflection coefficient. The electrode voltage is then reconstructed by adding the initial and the time shifted and inverted reflected pulses that are measured at the BCS location. Such a doubling of the voltage is only valid for the reflection at an open ended cable. Any losses at the end may damp and distort the signal. The inspection of the shape of the traveling pulses (shown in figure 4(c)) indicates, however, that any distortion and damping is rather small, so that the simple addition of the traveling pulses remains a good estimate. Nevertheless, a more detailed electrical analysis of pulse shapes to describe the electrode voltage accurately remains a task of the future. In the following, we distinguish between 'BCS voltage' measured directly at the BCS and 'electrode voltage' which is a reconstructed pulse from the BCS voltage.
As discussed in the section above, the voltage measurements show reflections of the initial pulse but at much later times in comparison to the first 30 ns after plasma ignition. The time t0 = 0 ns is defined by the rise of the voltage pulse. Figure 4(b) shows the integrated intensity of the ICCD images. Two intensity maxima can be seen, which correlate with the rising and falling edge of the HV pulse. A minimum in emission is seen during the plateau phase of the pulse. This so-called 'dark phase' was already reported in the literature [26] (this minimum cannot directly be derived from figure 4(a), because all images are normalized to the maximum).
4.2. Plasma ignition by field effects
The ignition of plasmas in liquids by nanosecond pulses cannot easily be explained by an initial bubble formation followed by an electron avalanche inside that bubble to create the plasma. Such a macroscopic bubble formation is prohibited by the inertia of water at these short time scales preventing any displacement of the heavy species. Instead, the formation of nanovoids due to the differential pressure by the electric field around a tip is postulated serving as nucleation sites for an electron avalanche ignition. However, these nanovoids have not been observed so far and the gas density in such a small void might be even too small to allow for a plasma to develop.
In order to gain a better understanding of the exact position of the discharge, ICCD images for different pulses were taken (figure 5) 6 ns after the ignition of the discharge. In these images the position of the plasma at the tungsten electrode was monitored by single shot ICCD images. The images show, that the plasma ignites at different locations of the tungsten tip for different pulses which leads to the hypothesis that small protrusions at the tungsten surface are the sites of ignition. Furthermore, one can see that ignition may also appear at two or more locations simultaneously. The dimension of the emitting areas is of the order of 10 μm. This illustrates that the microscopic topology of the surface is more important than the macroscopic curvature radius of the tungsten wire.

Figure 5. Three single shot ICCD images taken at 6 ns after plasma ignition during different pulses with a gate of 2 ns showing varying ignition sites at the electrode tip.
Download figure:
Standard image High-resolution imageTo understand the surface structure of the electrode material in our experiment, we compared two electrode materials tungsten and a platinum/iridium alloy and analyzed the surface after operation with a scanning electron microscope (SEM), as illustrated in figure 6. The electrode using the platinum/iridium alloy was intentionally sharpened by chemical etching with a manufactured tip radius of only a couple of 100 nm for optimum plasma ignition. The tungsten wire was cut sloping before clamping it into the cannula. The experiments showed that the plasma operation with a tungsten tip was continuously possible despite significant material erosion, whereas the plasma operation using the platinum/iridium tip was only possible for approximately one hour.
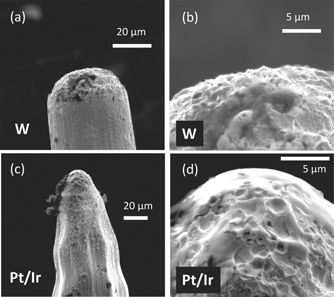
Figure 6. SEM micrographs of the electrode tip made from tungsten (a) and (b) after several hours of operation of the ns plasma and made from platinum/iridium (c) and (d) after 1 h of operation of the ns plasma.
Download figure:
Standard image High-resolution imageThe SEM inspection of this platinum/iridium tip after operation revealed a very smooth surface and a larger tip radius, as shown in figures 6(c) and (d). This is in contrast to the electrode surface of the tungsten tip shown in figures 6(a) and (b) where individual sharp micrometer sized protrusions are present.
Such sharp protrusions at the tungsten tip electrode are apparently rather durable or reappearing even during long operation of the plasma when the electrodes are being eroded continuously. The erosion of electrodes for in-liquid plasmas was studied by Lukeš et al [27, 28]. The comparison of platinum, tungsten and stainless-steel as electrode material showed the highest erosion rates for tungsten [28]. Furthermore, the surface topology of tungsten electrodes showed peculiar protrusions in their study. The authors linked the appearance of these protrusions to the high melting temperature and high thermal conductivity of tungsten that cause very transient melting and solidification processes of the tungsten surface during the plasma pulse.
It is assumed, that the plasma operation for a tungsten tip continuously regenerates these sharp protrusions in a cycle of melting and solidification in each plasma pulse. Due to the lower melting temperature and lower thermal conductivity of the platinum/iridium alloy, a larger surface area on the tip remains in the molten state for a longer time implying also a slower solidification process after the end of the plasma pulse. As a result, the surface tension of the platinum/iridium alloy leads to small curvature protrusions and any electric field enhancement effect is smaller compared to tungsten as electrode material. Therefore, we postulate that these sharp protrusions act as ignition sites.
In order to explain the lifetime of the different material electrode tips, we postulate plasma ignition by field emission in case of a negative polarity or by field ionization for a positive polarity at the protrusions on the electrode tip surface. In this case, after a specific time of operation, the tip of the platinum/iridium alloy becomes too smooth so that ignition by field effects is no longer possible and plasma generation stops.
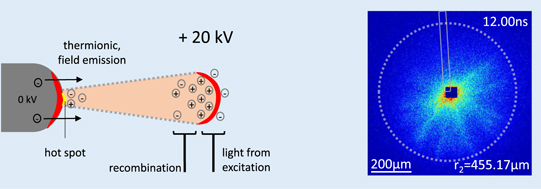
In general, a strong electric field at the electrode–liquid interface acts on the adjacent water molecules and distorts their electronic ground state as illustrated in figure 7. In the beginning of the pulse, a positive potential between electrode and surrounding (figure 7(a)) may lead to electron generation by field ionization from the H2O molecule tunneling into the tip. A layer of positive water ions adjacent to the electrode surface is created. At the end of the pulse a negative potential is created due to a strong residual positive space charge close to the tip (figure 7(b)). Electrons generated by field emission may tunnel from the tip into the water and populate an excited state of the water molecule or simply ionize the water molecule by electron impact. This would be the case for the positive charge in a streamer head as will be discussed in part II of this paper.
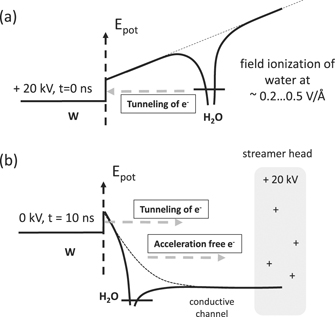
Figure 7. Sketch of field ionization for positive potential between electrode and surrounding as at the beginning of the pulse (a) and field emission for negative potential between electrode and surrounding at the end of the pulse (b).
Download figure:
Standard image High-resolution imageThe threshold electric field Ethreshold for tunneling to occur is in H2O 0.2–0.5 V Å−1 (H2 = 0.7 [29]). The field at the tip used in these experiments can be estimated as follows [29]:

with the applied voltage V and the tip radius rt. The voltage in our experiment was set to 20 kV resulting in a field of 0.016 V Å−1 assuming a tip radius of 25 μm. This is too small for field emission effects to occur. However, a close inspection of the tungsten tip in operation indicated that plasmas can only be ignited if the 25 μm radius tip is intentionally sharpened yielding local radii in the range of 1 μm. This in turn implies local electric fields of the order of 0.4 V Å−1 which is identical to the required threshold fields Ethreshold for water field ionization or field emission [13].
4.3. Continuum emission from black body radiation
The gas temperature inside the plasma can be derived from the ideal gas law for a known pressure, plasma volume and particle density. Recently, we used cavitation theory to model bubble expansion [19]. In this model, the expansion of the cavitation bubble with an initial radius of R0 = 25 μm or a volume  and an initial pressure p0,gas is modeled showing excellent agreement with the temporal evolution of the bubble radius as deduced from shadowgraphy. The main fitting parameter of this model is the initial energy that is deposited by the plasma that eventually drives cavitation. This initial energy corresponds to the volume energy p0,gas
V0. Due to the high inertia of water molecules during the short plasma pulse itself, it is reasonable to assume that the species density inside the initial bubble with volume V0 is identical to the liquid water density nwater. Based on this information, we can assess a temperature by using the ideal gas law from p0,gas = nwater
kB
T to convert the fitted initial pressure p0,gas yielding temperatures from 2000 K for experiments using an applied voltage of 14 kV to 70 000 K for experiments using an applied voltage up to 26 kV. This determination of the temperature provided a good input parameter to model the water chemistry inside the expanding bubble [30]. Nevertheless, it remains a crude assumption with a significant error bar. For example, the initial volume V0 might be smaller and the initial pressure p0,gas higher yielding an identical initial volume energy. A smaller volume, however, corresponds to a smaller absolute number of water molecules at a higher temperature to yield the same dissipated energy. Consequently, we seek independent information on the temperatures based on spectroscopy.
and an initial pressure p0,gas is modeled showing excellent agreement with the temporal evolution of the bubble radius as deduced from shadowgraphy. The main fitting parameter of this model is the initial energy that is deposited by the plasma that eventually drives cavitation. This initial energy corresponds to the volume energy p0,gas
V0. Due to the high inertia of water molecules during the short plasma pulse itself, it is reasonable to assume that the species density inside the initial bubble with volume V0 is identical to the liquid water density nwater. Based on this information, we can assess a temperature by using the ideal gas law from p0,gas = nwater
kB
T to convert the fitted initial pressure p0,gas yielding temperatures from 2000 K for experiments using an applied voltage of 14 kV to 70 000 K for experiments using an applied voltage up to 26 kV. This determination of the temperature provided a good input parameter to model the water chemistry inside the expanding bubble [30]. Nevertheless, it remains a crude assumption with a significant error bar. For example, the initial volume V0 might be smaller and the initial pressure p0,gas higher yielding an identical initial volume energy. A smaller volume, however, corresponds to a smaller absolute number of water molecules at a higher temperature to yield the same dissipated energy. Consequently, we seek independent information on the temperatures based on spectroscopy.
The time-resolved emission spectra of the first 34 ns after plasma ignition are shown in figure 8 for a nanosecond pulsed plasma with approximately 15 ns width and 2–3 ns rising times at 20 kV and 15 Hz. The ICCD gate is 2 ns and each spectrum is averaged over 1000 discharges. The individual spectra are stacked in the graph and scaled for best visibility of the spectral features. In the beginning, the broadband continuum is evolving and the Balmer series of hydrogen becomes visible with Hα being very broad due to Stark broadening. The continuum may either originate from Bremsstrahlung or from black body radiation leading to different spectral shapes, especially at long wavelengths, because Bremsstrahlung follows a 1/λ2 dependence whereas black body radiation follows a 1/λ5 dependence, respectively:
- Bremsstrahlung background 1/λ2 at long wavelengths: Bremsstrahlung originates from the energy loss of an electron in a collision with an ion or a neutral. These free–free transitions are described by equations (3) and (4) with a 1/λ2 dependence of the emission coefficient.
- Hot tungsten surface emitting black body radiation with 1/λ5 dependence at long wavelengths: the power input onto the small electrode tip leads to electrode heating and to the emission of black body radiation (equation (5)). The ICCD images indicate that most of the emission is located very close the electrode surface (compare with figure 4(a)) so that we assume that the tungsten surface is the source of black body radiation.

Figure 8. Time-resolved emission spectra between 2 ns and 34 ns showing the continuum arising after plasma ignition. Hα , Hβ , Hγ and OI777 line positions are indicated by the vertical dashed lines. Each spectrum is averaged over 1000 discharges with a gate width is 2 ns.
Download figure:
Standard image High-resolution imageBoth possible continua are evaluated in comparison with typical data of a sensitivity calibrated emission spectrum at 4 ns after ignition shown in figure 9. The red line corresponds to black body radiation assuming a temperature of 7000 K, the black solid line corresponds to Bremsstrahlung of electrons in collisions with neutrals at a temperature of 9500 K. It is expected that the Bremsstrahlung of electrons in collisions with neutrals dominates in comparison to the collisions with ions, because ionization degrees of the order of only 10−3 are found, as discussed in the second part of this paper series [31].

Figure 9. Emission spectrum at 4 ns after plasma ignition (thin black line) with a gate width of 2 ns, averaged over 1000 discharges. The line positions for Hα
, Hβ
, Hγ
, and Hδ
are indicated. The solid lines denote either black body radiation bb assuming a temperature of 7000 K (red line) or Bremsstrahlung  (thick black line) due to electron neutral collisions for an electron temperature of 9500 K.
Download figure:
Standard image High-resolution imageThe continuum spectra are scaled arbitrarily to fit the data. Broadened hydrogen lines for Hα , Hβ and Hγ may be identified. At the position of the OH molecular bands around 300 nm no clear interpretation is possible. From this graph, it is obvious that a 1/λ5 dependency of black body radiation fits better to the continuum in comparison to the 1/λ2 dependency of Bremsstrahlung since line emission provides additional contributions. Therefore, the origin of the broad continuum background will be assumed to be black body radiation from the hot tungsten electrode.
4.4. Determination of temperatures from emission spectra
The fitting of the continuum background due to black body radiation is shown in figure 10 for different times of the pulse. The analysis of the data shows that the assumption of a single unique temperature for the complete tungsten tip is not sufficient to describe the complete data set. Instead, a variation of the continuum at short wavelengths is observed. It is postulated, that this behavior can be best fitted by a two temperature model of the hot tungsten surface during plasma operation exhibiting two distinct regions being motivated as follows:
- Black body radiation of the hot tungsten surface: the black body emission from the tungsten electrode is shown as green line in figure 10. The temperatures are typically at 6000 K or higher corresponding to the boiling temperature of tungsten at varying partial pressures of tungsten due to the ongoing evaporation process. Such a fit with a black body continuum and a unique temperature showed excellent agreement with the data taken at 2 ns, 4 ns, and 6 ns.
- Black body radiation of a hot spot on the hot tungsten surface: the continuum background of the data taken at 8 ns and later cannot easily be fitted by a single black body background at one unique temperature. Hence, the additional black body emission from a very small hot spot at the tungsten electrode (shown as red line in figure 10) is postulated. The temperature of this hot spot is set to 20 000 K arbitrarily. It is well known from arc discharges that the nonlinear interplay between thermionic emission and local heating of the surface leads to the formation of a 'hot spot', a very localized region, where the plasma is contracted and where the surface temperature can be much higher at the expense of a small reduction of the overall temperature of the remainder of the electrode [32]. The area of this hot spot may be only in the percent range of the complete hot tungsten surface. Due to the T4 dependency of the Stefan–Boltzmann law, even a small area but at a high temperature can significantly contribute to the emission. A very high temperature of this hot spot of 20 000 K creates a maximum emission at wavelengths well below the wavelength range of our spectra. Therefore, the emission of this hot spot contributes with a second 1/λ5 continuum to the emission at short wavelengths.
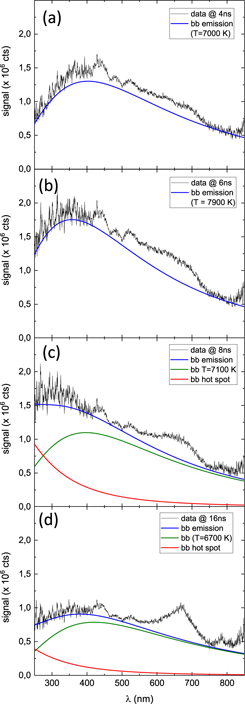
Figure 10. Time-resolved emission spectrum for different times after ignition modeled as the sum (blue line) of black body radiation at different temperatures as indicated (green line) and assuming a contribution of a percentage of a hot spot at 20 000 K (red line). The data (black line) is averaged over 1000 discharges with a gate width of 2 ns.
Download figure:
Standard image High-resolution imageDue to the limited wavelength range an exact determination of the temperature of such a hot spot is not possible. It is also conceivable that these hot spots are the locations of the small protrusions that had been found by Lukes et al [28] on the plasma electrode after operation.
In general, the assumption of the presence of a hot spot is reasonable, but remains a very crude assumption and any exact quantification of both, the temperature and the area ratio of such a hot spot, remain very ambiguous. One could also assume that the observed variation in the spectra at short wavelengths corresponds to a modulation due to a varying recombination radiation that correlates with the propagation of the plasma. However, this would imply that the continuum is composed of two very distinct sources of emission (Bremsstrahlung and black body radiation). Such a composition should lead to more complicated spectral shapes of the continua, because black body radiation and Bremsstrahlung can affect very different parts of a spectrum. This is not observed. The presence of several temperatures on the hot tungsten surface is, however, much more likely, so that one source of continuum emission, namely black body radiation, can more easily explain the observed variation and modulation in the spectra.
The fitting shows that in the beginning of the pulse, a black body emission with temperatures between 7000–8000 K fits well to the continuum background, consistent with findings in the literature [14]. The emission from the hot tungsten (green line) is ranging between 5000–8000 K for a time span of 25 ns.
The fitting of the continuum background using the two-temperature model in figure 10 is quantified by the two parameters in figure 11 of the (i) temperature of the hot emitting tungsten surface (green) and (ii) the fraction of the surface corresponding to a hot spot being at 20 000 K (red). The dashed line indicates the boiling temperature of tungsten at ambient conditions. The temporal evolution of the electrode voltage is plotted for comparison as black line. The hot spot may form a few nanoseconds after ignition and then contribute to the continuum radiation. This results in the 1/λ5 contribution in the short wavelength range from 250–300 nm (red line in figures 10(c) and (d)). The continuum fitting indicates that the temperature significantly exceeds the boiling temperature at the beginning and the end of the pulse, when the electric field is the highest. The fraction of the hot spot is out of phase with the variation of the temperature of the hot tungsten surface. This leads to the assumption that the surface is initially overheated, before the hot spot is formed and the temperature decreases to the boiling temperature after 12 ns after plasma ignition. A similar observation can be made at the end of the pulse where another overheating due to the assumed field from the positive propagating plasma initiates as second increase of the hot spot contribution at about 20 ns. The percentage of the hot spot agrees reasonably well with the ratio between the dimension of the protrusions of micrometer and the observed dimension of the total emitting areas.
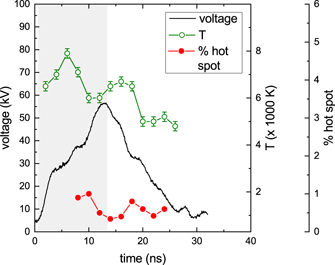
Figure 11. Quantification of the continuum spectra expressed as temperature (green symbols) and as percentage of that surface being at 20 000 K corresponding to the hot spot (red dots). The dashed line indicates the boiling temperature of tungsten at ambient conditions. The black line shows the temporal evolution of the electrode voltage. The gray area indicates the time span of increasing voltage.
Download figure:
Standard image High-resolution image5. Discussion
Based on the experimental results, we develop in the following a physical picture in five phases for plasma ignition and plasma propagation in the liquid. Phase I to IV describe the pulse itself, phase V the expansion of the gas bubble.
5.1. Phase I: ignition by field ionization
When the applied voltage pulse of 20 kV arrives at the electrode, field ionization becomes possible at the electrode liquid interface: due to the high electric field, the potential barrier between the water molecules and the tungsten tip becomes distorted (illustrated by the dashed line in figure 7). When the distortion of this reference energy is large enough so that the ground state level in the water molecule is above the Fermi level of the electrons in the tungsten electrode, an electron in the water molecule may tunnel into the tungsten electrode and field ionization occurs. This process requires electric fields of the order of 0.4 V Å−1 that can be present at 1 μm radius protrusions at the electrode tip. Protrusions of that size or even smaller are visible in the SEM micrographs (figure 6). Field ionization creates positive water ions at the electrode liquid interface. This effect induces also an electric field gradient inside the liquid, where more water molecules may be ionized by tunneling effects. A positive space charge is formed that is able to propagate in the liquid (figure 12). Unfortunately, no modeling is available for such a plasma propagation directly in liquids and the characteristic behavior may only be compared with the streamer propagation in air at high pressures [33]. The exact nature of this process will be analyzed in the second part of this paper series.
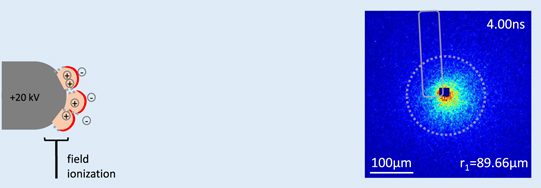
Figure 12. Sketch and ICCD image at the beginning of the pulse (field ionization). The area of strongest emission is blackened in order to make faint structures visible. The dashed circle represents the front of the propagating plasma and the solid line indicates the position of the electrode tip.
Download figure:
Standard image High-resolution image5.2. Phase II: heating of the electrode tip material and cathode spot formation
The high electric field at one or more protrusions at the tungsten tip surface leads to electrons being accelerated toward the tip and electron impact leads to heating of the tungsten surface. The temperatures of the tungsten surface are in the range of 6000–8000 K. This temperature range is consistent with the fact that the boiling temperature TB of tungsten is at  5828 K at ambient conditions corresponding to a vapor pressure p0. Here, we also have to take into account that the vapor pressure p of tungsten in front of the tungsten tip can be very high due to evaporation, which increases this transition temperature according to the Clausius–Clapeyron equation as:

with R the gas constant and the heat of evaporation of tungsten of ΔHvaporization = 774 kJ mol−1. This yields higher boiling temperatures of for example 8189 K for p/p0 = 100 or 6810 K for p/p0 = 10. Due to the very high heat of evaporation at this phase transition, it is assumed that the tip of the tungsten electrode is always at the boiling temperature, which may, however, vary during the pulse due to the intense evaporation of tungsten. This evaporation becomes visible as a non-negligible erosion of the tungsten tip during operation. At such high temperatures, the black body radiation is in the visible wavelength range and thereby dominating the spectrum.
Due to the local nature of the discharge it is expected that this temperature is not homogeneously distributed over the surface of the tungsten tip, but a small hot spot forms due to the contraction of the plasma to particular locations where the surface temperature is the hottest. Therefore, the overall black body radiation may be composed of the emission of the tungsten tip at boiling temperature plus a hot spot at even higher temperatures. The latter effect gets significant, when the plasma current and the electron emission at the electrode is the highest. This occurs at the rising and the falling edge of the plasma pulse leading to an additional contribution to the broad band continuum at smaller wavelengths.
This hot spot is assumed to have a temperature of 20 000 K and covers only a small percentage (approx. 0.5%) of the total emitting surface area. This area is likely to evaporate due to the high local temperature. Therefore, with each discharge a small part of the tungsten tip is evaporated that explains the typical loss of the tungsten wire of 1 mm h−1 in our experiment.
Such a hot spot formation has not been reported in literature for these in-liquid discharges. The comparison of ICCD images reported from groups working with similar setups [17, 26] is challenging because higher voltages were applied and therefore a higher power input is given. The emission from the propagating plasma is proportional to the electrode voltage whereas the black body radiation is limited by the boiling temperature of the surface material. This temperature of approximately 7000 K has also been observed by Marinov et al [14], although they claimed that molecular bands could also be responsible for this continuum. This should be investigated in future experiments.
5.3. Phase III: build up of the electron densities
The lines from the hydrogen Balmer series are evaluated with respect to the various broadening mechanisms, as discussed in the second part of this paper series [31]. From this, two emission regions of the propagating plasma are identified, a trailing recombination region and a leading ionization region. From the Stark broadening of the Hα emission from the ionization region, electron densities up to 5 × 1025 m−3 are determined. Such electron densities are also typical for discharges in liquids for a wide range of pulse lengths [8, 9, 34]. The Hβ and Hγ emission is assumed to originate from the recombination region where the water ions and electrons recombine.
5.4. Phase IV: end of the pulse, field emission
At the end of the ns pulse, the plasma may have traveled a distance of approximately several micrometers or even millimeters depending on the propagation velocities. The plasma channel may correspond to an equipotential region connecting the plasma to the HV at the electrode tip in a coarse similarity to high pressure streamers. When the voltage is switched off at the end of the pulse, a high electric field will form due to space charges at the interface between electrode and liquid because the propagating plasma represents an electrical potential of +20 kV. This causes a significant distortion of the reference potential energy of the free electrons, as illustrated by the dashed line in figure 7. Now, the electrons from the electrode tip material may tunnel into the adjacent liquid and trigger an intense emission signal.
This interpretation of dominating field effects at the beginning and end of the pulse may explain the observation of emission maxima in phases of the pulse with high dV/dt and a 'dark phase' in between.
The velocity of the propagating plasma can be calculated from ICCD images (figures 12 and 13). The radii of the propagating plasma together with the evolved time yield a velocity of vpropagation = 46 km s−1 which is comparable with the propagation velocities 30 km s−1 determined by Ceccato et al [35, 36] (20 ns rise time, 40 kV applied voltage). In this study, previously formed microbubbles were observed due to Joule heating resulting from the longer rise time of the voltage pulse. Different values for streamer propagation in liquids were found by [26] with estimated streamer channel velocities of 250 km s−1 (150 ps rise time, 112 kV applied voltage). Šimek et al [17] determined propagation velocities in the order of 100 km s−1 (1–2 ns rise time (estimated, not given), 50 kV applied voltage). Lesaint [37] studied various electrode configurations and powering schemes and found propagation velocities of plasmas in liquids between a few and several 1000 km s−1. A direct comparison between all reported streamer velocities is difficult because the values were determined for different times after the ignition and the setups as well as the discharge parameters varied.
Figure 13. Sketch and ICCD image at the end of the pulse (field emission). The area of strongest emission is blackened in order to make faint structures visible. The dashed circle represents the front of the propagating plasma and the solid line indicates the position of the electrode tip.
Download figure:
Standard image High-resolution image
This explanation of the continuum emission is consistent with the different sources of emission observed in the ICCD images. The emission spectra are fitted with a dominant contribution of black body radiation which constitutes 90% of the total emission intensity. The ICCD images also indicate that most of the emission is located very close the electrode surface whereas the streamer channels appear much fainter, as can be seen in figure 13.
5.5. Phase V: beginning of bubble formation and bubble expansion
At later times after the voltage pulse, the energy dissipated by recombination leads eventually to vaporization along the plasma channel. These plasma channels, filled with hot gas, coalesce to form a spherical bubble due to the surface tension of the surrounding liquid. Cavitation occurs until a maximum bubble diameter of typically 1 mm is reached [19].
Summarizing, we postulate that the continuum emission is dominated by the hot tungsten surface, which is mainly heated by electron transfer due to field effects at the electrode–liquid interface. This heating can become localized due the contraction of the plasma to a hot spot. The characteristic black body temperatures are at the boiling temperature of tungsten of 5828 K or even higher in synchronization with the change of the tungsten pressure in front of the electrode. It is possible that this high temperature also represents the temperature of the adjacent water layer where the dissociative recombination of water ions with electrons triggers the chemistry of these plasmas. It needs to be noted, that this fluid model approach cannot resolve smaller structures or discontinuities. However, the ignition process can be explained by assuming field emission only, without the pre-existence of nanovoids. Therefore, it can be assumed, that the initial ionization process if predominantly driven by field dependent ionization.
6. Conclusion
Nanosecond plasmas in liquids are analyzed by ICCD imaging, current voltage measurements and optical emission spectroscopy. From the fitting results we postulate that the plasma phase of the initial voltage pulse is dominated by black body radiation from the hot tungsten electrode tip. At this electrode, a hot spot may also be formed that dominates the radiation at shorter wavelength during the rising and falling edge of the voltage pulse. The intensity of the emission is especially pronounced at the onset and the end of the voltage pulse with a dark phase in between. An absolute synchronization of the voltage signal and the optical signals was not achieved in this experiment and the temporal axis of the electrical and optical signals are only shifted based on finding a consistent and complete description of our experiment. If we postulate, however, that the voltage increase coincides with the increase in emission, we can explain our data by assuming that field ionization of water molecules at the beginning of the voltage pulse and excitation by electrons due to field emission at the end of the pulse is able to explain the maxima in emission separated by a dark phase in between. The surface temperature in the initial phase is typically of the order of 7000 K whereas the hot spot can reach up to 20 000 K.
It is shown that the microscopic topology of the electrode surface has an important role in the ignition process of these nanosecond pulsed plasmas with short rising times of the voltage. Furthermore, the ignition process is assumed to originate from field effects rather than from the formation of micro- or nanovoids in the liquid to allow for ignition following a Townsend avalanche. The line emission in the spectra will be discussed in the second part of this paper series to unravel the dynamics of the propagating plasma.
Acknowledgments
We would like to thank Philipp Grosse for providing the Pt/Ir tips as electrodes and for taking their SEM images. Thanks are also due to Julian Held for support in setting up the spectrometer and the helpful discussions concerning the measurements. This project is supported by the DFG (German Science Foundation) within the framework of the Collaborative Research Centre SFB 1316 at Ruhr-University Bochum.