On the Birth of Structural and Crystallographic Fabric Signals in Polar Snow: A Case Study From the EastGRIP Snowpack
 Maurine Montagnat1,2*
  Henning Löwe3
  Neige Calonne2
  Martin Schneebeli3
  Margret Matzl3 Matthias Jaggi3
- 1Univ. Grenoble Alpes, CNRS, IGE, Grenoble, France
- 2Univ. Grenoble Alpes, Université de Toulouse, Meteo-France, CNRS, CNRM, Centre d'Études de la Neige, Grenoble, France
- 3WSL Institute for Snow and Avalanche Research SLF, Davos Dorf, Switzerland
The role of near-surface snow processes for the formation of climate signals through densification into deep polar firn is still barely understood. To this end we have analyzed a shallow snow pit (0-3 meters) from EastGRIP (Greenland) and derived high-resolution profiles of different types of mechanically relevant fabric tensors. The structural fabric, which characterizes the anisotropic geometry of ice matrix and pore space, was obtained by X-ray tomography. The crystallographic fabric, which characterizes the anisotropic distribution of the c-axis (or optical axis) orientations of snow crystals, was obtained from automatic analysis of thin sections. The structural fabric profile unambiguously reveals the seasonal cycles at EastGRIP, as a consequence of temperature gradient metamorphism, and in contrast to featureless signals of parameters like density or specific surface area. The crystallographic fabric profile unambiguously reveals a signal of cluster-type texture already at shallow depth. We make use of order of magnitude estimates for the formation time of both fabric signals and discuss potential coupling effects in the context of snow and firn densification.
1. Introduction
The mechanical behavior of porous ice is controlled by different types of anisotropy. The anisotropic geometry of the ice matrix and pore space, characterized by the structural fabric, affects the macroscopic mechanical properties of snow, e.g., the elasticity tensor (Hagenmuller et al., 2015; Srivastava et al., 2016; Gerling et al., 2017). As snow is made of individual crystals of ice, another type of anisotropy comes into play that is the anisotropic distribution of the c-axis (or optical axis) orientations, characterized by the crystallographic fabric. The latter has been widely investigated for dense ice and its impact on the elastic, viscoplastic and large scale flow behaviors was shown (Nakaya and Marshall, 1954; Duval et al., 1983). Thus, a faithful mechanical description of the entire snow-firn-ice column requires understanding the origin, strength, and impact of both fabric signals.
In Antarctica and Greenland, snow transforms into firn and ice by compaction of subsequent seasonal layers whose mechanical properties may affect densification mechanisms at depth. Processes occurring in near-surface Antarctic snow have been discussed as a potential origin of different features observed at depth. The variability reported in the O2/N2 ratios in the air trapped in the deep ice might reflect local (78S) summertime insolation (Bender, 2002; Lipenkov et al., 2011). Layering of firn properties would result into layered gas trapping “artifacts” that challenge the interpretation of gas concentrations in ice cores (Fourteau et al., 2017, 2020). As a result, how features of the snow cover (heterogeneities, anisotropy, layering, etc.) are transferred to firn and ice remains a key question to improve the interpretation of paleoclimatic signals extracted from ice cores (e.g., Steen-Larsen et al., 2011; Fourteau et al., 2019) and the modeling of densification.
Anisotropy in the structural fabric of near-surface snow can be caused by temperature gradient metamorphism (Calonne et al., 2012, 2017; Löwe et al., 2013; Leinss et al., 2020). In addition, indications for the evolution of structural anisotropy under mechanical deformations was found in laboratory experiments (Wiese and Schneebeli, 2017a) and suggested by polarimetric radar measurements in an Arctic snowpack (Leinss et al., 2016). The dielectric permittivity was also used to characterize the structural anisotropy in deep firn from the dielectric anisotropy (Fujita et al., 2009, 2014). Seasonal variations were revealed, with higher structural anisotropy in summer layers. This was attributed to the stronger summer-to-autumn metamorphism causing the development of vertically oriented ice structures layers that are mechanically stiffer and less sensitive to densification in contrast to the less metamorphosed, more isotropic winter layers. Very recently, Moser et al. (2020) analyzed the structural anisotropy of snow from Kohnen Station and reported the emergence of a seasonal pattern in the anisotropy that was attributed to the impact of a stronger daily temperature gradient and higher temperatures during the transition from summer to autumn. Comparatively, density signal measured in isolated firn cores is strongly perturbed by stratigraphic noise. Laepple et al. (2016) made an extensive data set of horizontal and vertical high resolution density measurements performed along 143 snow pits at Kohnen station, Antarctica, that ended revealing a seasonal signal.
In contrast to the long history of crystallographic fabric measurements in deep firn and ice (Perutz et al., 1939; Gow and Williamson, 1976), the crystallographic fabric of snow has only recently been studied. The evolution of the crystallographic fabric of a natural alpine snow sample subjected to a temperature gradient was analyzed from thin sections (Riche et al., 2013). They reported an initial cluster-type fabric in the freshly deposited snow that evolved toward a girdle-type during controlled temperature gradient metamorphism. Later, the same method was applied to characterize the vertical profile of crystallographic fabric along a three-meter deep snowpack at Point Barnola, Antarctica, a very low-temperature and low-accumulation site (−80 to −25°C, 25 kg m−2yr−1) (Calonne et al., 2017). While no trend with depth was observed, correlations between crystallographic fabric, density and specific surface area (SSA) were found, such that weak girdle-type fabrics were measured in layers of lower density, lower specific surface area, and larger grain size. The latter observation was assumed to be the result of a preferential crystal growth mechanism during temperature gradient metamorphism.
The role of crystallographic anisotropy on the mechanical properties (and densification) of low-density snow and firn was addressed by Theile et al. (2011), Rolland du Roscoat et al. (2011), and Burr et al. (2017). Due to the complexity of the snow microstructure, the local state of stress in a loaded snow sample is strongly heterogeneous. This was shown by Schneebeli (2004) and Hagenmuller et al. (2014) for elastic applications (neglecting the crystallographic orientations of individual grains). Hagenmuller et al. (2014) highlighted the potential role of crystal orientation to determine the strength at the local scale, between two bonds. Under creep conditions, Theile et al. (2011) simulated intragranular deformations and microstructural changes and concluded a measurable impact of the crystallographic anisotropy on the densification of structurally isotropic snow. Back to polar firn conditions, recent measurements of seismic diving waves at Kohnen (Schlegel et al., 2019) indicated the necessity of quantifying the crystallographic fabric alongside with the structural fabric to evaluate uncertainties in the inversion technique giving access to the elastic moduli in firn cores.
The present work is motivated by the abundant evidences showing the need to quantify the strength and variability of both structural and crystallographic fabric signals in snow and firn. We will provide measurements and detailed analyses of both fabric signals, including their variations with depth, in the natural snowpack at the EastGRIP ice core site, Greenland. The EastGRIP site (75.6268°N 35.9915°W) is located in the vicinity of the Northeast Greenland Ice Stream (NEGIS), the sole interior Greenlandic ice stream that initiates near the summit dome. Snow surface temperatures at EastGRIP range between about −10 and −40°C. A previous analysis of shallow cores (67 m depth) at that site showed relatively stable accumulations of 110 kg m−2yr−1 in average over the past 400 years, as well as a density profile very similar to the one at NorthGRIP [Greenland, Dahl-Jensen et al. (2002)], with values ranging from about 250 kg m−3 at the surface to about 850 kg m−3 at 67 m depth (Vallelonga et al., 2014). Due to the relatively high temperatures and high accumulations at EastGRIP, a stronger impact of metamorphism, settlement and compaction on the structural and crystallographic fabric can be expected in comparison to Point Barnola (Calonne et al., 2017).
Methodologically, we relied on established means. The crystallographic anisotropy was evaluated by performing thin sections of snow (Riche et al., 2013) and using the Automatic Ice Texture Analyzer (AITA, Wilson et al., 2003). For the structural anisotropy, we performed micro-computed (contrast) tomography (microCT) (Coléou et al., 2001; Schneebeli and Sokratov, 2004), which is presently the most direct way to compute structural fabric alongside with routinely evaluated properties of density and specific surface area. Our analysis confirms that a seasonal signal emerges in the structural anisotropy and that significant cluster-type textures are appearing with depth.
The paper is organized as follows. The measurements performed along the three-meter deep snow pit are described in section 2. Section 3 presents the analysis of the microstructure and texture parameters. Finally, section 4 provides an attempt to explain the origin of the structural and crystallographic fabric signals observed in the EastGRIP snowpack.
2. Materials and Methods
2.1. Field Measurements
The data underlying this work were collected at the EastGRIP site (75.6268N 35.9915W) during a campaign conducted in May 2016 within the Greenland Climate Network (GC-Net) maintenance program. They comprise a deep profile (three meters) for excavating samples for post-campaign laboratory measurements, a shallow profile (130 cm, 300 m away from the deep profile) for standard in-situ snow measurements as a reference, and complementary automatic temperature measurements.
Three blocks of snow of one meter height were cut out from the deep pit. Figure 1 shows a near-infrared (840–940 nm) picture of the pit, showing the locations of the snow blocks and illustrating qualitatively the snowpack layering. The blocks were then transported in insulated boxes of dimensions 0.5×0.5×1 m3 to the WSL-SLF cold labs in Davos under controlled temperature conditions (−20°C). The snow samples have not been impregnated in the field and some degree of metamorphism is expected to occur during transport.
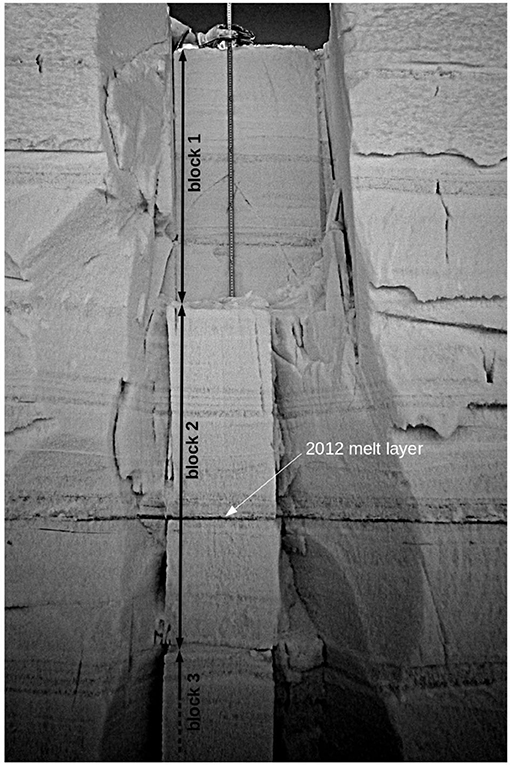
Figure 1. Near-infrared picture (qualitative) of the snow wall that highlights the snowpack layering via differences in the specific surface area. Clearly visible is the melt event from 2012 as a (low specific surface area) marker.
To further characterize the snowpack at EastGRIP, snow pit measurements of the first 130 cm depth were performed on May 24, 2016, 11 p.m. local time at the shallow pit. Density and specific surface area (SSA) profiles were obtained from box cutter measurements (Proksch et al., 2016) and IceCube measurements (Zuanon, 2013), respectively, with a 3 cm vertical resolution. The in-situ temperature profile was measured with a 5 cm vertical resolution (Figure 2).
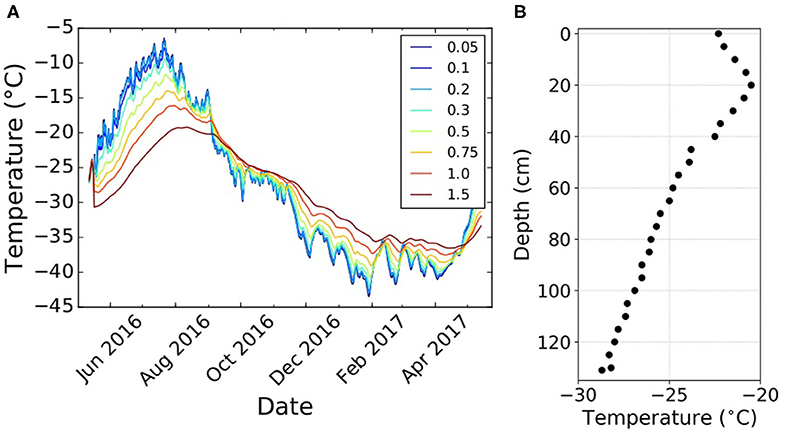
Figure 2. (A) Temperature data (Courtesy of H-C. Steen-Larsen) measured from April 2016 to March 2017 at different depths in m (legend). (B) Temperature profile of the first 1.3 m depth of the snowpack measured at EastGRIP on May 24th, 2016.
The in-situ measurements were complemented by automatic temperature data from the EastGRIP site that was provided through the EastGRIP surface measurement program (H-C. Steen-Larsen, personal communication). Automatic temperatures were measured by thermistors that were inserted into the snow the first year of the program and subsequently buried during accumulation. The measurements presented here are from May 2016 to May 2017, during which the amount of snow accumulation was evaluated between 40 and 50 cm. Available raw temperature measurements as a function of the initial sensor depths, not corrected for subsequent accumulation, are shown in Figure 2.
2.2. Laboratory Measurements
Each of the three snow blocks extracted along the EastGRIP snow pit were further sub-sampled in the laboratory for subsequent X-ray micro-computed tomography (microCT) and crystallographic orientation analyses (thin sections and Automatic Ice Texture Analysis, AITA). A schematic of the sampling procedure for both types of measurements is given in Figure 3 and further detailed below. The exact location of the thin sections along the microCT sample is known only with a precision of a few millimeters. MicroCT measurements cover the entire profile length in a continuous way, whereas thin sections are not contiguous. Each orientation data extracted from the thin section automatic analysis integrates information over the full area of the thin section (2 × 3 cm2).
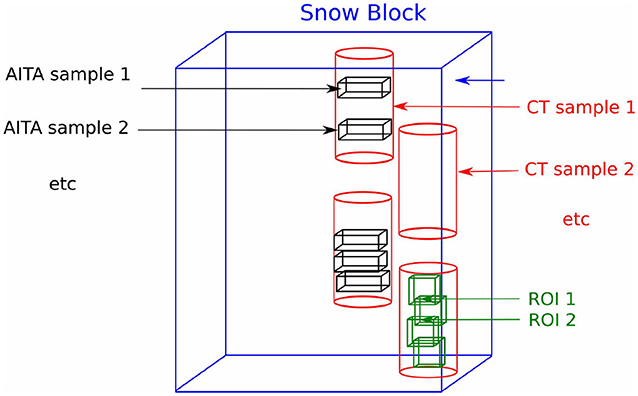
Figure 3. Schematic showing the sub-sampling of the snow blocks for co-located microCT and AITA measurements. Typical dimensions of thin sections (from AITA samples) are 30 × 20 mm2. MicroCT samples are about 60 mm height and 30 mm diameter.
2.2.1. Micro Computed Tomography Measurements
The microCT analysis was performed to obtain 3-D images of the snow microstructure and to derive the structural parameters. For that, two lines of parallel sampling were made from bottom to top along each of the one-meter-long snow block, in order to provide a 50% overlap between the samples, except at the transition between the one-meter-long blocks. Each sample had a diameter of about 30 mm, and a height of about 60 mm. The microCT analyses were performed in a micro-CT 40 scanner from ScancoMedical located in a cold-room at -15°C. After reconstruction the gray-scale images were filtered by a Gaussian filter (sigma = 1.5, support = 2) to remove the image noise, and segmented by using a fit of the histogram to three Gaussians as detailed in (Hagenmuller et al., 2013). The images have a voxel size of 18μm. By analyzing the microCT samples vertically in a moving region of interest (ROI) analysis (cubic window of 400 × 400 × 400 voxels), continuous profiles of density, specific surface area and structural anisotropy were obtained. Immediately after the microCT scanning, each cylindrical sample was impregnated with diethyl phthalate (CAS No. 84-66-2) in a cold room at −4°C (Heggli et al., 2009) and kept at −60°C until thin sectioning.
2.2.2. Ice Texture Measurements
Distributions of c-axis crystallographic orientations (also called crystallographic fabrics or textures) were measured on thin sections of snow made along the impregnated microCT samples, following the technique described in Riche et al. (2012). Operating in a -15°C room, two to four thin sections were extracted from one microCT sample. Thin sections were cut and thinned down to a thickness of about 100 μm and were about 30×20 mm2 in dimension. Most of them were cut vertically, compared to the microCT cylindrical sample, and therefore along the snow pit vertical (see Figure 3).
The c-axis crystallographic orientations were measured using the AITA, as performed in Riche et al. (2013) and Calonne et al. (2017). The analyzer provides the c-axis orientation ck of every pixel k over the thin section surface. In our case, a pixel had a size of 10 μm and the entire area of the thin section was mapped.
Each orientation ck is defined in a spherical coordinate system by an inclination θk (angle in the vertical plane between 0 and 90°) and an azimuth ϕk (angle in the horizontal plane between 0 and 360°) given in a local reference frame R with the third axis perpendicular to the thin section. The expression of ck in this reference frame is:
Orientation measurements are provided together with a quality factor ranging from 0 to 100 for each pixel. Only pixels with a quality factor higher than 70 were considered here (Peternell et al., 2011). This automatically removes the non-ice pixels surrounding snow grains. To ensure that the samples are representative, analyzed thin sections contained at least 100 snow crystals.
2.2.3. Structural Fabric From microCT Data
Different types of structural fabric tensors can be computed from a two-phase microstructure (Moreno et al., 2014) to characterize the anisotropic distribution of ice and air in snow. For instance in Srivastava et al. (2016) a fabric tensor was computed from the mean intercept length to infer the stiffness tensor of snow. In the following, we used a definition of an orientation tensor that is based on the two-point correlation function of the microstructure (Löwe et al., 2013; Calonne et al., 2015; Leinss et al., 2016). Under the assumption of transverse isotropy and ellipsoidal symmetry of the correlation function, the structural orientation tensor takes the form
where ϵ = lz/lxy is the ratio between the vertical and horizontal correlation lengths obtained from the two-point correlation function. The function Q(ϵ) is explicitly given in Löwe et al. (2013, Equation 3). In this representation it follows that Tr(A(2)) = 1 with eigenvalues given by . As outlined in Torquato (2005, Chapter 17), “needle shaped microstructure” (i.e., preferential vertical orientations) correspond to (for ϵ → ∞) while “penny shaped microstructures” (i.e., preferential horizontal orientations) correspond to (for ϵ → 0). Practically, these extreme cases are never reached in snow where anisotropy values seem to be bounded by 0.7 < ϵ < 2.1 (Leinss et al., 2020). To characterize the structural fabric via Q(ϵ), the two-point correlation function C(r) was calculated from segmented tomography images following Löwe et al. (2013) by means of fast Fourier transformation, and fitted to exponentials Cβ(r) = Cβ,0exp(−r/lβ) along the coordinate axes β = x, y, z (z being the vertical direction along the snow pit). This procedure yields the correlation lengths lz and lxy = (lx + ly)/2, their ratio ϵ = lz/lxy and the orientation tensor via Equation (2).
2.2.4. Crystallographic Fabric From AITA Data
From the c-axis orientation measurements (Equation 1), a quantitative evaluation of the texture can be performed by means of the second order orientation tensor a(2) and its eigenvalues as in e.g., (Thorsteinsson et al., 1997). The second order orientation tensor is defined as
with Np the total number of pixels over which ck is calculated, and ⊗ the tensor product. By construction, a(2) is symmetric and a symmetry reference frame exists in which a(2) is diagonal. Let , , and denote the three corresponding eigenvalues that satisfy and . These eigenvalues correspond to the length of the axes of the ellipsoid that best fits the distribution of the c-axis orientations. Three classical types of texture can be defined that are (1) the isotropic texture with c-axes oriented randomly in all directions leading to , (2) the girdle texture with c-axes oriented randomly within a preferential plane, , and (3) the cluster texture with c-axes oriented toward one direction and .
In the following, the eigenvector direction, and the associated eigenvalues, are represented in the c-axis pole figure (stereographic projection of c-axes) for each thin section. The pole-figures are plotted in the plane of the thin section (see e.g., Figure 4).
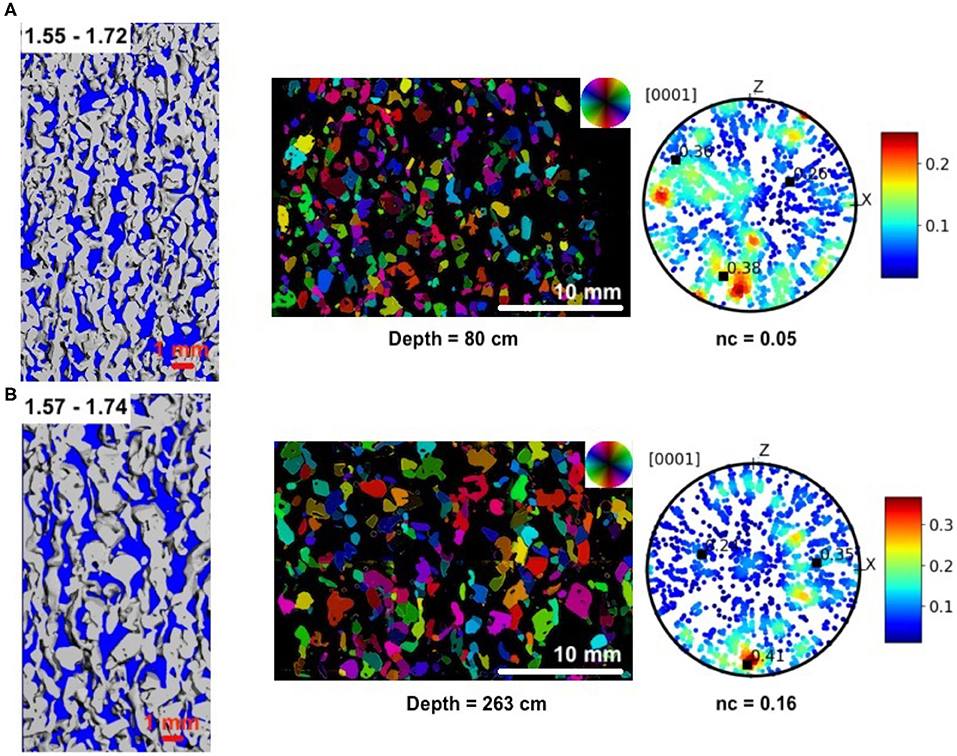
Figure 4. MicroCT structure, microstructure and c-axis pole figure from samples extracted at 80 (A) and 263 (B) cm depth along the EastGRIP snow pit. The thin section was made in the microCT sample. A range of ϵ values is given in the microCT structure. The figures of microstructure are color-coded with the colorwheel that represents orientations of the c-axis. On the pole figures, 5,000 pixels are plotted. The black squares correspond to the location of the eigenvectors of a(2), and the associated eigenvalues are given. nc is the cluster index. The z-axis is the same for the three images.
As in Calonne et al. (2017), and following (Fisher et al., 1987), we defined the girdle index (the higher, the more girdle-type is the texture) and the cluster index (the higher, the more cluster-type is the texture).
3. Results
3.1. Overview
The following Figures 4–6 illustrate the snow microstructure (vertical slices from the microCT images and associated range of ϵ values) and the crystallographic fabric (c-axis orientation maps and associated pole figures) obtained at some representative depths along the three-meter deep snow pit. Note that due to the sampling procedure (cf. section 2.2) the match between microCT images and thin section areas analyzed by AITA is not exact. Thin section areas are nevertheless always located within the microCT sample volume.
A large part of the snowpack is characterized by medium to strong structural fabrics, as it can be detected on some of the microCT images showing a chain-like structure of the ice matrix, and with ϵ values larger than 1.2. This is the case for snow at 80 cm and 263 cm depth, shown in Figure 4, for which ϵ values are as high as 1.7. The weakest structural anisotropy is mostly found in the upper part of the pit, as shown in Figure 6 (a) with an example from a sample extracted at 28 cm depth, with ϵ close to 0.8.
In contrast to what was observed in previous similar analyses performed on natural snow cover from Antarctica (Point Barnola) (Calonne et al., 2017) or the Alps (Riche et al., 2013), many thin sections show a (crystallographic) texture with a significant c-axis clustering. For the two examples shown in Figure 5, the crystallographic anisotropy is characterized by an eigenvalue of the second order orientation tensor as high as 0.68 and a strong cluster indexes of up to 1.4. Similar values were found at a depth of about 1,000 m along the Greenlandic NEEM ice core (Montagnat et al., 2014). The cluster positions on the pole figures (see e.g., Figure 5) reveal that their direction is very close to 0° or 180° (North or South) with a low inclination. As thin sections were cut out vertically, those cluster-type textures correspond to c-axes mostly oriented closed to the vertical. At a few specific depth, variability within the height of one single thin section (2 cm) is observed and the resulting eigenvalues thus reveal an “average” texture over a non-homogeneous vertical extent (see Figure 6).
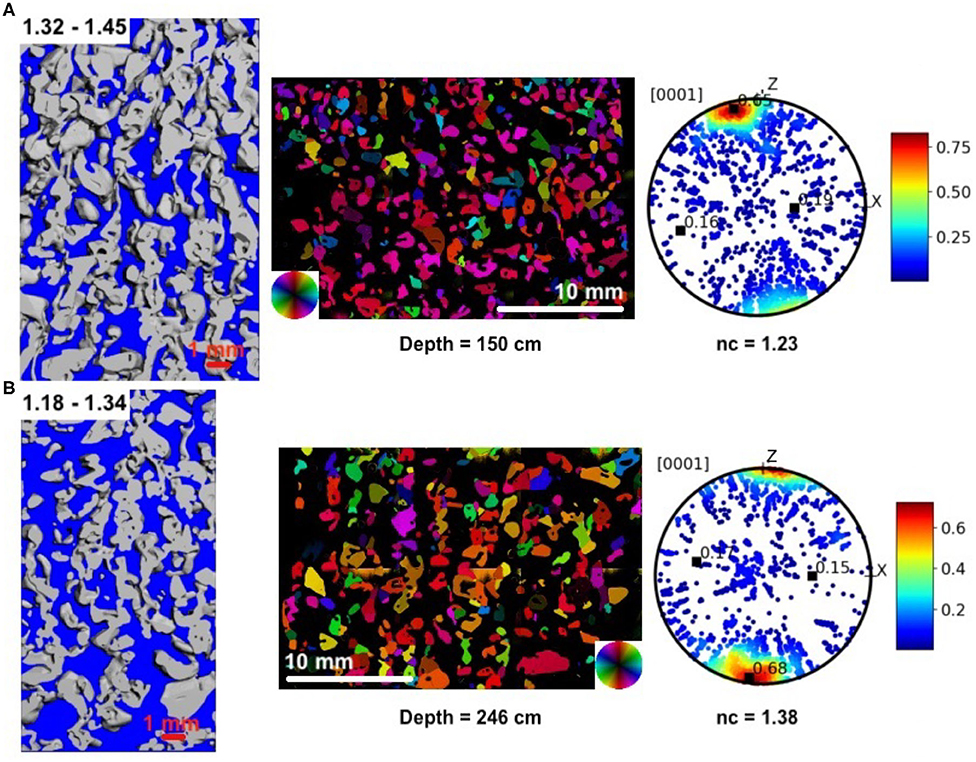
Figure 5. MicroCT structure, microstructure and c-axis pole figure from samples extracted at 150 (A) and 246 (B) cm depth along the EastGRIP snow pit. The thin section was made in the microCT sample. A range of ϵ values is given in the microCT structure. The figures of microstructure are color-coded with the colorwheel that represents orientations of the c-axis. On the pole figures (right), randomly picked 5,000 pixels are plotted. The black squares correspond to the orientation of the eigenvectors of a(2), and the associated eigenvalues are given. nc is the cluster index. The z-axis is the same for the three images.
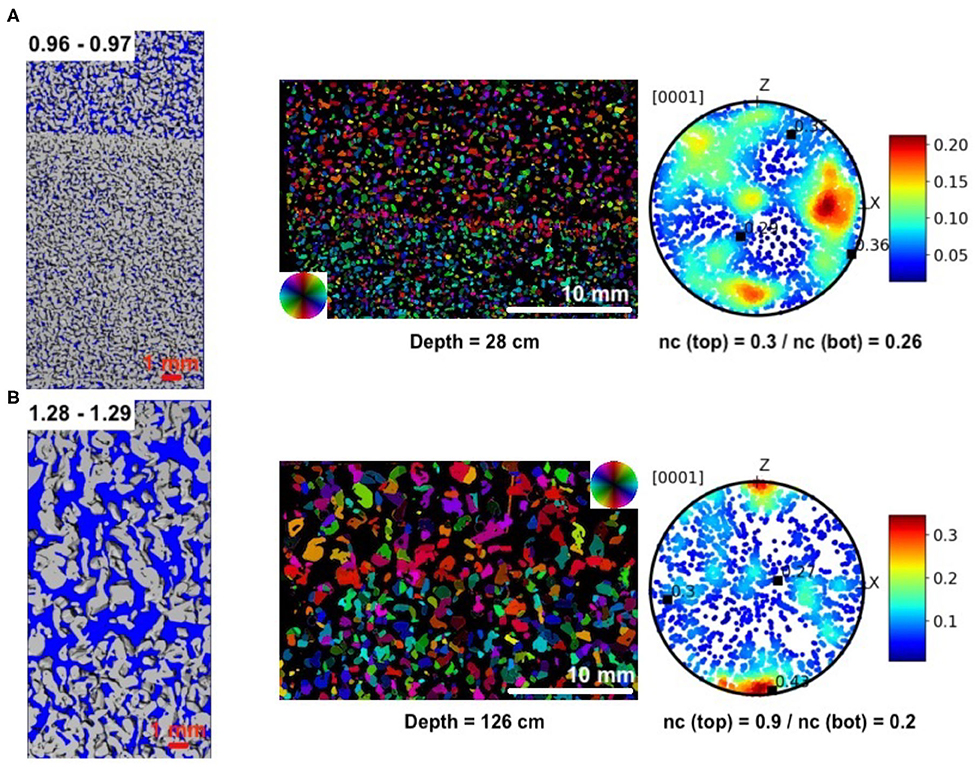
Figure 6. MicroCT structure, microstructure and c-axis pole figure from samples extracted at 28 (A) and 126 (B) cm depth along the EastGRIP snow pit. A corresponding range of ϵ values is given in the microCT structure. The figures of microstructure are color-coded with the colorwheel that represents orientations of the c-axis. On the pole figures, 5,000 pixels are plotted. The black squares correspond to the location of the eigenvectors of a(2), and the associated eigenvalues are given. nc is the cluster index. The z-axis is the same for the three images.
3.2. Structural and Crystallographic Fabric Profiles
As the main result of the present study, we provide the vertical profiles of all the structural and crystallographic parameters in Figure 7.
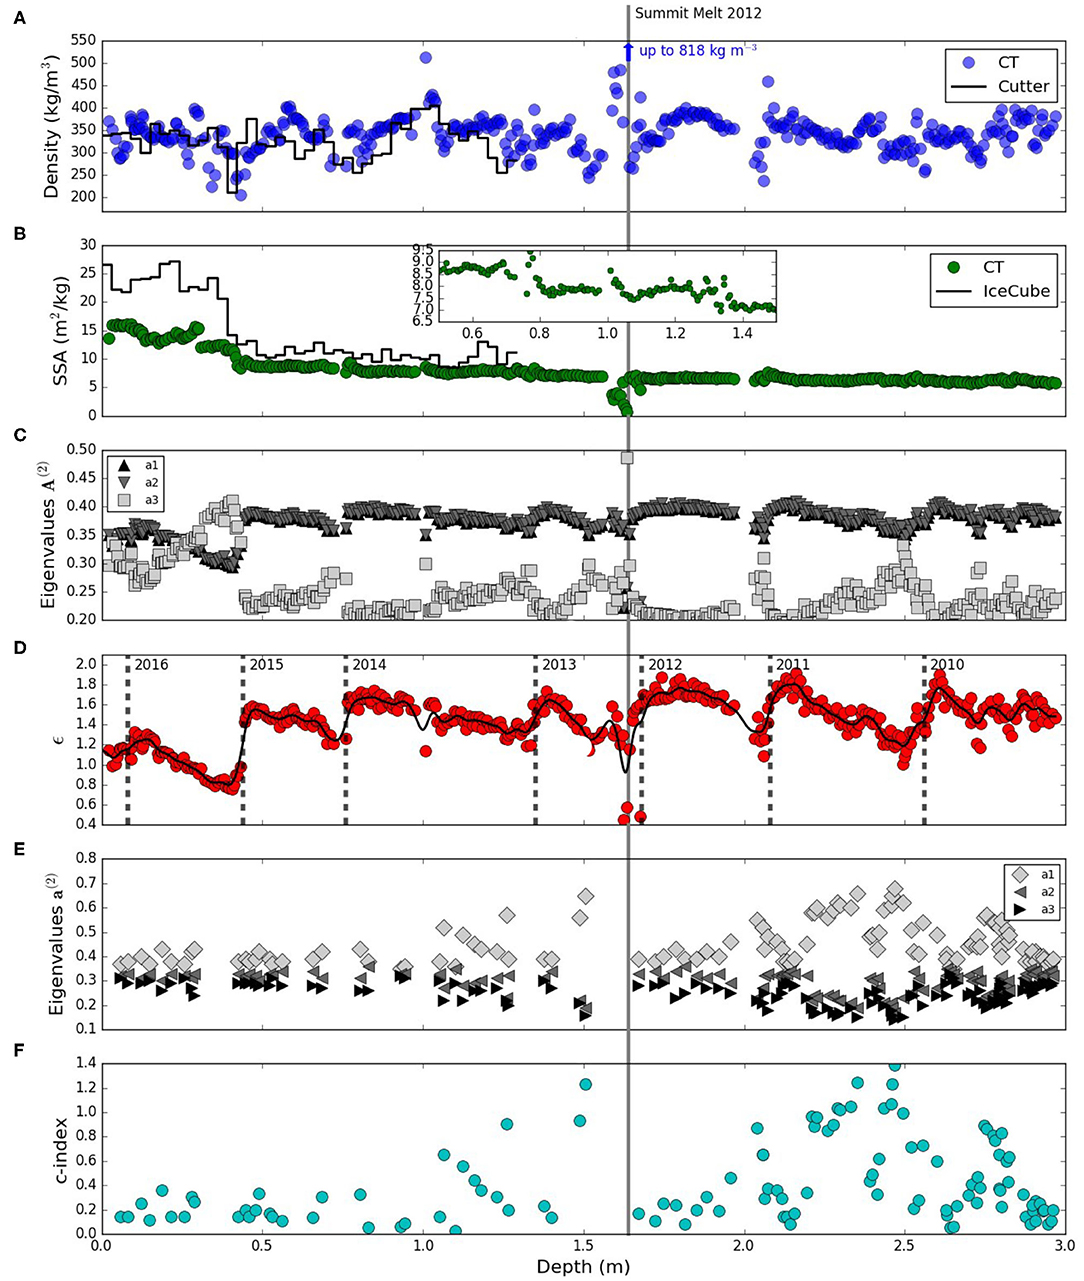
Figure 7. Structural and crystallographic signals extracted from microCT and AITA from the snow profile taken at EastGrip. (A) Density (kg m−3). (B) Specific Surface Area (m2 kg−1). (C) Eigenvalues of the structural fabric tensor A(2). (D) Ratio of the vertical and horizontal correlation lengths. (E) Eigenvalues of the second order orientation tensor a(2). (F) Cluster index nC. The figure is complemented by a marker for the 2012 melt event and several anisotropy markers [2016-2011 in (D)] that correspond to the early summer season of the respective year (for details cf. text).
In view of traditionally used snow parameters like density or specific surface area the snow at EastGRIP is unremarkable. The density (Figure 7A) shows a rather typical behavior of highly fluctuating values around an average density of about 370 kg m−3 without any apparent trend with depth in these first three meters, as expected for this location (Schaller et al., 2016). Most values are between 250 and 450 kg m−3. The 2012 Greenland surface melt event is easily identified in a depth of around 1.64 m where the density reaches 818 kg m−3. The in-situ density profile from cutter measurements, from the nearby snow pit, matches rather well with the microCT data, showing similar stratigraphic features in the first 1.3 m.
The profile of specific surface area (Figure 7B) shows a drop from near surface values of 15 m2 kg−1 to about 8 m2 kg−1 in the first 0.5 m. Below, specific surface area decreases more smoothly with depth, reaching about 6 m2 kg−1 at 3 m. The in-situ IceCube measurements show a similar sharp decrease with depth in the first meter. Specific surface area values are however systematically higher than the ones from microCT, especially in the first 0.4 m (about 25 m2 kg−1 vs. 15 m2 kg−1). Similar deviations were reported in Calonne et al. (2019), suggesting possible biases in the specific surface area measurement methods. In our case, the deviations might have been likewise caused by equi-temperature metamorphism in the snow blocks during transport and storage, leading to a specific surface area decrease, the higher the initial specific surface area, the higher the evolution rate.
In contrast, the structural fabric profile (Figure 7D) reveals an interesting signal with depth, where characteristic (saw-tooth-like) up-and-down variations are observed. These variations become more apparent when the data is smoothed (Gaussian filter with σ = 14 cm black line in Figure 7D): the structural anisotropy repeatedly shows abrupt increases followed by areas of gentle decrease with depth. The anisotropy signal can be used to define seasonal markers (Moser et al., 2020). To this end vertical dashed lines have been manually added at the locations of steepest increase of the anisotropy with depth. From the date the profile was taken (May 24 2016) and from the date of the 2012 melt event (early July), the observed offset of the (2016, 2012) markers from the surface and the melt-event, respectively, indicates that the steepest gradient of the anisotropy signal is created in the early summer season. Overall, these annual anisotropy markers are consistent with the thickness of mean annual layers of about 27 cm (given an average snow density of about 370 kg m−3, and an average accumulation rate of 100 kg m−2yr−1).
The crystallographic fabric are shown in Figure 7F. Whereas, cluster indexes in the first meter are low (below 0.4) and little-scattered, indexes from 1 to 3 m depth strongly fluctuate and reach high values up to 1.4 (corresponding to eigenvalues of 0.7). A clustering trend is observed in the depth interval 1–1.5 m depth (above the melt-refrozen layer) as well as in the interval 1.7 to 2.5 m depth. In contrast, no significant evolution and trend are observed in the girdle index (not shown). For comparison, the eigenvalues of the structural and crystallographic fabric (eigenvalues) are shown in Figures 7C,E.
4. Discussion
4.1. Near-Surface Signal of Structural Anisotropy
A key finding of the present study is a clear seasonal signal in the structural fabric (anisotropy) in the first three meters of snow at the EastGRIP site. This is in agreement with observations in the snowpack at Kohnen, Antarctica, that were recently published by Moser et al. (2020). The seasonal variations in the structural anisotropy emerge as a characteristic, asymmetric saw-tooth signal (Figure 7D) where the timing suggests that the steep edge is imprinted into the profile in early summer.
To quantify the expected range of anisotropy variations we have forced the model from Leinss et al. (2020) with the measured temperatures (Figure 2) in the absence of settling assuming a constant accumulation rate (presented in Appendix A). The results suggest that the order of magnitude of the structural fabric variations (seasonal jumps in ϵ of up to 0.3) can be well-explained by variations in the vapor flux during temperature gradient metamorphism caused by observed temperatures (cf. Appendix A and Figure 8A). The vapor flux is proportional to the temperature gradient and increases with temperature according to the temperature dependence of the equilibrium vapor pressure. The results shown in Appendix A and Figure 8B also indicate that for a realistic mean surface velocity ḃ = 0.3 m yr−1 (corresponding to a mean density of 370 kg m−3 and an accumulation rate of 100 kg m−2yr−1) the 4 peaks occurring in the structural anisotropy in the first 1.5 m (cf. Figure 7D) can be recovered.
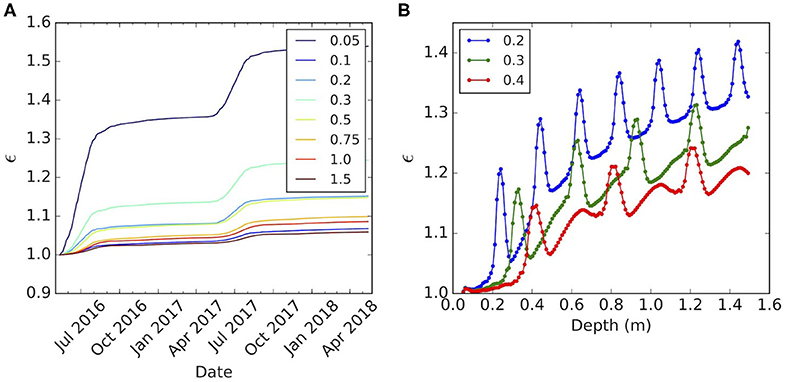
Figure 8. (A): Modeled evolution of the structural anisotropy ϵ over 2 years with temperature and temperature gradient time series taken from the EastGRIP field measurements at fixed depth in m (legend). (B): Modeled anisotropy profile using spatio-temporal interpolation of the measured temperatures and gradients for different (constant) accumulation rates in m/year (legend). The start of the time series in (A) and the surface (B) corresponds to May 12. For details see text.
The asymmetry of the saw-tooth-pattern is however not explained by the model when neglecting settling and seasonal variations in the accumulation rate. Figure 8B reveals the subtle impact of the accumulation rate on both, absolute magnitude and variability of the structural anisotropy with depth, even when using a constant accumulation throughout the year. The accumulation rate determines the timing and duration at which a material element, previously located at the surface, is advected through the (anisotropy forming) heat wave into the sub-surface. Accordingly, when the accumulation rate exhibits seasonality too, it can be expected that a lag between the maxima of temperature/temperature gradients (anisotropy forming period) and the maxima of accumulation (anisotropy burial period) contributes to the signal shape. To assess the seasonality of accumulation at EastGRIP, we considered re-analyses data from the model MAR (Modèle Atmosphérique Régional) (Fettweis et al., 2020) for the monthly averaged precipitation at EastGRIP over the period 1979–2018. The averaged precipitation for the period of interest (2009–2017) is included in Appendix B, Figure 9 suggesting a seasonal pattern in accumulation around an annual average of about 96 mm water equivalent (w.e.) (~ 8 mm w.e per month). Comparing Figure 9 with Figure 2 confirms that the maximum firn temperatures and temperature gradients (July) coincide with low accumulation in summer, and that the temperature maxima lag ~2 months behind the accumulation maxima in fall.
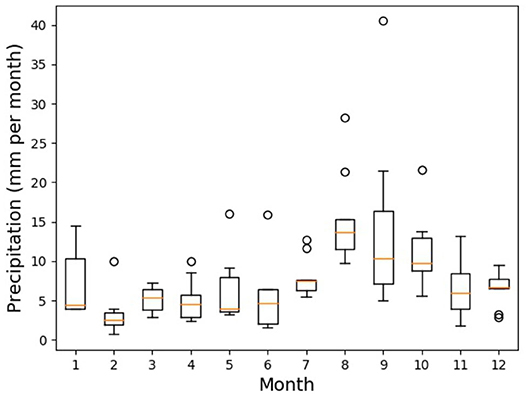
Figure 9. Precipitation at EastGRIP obtained from model MAR re-analyses. Statistics over the period 2009–2017.
From the considerations of the accumulation rate and from the results of the model above, we suggest the following mechanism for the creation of the asymmetric saw tooth pattern in anisotropy at EastGRIP: The steep edge is formed at the surface in early-to-mid summer as a consequence of three mechanisms. (i) The increase of temperatures and gradients in the sub-surface that considerably increase the rate of anisotropy formation, consistent in order of magnitude with Leinss et al. (2020). (ii) The onset of diurnal temperature variations in spring that likely inhibit anisotropy formation close to the surface due to alternating gradients at daily frequency. Such metamorphism under alternating gradients is known to lack common features of depth hoar formation (Pinzer and Schneebeli, 2009), even for high gradient magnitudes. But diurnal gradients may still effectively contribute to a reduction of the anisotropy through settling (Leinss et al., 2020). (iii) Lower summer accumulation which leaves the surface snow in conditions (i) and (ii). Later in the year, through increase of accumulation, the generated steep edge of the saw-tooth is buried without significant change in shape (steep edge still visible in the second cycle in (cf. Figure 7D) but with an overall gentle increase under the influence of persistent, seasonal temperature gradients. The latter shifts the anisotropy signal toward higher values by repeated metamorphism of consecutive years. Clearly, a confirmation of the hypothesized interplay of mechanisms would however require the implementation of all potential processes in a single model.
In our data, the initially imprinted asymmetric saw tooth is preserved down to the depth of 3 m corresponding to 6 year old snow. It is interesting to note that Fujita et al. (2014) reported measurable variations in the structural anisotropy down to a depth of 26 m in the NEEM firn using dielectric methods. Since our structural anisotropy parameter ϵ can be directly used to compute the dielectric anisotropy (Leinss et al., 2016) these findings are linked by exactly the same parameter. Fujita et al. (2014) attributed the signal as remainders of summer-to-winter variations in near-surface metamorphism, which would be consistent with our findings. It must be noted though, that at NEEM the details of accumulation, temperature and seasonality are different. Kuramoto et al. (2011) reported that the deposition during the November-July period is greater than during July-October period by 10–20 mm w.e. (expressed here as a mass balance) for a mean annual mass balance of 176 mm w.e. An important conclusion drawn by Fujita et al. (2014) for NEEM was the preservation of the insolation-sensitive structural fabric signal all the way to the pore close-off. To assess the fate of the structural anisotropy in deep firn however requires to discuss the structural fabric alongside with the crystallographic fabric which is known to influence deep firn densification.
4.2. Near-Surface Signal of Crystallographic Anisotropy
In addition to the structural fabric signal, we also find indications of a crystallographic signal in the EastGRIP snow. Marked cluster-type textures are visible along the snow pit and occur more frequently with depth, with eigenvalues that locally exceed 0.6 in the last two meters. This contrasts with the measurements performed at Point Barnola, Antarctica (Calonne et al., 2017), where only weak girdle-type textures were observed along a similar three-meter deep snow pit (Tmean ~ −40°C). In addition, the significant anti-correlation of the crystallographic fabric (girdle-type) with density observed along the Point Barnola snow pit is absent here at EastGRIP.
Two hypotheses could explain the occurrence of clustered textures in the snowpack, namely (i) the temperature gradient metamorphism, at temperature conditions encountered in EastGRIP (Tmean ~ −20°C), favors a cluster-type texture or (ii) at the temperature conditions of EastGRIP, compression creep can not be neglected anymore and, within some specific layers, conditions could favor individual grains to rotate toward the vertical because of dislocation motion under a local stress resulting from the vertical overburden stress.
The first hypothesis can be tested by comparing the EastGRIP snowpack texture with the one measured during temperature gradient metamorphism experiments performed by Riche et al. (2013) on a natural alpine snowpack at a mean temperature of −20°C and under a constant gradient of 50 °C m−1 (bottom temperature: −15°C; top temperature: −25°C). The texture evolved from an initial cluster-type fabric toward a weak girdle-type for a low-density natural snow sample. Thus, although the temperature and temperature gradient conditions in the EastGRIP snowpack are close to the conditions of these experiments, the texture evolution differs. The main differences between (Riche et al., 2013) experiments and the EastGRIP snowpack conditions are two-fold. First, the first 20 cm of the EastGRIP snowpack encounter temperatures higher than -10°C during the summer period, i.e., about 3 months. Around −10°C, there is a transition in ice crystal growth from a preferential prismatic growth to a preferential basal (c-axis) growth (Nakaya and Marshall, 1954; Lamb and Scott, 1972). From Calonne et al. (2017), one could expect these conditions to favor the growth of grains with c-axis oriented parallel to the temperature gradient (i.e., basal faces perpendicular to the vapor flux). Given that the temperature gradient is vertical, cluster-type fabric with c-axes oriented vertically would then developed preferentially. However, if this short duration of a cluster-favored temperature gradient metamorphism was sufficient, it would result in a positive correlation between structural anisotropy and cluster index (Riche et al., 2013; Calonne et al., 2017). This correlation is not observed, as pronounced structural anisotropy are found below 0.4 m depth (ϵ > 1.2) whereas cluster index shows larger values only from 1 m depth and below. Second, whereas Riche et al. (2013) studied the effect of a constant temperature gradient during 3 months, the intensity and direction of the temperature gradient at EastGRIP vary with time due the seasonal temperature oscillations. The impact of an alternating gradient (diurnal oscillations) on snow microstructure was studied recently by Wiese and Schneebeli (2017b) but no analysis of crystallographic orientations was done. Overall, a firm conclusion about the role of temperature gradient metamorphism in the development of the observed cluster-type texture is presently not possible and confirming or rejecting this hypothesis would require further dedicated experiments.
The second hypothesis is based on the observation that the number of cluster-type textures increases with depth. In natural, slow deforming ice this type of cluster texture can be explained by dislocation-induced deformation under compression (Alley, 1988, 1992). Although the density at the surface and the mean overburden stress is relatively low, the stress distribution in snow is expected to be broad (Theile et al., 2011). Accordingly, the load bearing fraction of the microstructure exhibits significantly higher stresses than the mean (Schneebeli and Sokratov, 2004), in particular if grains are connected by small necks (Hagenmuller et al., 2014). Depending on the structural fabric of the layer, the strength and viscosity are expected to vary significantly impacting local stress concentrations (Wiese and Schneebeli, 2017b). In particular, we expect layers with a high vertical structural anisotropy to be stiffer to viscoplastic deformation under a vertical load, relative to the surrounding more isotropic layers. The following hypothesis is therefore based on the picture of a layered snowpack, where the induced strain is vertically heterogeneous and concentrated in layers with a low structural anisotropy.
To assess the potential impact of stress on texture formation in these layers we have conducted an order-of-magnitude estimate for the conditions encountered in the EastGRIP snowpack in Appendix C. By employing the so called Sachs approximation (Sachs, 1928), we computed the rotation of independent grains under a vertically homogeneous compressive stress corresponding to the weight of two-meters of snow with an average density of 350 kg m−3. The rotation is computed from the stress-induced motion of dislocations following (Alley, 1988) and taking into account the temperature dependant dislocation velocity measured by Shearwood and Whitworth (1991). By considering the above mentioned local stress enhancement as estimated in snow, we show that an ensemble of independent grains evolves toward an anisotropic texture similar to the one measured along the EastGRIP snow pack [ ~ 0.6] after about 3,000 to 4,000 days (~ 8–11 yrs) in the temperature conditions of EastGRIP (see Appendix C and Figure 10). By doing the same modeling for colder temperature conditions (−40°C), no anisotropic texture could be generated. From Alley (1988) a texture characterized by an eigenvalue of 0.6 would correspond to a accumulated compressive strain of about 25%. The measured variation of density between adjacent layers can be as high as 100 kg m−3 (average density of 370 kg m−3), and are therefore not incompatible with a creep driven local densification of 25%. Although a clear correlation could not be established owing to the limited numbers of texture measurements, the highest cluster indexes are found in layers characterized by a low structural anisotropy. This is coherent with the assumption of isotropic layers being more compliant to compressive stress than stiffer layers which are characterized by a strong vertical anisotropy.
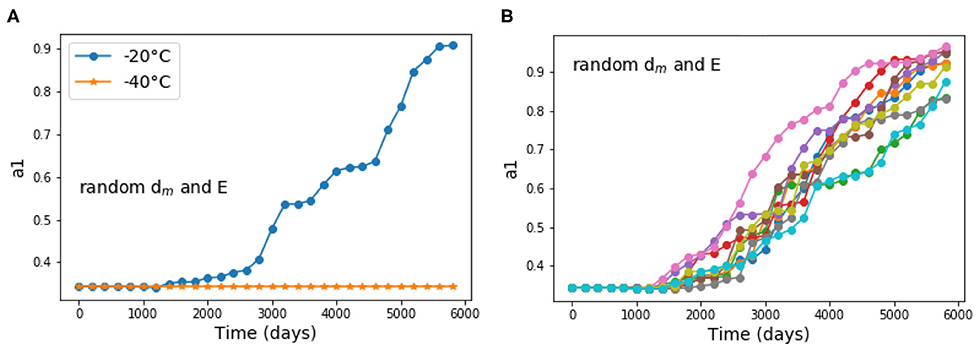
Figure 10. Modeled evolution of as a function of time, based on 1000 random initial orientations, following the homogeneous stress hypothesis (Sachs), with initial density varying randomly between dm(min) and dm(max) (Table A1) and stress concentration E varying randomly between 1 and 10. (A) Comparison between the two temperature conditions of Point Barnola (−40°C) and EastGRIP (−20°C) for on single run. (B) Ten runs performed for EastGRIP conditions (−20°C). No variation between the runs is observed for Point Barnola conditions.
This order-of-magnitude estimate shows that for the temperature conditions of EastGRIP, the overburden stress imposed by the upper two-meter snow column could activate dislocations in individual grains in some layers to an extent that induces significant crystallographic rotations after only 8 to 11 years. The resulting modeled textures are coherent with the textures measured in the third meter of the EastGRIP snowpack. That such a clustered texture is not observed at Point Barnola (Calonne et al., 2017) is consistent with the fact that plastic deformation is very dependent on temperature, and therefore no rotation is predicted at very low temperatures. This simple model predictably fails to predict the c-axis rotations at higher density for which interactions between neighboring grains must be taken into account. By neglecting the effect of strain incompatibilities between grains, the Sachs hypothesis considered here is expected to overestimate the kinematic of crystallographic rotations (Castelnau et al., 1996). In addition, metamorphism-induced recrystallization, grain re-arrangement and heterogeneous densification contribute to the evolution of microstructural (structural and crystallographic) heterogeneities [see for instance Fujita et al. (2009)] that would require to be represented by means of a full-field approach.
4.3. The Necessity of Quantifying Both Fabric Tensors
Considering the ice matrix as (i) an isotropic polycrystal arranged in a geometrically anisotropic structure or as (ii) an anisotropic polycrystal arranged in a geometrically isotropic structure lead to the same result: the homogenized mechanical properties are anisotropic. Whereas the structural anisotropy naturally dominates at the surface, in deep ice cores only the crystallographic anisotropy remains. In the snow-firn column in between, both types of anisotropy occur and their relative strength must be quantified for a faithful mechanical modeling.
Deep in the firn, the dense and (structurally) isotropic structure is expected to weaken the effect of local stresses on the mechanical behavior. Grain boundary migration mechanisms associated with normal grain growth, which govern the microstructure evolution in firn (de la Chapelle et al., 1998), likely reduce the anisotropy inherited from metamorphism. Both mechanisms (densification and normal grain growth) favor evolution toward a weaker structural and a weaker crystallographic anisotropy with depth (Montagnat et al., 2011; Calonne et al., 2019).
Despite a reduced structural fabric anisotropy with depth (Calonne et al., 2019), the layered structure of the snowpack inherited from anisotropy variations may still survive and impact the lock-in zone characteristics (thickness and depth) down to the close off depth (Fujita et al., 2009, 2014; Gregory et al., 2014; Fourteau et al., 2019). In particular, the existence of a seasonal signal in the structural fabric strengthens the interpretation of Gregory et al. (2014) that hypothesizes an impact of the microstructure on the lock-in processes. Also, the interaction between a layered structure of the snow pack and the development of a cluster-type crystallographic fabric, as suggested here, tends to confirm the hypothesis of Fujita et al. (2014) about the role of the layering on the close-off mechanisms.
Among the many firn densification models (Lundin et al., 2017), the approach developed initially by Arnaud et al. (2000) is based on a mechanical description that utilizes the idea of a densification mechanisms by grain boundary sliding in the upper snow cover (density lower than 550 kg m−3), as first suggested by including the seasonal variations, however suggests that other geometrical-structural aspects may influence the effective (compactive) viscosity of snow, accompanied by the layering. Our result indicate that viscoplastic deformation occurs in low density snow and induces crystallographic fabric anisotropy, while firn models mentioned above integrate either grain boundary sliding (Arnaud et al., 2000) or diffusion creep (Arthern et al., 2010) that do not produce any crystallographic rotation. These later mechanisms are used for the purpose to introduce an artificial grain-size (microstructure) dependence in the densification law. Most firn models are following a single layer and the evolution of its properties with depth without considering the layering structure of the snow and firn column. Our results also highlight that the imposed surface conditions result into a strong structural layering of the snowpack (down to 3 m, ρ ≤ 450 kg m−3). This layering impacts snow metamorphism under varying temperature gradients, but also induces a heterogeneous response to the overburden load. The fact that these aspects are not taken into account in firn models are partly compensated by the use of many adjustable parameters. This strategy partly prevents firn models to converge toward an “universal” firn description able to represent various densification conditions (Lundin et al., 2017).
5. Conclusions
In this work, we analyzed the microstructural characteristic of snow along a three-meter deep pit from the EastGRIP site, Greenland. These characteristics were derived from two signals influencing the mechanical processes during snow and firn densification. The structural anisotropy was retrieved from continuous X-ray microCT evaluation of the ice and pore matrix. The crystallographic anisotropy was evaluated by optical measurement of ice crystal orientations on regularly-spaced thin sections. The key results obtained are the following:
• In contrast to parameters like density or specific surface area, the structural fabric profile unambiguously reveals the seasonal cycles at EastGRIP.
• The crystallographic fabric reveals some strong cluster-type textures at shallow depth, that were not observed in the Antarctic Point Barnola snowpack (Calonne et al., 2017).
• Model-based arguments suggest that the asymmetric saw-tooth pattern in the structural anisotropy is imprinted into the signal by the interplay of accumulation and near-surface metamorphism through diurnal and seasonal temperature gradients.
• The emergence of a cluster-type crystallographic fabric at shallow depth can be roughly reproduced by a simplified viscoplastic modeling approach (homogeneous stress approximation) which is supposed to apply preferentially in soft layers.
• Current firn modeling may benefit from an improved representation of the snowpack to predict the layering of the compaction viscosity from both structural and crystallographic anisotropy.
Data Availability Statement
The datasets generated for this study are available on request to the corresponding author.
Author Contributions
MMo, HL, and NC co-treated the results and wrote the paper together. MMo made the AITA measurements and analyses. MMo, NC, MJ, and MMa made the microCT measurements. HL made the analyses of microCT measurements. NC and MS did the field work, field measurements, and field preparation of the snow blocks.
Funding
The Swiss Federal Institute for Forest, Snow, and Landscape Research WSL provided a research fellowship to MMo during her 1 year stay in WSL-SLF, Davos (2016-2017). NC was supported by grant 152845 from the Swiss National Science Foundation and by the WSL-project 201612N1411. This work benefited from support from the INSIS and INSU institutes of CNRS and from a grant from Labex OSUG@2020 (ANR10LABEX56). Field work in EastGRIP benefited from the financial support of US-NSF, NASA, and WSL-SLF within the frame of a Greenland Climate Network (GC-Net) maintenance program.
Conflict of Interest
The authors declare that the research was conducted in the absence of any commercial or financial relationships that could be construed as a potential conflict of interest.
The reviewer SL declared a past co-authorship with one of the authors HL to the handling editor.
Acknowledgments
We thank H-C. Steen-Larsen from University of Bergen for providing EastGRIP temperature data. We thank Lino Schmidt for his contribution to the field work and snow block extraction at EastGRIP. We are very grateful to Hubert Gallée and Xavier Fettweis for providing access to MAR re-analyses data. Many thanks to the reviewers for their useful critical evaluation of our work.
Supplementary Material
The Supplementary Material for this article can be found online at: https://www.frontiersin.org/articles/10.3389/feart.2020.00365/full#supplementary-material
References
Alley, R. B. (1988). Fabrics in polar ice sheets - Development and prediction. Science 240, 493–495.
Arnaud, L., Weiss, J., Gay, M., and Duval, P. (2000). Shallow-ice microstructure at Dome Concordia. Ann. Glaciol. 30, 8–12. doi: 10.3189/172756400781820813
Arthern, R. J., Vaughan, D. G., Rankin, A. M., Mulvaney, R., and Thomas, E. R. (2010). In situ measurements of antarctic snow compaction compared with predictions of models. J. Geophys. Res. Earth Surface 115:F03011. doi: 10.1029/2009JF001306
Bender, M. L. (2002). Orbital tuning chronology for the vostok climate record supported by trapped gas composition. Earth Planet. Sci. Lett. 204, 275–289. doi: 10.1016/S0012-821X(02)00980-9
Burr, A., Noël, W., Trecourt, P., Bourcier, M., Gillet-Chaulet, F., Philip, A., et al. (2017). The anisotropic contact response of viscoplastic monocrystalline ice particles. Acta Mater. 132, 576–585. doi: 10.1016/j.actamat.2017.04.069
Calonne, N., Flin, F., Lesaffre, B., Dufour, A., Roulle, J., Puglièse, P., et al. (2015). Celldym: a room temperature operating cryogenic cell for the dynamic monitoring of snow metamorphism by time-lapse x-ray microtomography. Geophys. Res. Lett. doi: 10.1002/2015GL063541
Calonne, N., Geindreau, C., Flin, F., Morin, S., Lesaffre, B., Rolland du Roscoat, S., et al. (2012). 3-d image-based numerical computations of snow permeability: links to specific surface area, density, and microstructural anisotropy. Cryosphere 6, 939–951. doi: 10.5194/tc-6-939-2012
Calonne, N., Milliancourt, L., Burr, A., Philip, A., Martin, C. L., Flin, F., et al. (2019). Thermal conductivity of snow, firn, and porous ice from 3-d image-based computations. Geophys. Res. Lett. 46, 13079–13089. doi: 10.1029/2019GL085228
Calonne, N., Montagnat, M., Matzl, M., and Schneebeli, M. (2017). The layered evolution of fabric and microstructure of snow at point barnola, central east Antarctica. Earth Planet. Sci. Lett. 460, 293–301. doi: 10.1016/j.epsl.2016.11.041
Castelnau, O., Duval, P., Lebensohn, R. A., and Canova, G. (1996). Viscoplastic modeling of texture development in polycrystalline ice with a self-consistent approach: comparison with bound estimates. J. Geophys. Res. 101, 13851–13868.
Coléou, C., Lesaffre, B., Brzoska, J-B., Ludwig, W., and Boller, E. (2001). Three-dimensional snow images by x-ray microtomography. Ann. Glaciol. 32, 75–81. doi: 10.3189/172756401781819418
Dahl-Jensen, D., Gundestrup, N., Miller, H., Watanabe, O., Johnsen, S. J., Steffensen, J. P., et al. (2002). The northGRIP deep drilling programme. Ann. Glaciol. 35, 1–4. doi: 10.3189/172756402781817275
de la Chapelle, S., Castelnau, O., Lipenkov, V., and Duval, P. (1998). Dynamic recrystallization and texture development in ice as revealed by the study of deep ice cores in Antarctica and Greenland. J. Geophys. Res. 103, 5091–5105.
Duval, P., Ashby, M., and Anderman, I. (1983). Rate controlling processes in the creep of polycrystalline ice. J. Phys. Chem. 87, 4066–4074.
Fettweis, X., Hofer, S., Krebs-Kanzow, U., Amory, C., Aoki, T., Berends, C. J., et al. (2020). GrSMBMIP: intercomparison of the modelled 1980-2012 surface mass balance over the greenland ice sheet. Cryosphere Discuss. 2020, 1–35. doi: 10.5194/tc-2019-321
Fisher, N. I., Lewis, T., and Embleton, B. J. (1987). Statistical Analysis of Spherical Data. Cambridge: Cambridge University Press.
Fourteau, K., Faïn, X., Martinerie, P., Landais, A., Ekaykin, A. A., Lipenkov, V. Y., et al. (2017). Analytical constraints on layered gas trapping and smoothing of atmospheric variability in ice under low-accumulation conditions. Clim. Past 13, 1815–1830. doi: 10.5194/cp-13-1815-2017
Fourteau, K., Martinerie, P., Faïn, X., Ekaykin, A. A., Chappellaz, J., and Lipenkov, V. (2020) Estimation of gas record alteration in very low-accumulation ice cores. Clim. Past 16, 503–522. doi: 10.5194/cp-16-503-2020
Fourteau, K., Martinerie, P., Faïn, X., Schaller, C. F., Tuckwell, R. J., Löwe, H., et al. (2019). Multi-tracer study of gas trapping in an east antarctic ice core. Cryosphere 13, 3383–3403. doi: 10.5194/tc-13-3383-2019
Fujita, S., Hirabayashi, M., Goto-Azuma, K., Dallmayr, R., Satow, K., and Zheng, J. (2014) Densification of layered firn of the ice sheet at neem, greenland. J. Glaciol. 60, 905–921. doi: 10.3189/2014JoG14J006.
Fujita, S., Okuyama, J., Hori, A., and Hondoh, T. (2009). Metamorphism of stratified firn at dome fuji, antarctica: a mechanism for local insolation modulation of gas transport conditions during bubble close off. J. Geophys. Res. Earth Surface. 114. doi: 10.1029/2008JF001143
Gerling, B., Löwe, H., and van Herwijnen, A. (2017). Measuring the elastic modulus of snow. Geophys. Res. Lett. 44, 11088–11096. doi: 10.1002/2017GL075110
Gow, A. J., and Williamson, T. C. (1976) Rheological implications of the internal structure crystal fabrics of the West Antarctic ice sheet as revealed by deep core drilling at Byrd station. Geol. Soc. Am. Bull. 87, 1665–1677.
Gregory, S. A., Albert, M. R., and Baker, I. (2014). Impact of physical properties and accumulation rate on pore close-off in layered firn. Cryosphere 8, 91–105. doi: 10.5194/tc-8-91-2014
Hagenmuller, P., Chambon, G., Lesaffre, B., Flin, F., and Naaim, M. (2013). Energy-based binary segmentation of snow microtomographic images. J. Glaciol. 59, 859–873. doi: 10.3189/2013JoG13J035
Hagenmuller, P., Chambon, G., and Naaim, M. (2015). Microstructure-based modeling of snow mechanics: a discrete element approach. The Cryosphere 9, 1969–1982. doi: 10.5194/tc-9-1969-2015
Hagenmuller, P., Theile, T. C., and Schneebeli, M. (2014). Numerical simulation of microstructural damage and tensile strength of snow. Geophys. Res. Lett. 41, 86–89. doi: 10.1002/2013GL058078
Heggli, M., Frei, E., and Schneebeli, M. (2009). Snow replica method for three-dimensional x-ray microtomographic imaging. J. Glaciol. 55, 631–639. doi: 10.3189/002214309789470932
Kuramoto, T., Goto-Azuma, K., Hirabayashi, M., Miyake, T., Motoyama, H., Dahl-Jensen, D., et al. (2011). Seasonal variations of snow chemistry at neem, greenland. Ann. Glaciol. 52, 193–200. doi: 10.3189/172756411797252365
Laepple, T., Hörhold, M., Münch, T., Freitag, J., Wegner, A, and Kipfstuhl, S. (2016) Layering of surface snow firn at Kohnen station, Antarctica –noise or seasonal signal? J. Geophys. Res. Earth Surface 121, 1849–1860. doi: 10.1002/2016JF003919
Lamb, D., and Scott, W. D. (1972). Linear growth rates of ice crystals grown from the vapor phase. J. Crystal Growth 12, 21–31. doi: 10.1016/0022-0248(72)90333-8
Leinss, S., Löwe, H., Proksch, M., and Kontu, A. (2020). Modeling the evolution of the structural anisotropy of snow. Cryosphere 14, 51–75. doi: 10.5194/tc-14-51-2020
Leinss, S., Löwe, H., Proksch, M., Lemmetyinen, J., Wiesmann, A., and Hajnsek, I. (2016). Anisotropy of seasonal snow measured by polarimetric phase differences in radar time series. Cryosphere 10, 1771–1797. doi: 10.5194/tc-10-1771-2016
Lipenkov, V. Y., Raynaud, D., Loutre, M. F., and Duval, P. (2011). On the potential of coupling air content and o2/n2 from trapped air for establishing an ice core chronology tuned on local insolation. Q. Sci. Rev. 30, 3280–3289. doi: 10.1016/j.quascirev.2011.07.013
Löwe, H., Riche, F., and Schneebeli, M. (2013). A general treatment of snow microstructure exemplified by an improved relation for thermal conductivity. Cryosphere 7, 1473–1480. doi: 10.5194/tc-7-1473-2013
Lundin, J. M. D., Stevens, C. M., Arthern, R., Buizert, C., Orsi, A., Ligtenberg, S. R. M., et al. (2017). Firn model intercomparison experiment (firnmice). J. Glaciol. 63, 401–422. doi: 10.1017/jog.2016.114
Montagnat, M., Azuma, N., Dahl-Jensen, D., Eichler, J., Fujita, S., Gillet-Chaulet, F., et al. (2014). Fabric measurement along the NEEM ice core, greenland, and comparison with GRIP and NGRIP ice cores. Cryosphere 8, 1129–1138. doi: 10.5194/tc-8-1129-2014
Montagnat, M., Blackford, J. R., Piazolo, S., Arnaud, L., and Lebensohn, R. A. (2011). Measurements and full-field predictions of deformation heterogeneities in ice. Earth Planet. Sci. Lett. 305, 153–160. doi: 10.1016/j.epsl.2011.02.050
Moreno, R., Borga, M., and Smedby, Ö. (2014). “Techniques for computing fabric tensors: a review,” in: Visualization and Processing of Tensors and Higher Order Descriptors for Multi-Valued Data, eds C. F. Westin, A. Vilanova, and B. Burgeth (Berlin, Heidelberg: Springer), 271–292.
Moser, D. E., Hörhold, M., Kipfstuhl, S., and Freitag, J. (2020). Microstructure of snow and its link to trace elements and isotopic composition at Kohnen station, dronning maud land, Antarctica. Front. Earth Sci. 8:23. doi: 10.3389/feart.2020.00023
Perutz, M. F., Seligman, G., and Bragg, W. H. (1939). A crystallographic investigation of glacier structure and the mechanism of glacier flow. Proc. R. Soc. Lond. Ser. A Math. Phys. Sci. 172, 335–360. doi: 10.1098/rspa.1939.0108
Peternell, M., Russell-Head, D., and Wilson, C. (2011). A technique for recording polycrystalline structure and orientation during In situ deformation cycles of rock analogues using an automated fabric analyser. J. Microsc. 242, 181–188. doi: 10.1111/j.1365-2818.2010.03456.x
Pinzer, B. R., and Schneebeli, M. (2009). Snow metamorphism under alternating temperature gradients: Morphology and recrystallization in surface snow. Geophys. Res. Lett. 36. doi: 10.1029/2009GL039618
Proksch, M., Rutter, N., Fierz, C., and Schneebeli, M. (2016). Intercomparison of snow density measurements: bias, precision, and vertical resolution. Cryosphere 10, 371–384. doi: 10.5194/tc-10-371-2016
Riche, F., Montagnat, M., and Schneebeli, M. (2013). Evolution of crystal orientation in snow during temperature gradient metamorphism. J. Glaciol. 59, 1–9. doi: 10.3189/2013JoG12J116
Riche, F., Schneebeli, M., and Tschanz, S. (2012). Design-based stereology to quantify structural properties of artificial and natural snow using thin sections. Cold Regions Sci. Technol. 79–80, 67–74. doi: 10.1016/j.coldregions.2012.03.008
Rolland du Roscoat, S., King, A., Philip, A., Reischig, P., Ludwig, W., Flin, F., et al. (2011). Analysis of snow microstructure by means of x-ray diffraction contrast tomography. Adv. Eng. Mater. 13, 128–135. doi: 10.1002/adem.201000221
Schaller, C. F., Freitag, J., Kipfstuhl, S., Laepple, T., Steen-Larsen, H. C., and Eisen, O. (2016). A representative density profile of the north greenland snowpack. Cryosphere 10, 1991–2002. doi: 10.5194/tc-10-1991-2016
Schlegel, R., Diez, A., Löwe, H., Mayer, C., Lambrecht, A., Freitag, J., et al. (2019). Comparison of elastic moduli from seismic diving-wave and ice-core microstructure analysis in antarctic polar firn. Ann. Glaciol. 60, 220–230. doi: 10.1017/aog.2019.10
Schneebeli, M. (2004). Numerical simulation of elastic stress in the microstructure of snow. Ann. Glaciol. 38, 339–342. doi: 10.3189/172756404781815284
Schneebeli, M., and Sokratov, S. A. (2004). Tomography of temperature gradient metamorphism of snow and associated changes in heat conductivity. Hydrol. Process. 18, 3655–3665. doi: 10.1002/hyp.5800
Shearwood, C., and Whitworth, R. W. (1991). The velocity of dislocations in ice. Philos. Mag. A64, 289–302.
Srivastava, P. K., Chandel, C., Mahajan, P., and Pankaj, P. (2016). Prediction of anisotropic elastic properties of snow from its microstructure. Cold Regions Sci. Technol. 125, 85–100. doi: 10.1016/j.coldregions.2016.02.002
Steen-Larsen, H. C., Masson-Delmotte, V., Sjolte, J., Johnsen, S. J., Vinther, B. M., Bréon, F. M., et al. (2011). Understanding the climatic signal in the water stable isotope records from the neem shallow firn/ice cores in northwest greenland. J. Geophys. Res. Atmos. 116. doi: 10.1029/2010JD014311
Theile, T., Loewe, H., Theile, T., and Schneebeli, M. (2011). Simulating creep of snow based on microstructure and the anisotropic deformation of ice. Acta Mater. 59, 7104–7113. doi: 10.1016/j.actamat.2011.07.065
Thorsteinsson, T., Kipfstuhl, J., and Miller, H. (1997). Textures and fabrics in the GRIP ice core. J. Geophys. Res. 102, 26583–26600.
Torquato, S. (2005). Random Heterogeneous Materials: Microstructure and Macroscopic Properties. New York, NY: Springer.
Vallelonga, P., Christianson, K., Alley, R., Anandakrishnan, S., Christian, J., Dahl-Jensen, D., et al. (2014). Initial results from geophysical surveys and shallow coring of the northeast greenland ice stream (NEGIs). Cryosphere 8, 1275–1287. doi: 10.5194/tc-8-1275-2014
Wiese, M., and Schneebeli, M. (2017a). Snowbreeder 5: a micro-ct device for measuring the snow-microstructure evolution under the simultaneous influence of a temperature gradient and compaction. J. Glaciol. 63, 355–360. doi: 10.1017/jog.2016.143
Wiese, M., and Schneebeli, M. (2017b). Early-stage interaction between settlement and temperature-gradient metamorphism. J. Glaciol. 63, 652–662. doi: 10.1017/jog.2017.31
Wilson, C., Russell-Head, D., and Sim, H. (2003). The application of an automated fabric analyzer system to the textural evolution of folded ice layers in shear zones. Ann. Glaciol. 37, 7–17. doi: 10.3189/172756403781815401
Keywords: snow cover, structural fabric, crystallographic fabric, seasonal signal, metamorphism, densification, Greenland
Citation: Montagnat M, Löwe H, Calonne N, Schneebeli M, Matzl M and Jaggi M (2020) On the Birth of Structural and Crystallographic Fabric Signals in Polar Snow: A Case Study From the EastGRIP Snowpack. Front. Earth Sci. 8:365. doi: 10.3389/feart.2020.00365
Received: 16 October 2019; Accepted: 07 August 2020;
Published: 16 September 2020.
Edited by:
Alun Hubbard, Arctic University of Norway, NorwayCopyright © 2020 Montagnat, Löwe, Calonne, Schneebeli, Matzl and Jaggi. This is an open-access article distributed under the terms of the Creative Commons Attribution License (CC BY). The use, distribution or reproduction in other forums is permitted, provided the original author(s) and the copyright owner(s) are credited and that the original publication in this journal is cited, in accordance with accepted academic practice. No use, distribution or reproduction is permitted which does not comply with these terms.
*Correspondence: Maurine Montagnat, maurine.montagnat@univ-grenoble-alpes.fr