Article

Zooplankton as Indicator of the Ecological State of Protected Aquatic Ecosystems (Lake Borovoe, Burabay National Nature Park, Northern Kazakhstan)

1
Institute of Zoology, Almaty 050060, Kazakhstan
2
Kazakh Agency of Applied Ecology, Almaty 050010, Kazakhstan
3
Faculty of Chemistry and Chemical Technology, Kazakh National University named after Al Farabi, Almaty 050040, Kazakhstan
4
TOO “ECOSERVICE-S”, Alamty 050009, Kazakhstan
*
Author to whom correspondence should be addressed.
Water 2020, 12(9), 2580; https://doi.org/10.3390/w12092580
Submission received: 15 July 2020 / Revised: 28 August 2020 / Accepted: 9 September 2020 / Published: 16 September 2020
(This article belongs to the Special Issue Assessment of Water Quality)

Abstract

:
The enrichment of the protected Borovoe Lake with nutrients has taken place within the last 100 years, from the moment the first resort was formed on its shores. The purpose of this study was to assess the current ecological state of Borovoe based on the structure of zooplankton. According to the chemical data, in the summer of 2019, the content of nutrients in the water was, relatively, not high; the content of heavy metals was very low. Twenty-seven species were found in zooplankton. The average abundance of zooplankton was 988.8 thousand ind./m3 with a biomass of 1.52 g/m3. Rotifera dominated. Cladocera sub-dominated. The Shannon index values were 2.31 bit/ind. and 2.57 bit/mg; the values of Clarke’s W-statistics and Δ-Shannon were negative. The abundance of zooplankton increased more than nine times, but the average individual mass of an organism decreased from 0.0112 to 0.0016 mg over the past decade. Despite the relatively low content of nutrients, the structure of zooplankton demonstrated that the nutritional load on Lake Borovoe is currently close to critical. Statistical mapping of the data and redundancy analysis (RDA) showed that the primary source of lake pollution is the village of Borovoe and sanatoriums located on the southeast and northwest coasts.

1. Introduction

Water bodies of protected areas are remote from industrial enterprises; therefore, the content of toxic substances in them is usually low [1,2]. The main environmental problems of preserved water bodies are connected with organic pollution, especially in the case of their intensive recreational use. The accumulation of nutrients in water bodies leads to the mass reproduction of blue-green algae [3], an increase in primary productivity, a decrease in transparency, and a deterioration in water quality [4]. The toxins released by some Cyanobacteria species during blooms pose a severe threat to human health when using the water of a blooming water body [5,6].
Water quality assessment of water bodies can be performed based on chemical or biological methods; both of them have certain limitations. Organic substances and nutrients entering water bodies are used by primary producers [7], or accumulate in bottom sediments [8]. As a result, the chemical analysis of water takes into account only some part of the total amounts of components contained in a water body. Unlike chemical analysis methods, bioindication provides an integrated assessment of the quality of the water bodies [9,10]. The informativeness of biological assessment methods is because the structure of natural communities is formed under the influence of a complex of climatic and anthropogenic factors. In particular, an increase in nutrient load is accompanied by an increase in the abundance and a decrease in the average size of planktonic invertebrates [11,12,13], as well as a violation of the structure of the dominance of species in communities [14,15,16,17]. The effectiveness of the bioindication method based on aquatic invertebrates in environmental studies has been shown in several publications [18,19,20]. A limitation of the bioindication method is the inability to accurately establish the reasons for the unfavorable ecological state of the water body. Thus, for these, a combination of chemical and biological methods, as recommended in the Water Framework Directive (WFD) [21], is the most effective.
Borovoe Lake is located on the territory of the National Natural Park “Burabay” (Northern Kazakhstan). It obtained conservation status in 2000 when the Burabay National Natural Park was created. Borovoe is one of the most visited lakes of the Shchuchinsk-Borovsk resort area. The developed infrastructure, convenient location, and picturesque area attracts many vacationers, the number of which is increasing every year [22]. The enrichment of the lake with nutrients has been going on for more than 100 years, since the foundation of the first resort. Increasing anthropogenic pressure on the lake is causing serious concern. A high abundance of phytoplankton and zooplankton was recorded in the lake [23,24,25]. In 1974, most fish died in the lake, which was associated with a high abundance of Cyanobacteria, and currently, the ichthyofauna is represented only by four species—vendace Coregonus albula (Linnaeus, 1758), carp Cyprinus carpio (Linnaeus, 1758), perch Perca fluviatilis (Linnaeus, 1758), and tench Tinca tinca (Linnaeus, 1758) [26]. The content of nutrients in water during this period [27], as in subsequent years [23], was at a relatively low level. The above information indicates that the assessment of the ecological state of Borovoe Lake should be done, not only with the use of chemical data, but also with bioindication methods.
In addition to assessing the water quality of Borovoe Lake, an important task is to identify the primary sources of its pollution. Statistical data mapping is a useful tool for solving this application problem [28,29]. The effectiveness of this method in monitoring studies of water bodies in Kazakhstan has been shown previously [30,31,32]. During occasional hydrochemical and hydrobiological studies of Borovoe Lake, a comprehensive assessment of its ecological status has not been performed yet. This work partially fills this gap. Its purpose is to analyze the structure and spatial distribution of zooplankton to assess the ecological state and identify the primary sources of pollution of Lake Borovoe.

2. Materials and Methods

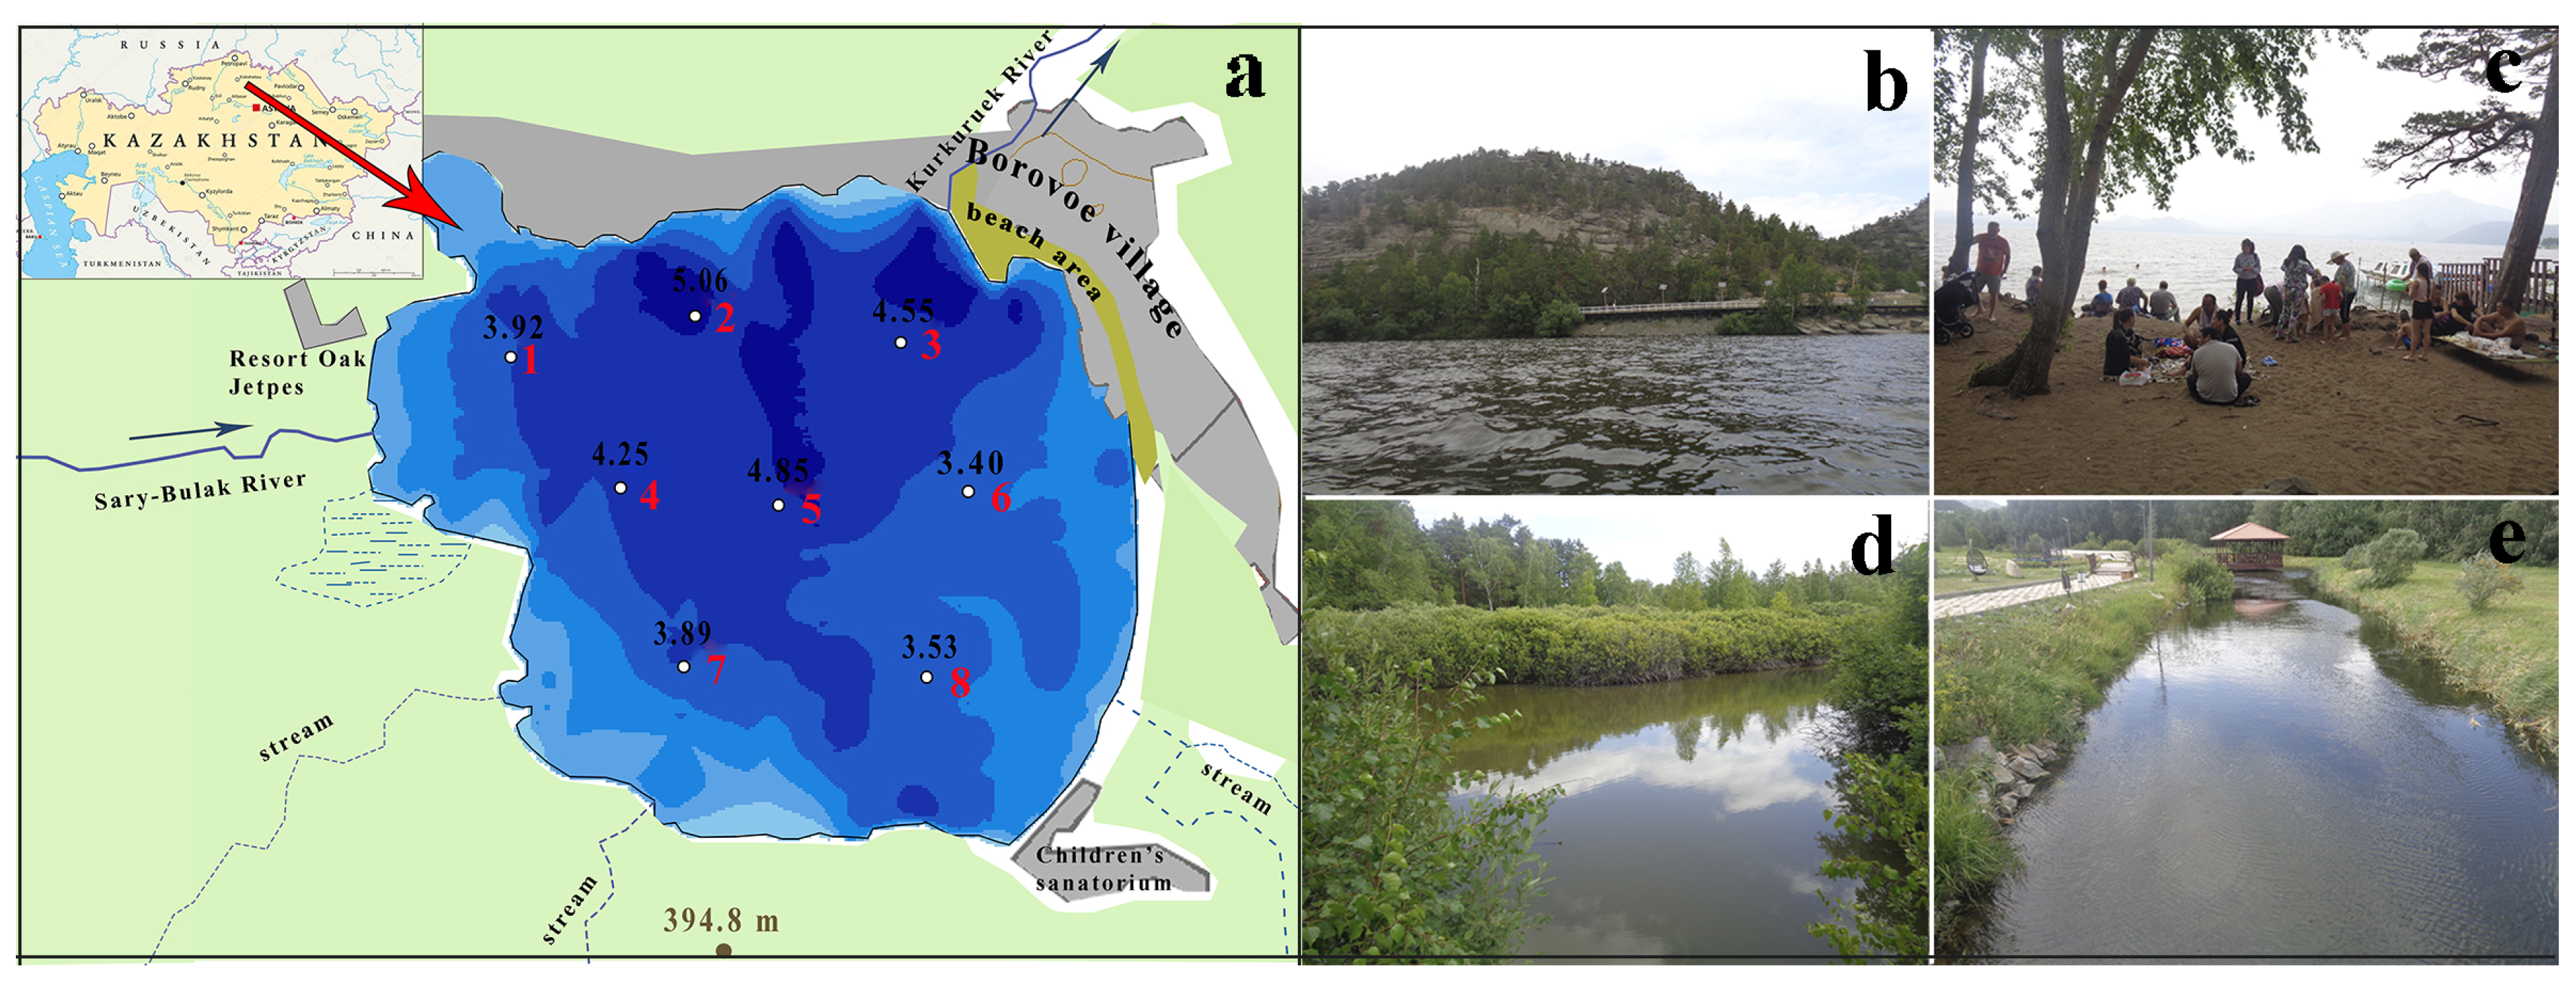
2.1. Description of Study Area

Borovoe Lake is located in the Burabay district of the Akmola region (Northern Kazakhstan) at the altitude of 315.0 m above sea level. Borovoe is separated from the nearby lakes by ridges 400–900 m high. It has an almost circular shape, with two bays in the western part (Figure 1a). The maximum length of the lake is about 4 km, with a width of 3.27 km. The water area is about 11.0 km2. The lake is shallow, with a maximum depth of 6.0 m and an average depth of 4.2 m. The catchment area is 164.0 km2. The southern, western, and northern shores are granite, sometimes rising above the water in the form of cliffs (Figure 1b). The east coast is sandy, sloping. The shores are overgrown by pine and birch. The lake is fed by the waters of the Sary-Bulak River (Figure 1d), temporary watercourses, and precipitation. A small river, Kurkure, flows from the lake (Figure 1e).
Sediments are black silts. The coastal zone and bays are overgrown with Potamogeton lucens L., 1753. Macrophyte overgrowth is no more than 35–40%. The bottom is overgrown with Charophyta algae, except for the central part of the lake.
The Borovoe village, with numerous holiday homes and sanatoriums, is located on the eastern and northern shores of the lake (Figure 1a). Two more large sanatoriums are located on the southeast and northwest shores of the lake. Private and public beaches are situated along the entire coast of the lake (Figure 1c).

2.2. Field Sampling

The studies of the lake were performed on 29 July, of 2019, on a grid of eight stations. Zooplankton samples were collected using a small Juday plankton net (input diameter 12 cm, mesh size 64 μm) by pulling it from the bottom to the surface. Surface water samples were taken at the same stations to determine the total dissolved solids (TDS), nitrites, nitrates, ammonia, phosphates, iron, manganese, fluorine, silicon, heavy metals, and permanganate index (PI) (ISO 8467:1993) [33]. Samples for analysis of TDS were taken in 1-L plastic containers. Samples for determining the nutrients were taken in 0.5 L glass containers and fixed with 1 mL of chloroform. Water samples for analysis of four heavy metals (Cd, Cu, Pb, and Zn) were taken in 0.5 L plastic containers and fixed with concentrated chemically pure nitric acid. Samples for determining the amount of easily oxidizable organic matter (permanganate index (PI)) were taken in 0.3 L glass containers and fixed with 2 mL concentrated sulfuric acid. All samples were stored in a refrigerator and delivered to the laboratory within 1–2 days after collection. The temperature and pH values of the surface layers of water were measured in parallel with sampling. The transparency of the water was measured using a Secchi disk. Coordinate referencing of the stations was done by Garmin eTrex GPS-navigator.

2.3. Laboratory Processing

Conventional methods of chemical analysis of water samples were used [34,35]. All water samples were analyzed in triplicate or quadruplicate. Analysis of samples for heavy metals was carried out in the analytical laboratory “KAZEKOANALIZ” (accreditation certificate No. KZ.I.02.1017) according to the Interstate standard [36]. Heavy metal measuring was performed by mass spectrometry with inductively coupled plasma by using Agilent 7500 A manufactured by Agilent Technologies, USA (National Standard of Republic of Kazakhstan ISO). Abundance Sensitivity of Agilent 7500 A: Low Mass < 5 × 10⁻⁷, High Mass < 1 × 10⁻⁷.
Zooplankton samples were processed with standard methods [37,38] using guides to the species identifications [39,40,41,42]. To calculate the quantitative variables of planktonic invertebrates, a sample was brought to a certain volume (150–500 mL). After thorough mixing, three sub-samples were taken from the sample using a 1 mL stamp-pipette. In this sub-sample, all encountered individuals and age stages of certain species (the most numerous) were counted in Bogorov’s cell. Then, the sample was concentrated to a volume of 125–150 mL. Three sub-samples were taken from it again, where less abundant age stages or species were counted. The whole procedure was repeated once more, while the sample was concentrated to a volume of 50 mL. In the end, the sample, with its volume of 20–25 mL, was viewed in its entirety for counting large and rare species of planktonic invertebrates. The results of counting individuals are recalculated per 1 m3 using the formula (separately for each sample dilution):
N   = n × ( V 1 / V 2 ) V 3                
where: N—abundance (ind./m3), n—number of individuals in a portion (specimens), V1—dilution volume (ml), V2—subsample volume (ml), V3—filtered water volume (m3).
The filtered volume of water was calculated by the formula:
V 3   =   h   ×   π r 2  
where: r is the radius of the inner ring of the Juday net, h is the length of the net pulling (water column height), m.
The total abundance was found for each species of planktonic invertebrates; for each crustacean species, the total abundance was calculated by summing the abundance of individual age and size stages. The total abundance of zooplankton was determined by summing up the abundance of all species found in the sample.
For all species of planktonic invertebrates encountered, the mass of an individual was found according to formulas specific to each species [38]. The obtained values were multiplied by the abundance of individuals (ind./m3) and then summed up for each species and total for a sample.
The frequency of occurrence of species (%) was found as the ratio between the number of samples in which the species was found to the total number of samples. The number of species per sample, an average individual mass of an organism, values of Clarke’s W-statistics, and Δ-Shannon were calculated to describe the zooplankton structure. An average individual mass of an organism (mg) was calculated as the total biomass divided by the total abundance of zooplankton. Shannon index [43] was calculated using Primer 6 Software by the formula:
H = i = 1 n p i ×   l o g 2   p i
where: H—Shannon index, pi—the proportion of a species in total quantitative variables of zooplankton, log2—logarithm based on 2, n—the total number of species in a sample, ∑—the sum of values for a sample.
The Shannon index can be calculated both based on the abundance of species in the sample and based on the specific biomass [44]. For the convenience of distinguishing them, the first version of the index is designated as Shannon Ab (bit/ind), the second one—as Shannon Bi (bit/mg). The unit of measurement of the Shannon index (bit) historically originates in the entropy approach to measuring biodiversity [45]; and it is traditionally used in hydrobiological research [11,44,46].
For each station, we calculated Clarke’s W-statistic using Primer 6 Software by the formula [15]:
W =   i = 1 S ( B i A i ) / [ 50 ( S 1 ) ]
where: W—Clarke’s W-statistic, Bi—biomass for each species rank (i) in %, Ai—abundance for each species rank (i) in %, S—number of species.
Clarke’s W-statistic [14,15] characterizes the distribution of species by abundance and biomass (ABC method, abundance, and biomass comparison). W takes values in the range from −1 to +1. This method was proposed by R.M. Warwick [14] to determine the disturbance of the structure of marine benthos. The theoretical basis of the method is the provision that in undisturbed communities, large species dominate by biomass, but less large species dominate by the abundance. In this case, the biomass curves are above the abundance curves, and Clarke’s W-statistic values are positive [15]. The strengthening of the role of small species under the influence of stress [47] leads to convergence of the curves and, ultimately, to the location of the abundance curve above the biomass curve, which is characterized by negative Clarke’s W-statistic values. A change in the size of plants and animals is a universal response to a change in external factors [11,48], which determines the applicability of the ABC method for any community. Earlier, we successfully applied the ABC method to assess the influence of external factors on the structure of phytoplankton [2,30,49] and zooplankton communities [13,31,50] from water bodies in Kazakhstan.
We calculated the values of Δ-Shannon as an arithmetical difference between Shannon Bi and Shannon Ab [2]. Like Clarke’s W-statistics, Δ-Shannon characterizes the structure of the dominance of species. In large-sized communities, the distribution of species by abundance is more uniform than by biomass. Accordingly, the Shannon Ab values are higher than the Shannon Bi, and Δ-Shannon is positive [2,13,30,31,49,50]. In disturbed communities, small species are dominated; the Shannon Bi is higher than the Shannon Ab, and the values of Δ-Shannon are negative.

2.4. Statistical Analysis

Statistical data analysis was performed using the Statistica 10 Software. We calculated mean values with standard errors for all variables. Statistical maps based on the coordinate reference of sampling stations were built [28] to assess the spatial distribution of the analyzed variables. We used functions “3D XYZ Graphs”, where the coordinates of the sampling points are on the X- and Y-axes, the values of the analyzed variables are on the Z-axis. The distribution of variables across the lake is shown using a color scale. The maximum values of variables are colored red, and the minimum one is colored green. We calculated the Spearman correlation coefficient (R, at p < 0.05) to assess the relationship between the variables. We used redundancy analysis (RDA) to elucidate the relationships between biological and environmental variables. RDA is a direct gradient analysis technique that summarizes linear relationships between components of response variables that are “redundant” with (i.e., “explained” by) a set of explanatory variables [51]. RDA analyzes was performed with Canoco Software.

3. Results

3.1. Physico-Chemical Characteristics of the Borovoe Lake

During the study period, the temperature of the surface water reached 22.0–22.9 °C. According to the chemical data, the water is fresh, slightly alkaline, and soft (Table 1). The permanganate index values characterized a moderate amount of dissolved organic substances. The nutrient content in the water was relatively not high, but the amount of iron and fluorine was increased [52]. The content of heavy metals was very low.
Elevated levels of N-NO2 and N-NO3 were revealed in the northern part (Figure 2a,b), N-NH4 (Figure 2c), as well as PO4 (Figure 2d) in the southern and central parts of the water area. Maximum PI values were found along the eastern and western shores (Figure 2e), and iron concentrations—in the northern part of the lake (Figure 2f).

3.2. The Structure of Zooplankton Communities

Twenty-seven planktonic species were recorded as part of zooplankton (Table 2). Rotifers Asplanchna priodonta Gosse, Kellicottia longispina (Kellicott), Keratella cochlearis (Gosse), Polyarthra vulgaris Carlin, Pompholyx complanata Gosse, cladocerans Bosmina kessleri Uljanin, Bosmina longirostris (O.F. Muller), Ceriodaphnia pulchella (Sars), Leptodora kindtii (Focke), copepods Mesocyclops leuckarti (Claus), Macrocyclops albidus (Jurine), Eudiaptomus graciloides (Lilljeborg), and the parasitic cyclopids Ergasilus sieboldi Nordmann were widespread.
The abundance of zooplankton was very high (Table 3). Rotifers dominated, and among them K. cochlearis formed 46.9%, P. complanata - 25.1% of the total abundance of the community. Despite the high abundance, zooplankton biomass was relatively low. The ratio of taxonomic groups in the total biomass of zooplankton was pretty uniform. The dominant complex included the predatory rotifers A. priodonta (34.4%), cladocerans C. pulchella (19.6%), B. kessleri (12.1%), and cyclops M. leuckarti (17.9%).
According to the Shannon index, the diversity of zooplankton was at a relatively high level (Table 4). The average individual mass of an organism characterized the small-sized composition of the zooplankton community. The values of Clarke’s W-statistics and Δ-Shannon were negative.
The maximal density of Rotifera abundance due to K. cochlearis was revealed in the central and eastern parts (Figure 3a,b), P. vulgaris—in the northern and partially northwestern parts of the water area (Figure 3c), A. priodonta—along the east coast (Figure 3d).
The area with the maximum abundance of zooplankton (Figure 4a) coincided in general with extremum found for the dominant rotifer K. cochlearis. Cladocera C. pulchella (Figure 4b) preferred the peripheral zones of the lake, except for the eastern shore. The east part of the lake was characterized by the highest species richness of zooplankton (Figure 4c). The zooplankton communities were characterized by negative values of Δ-Shannon, with their minimum in the central and southeastern parts (Figure 4d). Distribution of values of Δ-Shannon generally coincided with the distribution of Clarke’s W-statistics.

3.3. Nonparametric Correlation Analysis

According to the values of Spearman’s rank correlation coefficient, the distribution of nitrites and nitrates across the lake was mostly synchronous (R = 0.833, p < 0.05). The distribution of iron and easily oxidizable organic substances (PI) was characterized by opposite trends (R = −0.786, p < 0.05); all these trends are also clearly visible in Figure 2.
Positive statistically significant relationships were found between the abundance of rotifers A. priodonta and nitrates (R = 0.738, p < 0.05), cladocerans B. longirostris and ammonium (R = 0.762, p < 0.05), L. kindtii and fluorine (R = 0.786, p < 0.05). The influence of other abiotic variables including heavy metals on the distribution of taxonomic groups and dominant species was statistically insignificant. Regarding the structure of the community, a positive, statistically significant relationship was established between Δ-Shannon and the average individual mass of an organism (R = 0.810, p < 0.05); Δ-Shannon and Clarke’s W-statistics (R = 0.900, p < 0.05); Clarke’s W-statistics and the average individual mass of an organism (R = 0.750, p < 0.05). A negative link was found between the abundance of K. cochlearis and the average individual mass of an organism (R = −0.738, p < 0.05).

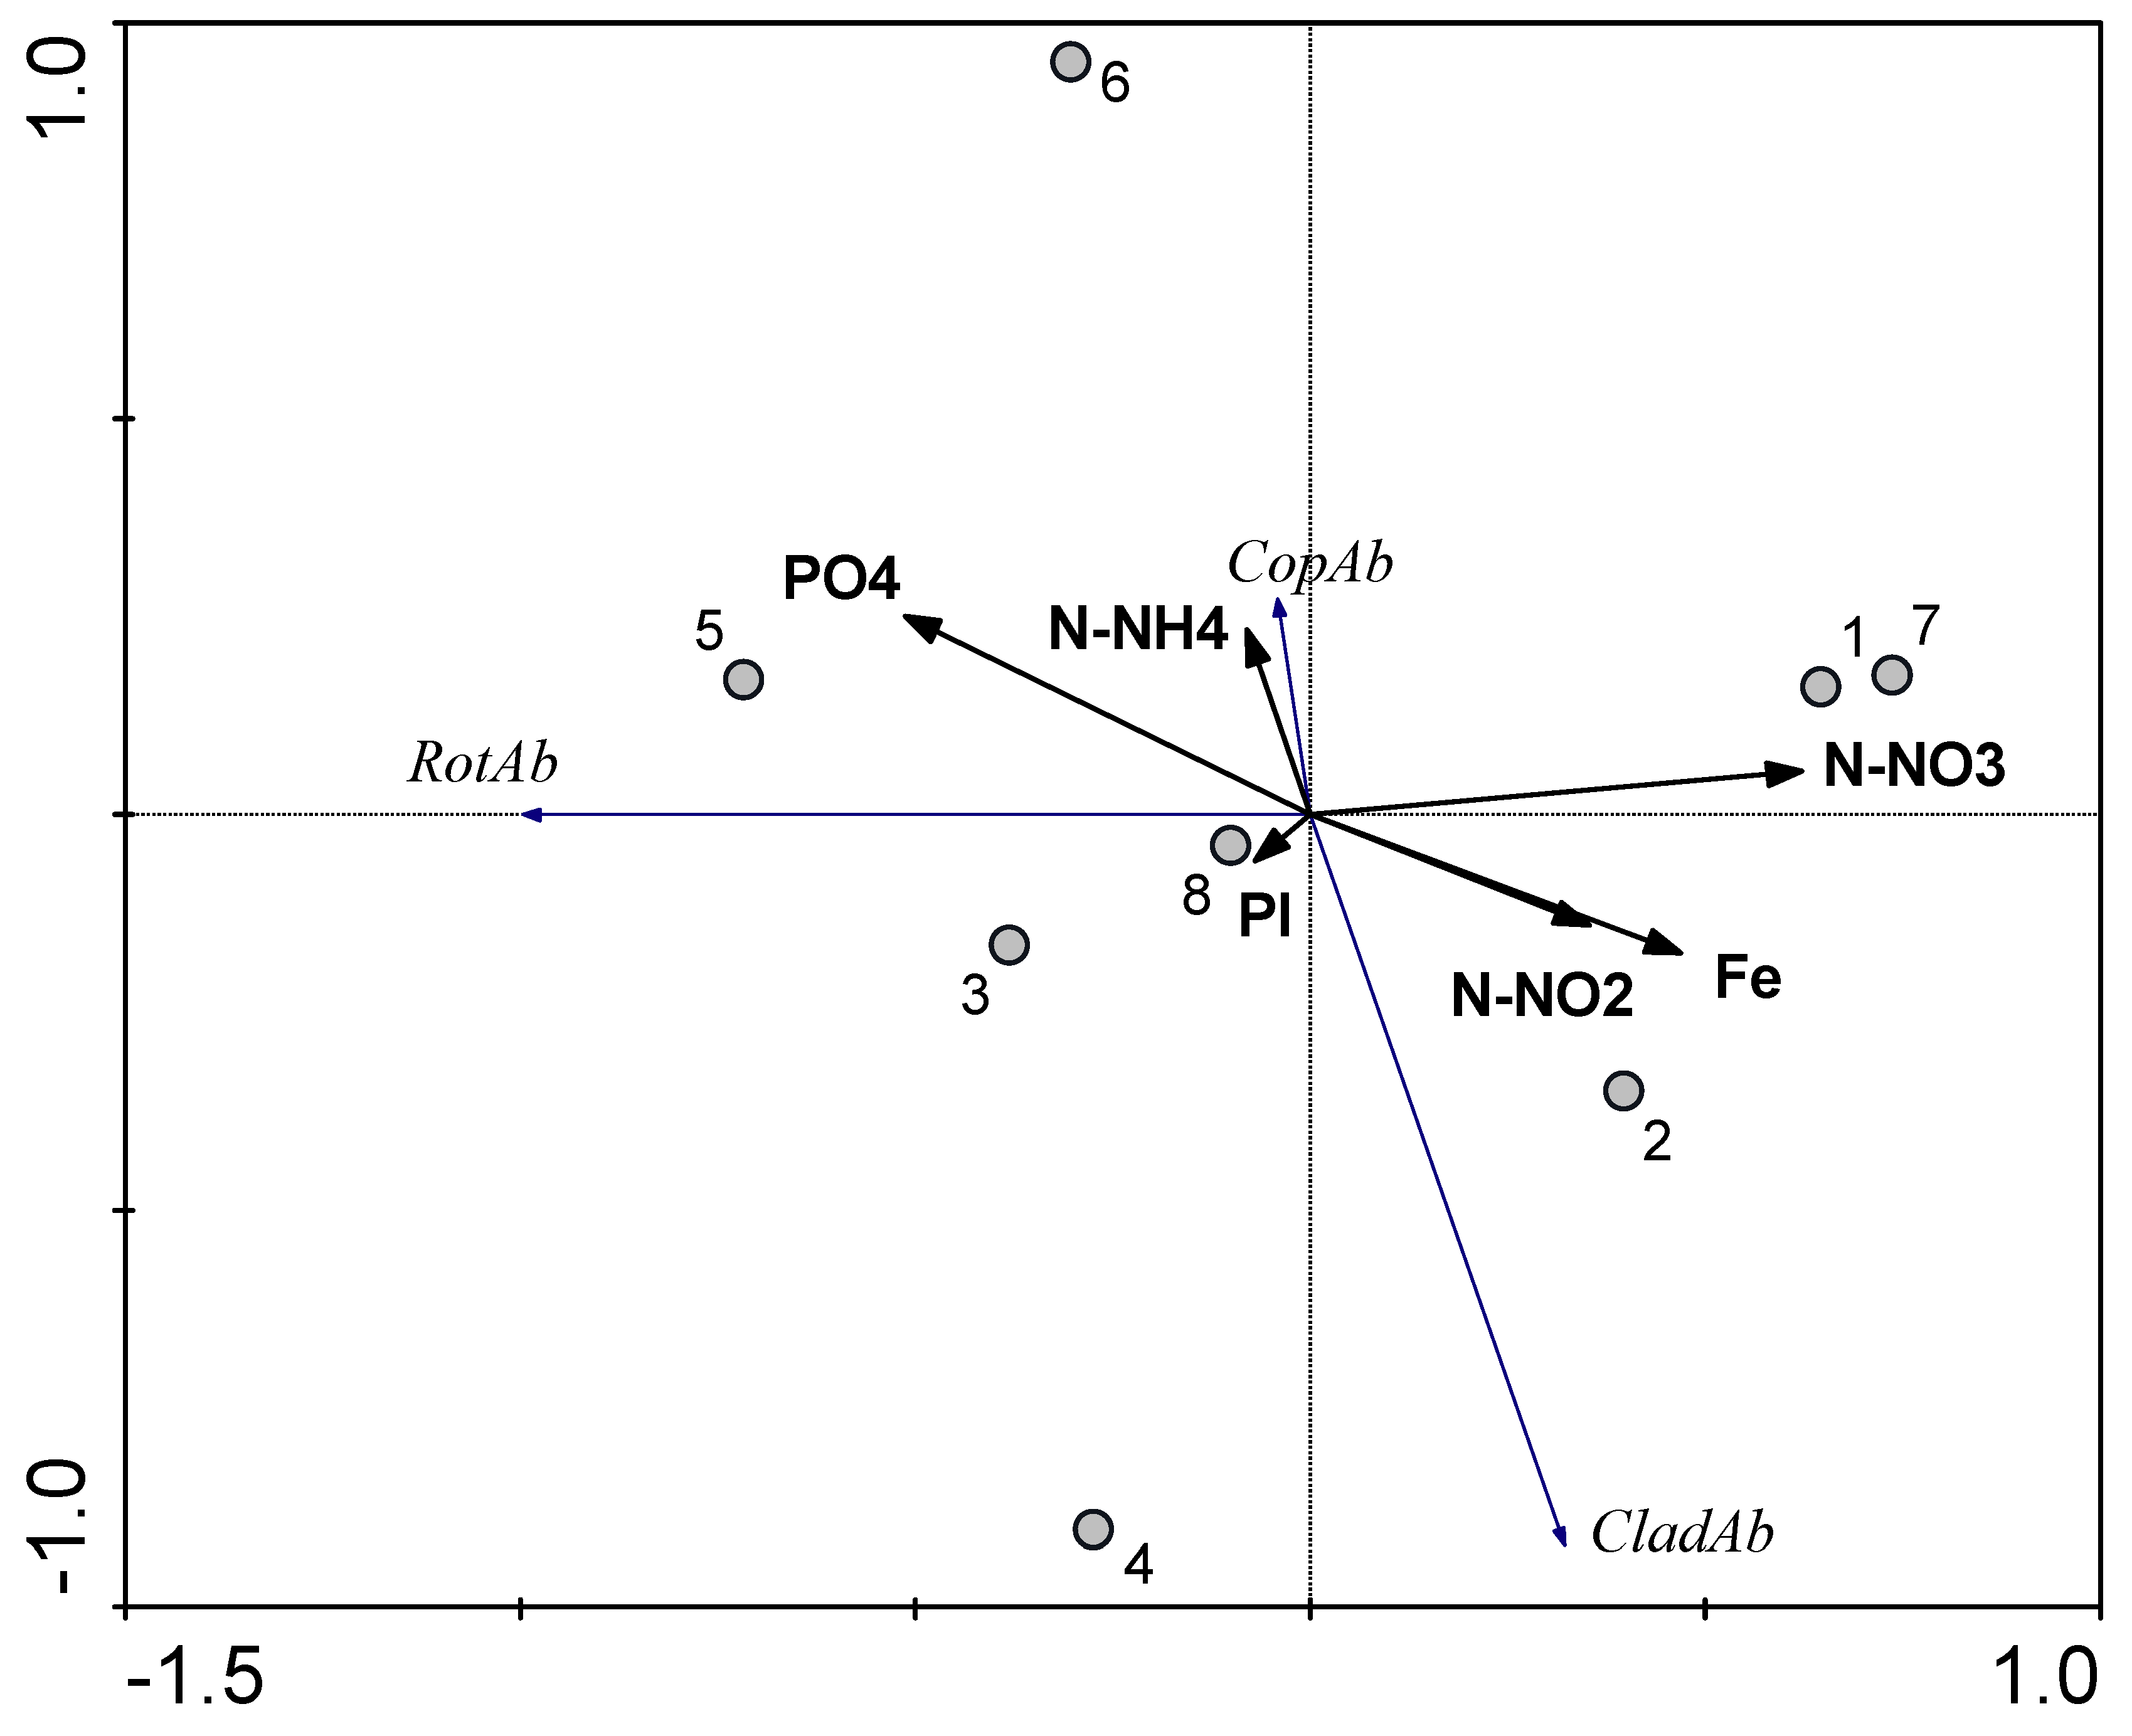
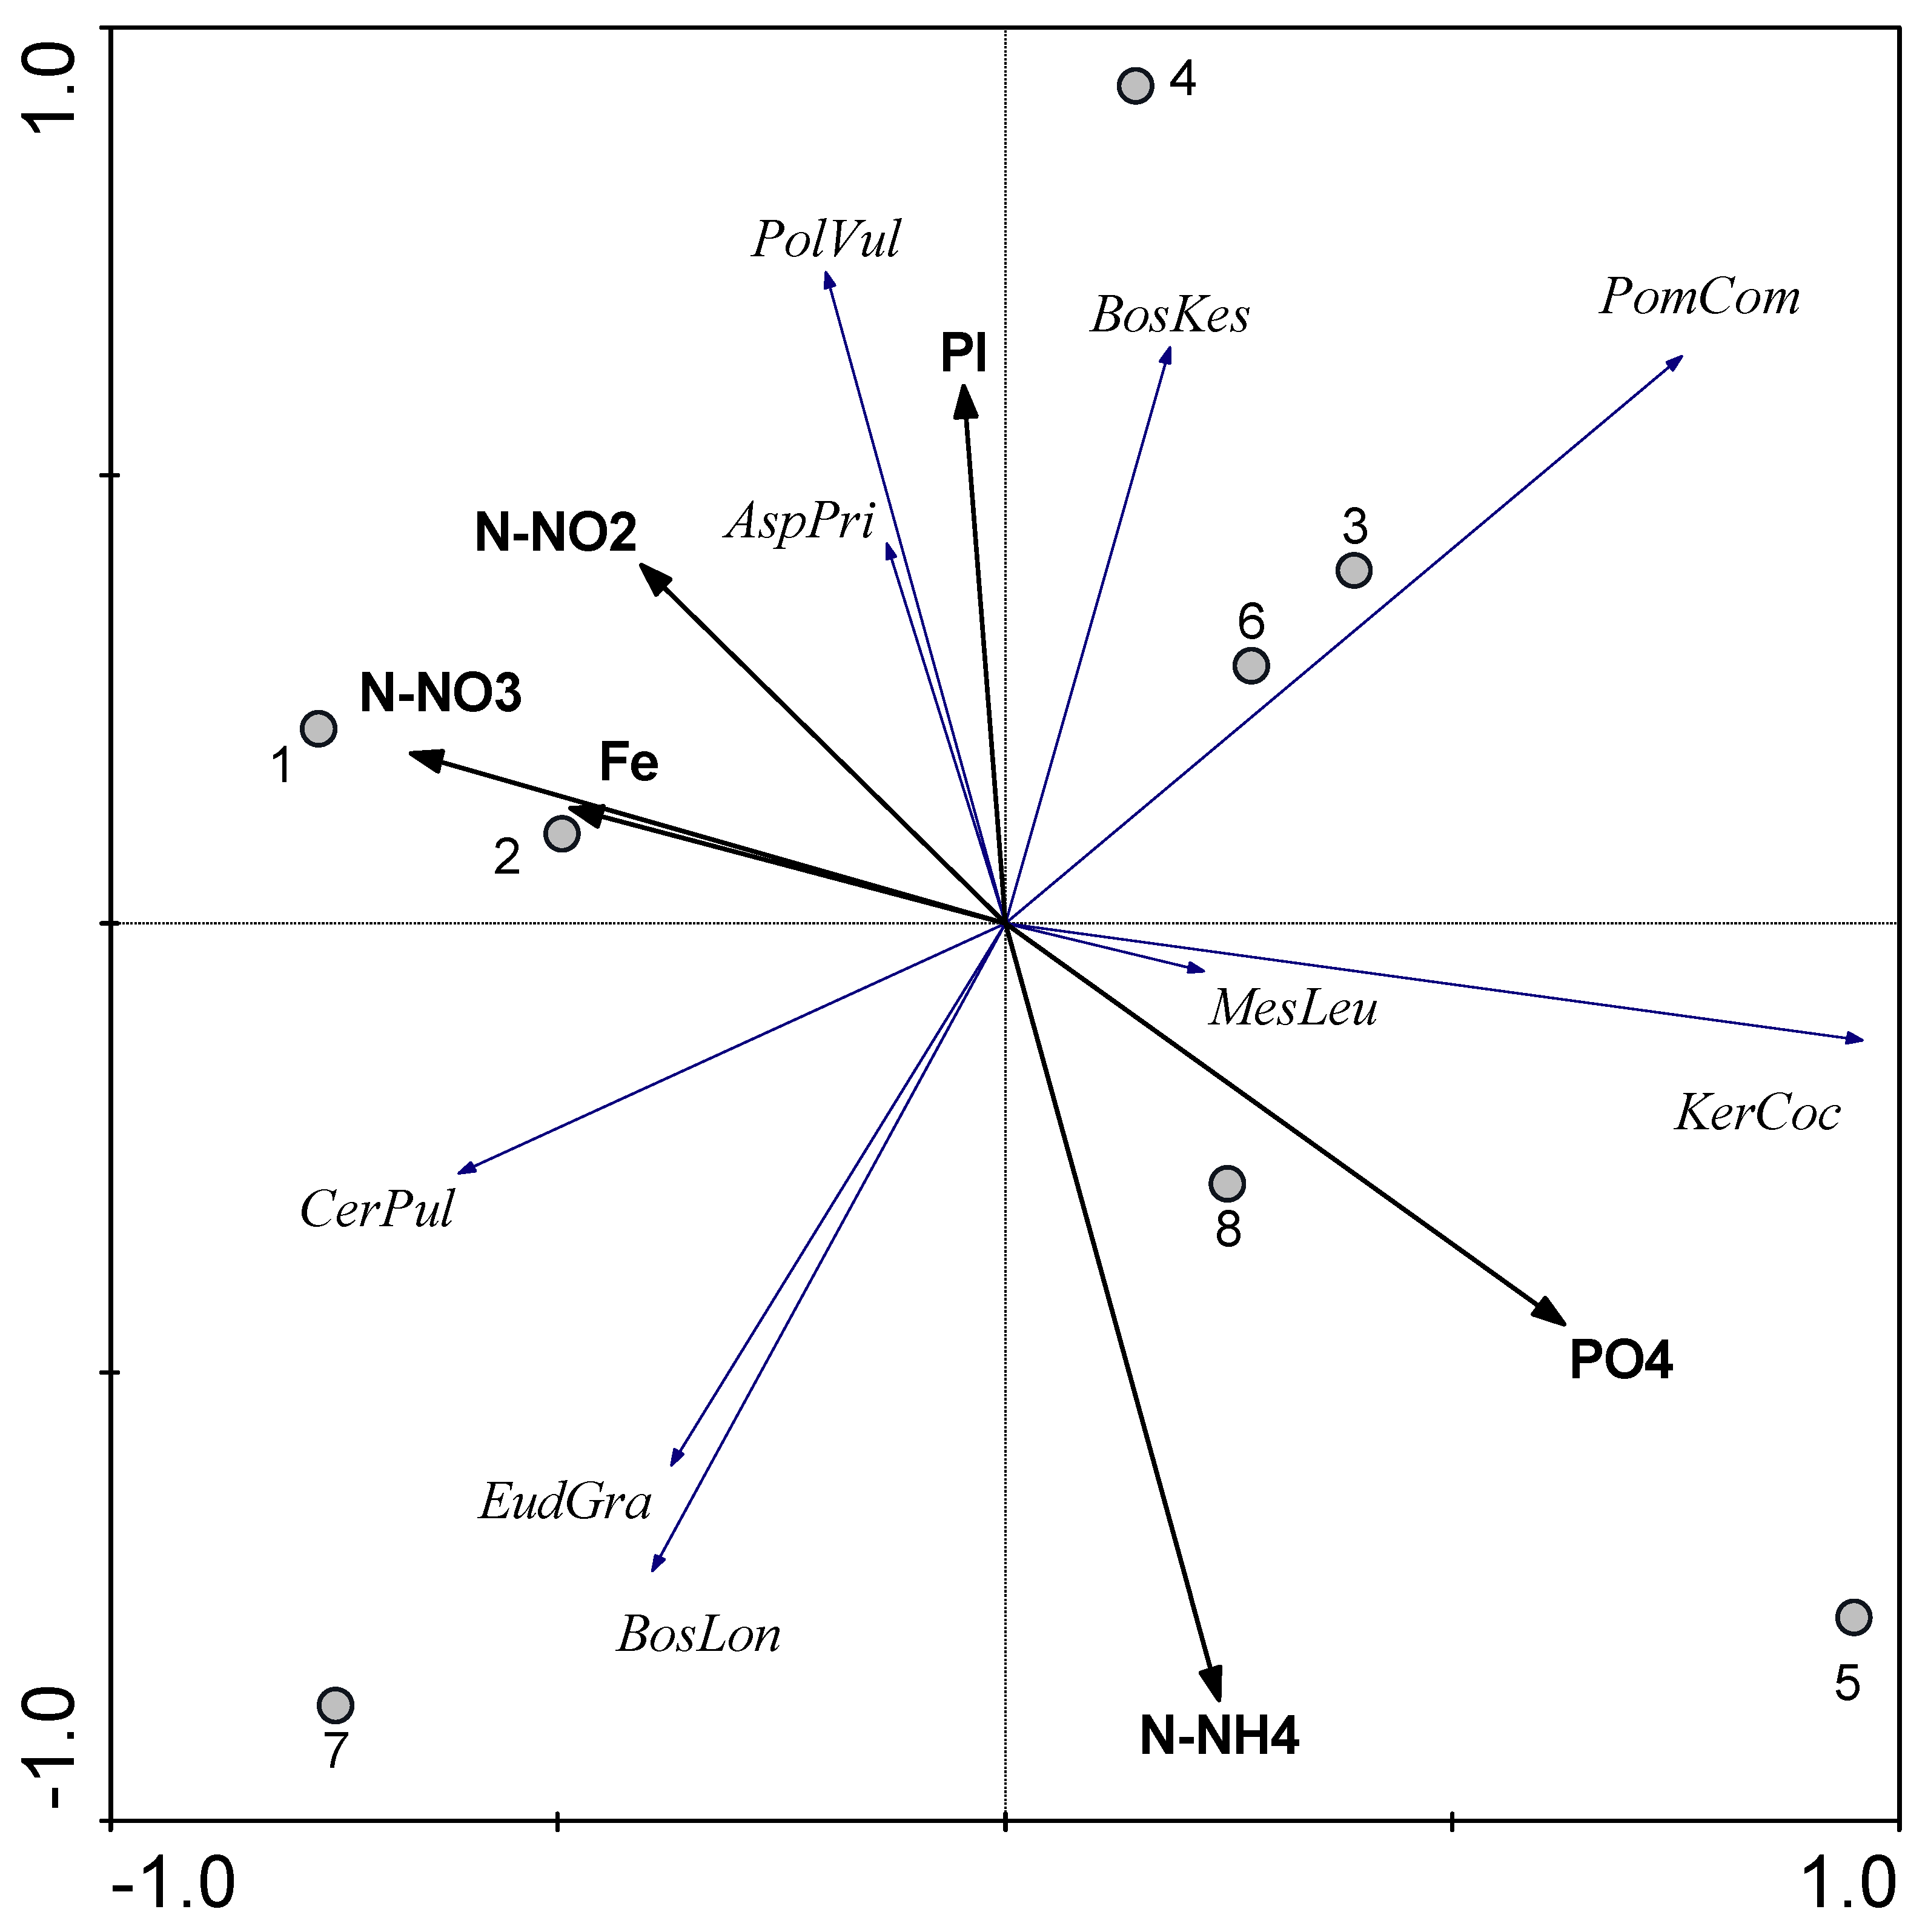
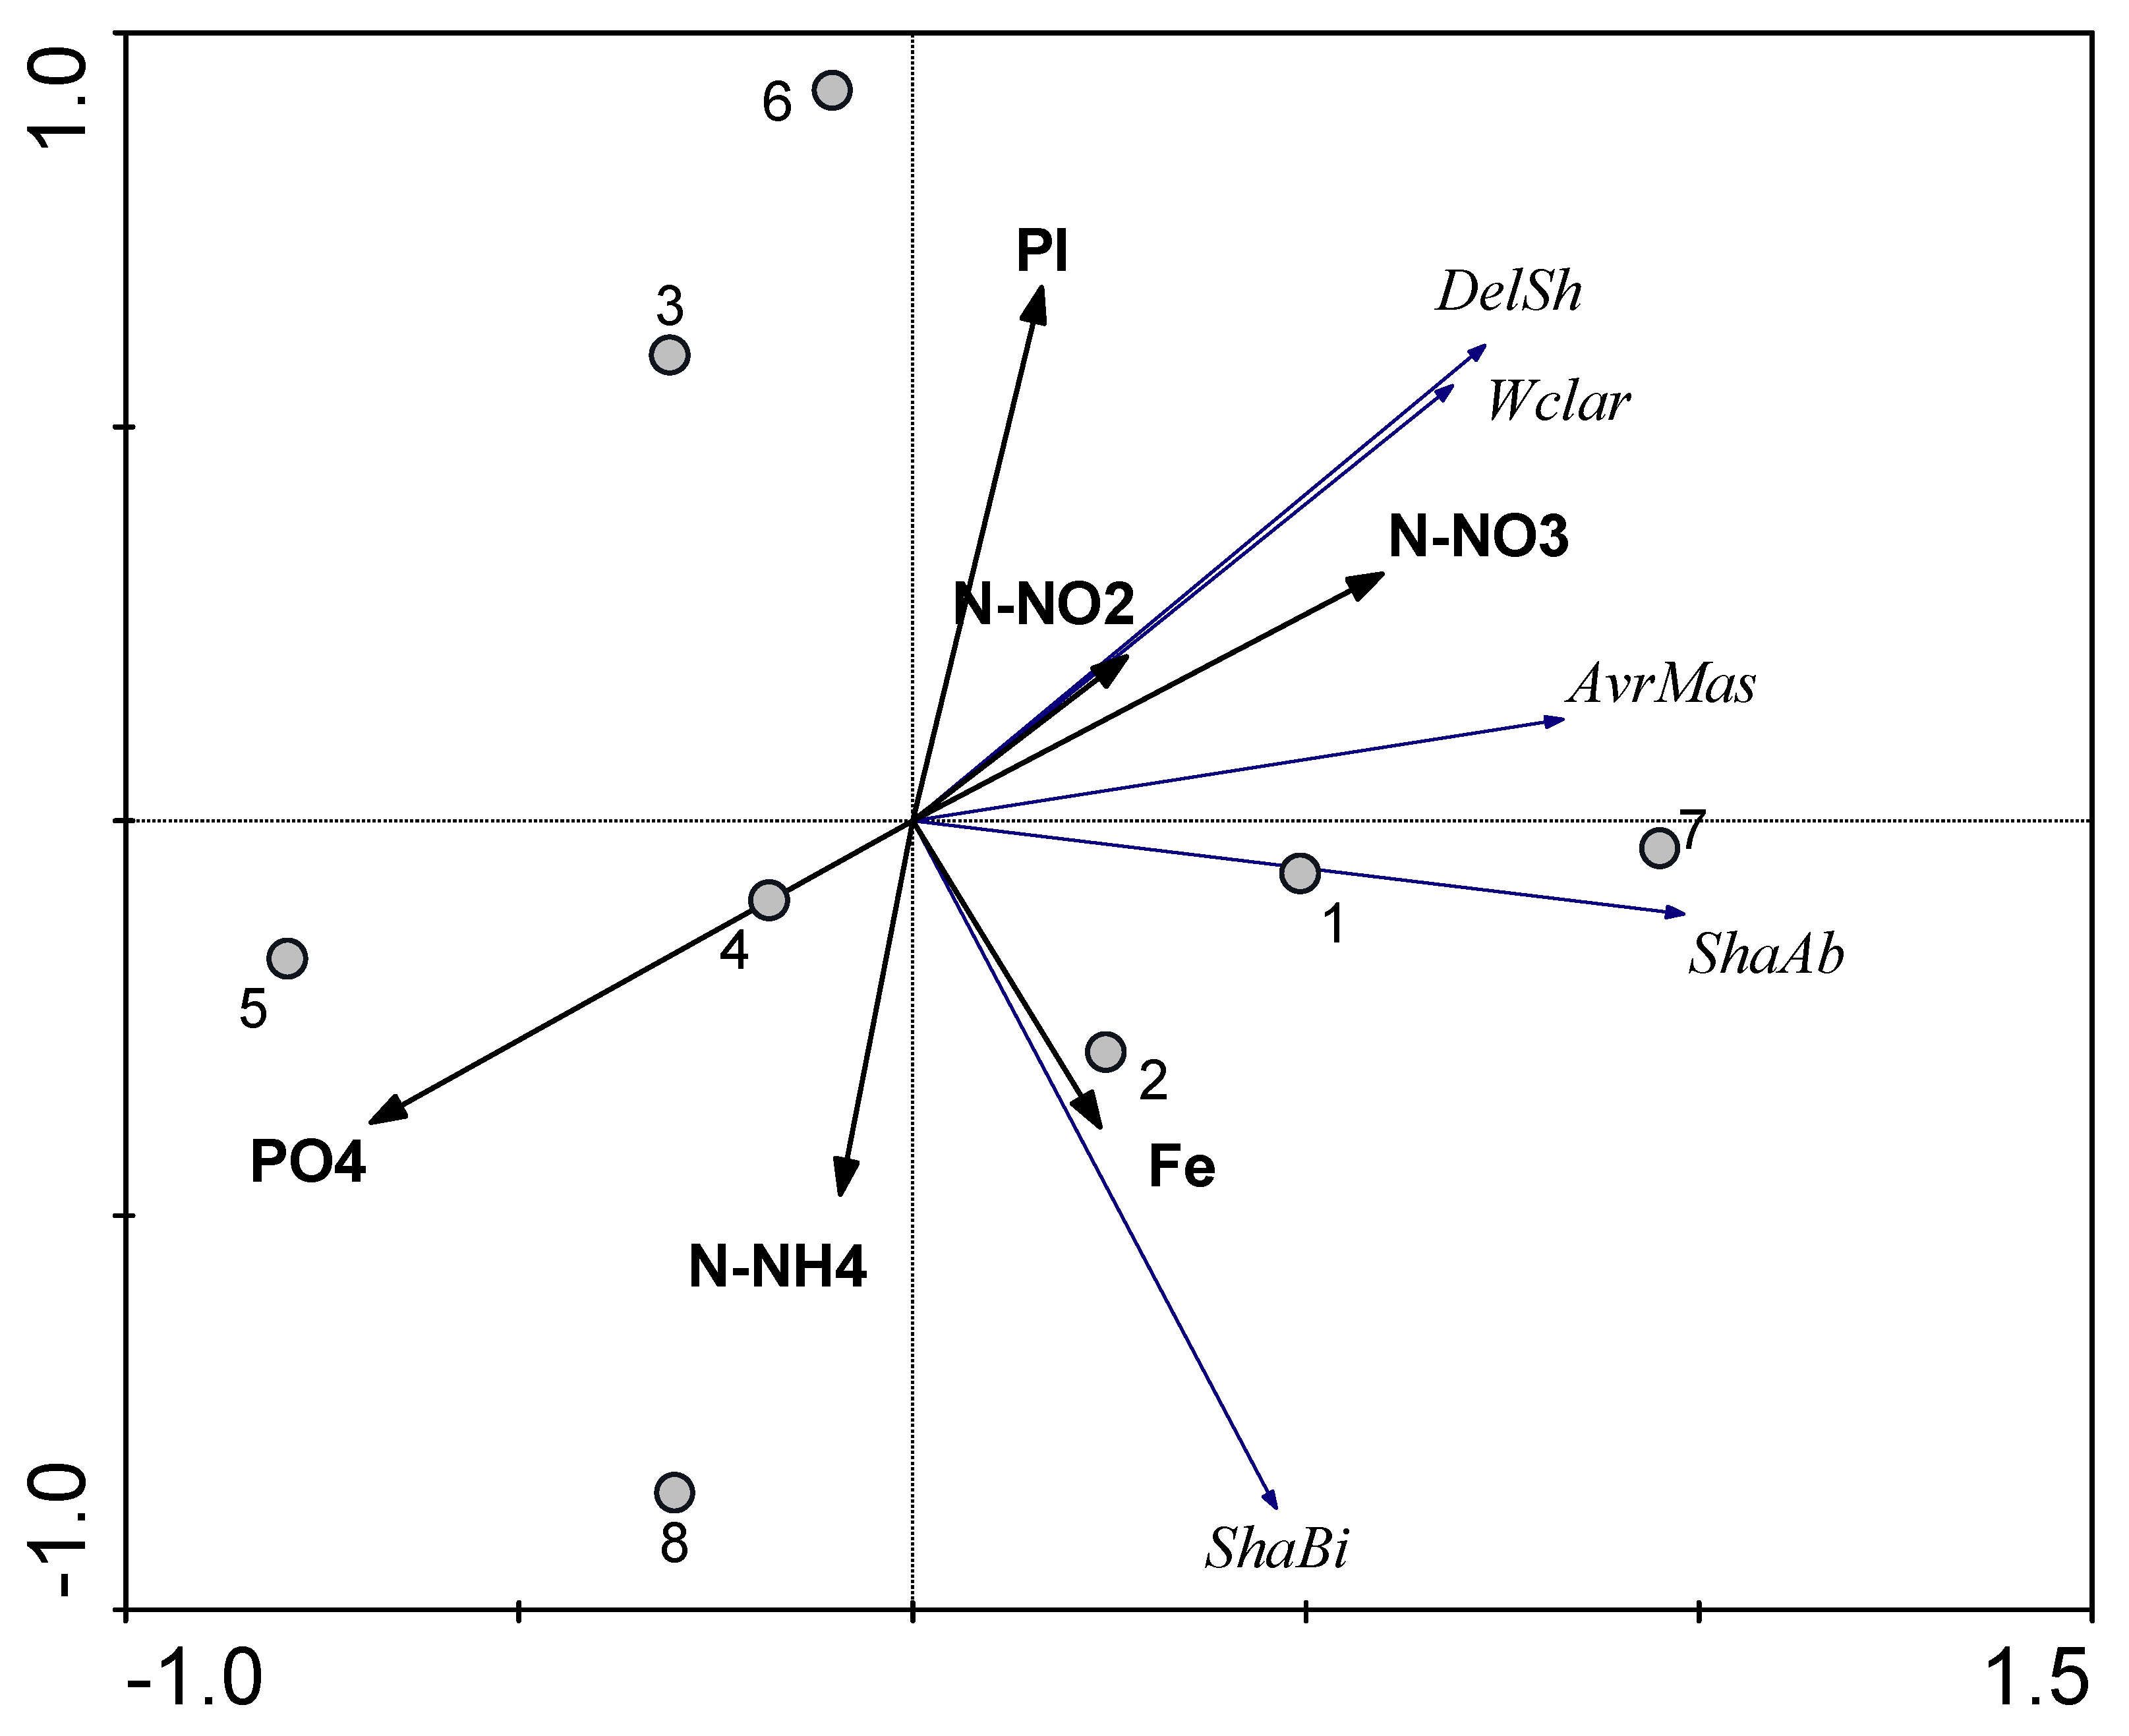
3.4. Redundancy Analysis (RDA)

According to the results of RDA analysis (Figure 5), it is possible to distinguish three groups of factors, which predicted spatial distribution of biological variables. The first group of factors included iron, nitrite, and nitrate nitrogen, and they were connected with stations 1, 2, and 7. The second group included phosphates and ammonium nitrogen, which were associated with stations 5 and 6. PI was associated with the stations 3, 4, and 8 located in west and east parts of the lake.
As Figure 5 demonstrates, nitrite nitrogen, iron, and partly PI were the main predictors of the distribution of Cladocera abundance; they had negative correlation with phosphates and ammonium nitrogen. Rotifera abundance was associated with phosphates, but there was a negative link with iron, nitrate, and nitrite nitrogen. Copepoda abundance was associated with ammonium nitrogen and phosphates; they had negative correlation with iron and nitrate nitrogen.
As for the dominant species of planktonic invertebrates, cyclopoid Mesocyclops leuckarti and rotifers Keratella cochlearis were mostly associated with phosphates, and both species had negative correlations with iron, nitrite, and nitrate nitrogen (Figure 6). Nitrite nitrogen together with easily oxidizable organic matter (PI) mostly predicted spatial distribution of rotifers Polyarthra vulgaris and Asplanchna priodonta, while Cladocera Bosmina kessleri was predicted by PI values. There are some species like Pompholyx complanata, Bosmina longirostris, Ceriodaphnia pulchella, and Eudiaptomus graciloides, which were not associated with any environmental variables.
As was noticed earlier, distributions of Δ-Shannon and Clark’s W-statistics values were strongly synchronous (Figure 7). Both variables were also connected with the average mass of individuals, and together they were associated with nitrate and nitrite nitrogen, partly with the amount of easily oxidizable organic matter (PI). The above structural variables of zooplankton had negative links with phosphates and ammonium nitrogen. The spatial distribution of the Shannon Bi index values can be associated mainly with the distribution of the iron over the water area of the lake.
Thus, the multivariate statistical analysis of the RDA made it possible to distinguish two groups of factors that have an opposite effect on biological variables (Table 5). The first group included N-NO2, N-NO3, and Fe, sometimes together with PI. Polyarthra vulgaris, Asplanchna priodonta, Bosmina kessleri, and Cladocera were associated with this group of factors (or with individual components). However, these factors were unfavorable for rotifers in general and the dominant Keratella cochlearis in particular and the cyclops Mesocyclops leuckarti. The second group of factors was represented by N-NH4+ and PO4, in some cases, together with PI. These factors (together or separately) were favorable for rotifers as a whole due to the dominant Keratella cochlearis, and the cyclops Mesocyclops leuckarti. At the same time, the second group of factors negatively influenced Polyarthra vulgaris, Asplanchna priodonta, Bosmina kessleri, and the total quantitative variables of Cladocera.
Like non-parametric correlation analysis, RDA showed a close relationship between the spatial distribution of Δ-Shannon, Clarke’s W-statistics, and average individual mass of an organism; these variables were positively affected by N-NO2, N-NO3, PI, and negatively by PO4, N-NH4+.

4. Discussion

4.1. Chemical Variables

According to the chemical data (Table 1), the content of heavy metals in Borovoe Lake was at a very low level (sometimes it was less than the sensitivity of the mass spectrometer) due to its remoteness from sources of industrial pollution. Such low concentrations of heavy metals are characterized by other protected lakes of Kazakhstan [2,13,53]. The average content of N-NO3, N-NH4, and PO4 did not exceed the maximum permissible concentrations (MPCf) established for fishery water bodies [52]. The average content of N-NO2 exceeded the MPCf in 1.5, fluorine is in 1.7, and iron in 2.5 times. Comparison these data with the ranks of water quality from the ecological point of view [54] showed that PI, the content of phosphates and nitrate nitrogen in Lake Borovoe corresponded to the level of quite clean, ammonium nitrogen—slightly polluted, nitrite nitrogen—moderately polluted water (Table 6). A similar not very high content of nutrients was also recorded in Borovoe Lake earlier [22,23,24,25,26], including the period of fish mortality in 1974 [27].

4.2. Biological Variables

The structure of the zooplankton community in Borovoe Lake–the high total abundance (Table 3), the dominance of the small rotifers Keratella cochlearis, Pompholyx complanata, cyclopoid M. leuckarti, the presence of crustaceans Bosmina longirostris, Ceriodaphnia pulchella, Chydorus sphaericus (Table 2), and low values of the average individual mass of an organism (Table 4) indicated an increased nutrients load [11]. Keratella cochlearis, Bosmina longirostris, Chydorus sphaericus are often described as typical species for eutrophic water bodies [55,56,57]. M. leuckarti dominance also confirms this conclusion, since the role of Cyclopoida increases with increasing trophy [11,55,56,57].
According to the average values of Shannon Bi (2.57 bit/mg), the zooplankton diversity in Lake Borovoe corresponded to the level of clean water bodies [11]. The contradictions with the above estimate are since the cited work postulates a linear decrease in the diversity of communities in the process of eutrophication of water bodies: from 2.6–4.0 bit/mg in oligotrophic to 0.1–2.0 bit/mg in eutrophic conditions. Subsequent studies have shown the nonlinear variability of the structure of hydrocenoses in the gradient of external factors [58,59]. It was revealed that the maximum diversity of communities is formed in mesotrophic water bodies [60,61] and decreases in eutrophic or hypertrophic [4]. This is confirmed by the presence of two unequal extremums of diversity–in communities consisting of many small-sized species and in ones composed of a few large-sized species [62]. Negative statistically significant relationships between Shannon Bi and dimensional variables, as well as between dimensional variables and total zooplankton abundance [13,62], also indicate a complicated character of change in the diversity of biological communities as a trophic state of water body increases.
Following the concept of nonlinear variation in diversity [13,50,62], the values of the Shannon index mentioned above characterized not oligotrophic but, most likely, the eutrophic state of Borovoe Lake. This conclusion was consistent with an estimate based on other structural variables of zooplankton. Negative values of Clarke’s W-statistics and Δ-Shannon (Table 4) indicated the predominance of small species in planktonic communities, which usually occurs under the influence of stress [14,15], including increased levels of organic pollution [63].
In general, at relatively low concentrations of nutrients in the summer of 2019, the structure of zooplankton indicated the elevated level of organic pollution of Lake Borovoe.

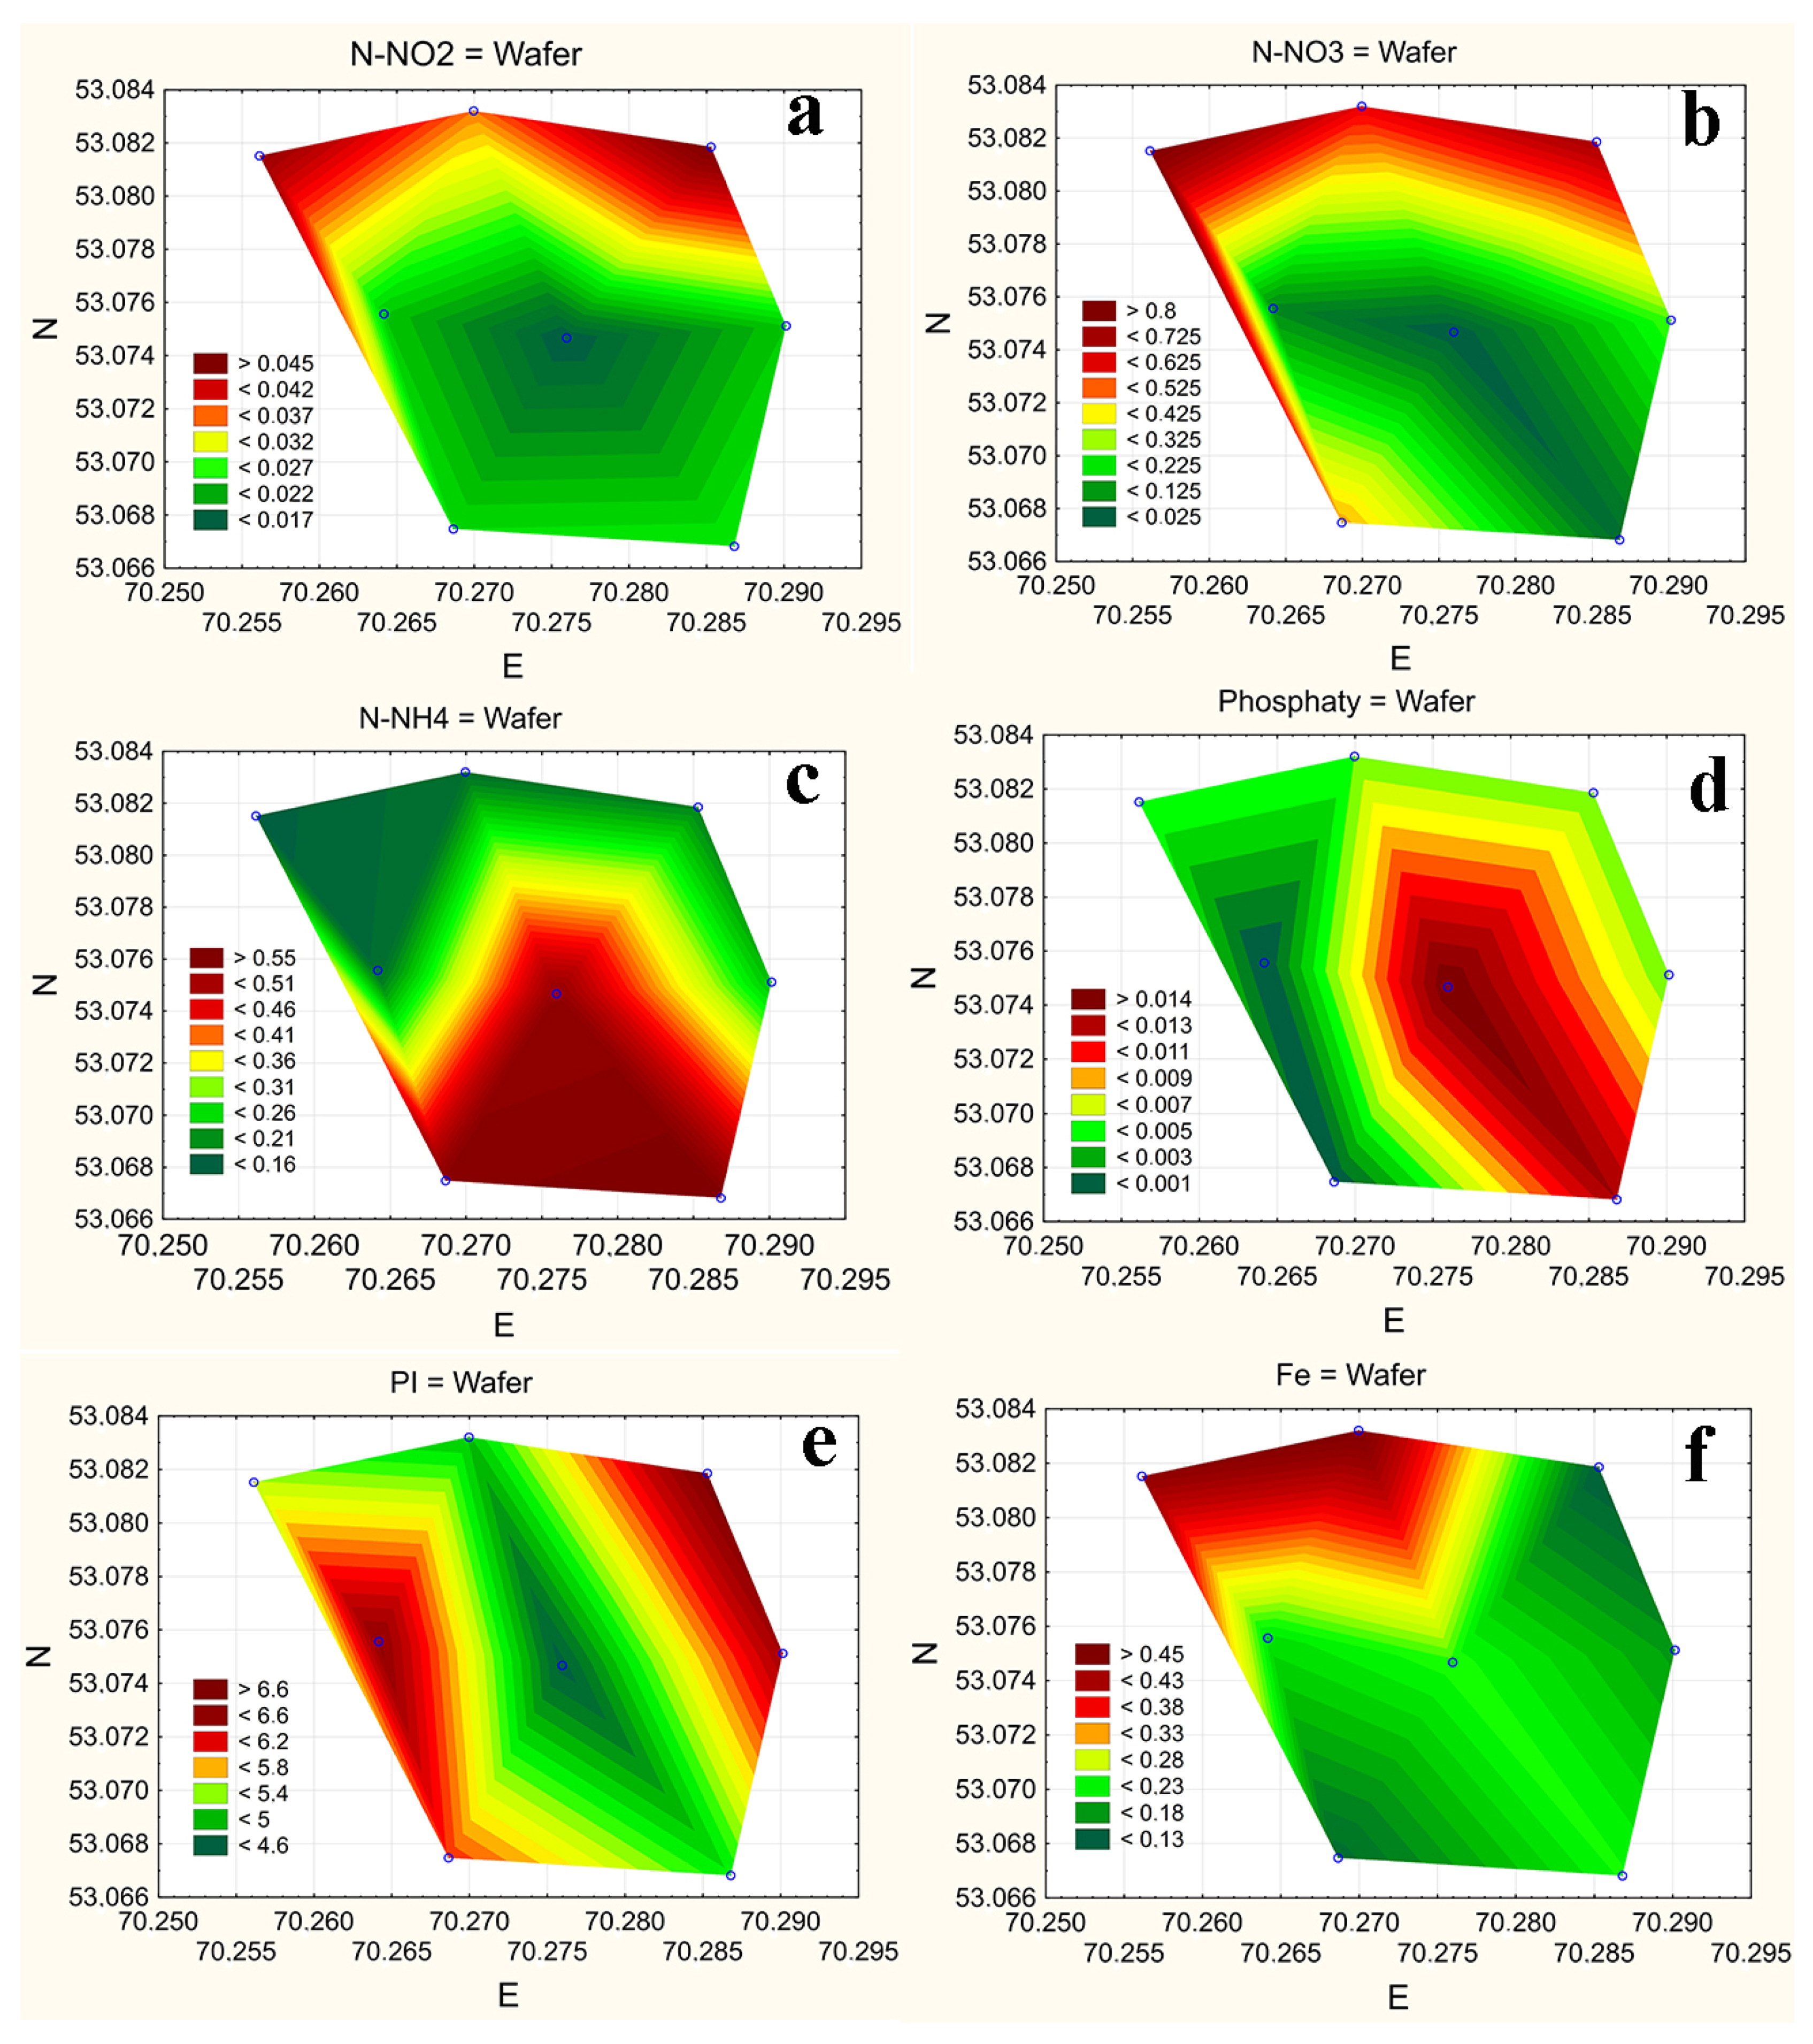
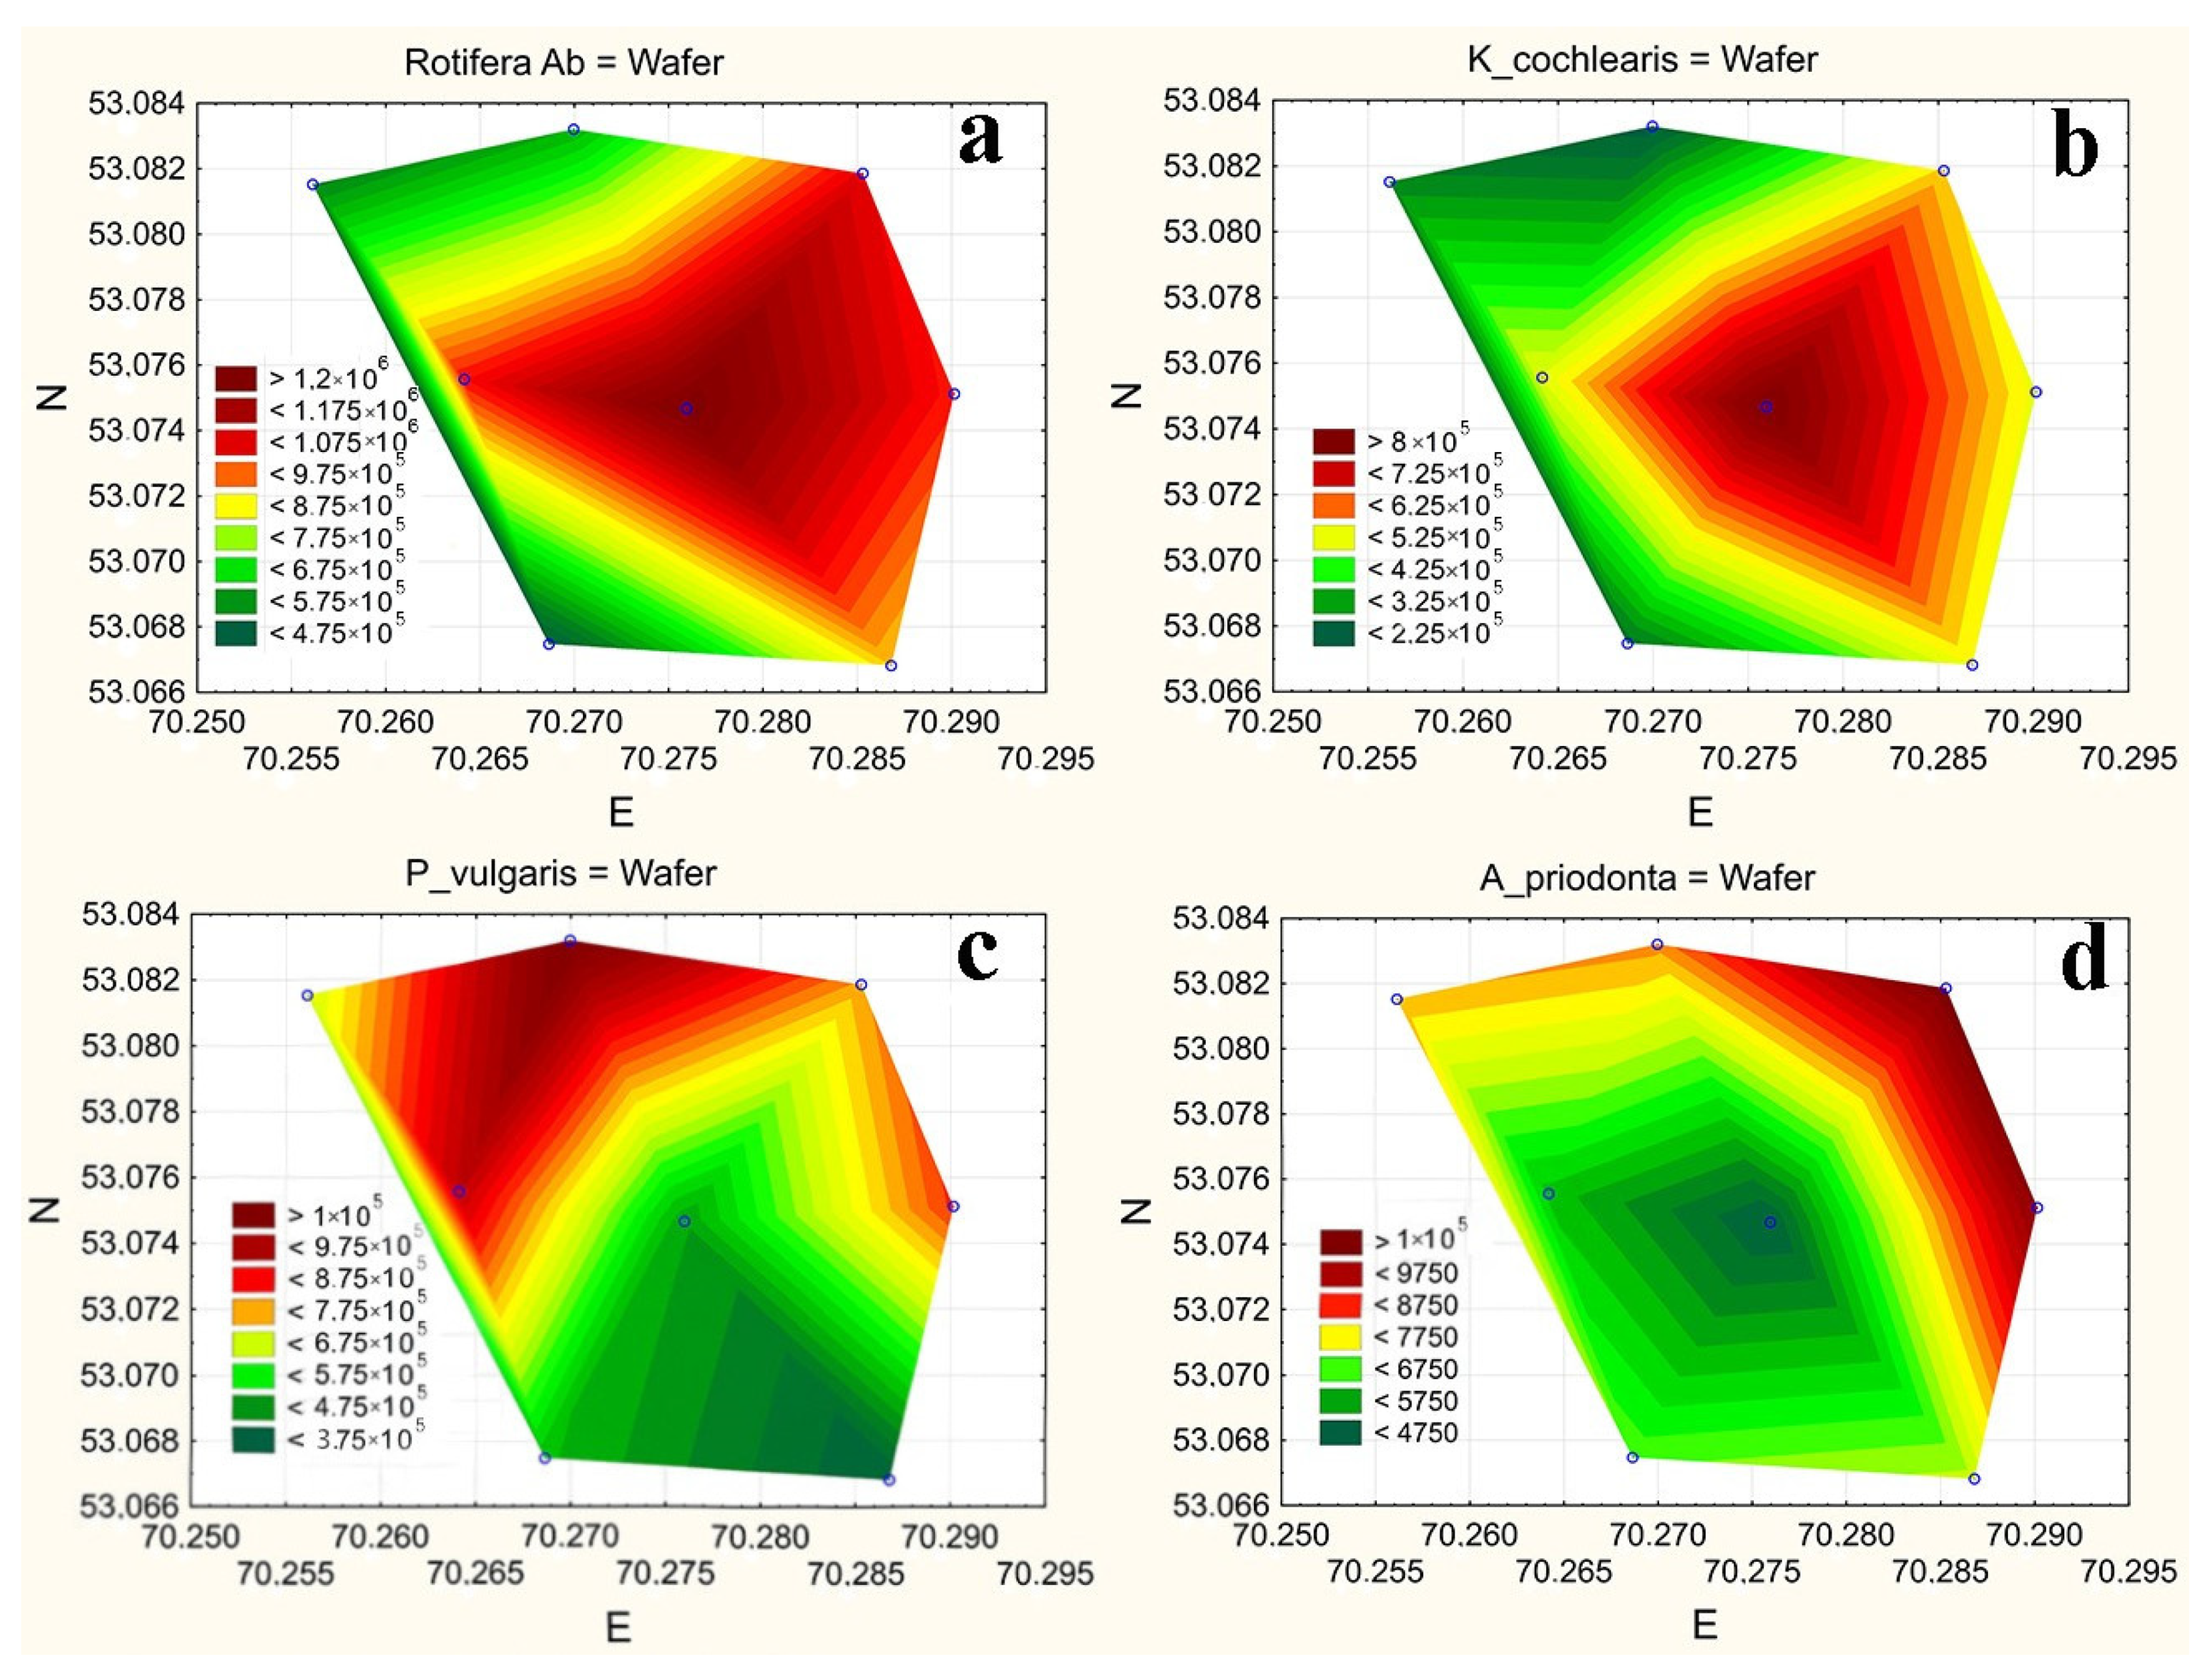
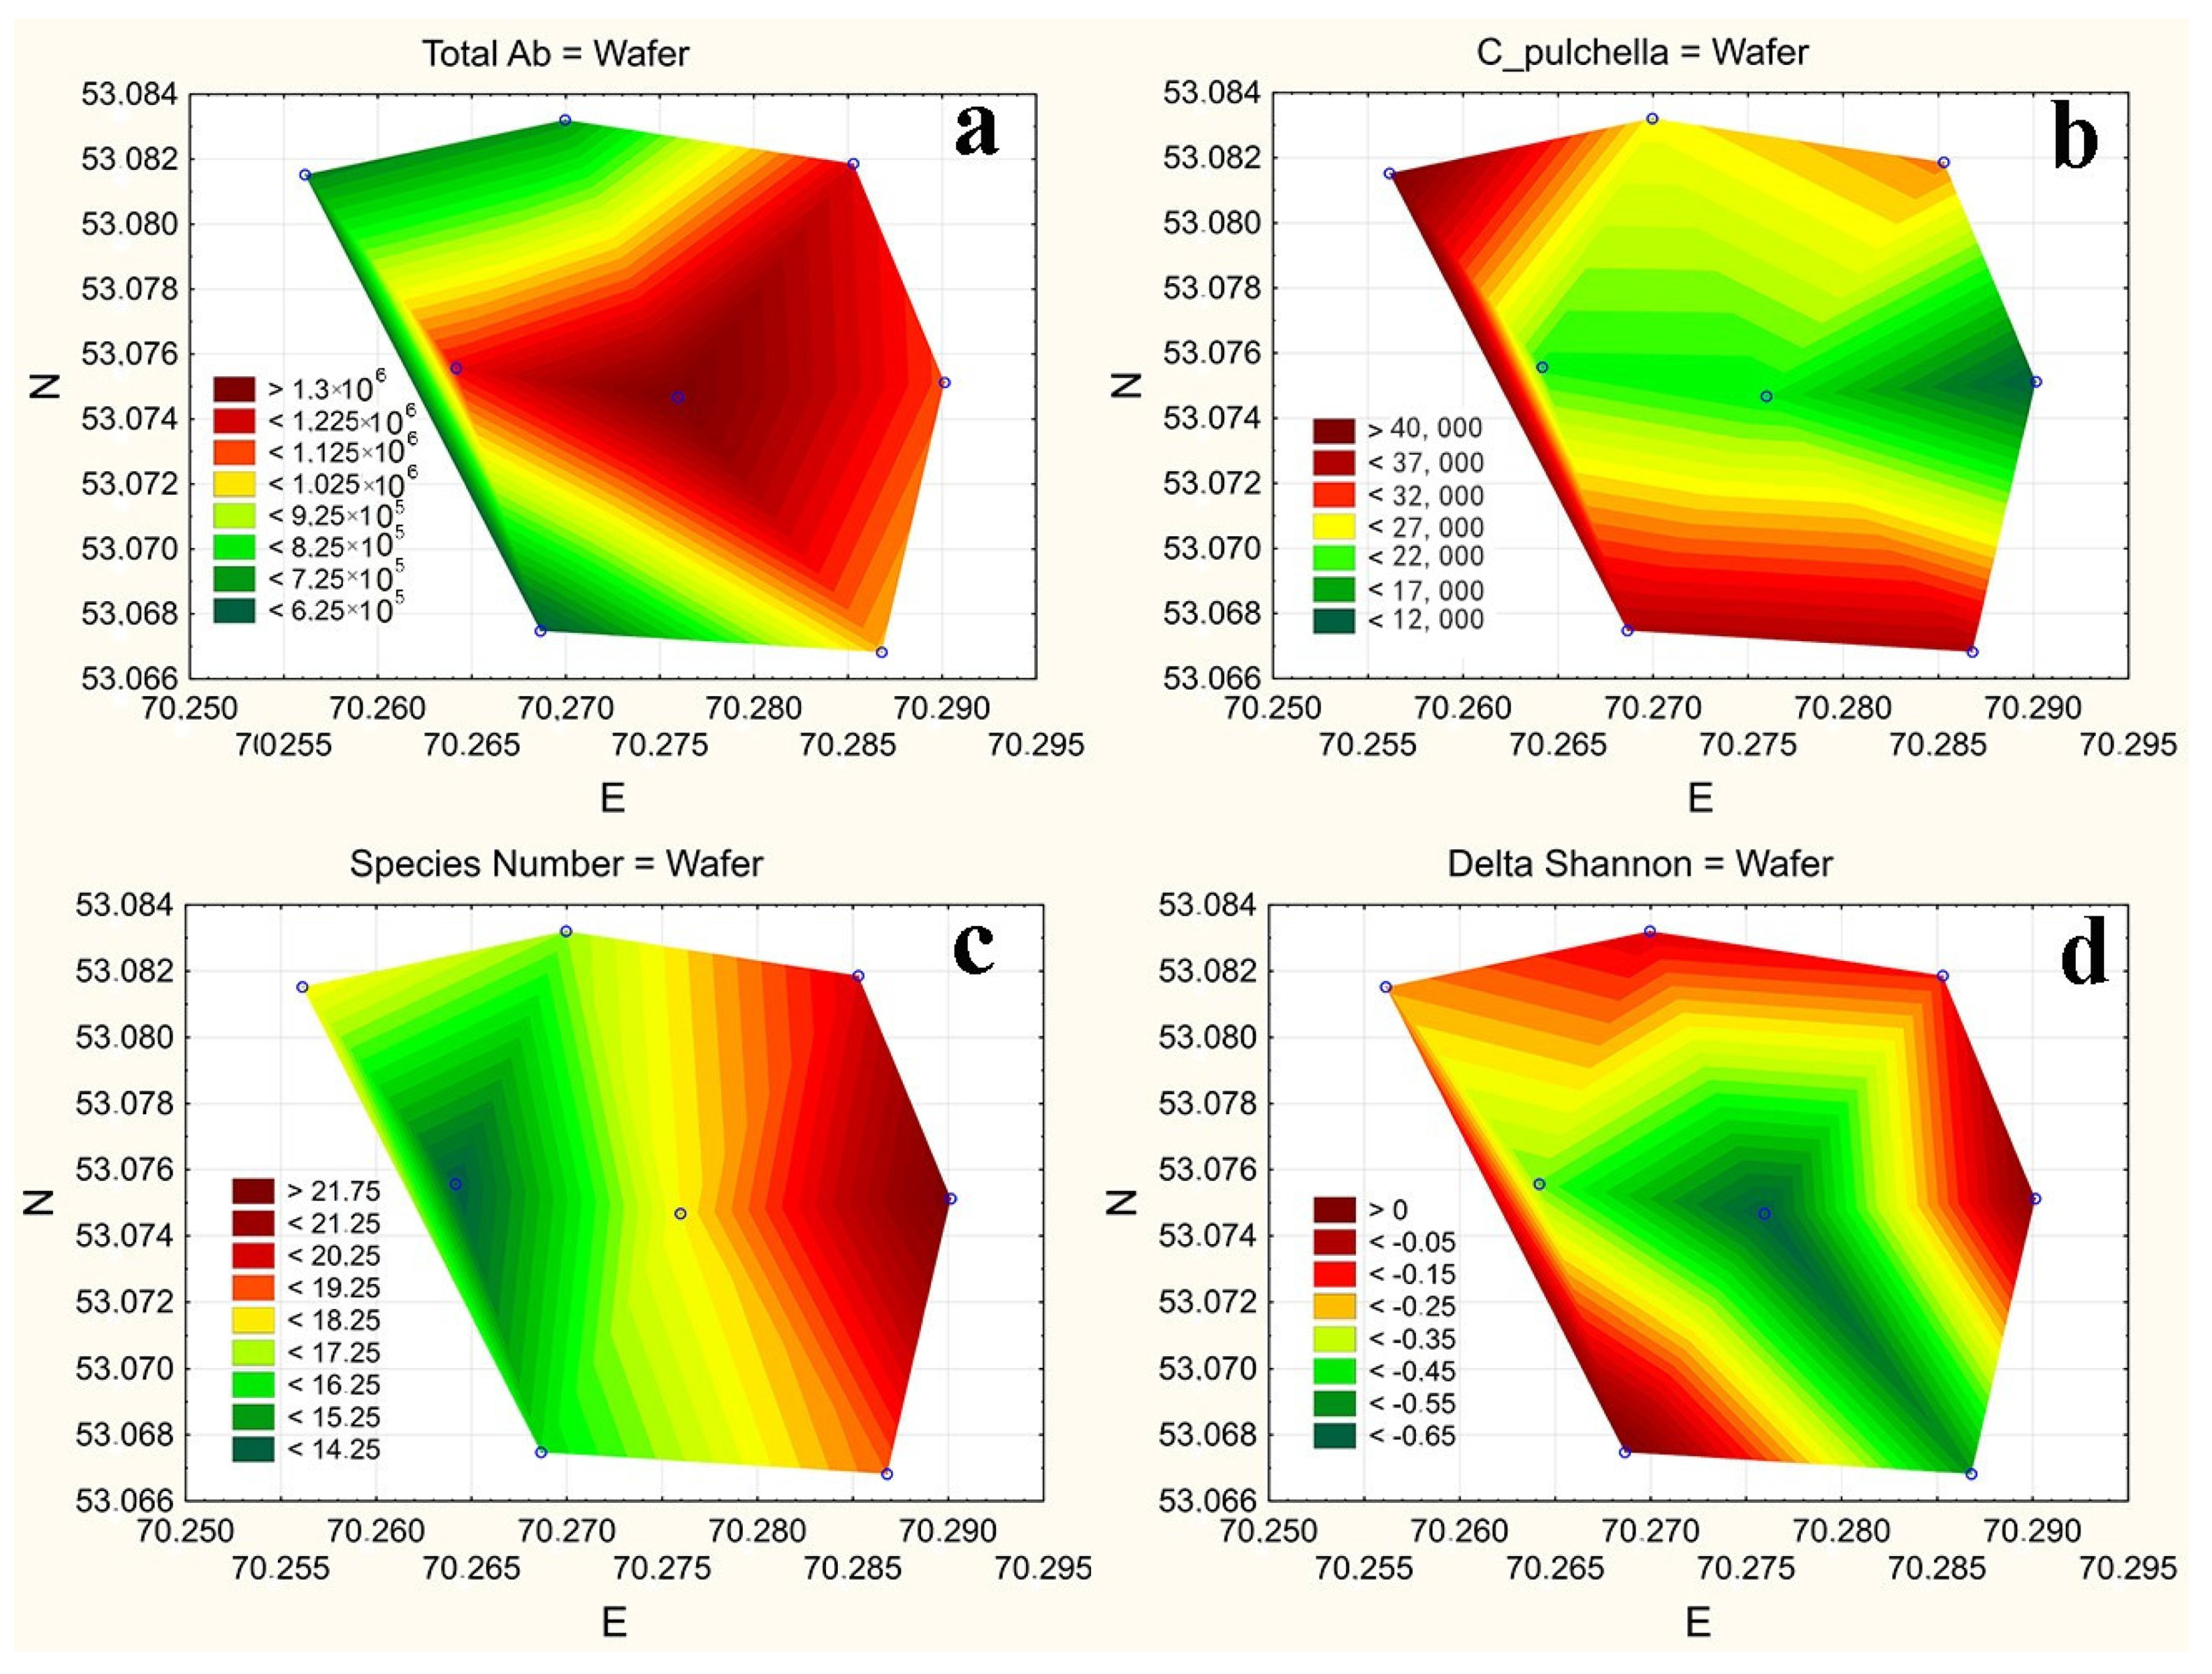
4.3. Statistical Mapping

Statistical data mapping demonstrates the synchronous spatial distribution of nitrites and nitrates with extremum in the northern part of the water area (Figure 2a,b). It seems that the primary sources of their entry into the lake are the sanatorium complexes of the Borovoe village on the northern shore (Figure 1). The high concentration of rotifers Polyarthra vulgaris (Figure 3c), which are indicators of mesosaprobic waters [64,65], but they are found in different trophic types of water bodies [66], was recorded here. Asplanchna priodonta, which is considered as oligotrophic species [67], and Bosmina kessleri (its environmental preferences are not established), also preferred the water area with elevated concentrations of nitrite nitrogen or PI.
According to (Figure 3c,d), the flows of ammonia and phosphates into the lake are mainly due to the influence of a large sanatorium located on the southeast coast (Figure 1). The impact of phosphates led to the accumulation of rotifers including the dominant species Keratella cochlearis in the central and southern parts of the lake. K. cochlearis is considered as β-mesosaprobic species [67], but it is common in eutrophic lakes [68]. Both ammonia and phosphates mostly affected cyclopoid copepod Mesocyclops leuckarti positively. It is a β-mesosaprobic species [67] but also inhabits eutrophic water bodies [69], including Kazakhstan [53]. Ammonium is an indicator of contamination with fresh organic matter [70]. Its entry into the lake stimulates an increase in the amount of phytoplankton [71], which, in turn, creates favorable trophic conditions for M. leuckarti. The source of pollution of the lake by easily oxidizable organic matter (Figure 2e) is, obviously, surface runoff from the beach area of the east coast (anthropogenic source) and river runoff from the west coast (natural source). The most sensitive to this factor was B. kessleri and M. leuckarti.
Among dominant species, the spatial distribution of Pompholyx complanata, Bosmina longirostris, Ceriodaphnia pulchella, and Eudiaptomus graciloides is more challenging to explain; obviously, it was determined by several factors.
The Δ-Shannon index is positively associated with the dimensional structure of the community [62]. Its minimum values in the southeastern and central parts of the lake (Figure 4d) reflected the predominance of small rotifers Keratella cochlearis here (Figure 3b).
In general, the spatial distribution of nutrients and zooplankton suggests that the lake is polluted by the communal services of the village of Borovoe and two large sanatoriums (Figure 1a). The main contribution of the village is associated not only with wastewater discharges, but also with surface runoff from the beach area along the east coast. Additionally, easily oxidized organic matter, and partially ammonium, enter the lake with water from the western tributaries.

4.4. Statistical Analysis

RDA analysis and partly the values of Spearman’s rank correlation coefficient confirmed the results of statistical mapping. According to RDA ordination plot, there are three groups of factors that are associated with different parts of the lake. Nitrite nitrogen, nitrate nitrogen, and iron are connected with stations located in the north part of the lake. It also confirms by positive correlation coefficient R between nitrite and nitrate nitrogen. This water area is influenced by the village of Borovoe. It seems that Polyarthra vulgaris, Asplanchna priodonta, and Bosmina kessleri are indicators of the elevated amounts of these chemical components. The second one included phosphate and ammonium nitrogen. They are associated with the south part of the lake, which is affected by the large sanatorium. It seems that Keratella cochlearis and Mesocyclops leuckarti are indicators of the elevated amounts of N-NH4+ and PO4. Easily oxidizable organic substances (PI) were associated with stations along the west and east coasts. These substances can enter into the lake due to both surface runoff from the beach area, which is on the eastern coast and the western tributaries. Connection biological variables with PI were less distinct in comparison with the factors of the first and second groups.

4.5. Interannual Changes in the Structure of Zooplankton

An analysis of interannual changes in the structure of zooplankton communities allows us to conclude that the organic pollution of Lake Borovoe has increased in recent decades. In 1964–2001, the abundance of planktonic invertebrates ranged from 4.8 to 515.0 thousand ind./m3, with biomass of 0.3–14.3 g/m3 [22,23,27]. In 2019, the abundance of zooplankton was almost two times higher than the maximum values of 1974 [27] and 9.1 times higher than the value of 2006 [24]. A relatively slight increase in community biomass by 2019 (from 1.22 to 1.59 g/m3) is due to the increased dominance of small-sized rotifers and a decrease in the role of relatively large crustaceans Mesocyclops leuckarti and Bosmina kessleri. The values of the average individual mass of an organism in the community decreased by order of magnitude—from 0.0112 to 0.0016 mg. Shannon Ab values decreased from 2.44 to 2.31 bit/ind., and Shannon Bi increased from 2.40 to 2.57 bit/mg, Δ-Shannon values decreased from 0.05 to −0.26. Comparison of primary data for 2006 [24] and 2019 using the Mann–Whitney U test [72] showed that differences in the abundance of rotifers (Z = −2.34, p = 0.019), total zooplankton (Z = −2.34, p = 0.018), and average individual mass of an organism (Z = 2.35, p = 0.019) were statistically significant.
In addition to the anthropogenic load, one of the reasons for the eutrophication of Lake Borovoe is the degradation of macrophyte communities. While in 1964–2002, macrophytes occupied 65–80% of the bottom surface [27], by 2019, they were found on approximately 30–35% of the bottom surface. A decrease in the role of macrophytes consuming nutrients [73] has created favorable conditions for planktonic algae [4] and, as a result, for planktonic invertebrates. Another factor affecting the quantitative variables and species composition of planktonic invertebrates may be their consumption by predators, for example, fish. At present, the ichthyofauna of Lake Borovoe is significantly depleted [26], which, along with the degradation of macrophytes, maybe the reason for the increase in the quantitative variables of zooplankton. However, according to [74], the decrease in the number of fish in Lake Borovoe should have led to the dominance of larger species of planktonic invertebrates than we registered in 2019. In fact, despite the decrease in fish pressure, the dominance of small species increased in zooplankton, which we explain the eutrophication of Lake Borovoe under the influence of long-term nutrient load.
Thus, the current ecological state of Lake Borovoe is the result of the interaction of external factors (the intensity and duration of anthropogenic impact, long-term accumulation of organic substances, climatic conditions of the year) and internal processes—the level of development of macrophytes, phytoplankton, and zooplankton communities, as well as fish predatory impact. The assessment of biological variables showed a significant increase in the eutrophication of Lake Borovoe, while the content of nutrients remains at a relatively low level.

5. Conclusions

In the summer of 2019, the structural variables of the zooplankton of the Borovoe Lake indicated pronounced eutrophication of its ecosystem. For 15 years, zooplankton abundance has increased significantly, with a relatively small increase in biomass. In all taxonomic groups of planktonic invertebrates, relatively large dominants of the past (Diaphanosoma brachyurum, Mesocyclops leuckarti) lost their leading position for smaller species (Keratella cochlearis, Pompholyx complanata, Ceriodaphnia pulchella). The average individual mass of the organism, which decreased by order of magnitude, reflected changes in the composition of dominant species in an integrated form. The main reason for the described changes in the structure of zooplankton communities and the deterioration of the ecological state of Lake Borovoe is nutrient enrichment, as well as degradation of macrophyte communities. Statistical data mapping, non-parametric correlation analysis, and RDA plots allowed us to make a reasonable assumption about the sources of organic matter in Lake Borovoe. It was shown that the primary source of nutrients to the lake is municipal wastewater and surface runoff from the surrounding area. Urgent measures are needed to reduce the amount of municipal wastewater entering Borovoe to prevent further degradation of the lake ecosystem.

Author Contributions

Conceptualization, methodology, writing, editing, E.K.; investigation, E.K., S.R., E.S.; data curation, software, G.B.; formal analysis, N.Y. All authors have read and agreed to the published version of the manuscript.

Funding

This research was funded by TOO “ECOSERVICE-S, grant number No. BR05236529.

Acknowledgments

The work was carried out under project no. BR05236529 for the Committee of Science, Ministry of Education and Science, Republic of Kazakhstan “A comprehensive assessment of the ecosystems of the Shchuchinsk-Borovsk resort area with the determination of the environmental load for the sustainable use of the recreational potential.” The authors express their sincere gratitude to S. Barinova (Haifa, Israel) for her help in multivariate data analysis.

Conflicts of Interest

The authors declare no conflict of interest.

References

  1. Anishchenko, O.V.; Glushchenko, L.A.; Dubovskaya, O.P.; Zuev, I.V.; Ageev, A.V.; Ivanova, E.A. Morphometry and metal concentrations in water and bottom sediments of mountain lakes in Ergaki natural park, western Sayan mountains. Water Resour. 2015, 42, 670–682. [Google Scholar] [CrossRef]
  2. Krupa, E.G.; Barinova, S.M.; Romanova, S.M.; Malybekov, A.B. Hydrobiological assessment of the high mountain Kolsay Lakes (Kungey Alatau, Southeastern Kazakhstan) ecosystems in climatic gradient. Br. J. Environ. Clim. Chang. 2016, 6, 259–278. [Google Scholar] [CrossRef]
  3. Moschonas, G.; Gowen, R.J.; Paterson, R.F.; Mitchell, E.; Stewart, B.M.; McNeill, S.; Glibert, P.M.; Davidson, K. Nitrogen dynamics and phytoplankton community structure: The role of organic nutrients. Biogeochemistry 2017, 134, 125–145. [Google Scholar] [CrossRef] [Green Version]
  4. Qin, B.Q.; Gao, G.; Zhu, G.W.; Zhang, Y.L.; Song, Y.Z.; Tang, X.M.G.; Xu, H.; Deng, J.M. Lake eutrophication and its ecosystem response. Chin. Sci. Bull. 2013, 58, 961–970. [Google Scholar] [CrossRef] [Green Version]
  5. Zhang, F.; Lee, J.; Liang, S.; Shum, C.K. Cyanobacteria blooms and non-alcoholic liver disease: Evidence from a county level ecological study in the United States. Environ. Health 2015, 14, 41. [Google Scholar] [CrossRef] [Green Version]
  6. Kubickova, B.; Babica, P.; Hilscherová, K.; Šindlerová, L. Effects of cyanobacterial toxins on the human gastrointestinal tract and the mucosal innate immune system. Environ. Sci. Eur. 2019, 31, 1–27. [Google Scholar] [CrossRef] [Green Version]
  7. Singh, W.R.; Kalamdhad, A.S. Transformation of nutrients and heavy metals during vermicomposting of the invasive green weed. Salvinia natans using Eisenia fetida. Int. J. Recycl. Org. Waste Agric. 2016, 5, 205–220. [Google Scholar] [CrossRef] [Green Version]
  8. Kowalczewska-Madura, K.; Kozak, A.; Dera, M.; Gołdyn, R. Internal loading of phosphorus from bottom sediments of two meso-eutrophic lakes. Int. J. Environ. Res. 2019, 13, 235–251. [Google Scholar] [CrossRef] [Green Version]
  9. Dembowska, E.A.; Mieszczankin, T.; Napiórkowski, P. Changes of the phytoplankton community as symptoms of deterioration of water quality in a shallow lake. Environ. Monit. Assess. 2018, 190, 95. [Google Scholar] [CrossRef] [Green Version]
  10. Aazami, J.; Sari, A.E.; Abdoli, A.; Sohrabi, H.; Van den Brink, P.J. Assessment of ecological quality of the Tajan river in Iran using a multimetric macroinvertebrate index and species traits. Environ. Manag. 2015, 56, 260–269. [Google Scholar] [CrossRef] [Green Version]
  11. Andronikova, I.N. Structural and Functional Organization of Zooplankton of Lake Ecosystems of Various Trophic Types; Nauka: St. Petersburg, Russia, 1996; p. 189. (In Russian) [Google Scholar]
  12. Krupa, E. Assessment of changes in the structure of zooplankton communities to infer water quality of the Caspian Sea. Diversity 2019, 11, 122. [Google Scholar] [CrossRef] [Green Version]
  13. Krupa, E.G.; Barinova, S.S.; Romanova, S.M. Zooplankton size structure in the Kolsay Mountain Lakes (Kungei Alatau, Southeastern Kazakhstan) and its relationships with environmental factors. Water Resour. 2019, 46, 403–414. [Google Scholar] [CrossRef]
  14. Warwick, R.M. A new method for detecting pollution effects on marine macrobenthic communities. Mar. Biol. 1986, 4, 557–562. [Google Scholar] [CrossRef]
  15. Clarke, K.R. Comparison of dominance curves. J. Exp. Mar. Biol. Ecol. 1990, 138, 143–157. [Google Scholar] [CrossRef]
  16. Krupa, E.G. The dominance structure of species in the zooplankton of the Kazakhstan sector of the Caspian Sea. In Some Aspects of Hydroecological Problems of Kazakhstan; Burlibaev, M.Z., Ed.; Kaganat: Almaty, Kazakhstan, 2011; pp. 236–246. ISBN 978-601-78-596-8. (In Russian) [Google Scholar]
  17. Krupa, E.G. The dominance structure of species in zooplankton communities of water bodies of Kazakhstan as an indicator of their ecological state. In Bioindication in the Monitoring of Freshwater Ecosystems; “Lubavitch”: St. Petersburg, Russia, 2011; pp. 175–180. (In Russian) [Google Scholar]
  18. Ochocka, A.; Pasztaleniec, A. Sensitivity of plankton indices to lake trophic conditions. Environ. Monit. Assess. 2016, 188, 622. [Google Scholar] [CrossRef] [PubMed] [Green Version]
  19. Ieromina, O.; Musters, C.J.M.; Bodegom, P.M.; Peijnenburg, W.J.G.M.; Vijver, M.G. Trait modality distribution of aquatic macrofauna communities as explained by pesticides and water chemistry. Ecotoxicology 2016, 25, 1170–1180. [Google Scholar] [CrossRef] [Green Version]
  20. Svensson, O.; Bellamy, A.S.; Van den Brink, P.J.; Tedengren, M.; Gunnarsson, J.S. Assessing the ecological impact of banana farms on water quality using aquatic macroinvertebrate community composition. Environ. Sci. Pollut. Res. 2018, 25, 13373–13381. [Google Scholar] [CrossRef]
  21. The Directive 2000/60/EP of the European Parliament and of the Council establishing a framework for community action in the field of water policy. Off. J. Eur. Commun. 2000, 327. Available online: https://www.eea.europa.eu/policy-documents/directive-2000-60-ec-of (accessed on 14 September 2020).
  22. Kurmanbaeva, A.S.; Khusainov, A.T.; Zhumai, E. Ecological condition of the Burabay lake of the Burabay State National Natural Park. Sci. News Kazakhstan 2019, 3, 202–209. (In Russian) [Google Scholar]
  23. Skakun, V.A.; Kiseleva, V.A.; Goryunova, A.I. The ecosystem of Lake Borovoy and the possibilities of its transformation. Selevinia 2002, 1–4, 249–264. (In Russian) [Google Scholar]
  24. Krupa, E.G. Zooplankton of the lakes of the Shchuchinsko-Borovsk system (northern Kazakhstan) as an indicator of their trophic state. Terra 2007, 3, 60–66. (In Russian) [Google Scholar]
  25. Ismailova, A.A.; Zhamankara, A.K.; Akbaeva, L.K.; Adamov, A.A.; Abakumov, A.I.; Tulegenov, S.A.; Muratov, R.M. Hydrochemical and hydrobiological indicators as characteristics of the ecological state of lakes (on the example of Burabay and Ulken Shabakty lakes). Bull. Kazakh Natl. Univ. Biol. Ser. 2013, 3/2, 503–507. (In Russian) [Google Scholar]
  26. Baimukanov, M.T.; Baimukanova, Z.M.; Rakybaeva, A.A.; Zhdanko, L.A. The state of hydrobionts of water bodies of specially protected natural territories of the republican significance of Northern and Central Kazakhstan. In State National Natural Park; “Burabay”: Almaty, Kazakhstan, 2016; p. 156. [Google Scholar]
  27. Goryunova, A.I.; Danko, E.K. Lake Fund of Kazakhstan. Section 1. Lakes of the Kokchetav Region (Within the Borders of 1964–1998; Zhania-Polygraph: LLP Almaty, Kazakhstan, 2009; p. 70. (In Russian) [Google Scholar]
  28. Barinova, S.; Bilous, O.; Ivanova, N. New Statistical Approach to Spatial Analysis of Ecosystem of the Sasyk Reservoir, Ukraine. Int. J. Ecotoxicol. Ecobiol. 2016, 1, 118–126. [Google Scholar] [CrossRef]
  29. Barinova, S. Ecological mapping in application to aquatic ecosystems bioindication: Problems and methods. Int. J. Environ. Sci. Nat. Resour. 2017, 3, 1–7. [Google Scholar] [CrossRef] [Green Version]
  30. Krupa, E.G.; Barinova, S.S.; Ponamareva, L.; Tsoy, V.N. Statistical mapping and 3-D surface plots in phytoplankton analysis of the Balkhash Lake (Kazakhstan). Transylv. Rev. Syst. Ecol. Res. Wetl. Divers. 2018, 20, 1–16. [Google Scholar] [CrossRef] [Green Version]
  31. Krupa, E.G.; Barinova, S.S.; Isbekov, K.B.; Assylbekova, S.Z. The use of zooplankton distribution maps for assessment of ecological status of the Shardara reservoir (Southern Kazakhstan). Ecohydrol. Hydrobiol. 2018, 1852–1865. [Google Scholar] [CrossRef]
  32. Krupa, E.; Barinova, S.; Aubakirova, M. Tracking pollution and its sources in the catchment-lake system of major waterbodies in Kazakhstan. Lakes Reserv. Res. Manag. 2020, 25, 18–30. [Google Scholar] [CrossRef]
  33. ISO 8467:1993. Water Quality. Determination of Permanganate Index. 1993. Available online: https://www.iso.org/standard/15669.html (accessed on 14 September 2020).
  34. Semenov, A.D. Guidance on the Chemical Analysis of Land Surface Water; Gidrometeoizdat: Leningrad, Russia, 1977; p. 541. (In Russian) [Google Scholar]
  35. Fomin, G.S. Water. Control of Chemical, Bacterial, and Radiation Safety According to International Standards; NGO Alternative: Moscow, Russia, 1995; p. 618. (In Russian) [Google Scholar]
  36. Interstate Standard 31 870-2012. Drinking Water. Determination of Elements Content by Atomic Spectrometry Methods; Standardinform: Moscow, Russia, 2013. (In Russian) [Google Scholar]
  37. Kiselev, I.A. Research methods of plankton. In Life of the Fresh Water of the USSR; Pavlovsky, E.N., Zhadin, V.I., Eds.; Academy of Sciences: Moscow, Russia; Leningrad, Russia, 1956; pp. 188–253. (In Russian) [Google Scholar]
  38. Balushkina, E.V.; Vinberg, G.G. The relationship between the length and body weight of planktonic crustaceans. In Experimental and Field Studies of the Biological Foundations of Lake Productivity; Vinberg, G.G., Ed.; Institute of lake and river fishery: Leningrad, Russia, 1979; pp. 58–79. (In Russian) [Google Scholar]
  39. Rylov, V.M. Fauna of the USSR. Crustaceans. Freshwater Cyclopoida; Nauka: Moscow, Russian, 1948; p. 312. (In Russian) [Google Scholar]
  40. Kutikova, L.A. Rotifers of the Fauna of the USSR; Science: Leningrad, Russia, 1964; p. 744. (In Russian) [Google Scholar]
  41. Tsalolikhin, S.Y. Key to Freshwater Invertebrates in Russia and Adjacent Territories; Zoological Institute: St. Petersburg, Russia, 1995; Issue 2, p. 628. (In Russian) [Google Scholar]
  42. Krupa, E.G.; Dobrokhotova, O.V.; Stuge, T.S. Fauna of Calanoida (Crustacea: Copepoda) of Kazakhstan and Adjacent Territories; Etalon Print: Almaty, Kazakhstan, 2016; p. 208. (In Russian) [Google Scholar]
  43. Magurran, E. Ecological Diversity and its Measurement; Mir: Moscow, Russia, 1998; p. 184. ISBN 5-03-002404-2. (In Russian) [Google Scholar]
  44. Shitikov, V.K.; Rosenberg, G.S.; Zinchenko, T.D. Quantitative Hydroecology: Methods of Systemic Identification; Institute of Ecology of the Volga Basin of the Russian Academy of Sciences: Togliatti, Russia, 2003; p. 463. ISBN 5-93424-109-5. (In Russian) [Google Scholar]
  45. Shannon, K. Works on Information Theory and Cybernetics; Foreign Literature: Moscow, Russia, 1963; pp. 243–332. [Google Scholar]
  46. Yakovlev, V.A. Assessment of the Surface Water Quality of the Kola North by Hydrobiological Indicators and Biotesting Data (Practical Recommendations); Apatity, Russia, 1988; p. 27. Available online: http://resources.krc.karelia.ru/library/doc/abstracts/jakovlev.pdf (accessed on 14 September 2020).
  47. Warwick, R.M.; Clarke, K.R. Relearning the ABC: Taxonomic changes and abundance/biomass relationships in disturbed benthic communities. Mar. Biol. 1994, 118, 739–744. [Google Scholar] [CrossRef]
  48. Odum, Y. Ecology; Mir: Moscow, Russia, 1981; p. 328. [Google Scholar]
  49. Barinova, S.; Krupa, E.; Romanova, S. The role of planktonic algae in the ecological assessment of storage-reservoirs of the Ile-Balkhash basin (Kazakhstan). Transylv. Rev. Syst. Ecol. Res. Wetl. Divers. 2018, 20, 1–14. [Google Scholar] [CrossRef] [Green Version]
  50. Krupa, E.G.; Barinova, S.S.; Assylbekova, S.Z.; Isbekov, K.B. Structural indicators of zooplankton of the Shardara Reservoir (Kazakhstan) and the main influencing factors. Turk. J. Fish. Aquat. Sci. 2018, 18, 659–669. [Google Scholar] [CrossRef]
  51. Šmilauer, P.; Lepš, J. Multivariate Analysis of Ecological Data Using Canoco 5; Cambridge University Press: Cambridge, UK, 2014; p. 527. [Google Scholar]
  52. Guseva, T.V. Hydrochemical Variables of the State of the Environment; Social and Environmental Union: Moscow, Russia, 2002; p. 148. (In Russian) [Google Scholar]
  53. Krupa, E.G. Zooplankton of limnic and lotic ecosystems in Kazakhstan. In Structure, Patterns of Formation; Palmarium Academic Publishing: Saarbrucken, Germany, 2012; p. 346. [Google Scholar]
  54. Barinova, S.S.; Medvedeva, L.A.; Anissimova, O.V. Diversity of Algal Indicators in Environmental Assessment; Pilies Studio: Tel Aviv, Israel, 2006; p. 495. ISBN 965-7272-18-1. (In Russian) [Google Scholar]
  55. Rosińska, J.; Romanowicz-Brzozowska, W.; Kozak, A.; Gołdyn, R. Zooplankton changes during bottom-up and top-down control due to sustainable restoration in a shallow urban lake. Environ. Sci. Pollut. Res. 2019, 26, 19575–19587. [Google Scholar] [CrossRef] [PubMed] [Green Version]
  56. Ejsmont-Karabin, J. The usefulness of zooplankton as lake ecosystem indicators: Rotifer trophic state index. Pol. J. Ecol. 2012, 60, 339–350. [Google Scholar]
  57. Ejsmont-Karabin, J.; Karabin, A. The suitability of zooplankton as lake ecosystem indicators: Crustacean trophic state index. Pol. J. Ecol. 2013, 61, 561–573. [Google Scholar]
  58. Protasov, A.A. Methodological and methodological problems of using diversity indicators for bioindication. In Bioindication in Monitoring Freshwater Ecosystems; LEMA: St. Petersburg, Russian, 2007; pp. 19–23. (In Russian) [Google Scholar]
  59. Penning, W.E.; Mjelde, M.; Dudley, B.; Hellsten, S.; Hanganu, J.; Kolada, A.; Van Den Berg, M.; Poikane, S.; Phillips, G.; Willby, N.; et al. Classifying aquatic macrophytes as indicators of eutrophication in European lakes. Aquat. Ecol. 2008, 42, 237–251. [Google Scholar] [CrossRef]
  60. Budka, A.; Łacka, A.; Szoszkiewicz, K. The use of rarefaction and extrapolation as methods of estimating the effects of river eutrophication on macrophyte diversity. Biodivers. Conserv. 2019, 28, 385–400. [Google Scholar] [CrossRef] [Green Version]
  61. Agatz, M.; Asmus, R.M.; Deventer, B. Structural changes in the benthic diatom community along an eutrophication gradient on a tidal flat. Helgol. Mar. Res. 1999, 53, 92–101. [Google Scholar] [CrossRef] [Green Version]
  62. Krupa, E.G.; Barinova, S.M. The use of structural indicators of hydrocenoses in assessing the ecological state of water bodies in Kazakhstan. In Bioindication in Monitoring Freshwater Ecosystems; Institute of Lake Studies: St. Petersburg, Russia, 2017; pp. 165–170. (In Russian) [Google Scholar]
  63. Krupa, E.G.; Barinova, S.S. Environmental variables regulating the phytoplankton structure in high mountain lakes. Res. J. Pharm. Biol. Chem. Sci. 2016, 4, 1251–1261. [Google Scholar]
  64. Globan, B. Unified Methods for the Study of Water Quality. Part III: Methods of Biological Analysis of Water; Publishing Department of the CMEA Secretariat: Moscow, Russia, 1983; p. 371. [Google Scholar]
  65. Ermolaeva, N.I.; Dvurechenskaya, S.Y. Regional indices of indicator significance of zooplankton organisms in water bodies of the south of Western Siberia. Ecology 2013, 6, 476–480. [Google Scholar]
  66. Jekatierynczuk-Rudczyk, E.; Zieliński, P.; Grabowska, M.; Ejsmont-Karabin, J.; Karpowicz, M.; Więcko, A. The trophic status of Suwałki Landscape Park lakes based on selected parameters (NE Poland). Environ. Monit. Assess. 2014, 186, 5101–5121. [Google Scholar] [CrossRef] [Green Version]
  67. Kolkowitz, R.; Marsson, M. Ökologie der tierischen Saprobien. Beiträge zur Lehre von der biologischen Gewässerbeurteilung. Internationale Revue der gesamten Hydrobiologie und Hydrographie, Band 2. 1909, pp. 126–152. Available online: https://onlinelibrary.wiley.com/doi/abs/10.1002/iroh.19090020108 (accessed on 14 September 2020).
  68. Saunders-Davies, A.P. Horizontal distribution of the plankton rotifers Keratella cochlearis (Bory de St Vincent) and Polyarthra vulgaris (Carlin) in a small eutrophic lake. In Rotifer Symposium. Developments in Hydrobiology; Ricci, C., Snell, T.W., King, C.E., Eds.; Springer: Dordrecht, The Netherlands, 1989; p. 52. [Google Scholar] [CrossRef]
  69. Maier, G. Coexistence of the predatory cyclopoids Acanthocyclops robustus (Sars) and Mesocyclops leuckarti (Claus) in a small eutrophic lake. In Intrazooplankton Predation. Developments in Hydrobiology; Dumont, H.J., Tundisi, J.G., Roche, K., Eds.; Springer: Dordrecht, The Netherlands, 1990; p. 60. [Google Scholar] [CrossRef]
  70. Zaghloul, A.; Saber, M.; El-Dewany, C. Chemical indicators for pollution detection in terrestrial and aquatic ecosystems. Bull. Natl. Res. Cent. 2019, 43, 156. [Google Scholar] [CrossRef]
  71. Martínez-López, A.; Hakspiel-Segura, C.; Escobedo-Urías, D.C.; González-Acosta, B. Influence of agriculture and aquaculture activities on the response of autotrophic picoplankton in Laguna Macapule, Gulf of California (Mexico). Ecol. Process. 2017, 6, 6. [Google Scholar] [CrossRef] [Green Version]
  72. Glantz, S.A. Primer of BIOSTATISTICS; Praktik: Moscow, Russia, 1998; p. 459. ISBN 5-89816-009-4. (In Russian) [Google Scholar]
  73. Muylaert, K.; Pérez-Martínez, C.; Sánchez-Castillo, P.; Lauridsen, T.L.; Vanderstukken, M.; Declerck, S.A.J.; Van der Gucht, K.; Conde-Porcuna, J.M.; Jeppesen, E.; De Meester, L.; et al. Influence of nutrients, submerged macrophytes and zooplankton grazing on phytoplankton biomass and diversity along a latitudinal gradient in Europe. Hydrobiologia 2010, 653, 79–90. [Google Scholar] [CrossRef]
  74. Dodson, S.I. Adaptative change in plankton morphology in response to size-selective predation: A new hypothesis of cyclomorphosis. Limnol. Oceanogr. 1974, 19, 721–729. [Google Scholar] [CrossRef]
Figure 1. Map of zooplankton sampling (red numbers), and bathymetry (bold numbers) of the Borovoe Lake (a), Lake Borovoe (b), beach area (c), Sary-Bulak (d) and Kurkure rivers (e).
Water 12 02580 g001
Figure 2. Spatial distribution of N-NO2 (a), N-NO3 (b), N-NH4 (c), PO4 (d), PI (e), and Fe (f) over the water area of the Borovoe Lake, 2019.
Water 12 02580 g002
Figure 3. Spatial distribution of abundance of rotifers (a), K. cochlearis (b), P. vulgaris (c), A. priodonta (d) over the water area of the Borovoe Lake, 2019.
Water 12 02580 g003
Figure 4. Spatial distribution of zooplankton abundance (a), abundance of C. pulchella (b), number of species (c), values of Δ-Shannon (d) over the water area of the Borovoe Lake, 2019.
Water 12 02580 g004
Figure 5. Redundancy analysis (RDA) ordination plot of environmental and quantitative variables of zooplankton of the Borovoe Lake, 2019. Circles−stations, blue arrows−biological variables, black arrows−environmental variables. Abbreviations used in the figure: RotAb−abundance of Rotifera, CladAb−abundance of Cladocera, CopAb−abundance of Copepoda, and TotAb−total zooplankton abundance.
Water 12 02580 g005
Figure 6. RDA ordination plot of environmental and quantitative variables of dominant species in the zooplankton of the Borovoe Lake, 2019. Abbreviations used in the figure: KerCoc−Keratella cochlearis, PolVul−Polyarthra vulgaris, PomCom−Pompholyx complanata, AspPri−Asplanchna priodonta, BosKes−Bosmina kessleri, BosLon−Bosmina longirostris, CerPul−Ceriodaphnia pulchella, EudGra−Eudiaptomus graciloides, MesLeu−Mesocyclops leuckarti.
Water 12 02580 g006
Figure 7. RDA ordination plot of environmental and structural variables of zooplankton of the Borovoe Lake, 2019. Abbreviations used in the figure: ShaBi−Shannon Bi, ShaAb−Shannon Ab, DelSh−Δ-Shannon, Wclar−Clarke’s W-statistics, AvrMas−average mass of an organism.
Water 12 02580 g007
Table 1. Average physico-chemical and toxicological characteristics of Borovoe Lake, 2019 (mean with standard error).
VariableValueVariableValueVariableValue
transparency, m0.63 ± 0.03N-NO2, mg/dm30.030 ± 0.004F, mg/dm32.49 ± 0.14
temperature, °C22.27 ± 0.22N-NO3, mg/dm30.372 ± 0.112Si, mg/dm36.50 ± 0.07
pH8.20 ± 0.03N-NH4, mg/dm30.321 ± 0.066Cd, mg/dm3<0.0001
TDS, mg dm−3191.5 ± 4.07PO4, mg/dm30.006 ± 0.002Cu, mg/dm30.0018 ± 0.0001
total hardness, mEq/dm32.09 ± 0.01Fe, mg/dm30.25 ± 0.05Pb, mg/dm30.0011 ± 0.0001
permanganate index PI, mgO/dm35.71 ± 0.28Mn, mg/dm3<0.001Zn, mg/dm30.0023 ± 0.0001
Table 2. Species composition and frequency of occurrence of planktonic invertebrates in the Borovoe Lake, 2019.
Taxon NameFrequency of
Occurrence, %
Taxon NameFrequency of
Occurrence, %
Rotifera Bosmina longirostris (O.F. Muller)87.5
Bdelloidea gen. sp. 162.5Ceriodaphnia pulchella (Sars)100.0
Bdelloidea gen. sp. 250.0Chydorus sphaericus (O.F. Muller)37.5
Asplanchna priodonta Gosse 100.0Daphnia galeata (G.O. Sars)37.5
Kellicottia longispina (Kellicott)100.0Leptodora kindtii (Focke)100.0
Keratella cochlearis (Gosse)100.0Sida crystallina (O.F.Muller)25.0
Notommatidae gen. sp.12.5Copepoda
Polyarthra vulgaris Carlin100.0Eudiaptomus graciloides (Lilljeborg)100.0
Pompholyx complanata Gosse100.0Macrocyclops albidus (Jurine)87.5
Postclausa hyptopus (Ehrenberg)50.0Mesocyclops leuckarti (Claus)100.0
Synchaeta stylata Wierzejski12.5Paracyclops sp.12.5
Trichocerca capucina (Wirzej et Zach.)25.0Ergasilus sieboldi Nordmann75.0
Trichocerca similis (Wierzejski)50.0Others
Rotifera gen. sp.100.0Oligochaeta gen. sp.25.0
Cladocera Ostracoda gen. sp.50.0
Bosmina kessleri Uljanin100.0Total:27 species
Table 3. Quantitative variables of zooplankton of the Borovoe Lake, 2019 (mean with standard error).
VariableRotatoriaCladoceraCopepodaOthersTotal
abundance, thousand ind. m−3857.7 ± 102.547.8 ± 48.383.5 ± 4.80.02 ± 0.01988.8 ± 101.7
share in the abundance,%86.74.88.4<0.01100.0
biomass, g m−30.62 ± 0.110.53 ± 0.040.36 ± 0.030.001 ± 0.0011.52 ± 0.11
share in the biomass,%40.935.124.0<0.01100.0
Table 4. Structural variables of zooplankton of Lake Borovoe, 2019 (mean with standard error).
The Average Number
of Species
Clarke’s
W-Statistics
Δ-ShannonAverage Individual
Mass of an Organism, mg
Shannon AbShannon Bi
18.0 ± 0.9−0.260 ± 0.091−0.040 ± 0.0150.0016 ± 0.00012.31 ± 0.102.57 ± 0.08
Table 5. Comparison of the results of multivariate analysis RDA.
Biological VariableEnvironmental Factors
Positive Negative
RotiferaPO4N-NO2, N-NO3, Fe
CladoceraN-NO2, Fe PO4, N-NH4+
CopepodaN-NH4+, PO4 Fe, N-NO2
Keratella cochlearisPO4 N-NO2, N-NO3, Fe
Polyarthra vulgarisPI, N-NO2N-NH4+, PO4
Asplanchna priodontaPI, N-NO2NH4, PO4
Bosmina kessleriPIN-NH4+
Mesocyclops leuckartiPO4N-NO2, N-NO3, Fe
Δ-Shannon, Clarke’s W-statistics, average individual mass of an organismN-NO2, N-NO3, PI PO4, N-NH4+
Shannon BiFe -
Table 6. Assessment of the organic pollution level of Lake Borovoe by nutrient content, 2019.
VariableMean Value in Borovoe Lake* Rank of Water Quality* Range of Values for the Rank
PI, mgO/dm35.7102b (quite clean)4.100–6.000
N-NO2, mg/dm30.0304a (moderately polluted)0.021–0.050
N-NO3, mg/dm30.3722b (quite clean)0.210–0.500
N-NH4, mg/dm30.3213b (slightly polluted)0.310–0.500
PO4, mg/dm30.0062a (quite clean)0.005–0.015
* Notice. According to [54].

