Building an Online Learning Module for Satellite Remote Sensing Applications in Hydrologic Science


1
Department of Civil, Environmental & Infrastructure Engineering, George Mason University, Fairfax, VA 22030, USA
2
Department of Environmental Science, Policy and Management, University of California, Berkeley, CA 94720-3114, USA
3
Department of Civil Engineering, University of Louisiana at Lafayette, Lafayette, LA 70503, USA
4
Department of Curriculum & Instruction, University of Houston, Houston, TX 77204, USA
*
Author to whom correspondence should be addressed.
Remote Sens. 2020, 12(18), 3009; https://doi.org/10.3390/rs12183009
Submission received: 29 July 2020
/
Revised: 12 September 2020
/
Accepted: 14 September 2020
/
Published: 16 September 2020
(This article belongs to the Collection Teaching and Learning in Remote Sensing)
Abstract
:This article presents an online teaching tool that introduces students to basic concepts of remote sensing and its applications in hydrology. The learning module is intended for junior/senior undergraduate students or junior graduate students with no (or little) prior experience in remote sensing, but with some basic background of environmental science, hydrology, statistics, and programming. This e-learning environment offers background content on the fundamentals of remote sensing, but also integrates a set of existing online tools for visualization and analysis of satellite observations. Specifically, students are introduced to a variety of satellite products and techniques that can be used to monitor and analyze changes in the hydrological cycle. At completion of the module, students are able to visualize remote sensing data (both in terms of time series and spatial maps), detect temporal trends, interpret satellite images, and assess errors and uncertainties in a remote sensing product. Students are given the opportunity to check their understanding as they progress through the module and also tackle complex real-life problems using remote sensing observations that professionals and scientists commonly use in practice. The learning tool is implemented in HydroLearn, an open-source, online platform for instructors to find and share learning modules and collaborate on developing teaching resources in hydrology and water resources.
1. Introduction
Earth observations refer to any information about physical, biological, and chemical characteristics of the Earth collected using remote-sensing, defined as the process of detecting and monitoring such characteristics by measuring the radiation that is reflected and emitted by an area on the Earth’s surface at a distance (typically from a satellite or an aircraft). Earth observations are critical to measure and study the occurrence, distribution, movement, and properties of water on our planet. Such information is fundamental, especially in regions of the world where no ground observations are available (e.g., Amazon Forest, High Mountain Asia) and where satellites are the only means to observe the regional and local hydrology. Remote sensing applications in hydrology and water resources engineering are numerous, spanning from characterizing the global water budget to monitoring hydroclimatic hazards (such as floods and droughts) or managing a reservoir.
Remote sensing concepts are often difficult to grasp for undergraduate students in science and engineering due to multiple factors. First off, remote sensing requires background knowledge in physics, geography, engineering, programing software, and computer science, among others, but also familiarity with the applications of this knowledge (e.g., hydrology, ecology, meteorology, oceanography, geology, infectious diseases, humanitarian operations, urban planning, and agriculture). This can be overwhelming, especially to undergraduate students that may not have the appropriate background to fully comprehend all aspects taught in a traditional remote sensing course.
Second, remote sensing is a rapidly growing technology, requiring continuous adaptation of the instructional methods used in educational programs [1]. Students are often faced with teaching material that is outdated and only covers classical optical and radar sensors, basic satellite retrieval principles, and the main image processing techniques, without introducing more novel technologies, such as Unmanned Aerial Systems (UAVs) that are becoming increasingly popular in science and engineering applications [2,3,4]. Furthermore, as pointed out by the authors of References [5] and [6], the potential of teaching remote sensing goes beyond just offering a broad range of topics. Students in science and engineering need to be educated on how to use earth observations to make decisions and/or to better understand physical processes. This process, especially in hydrology, is far from being linear and requires accurate analysis of the data, critical interpretation, and the incorporation of expertise in the field of application (e.g., ecohydrology, extreme event monitoring, crop management) [5].
Third, satellite images are different from the typical images students are familiar with. Normally, we experience our world from a horizontal viewpoint while living on its surface, and such a view is limited by obstructions such as buildings, trees, and topography. From a vertical or high oblique perspective (e.g., from a satellite, UAV, or aircraft), we see the multitude of surface features in their spatial and contextual relationships. Moreover, remote sensing uses several regions of the electromagnetic spectrum (including microwave and infrared wavelengths), which can be difficult for students to grasp, since the human eye can only see a limited portion of the electromagnetic spectrum (i.e., the visible). Thus, interpreting remote sensing images and deriving useful information relies on decoding information, which is not a trivial task. On a similar note, remote sensing products are characterized by several types of resolutions (spatial, spectral, radiometric, and temporal), which are not easy concepts for students to grasp and differentiate. Interpreting and analyzing remote sensing images is further complicated by the variety of data formats, which are usually chosen based not only on the requirements of the sensing system and mission objective, but also on the technology of data processing, archiving, and distribution systems, and community data standards [6].
These challenges also represent opportunities for course instructors. As stated above, remote sensing is a complex field, intertwined with several disciplines and applications. One of the key learning objectives in a remote sensing course should be to raise awareness of such complexity and interdependence with other fields of knowledge [7]. Class discussions (or board discussions within an e-learning environment) and collaborative work are educational techniques that instructors could use to achieve such an objective and enable students to exchange views across disciplinary borders.
The increasing availability of satellite data with longer time series allows for the use of such products in several applications. For instance, missions dedicated to monitor a specific hydrologic variable (e.g., the Soil Moisture Active Passive (SMAP [8]) for soil moisture and the Global Precipitation Mission (GPM [9]) for precipitation) offer the unique opportunity to introduce students to crucial concepts in hydrology. Furthermore, the free availability of satellite products is an opportunity for active learning [4]. For instance, instructors can develop learning activities that use real satellite data and already existing online tools to visualize and manipulate satellite images and products. Examples of these tools include the Worldview tool from NASA’s Earth Observing System Data and Information System (EOSDIS; https://worldview.earthdata.nasa.gov/) and the Mascon Visualization tool, developed by the Colorado Center for Astrodynamics Research (https://ccar.colorado.edu/grace/). Such activities can be particularly useful for fostering problem-based learning, motivating students and improving their interpretation and evaluation skills [10]. Past studies showed the importance of active learning compared to more traditional educational approaches. Active learning refers to any instructional method that gets students actively thinking about the content and has been proven to enhance students’ performance and pass rates in science, engineering, and mathematics [11]. Moreover, instructional methods that use real-world problems as a context for students to acquire knowledge develop more positive student attitudes, foster a deeper approach to learning, and help students retain knowledge longer than with traditional instruction [12,13,14,15].
The COVID-19 pandemic outbreak in late 2019–early 2020 undoubtedly challenged university education and, as a result of many lockdown orders, several courses moved to online platforms in Spring 2020 and will continue with a similar (or hybrid) format thorough the Fall semester (and possibly through 2021) [16]. Nevertheless, the rapid growth of information and communications technologies together with more and more online educational platforms can overcome some of the challenges posed by the pandemic. For remote sensing, in particular, the Internet was already playing a crucial role in face-to-face teaching, because of its intrinsic connection to multimedia technologies [17,18]. Thus, developing e-learning tools for remote sensing courses that take advantage of a variety of satellite products, visualization and analysis tools, and active learning approaches has the potential to improve college students’ experience and their attitude toward complex remote sensing concepts.
In this article, we describe an online module on Remote Sensing Applications in Hydrology that uses research-based active learning methods within an online learning platform, i.e., HydroLearn. The overarching goal of the module is to introduce students to fundamental remote sensing concepts, online tools to manipulate satellite-based data and images and select applications in the field of hydrology. This is not a full course; instead, it covers the material traditionally taught in a few weeks within a semester-long course for junior/senior undergraduate students or junior graduate students. Specifically, the total time it would take to complete the module is approximately 16–18 h. The module could be used in many different fashions. For instance, one of the authors will use it within her Remote Sensing of the Environment course to familiarize students with some hydrologic applications of the tools they learn in the course. Another author will use it in a Water Resources Engineering course to introduce students to advanced tools (i.e., remote sensing observations, trend analysis, image interpretation) commonly used to solve problems in the field. The module could also be combined with other HydroLearn modules that cover different aspects and topics of hydrologic sciences. The process to develop the module is described in detail in Section 3, whereas the instructional content is presented in Section 4. The module is grounded in problem-based learning, in which relevant tasks are used to provide the context of major remote sensing concepts in the hydrology field and motivation for the learning. These activities, described in Section 5, use real-life examples to introduce hydrology concepts such as groundwater depletion of the aquifers and melting of glaciers that can be detected by remotely sensed observations, the effect of extreme weather events (such as hurricanes) on land surface vegetation, and the physical and anthropogenic processes that may cause soil moisture variability.
2. HydroLearn
A need for improving hydrology and water resources education has been increasingly expressed by the community (e.g., References [19,20]) to use emerging data and modeling platforms, supported with effective educational approaches such as active-learning and real-world case studies. A recent study used a customer-discovery approach with qualitative surveys to examine factors that affect the potential sustainability and community-scale adoption of educational innovations [21]. The study identified key barriers against developing or adopting educational innovations in the field, including lack of time that instructors need to develop new modules, steep learning curves for instructors to adopt existing modules, the need for continuous updates and refurbishment of “static” material, and rigidity of material and locality of case studies to specific hydrologic basins and datasets. Another key factor was the typical lack of assessment tools and evaluation data from the learning modules. The pedagogical approach available through the HydroLearn platform addresses some of these shortcomings by providing resources that allow for co-development and sharing of learning content, tools that allow for immediate editing and customization of datasets and instructions, and scaffolding mechanisms that support instructors in developing rubrics and assessment instruments. Through HydroLearn, instructors can explore existing modules and learning activities that can be used in their classrooms, customize such courses and activities, or develop new ones. One key aspect of the project is the collaborative approach: instructors are encouraged to share teaching content and feedback, additional resources, and get guidance from others on how to develop effective learning outcomes and assessment rubrics.
HydroLearn is built on the open-source edX platform and, thus, is freely accessible to everyone, although it is designed mainly for instructors and students around emerging topics in hydrology and water resources engineering. The purpose of HydroLearn is to (i) create a community of users with a common interest of active learning and innovative teaching in hydrology and water resources engineering, (ii) ease any existing barriers to the development and adoption of active-learning innovations, and (iii) disseminate sound pedagogical practices on how to develop effective learning activities and outcomes. In order to guarantee high learning performance, HydroLearn modules include assessment rubrics that aim to enhance student achievement through communicating the expected performance levels. Although the Remote Sensing Applications in Hydrology module described herein has not yet been implemented and studied with students, other HydroLearn modules, created on the principles described in Section 3, have been shown to support students’ understanding of mathematical modeling, as well as their engagement and learning gains. Our earlier work with modules designed with similar attributes (e.g., References [22,23]) showed that modules that include modern data analysis, use of real-world hydrologic datasets, and appreciation of uncertainties, have the most potential to facilitate students’ self-learning and enhance interests for future careers. In future phases of our work, we plan to perform evaluation analysis to quantify the effectiveness and impact of the module from a student’s perspective. We expect such evaluation to identify areas of improvements and revisions from which the module can benefit.
The authors were selected as Summer 2020 HydroLearn Fellows to participate in a 2-week long virtual hackathon and workshop. HydroLearn fellows included instructors of both undergraduate and graduate courses in hydrology and water resources with an interest in developing engaging online materials to use in their classes and to share with other faculty. As part of the workshop, fellows learned how to use and develop course modules in HydroLearn and were introduced to research-based practices in engineering education.
Fellows were divided into 14 teams of 2–3 instructors each and were assigned a content guide, responsible for providing guidance on the module scientific and/or engineering content, an education guide, responsible of providing guidance on the educational aspects of the learning experience, and a technical guide, typically a graduate student, who provided technical assistance with the HydroLearn platform. The authors worked as a team to design a module in Remote Sensing Applications in Hydrology. Maggioni and Girotto are the module developers, Habib the content guide, and Gallagher the education guide. The content guide provided overall guidance and feedback on the technical content of the module, its potential value for students, and general applicability to a broader audience, especially for undergraduate and early-graduate courses. The content guide also provided feedback on the authentic tasks within the module and whether they provide enriching experiences to the students through the use of real-world case studies, supported with actual datasets and model assessment. The content guide also reviewed the module to ensure that all adequate background and supporting material and instructions are provided so that the module can be adapted by other instructors without much dependence on the authors. The role of the education guide was similarly to provide guidance and feedback on the educational aspects of the module, including feedback regarding learning objectives, assessments, and constructive alignment between the objectives, assessments, and content presented. The details of this module and the process followed for its development are described in the next sections.
3. The Design Approach
A backward design approach was followed to create the online educational module. The concept of backward design was introduced by the authors of References [24] and [25] and proposes a three-step framework to assist instructors in developing educational content and assessments.
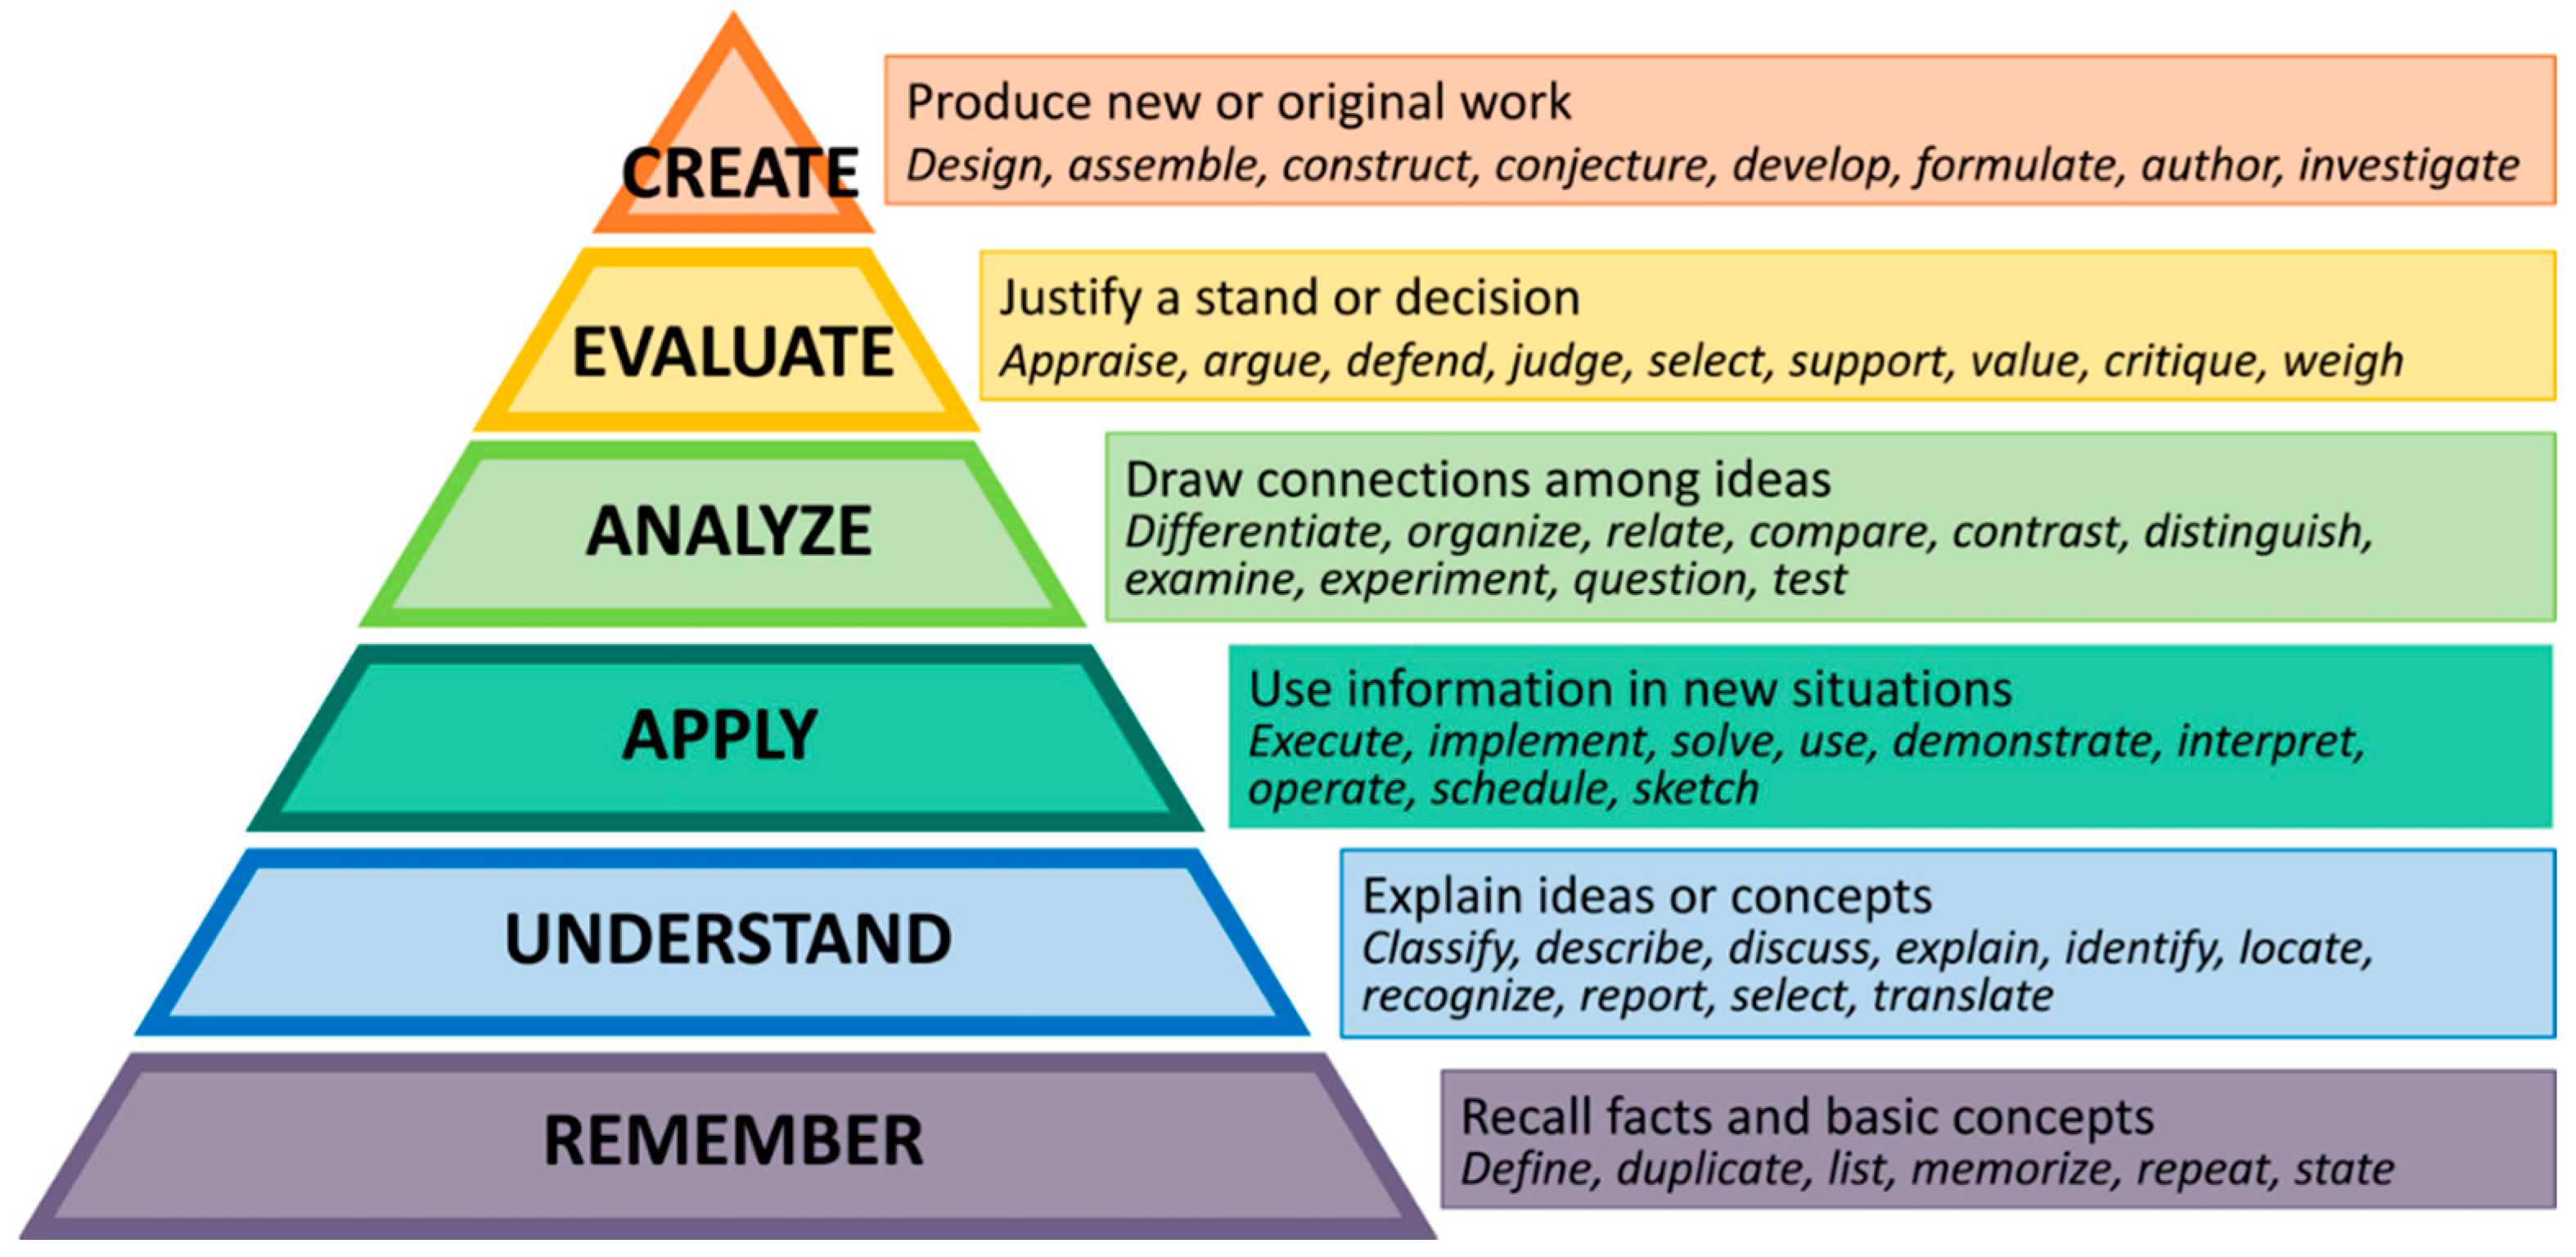
The first step consists of setting the learning objectives, which were identified following the specific format: [CONDITION], the student will be able to [ACTION] [TASK] [DEGREE]. The condition is the one under which the student will perform the described behavior. For several learning objectives that we selected for the Remote Sensing Applications in Hydrology module, we set the condition to be “Given a remote sensing dataset.” The action verb refers to the action associated with the intended learning level, whereas the task defines the knowledge students are expected to acquire. In our module, we tackled many different learning levels, as defined according to Bloom’s Taxonomy [26], shown in Figure 1, from more basic “remember” objectives all the way to ones that require a higher level of abstraction from the students (“evaluate”, “create”). The degree refers to the level of performance required, which was not set in our learning objectives. The learning objectives of our module are listed in Table 1, together with the corresponding Bloom’s Taxonomy.
In the second step, we created assessment tasks to collect evidence to determine whether students achieved the learning objectives and to what extent. Such tasks are a combination of simple problems, formulated for example as multiple choice or checkbox questions, and three culminating learning activities, described in detail in the next section. In the third and last step, we planned the learning content that students would need in order to complete the assessment tasks. The team only started developing instructional content on day 5 of the hackathon and spent the second week to complete it. The structure of the module and content are described in detail in Section 5 of this article.
Although organized in three well-defined steps, the process to develop the HydroLearn module was far from being linear. Once a task is generated, it is essential to verify that the learning objectives and content align with such assessment. Similarly, when the content is finalized, instructors should ensure that it covers all the notions and tools that students need to perform the tasks and achieve the objectives. This is what has been defined in Reference [27] as constructive alignment, a process to design learning activities that is based on the concept that the instructor aligns the teaching activities, learning outcomes, and assessments, with clearly defined criteria for providing assessment feedback to the learner [28]. Moreover, during the 2-week hackathon, the teams under the same content guide met every day in a virtual environment to share aspects of the module with which they were having difficulty, or were particularly successful. This was extremely valuable to provide/receive feedback to/from peers, but also learn how other fellows approached their module development and worked as a team in a virtual environment.
4. Instructional Content
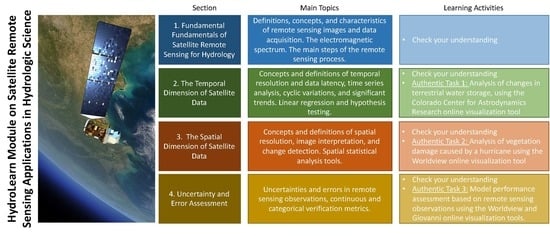
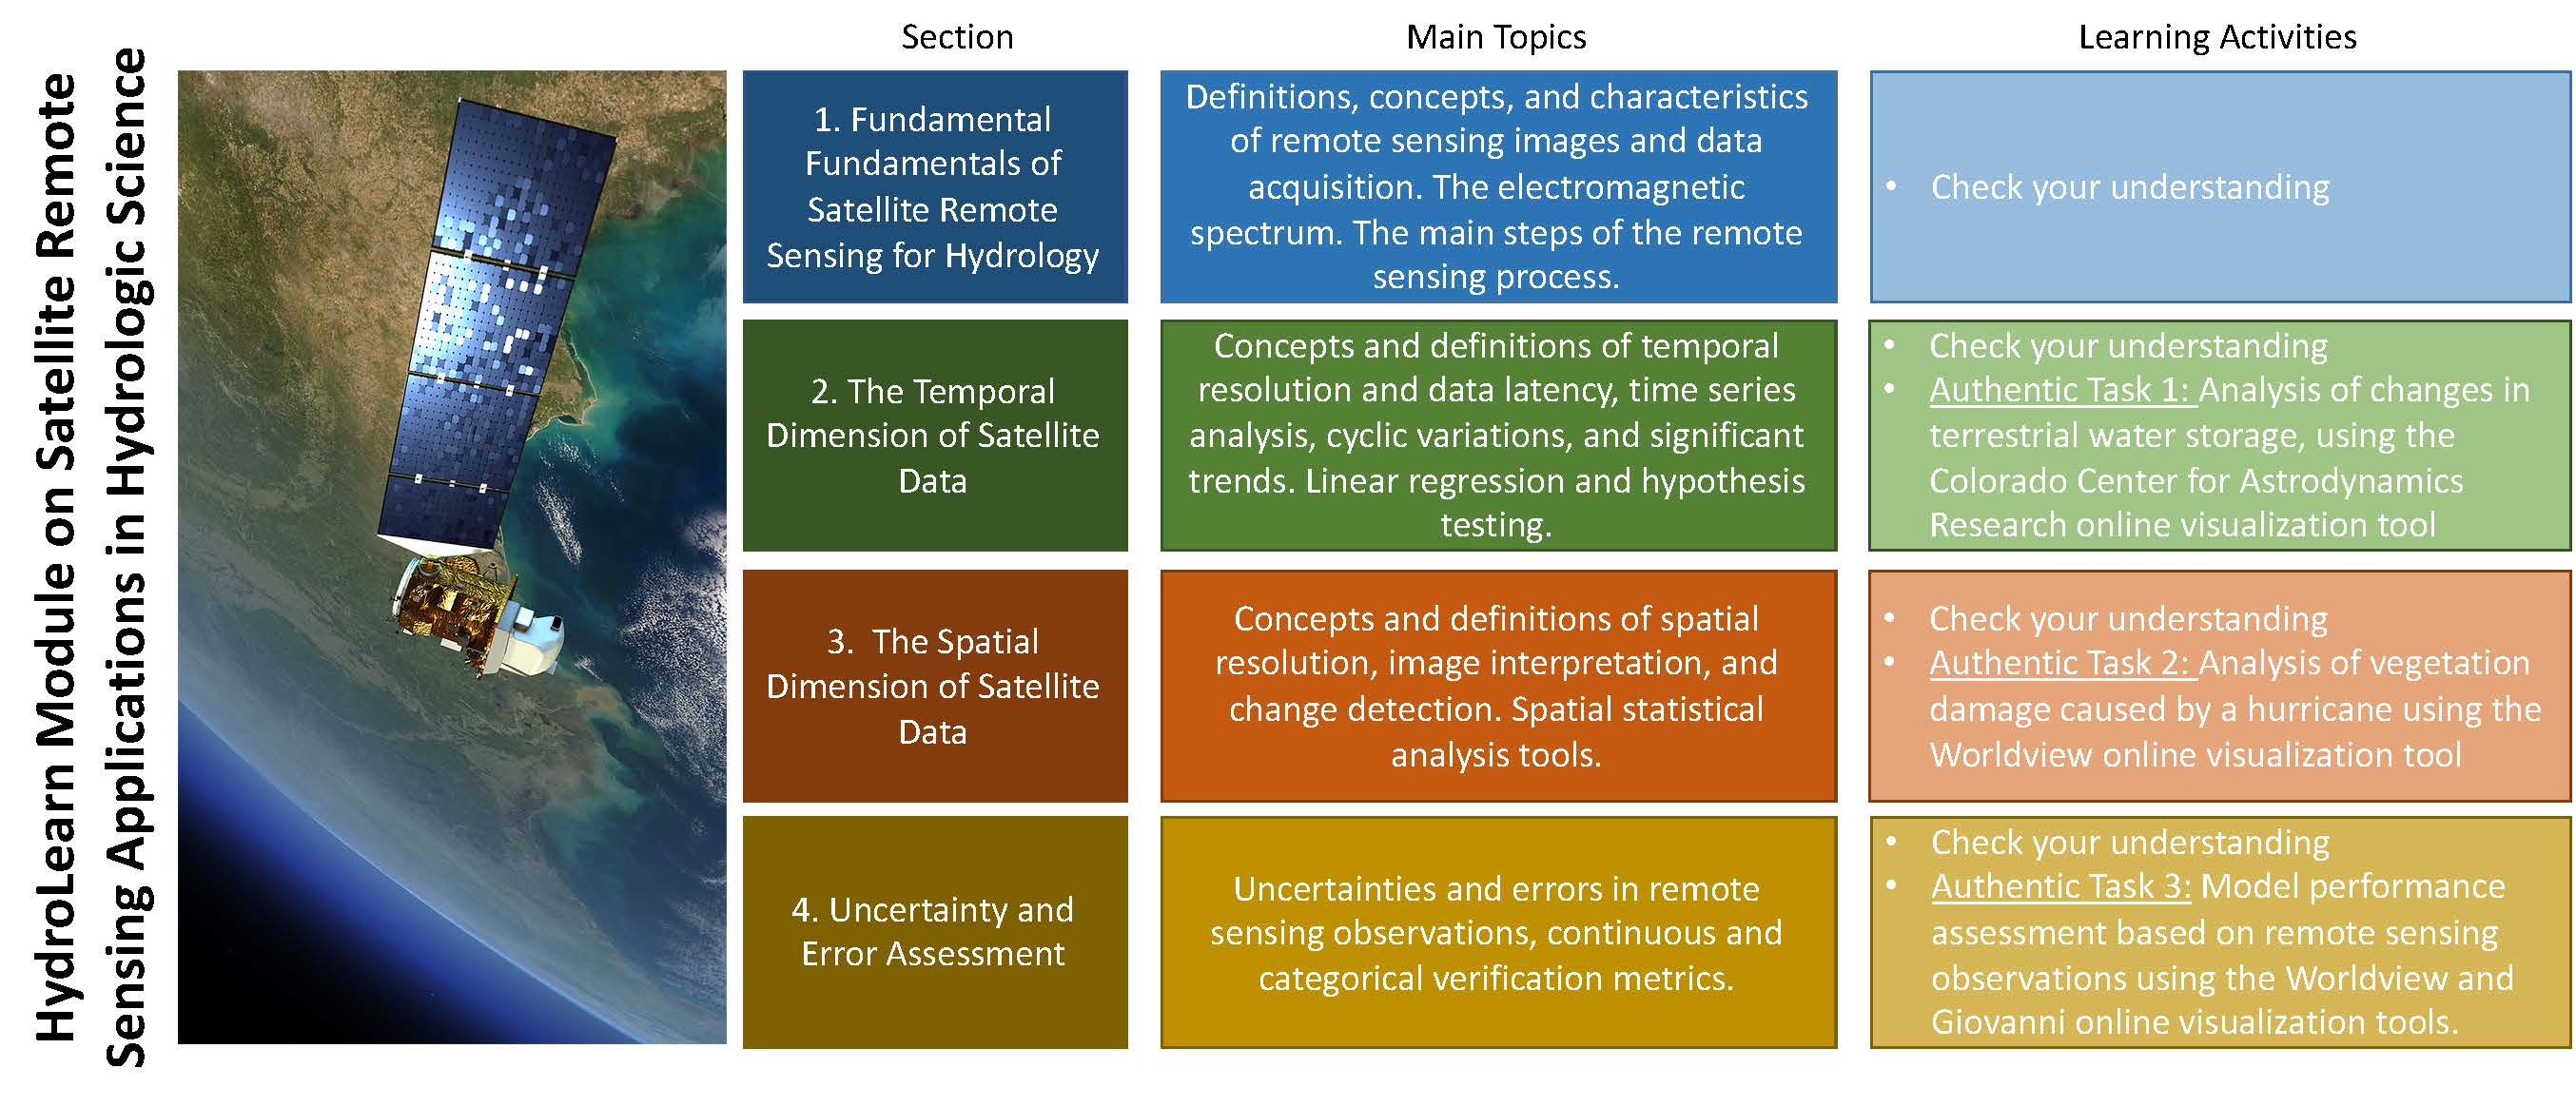
The Remote Sensing Applications in Hydrology module consists of four main sections (Table 2). Section 1 introduces the key concepts of satellite-based remote sensing that are useful for hydrological applications. This includes basic definitions on remote sensing and the electromagnetic spectrum, a discussion of the main features of satellite image retrieval, as well as the main steps of the remote sensing process (i.e., from data acquisition to processing and applications), as defined in Reference [29].
In Section 2 of the module, we focus on the temporal dimension of satellite data. Notions like temporal resolution and data latency are introduced, stressing their importance in hydrologic applications (e.g., floods, hurricanes, landslides, wildfires, sea level changes, urban sprawl, crop monitoring). The section also presents the definition of time series and discusses tools to analyze time series data from satellite observations by identifying cyclic variations and significant trends. Specifically, students will learn how (i) to fit a trendline to a time series dataset using the least-squares method, (ii) to assess the goodness of the fit using traditional statistical metrics, such as the coefficient of determination, and (iii) to verify the significance of the trend using the Mann–Kendall test [30].
Section 3 presents the spatial dimension of satellite observations. First off, the definition of spatial resolution is introduced and the dilemma of resolution is discussed (i.e., the pros and cons of choosing higher spatial resolution to obtain more detailed information). Students are then guided through the tools of image interpretation, such as the eight elements that help identify objects and features that appear on the image (size, shape, tone, texture, site, association, shadow, and pattern) [31]. In the last sub-section, students learn how to detect changes in the (natural or built) environment by comparing images and performing statistical analysis, a fundamental part of remote sensing studies.
In Section 4, we present techniques for assessing uncertainties and errors in remote sensing observations. This section stresses the importance of validation in the context of satellite products, introduces concepts of accuracy and precision, and discusses possible sources of error in satellite observations. Students will also learn how to compute the most common continuous (e.g., bias, root mean square error, correlation coefficient) and categorical verification metrics (e.g., probability of detection, false alarm rate, critical success index) and how to simultaneously display several statistics on the same plot, using Taylor’s and performance diagrams [32,33].
The content in the four sections is presented using multiple modes of instruction. We included text to introduce concepts and definitions, but also several videos, images, and diagrams to support students’ comprehension of the content and promote active engagement with the material. Thus, text was kept to a minimum and sections were built to be comprehensive but short. Videos were spread throughout, with at least one video per section, generally not longer than 10 minutes, and with the closed caption option available for any hearing-impaired student. Images and diagrams that were used to separate text sections are all open-source or freely available. A valuable feature in HydroLearn is the iframe, which allows instructors to embed an online database or application as part of a course. This was particularly useful to link satellite image visualization tools, like the Mascon Visualization Tool from the Colorado Center for Astrodynamics Research at Colorado University, Boulder (https://ccar.colorado.edu/grace/). Embedded throughout the instructional content section were learning activities, which are included to assess students’ achievement of the corresponding learning objectives. We discuss the learning activities below.
5. Learning Activities
The learning activities proposed in the Remote Sensing Applications in Hydrology module are a combination of simple “check-your-understanding” problems and quantitative authentic tasks, as shown in Table 2. The differences between the two types of tasks are presented in detail in the next sub-sections.
5.1. Check Your Understanding
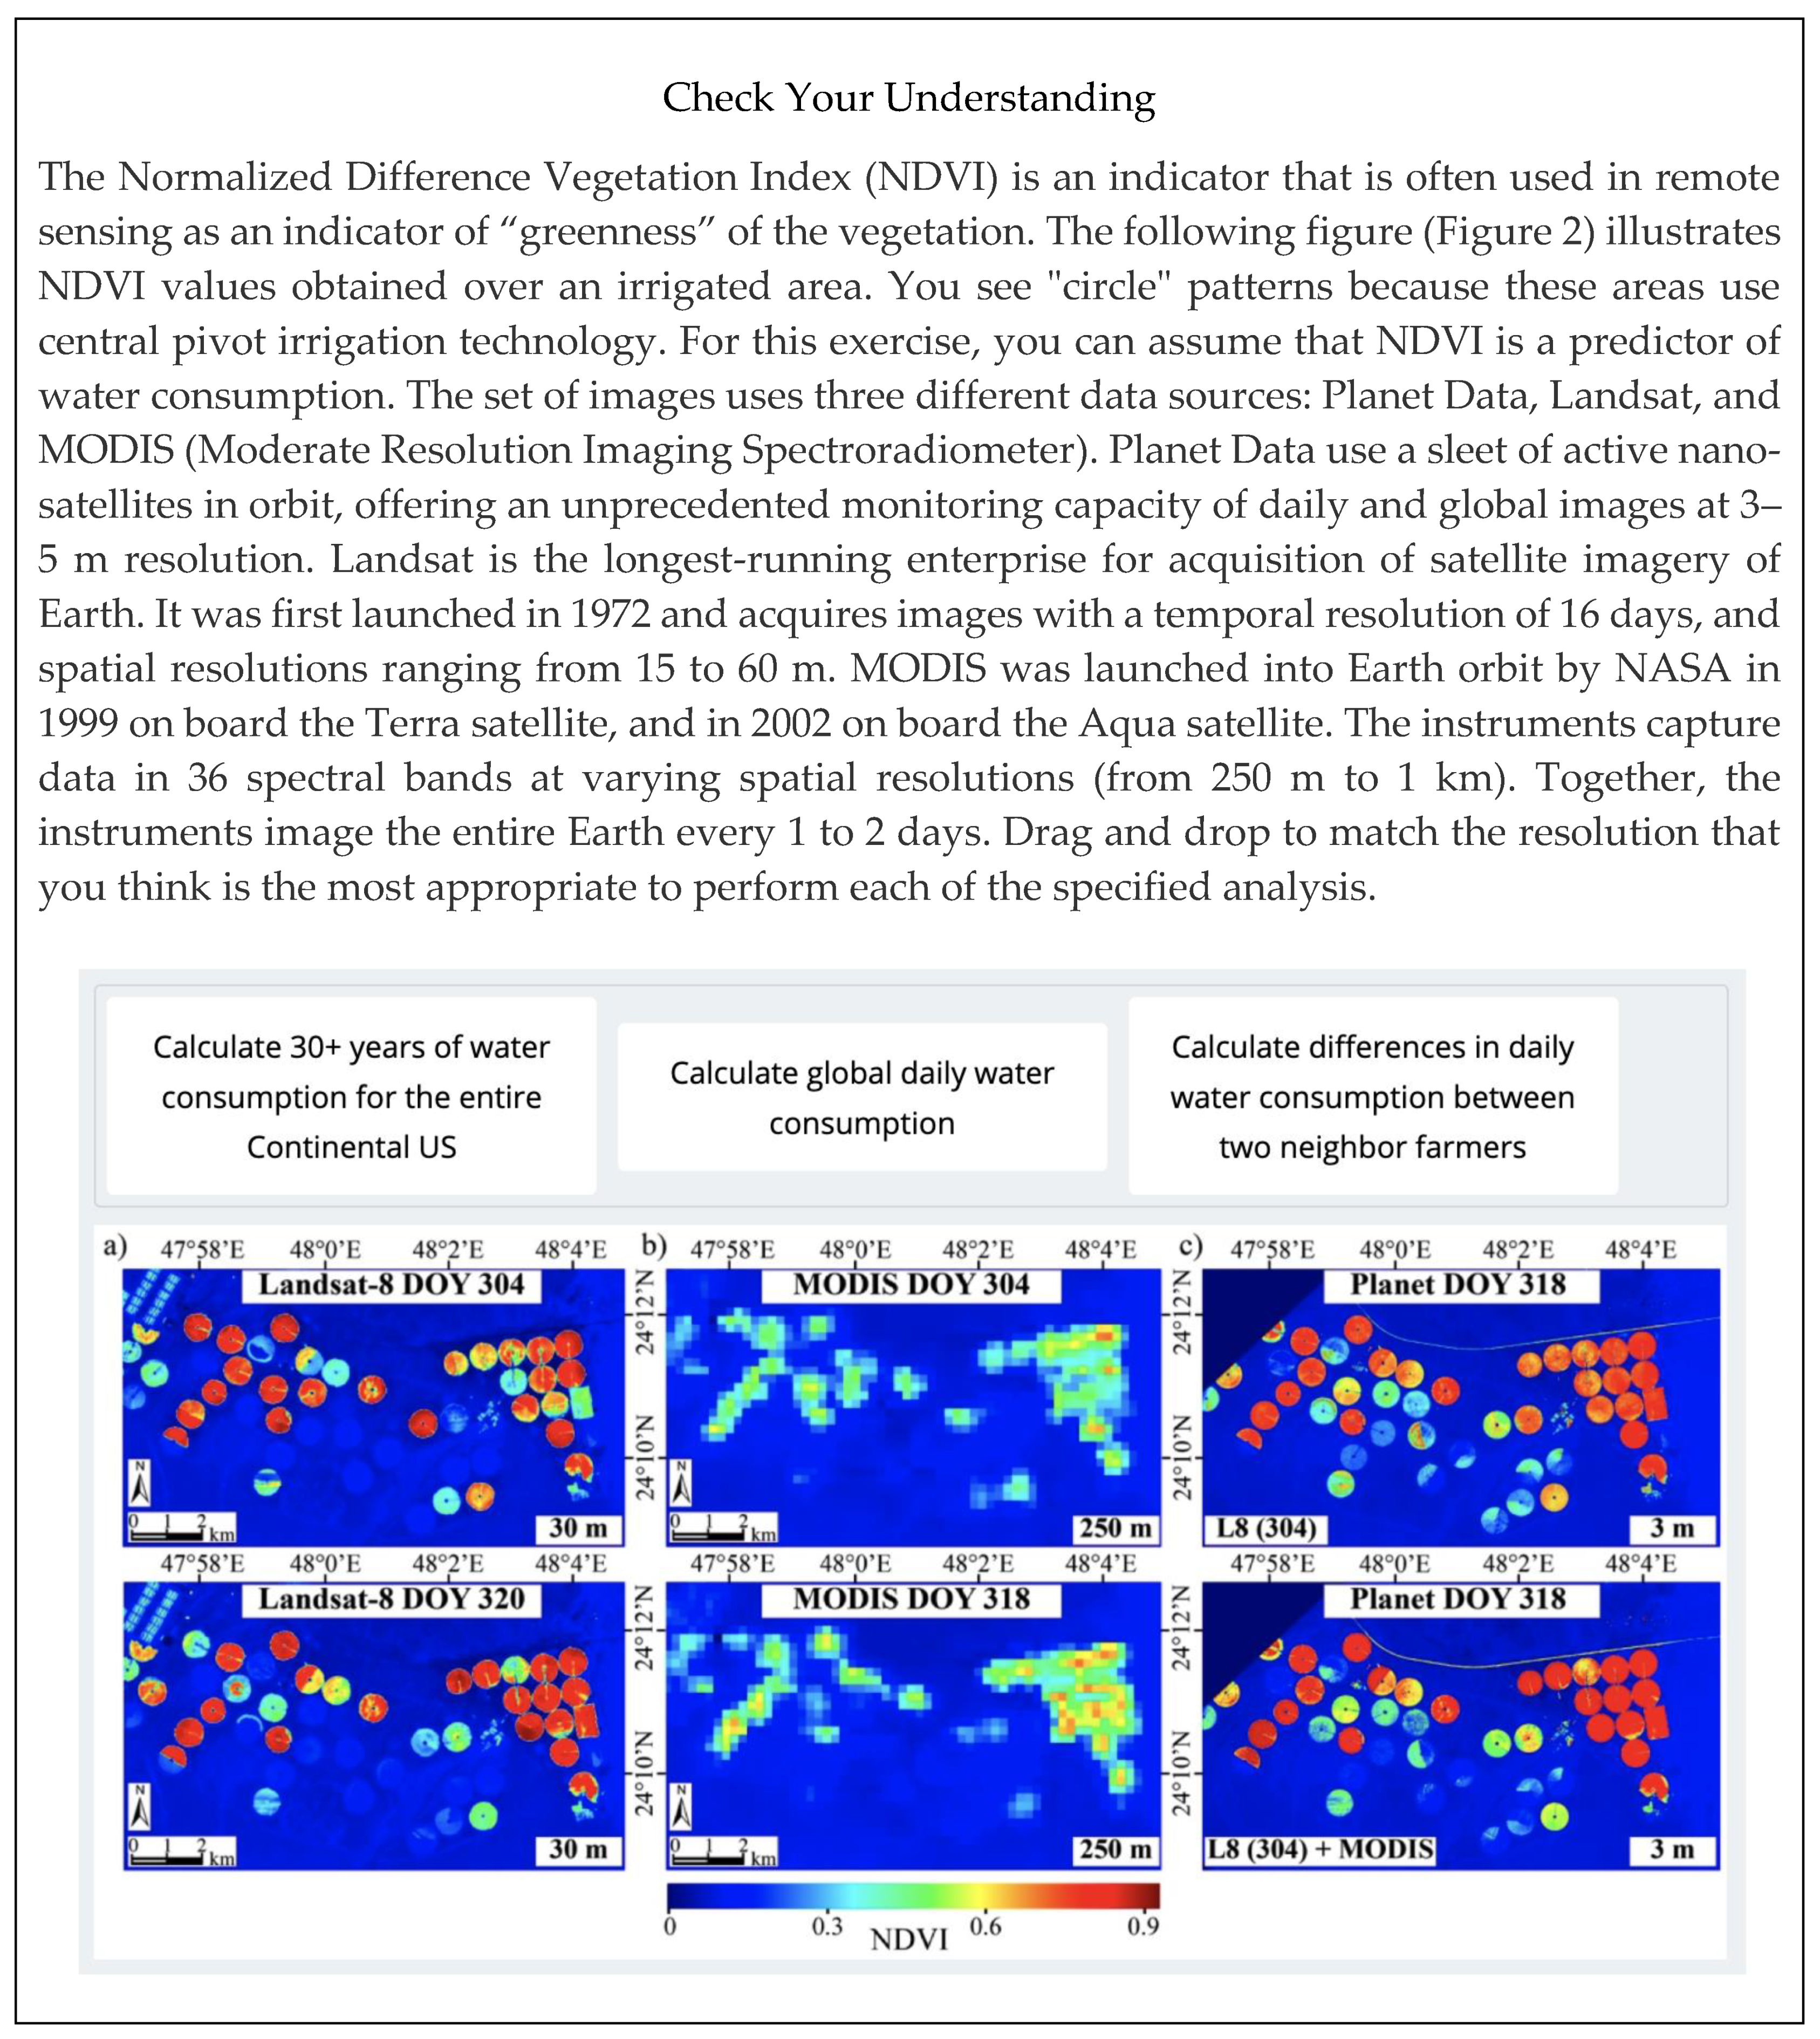
The “check-your-understanding” activities are low-cognitive-demand tasks, i.e., tasks for which students are asked to reproduce definitions, formulas, or principles about particular content to assess learning objectives at the lower levels of Bloom’s Taxonomy. Frequent feedback can help students to self-regulate their learning, which can lead to enhanced achievement [34]. In these tasks, the instructor provides lots of guidance, so that students can just follow the instructions without any high-level thinking. These activities are spread throughout the module and formulated in a variety of formats to help students process the text and videos. Formats include multiple choice, checkbox, and drag-and-drop questions. Multiple-choice questions offer a set of alternatives as possible answers (usually three to four options), but only one is correct, whereas the others work as distractors that are plausible but incorrect. Checkbox questions are similar, except that they allow students to select more than one choice as part of their answer (rather than just one) and one or more alternatives may be correct. A drag-and-drop question has a set of two or more possible answers that the student will drag to response targets. The target might be a block, a table, an image, or any other location on the screen. An example of a drag-and-drop question created for our module is shown in Figure 2.
Another interactive activity that we included in the module is discussion boards. Although not intended for grading, these activities help students to engage with the instructional material and to share ideas with their peers regarding a specific topic. Discussion boards have been proven to be effective tools in online courses, as they give all students a chance to “speak”—even the shyest person who may never speak in a regular classroom would get the opportunity to share their thoughts [36,37]. This is particularly important when teaching to a diverse body of students, who may not be used to voicing their opinion in class. For example, in Section 1—Fundamentals of Remote Sensing, students are given a photograph with an aerial view of a forest and asked to discuss what information they would miss if the photo of the same scene were taken standing in the middle of the trail crossing the forest. Students are encouraged to either include their responses in the discussion board or comment on others’ responses.
5.2. Authentic Tasks
There are three culminating learning activities at the end of Section 2, Section 3 and Section 4 (as shown in Table 2). As opposed to the “check-your-understanding” problems, these activities are high-cognitive-demand tasks and, more exactly, authentic tasks. In a high-cognitive-demand task, students are asked to engage in practices to master the content they learned and recognize how a scientific body of knowledge is developed [38]. These tasks usually include some guidance to students but require them to search for content, data, or additional information. There are generally multiple possible correct answers, meaning that if students accurately apply the content and justify their decisions, they will get full credit for their answer.
Authentic tasks, a subset of high-cognitive-demand tasks, are built to reflect how knowledge is used in real life and simulate the type of problems that a professional might tackle, in this case as hydrologists, remote sensing technicians, scientists, or engineers. They are complex and ill-defined, defined as tasks that echo the complexity of the real world, with the goal of encouraging students to explore different perspectives, rather than having one correct or straightforward answer [39]. Ill-defined tasks have many benefits for students, including better retention of information taught [40], higher levels of cognitive engagement [41], and more positive attitudes [13]. Such tasks often incorporate opportunities for the public presentation of an argument to give students the opportunity to defend their position. Authentic tasks assess higher levels of Bloom’s Taxonomy.
Each authentic task has a rubric, an assessment tool with the purpose of setting clear expectations for students and making grading more objective. Thanks to the rubric, instructors that will adopt the module can easily measure students’ achievement of the learning objectives at the higher levels of Bloom’s Taxonomy and keep track of their progress on the learning objectives. The rubrics adopted for two of the authentic tasks in the Remote Sensing Applications in Hydrology module are shown in Table 3 and Table 4. For each learning objective, one or more criteria were selected to assess whether and how expectations were met. Three levels of expectations were set, as: (1) does not meet expectations (0 points), (2) meets expectations (between 4 and 7 points), and (3) exceeds expectations (10 points).
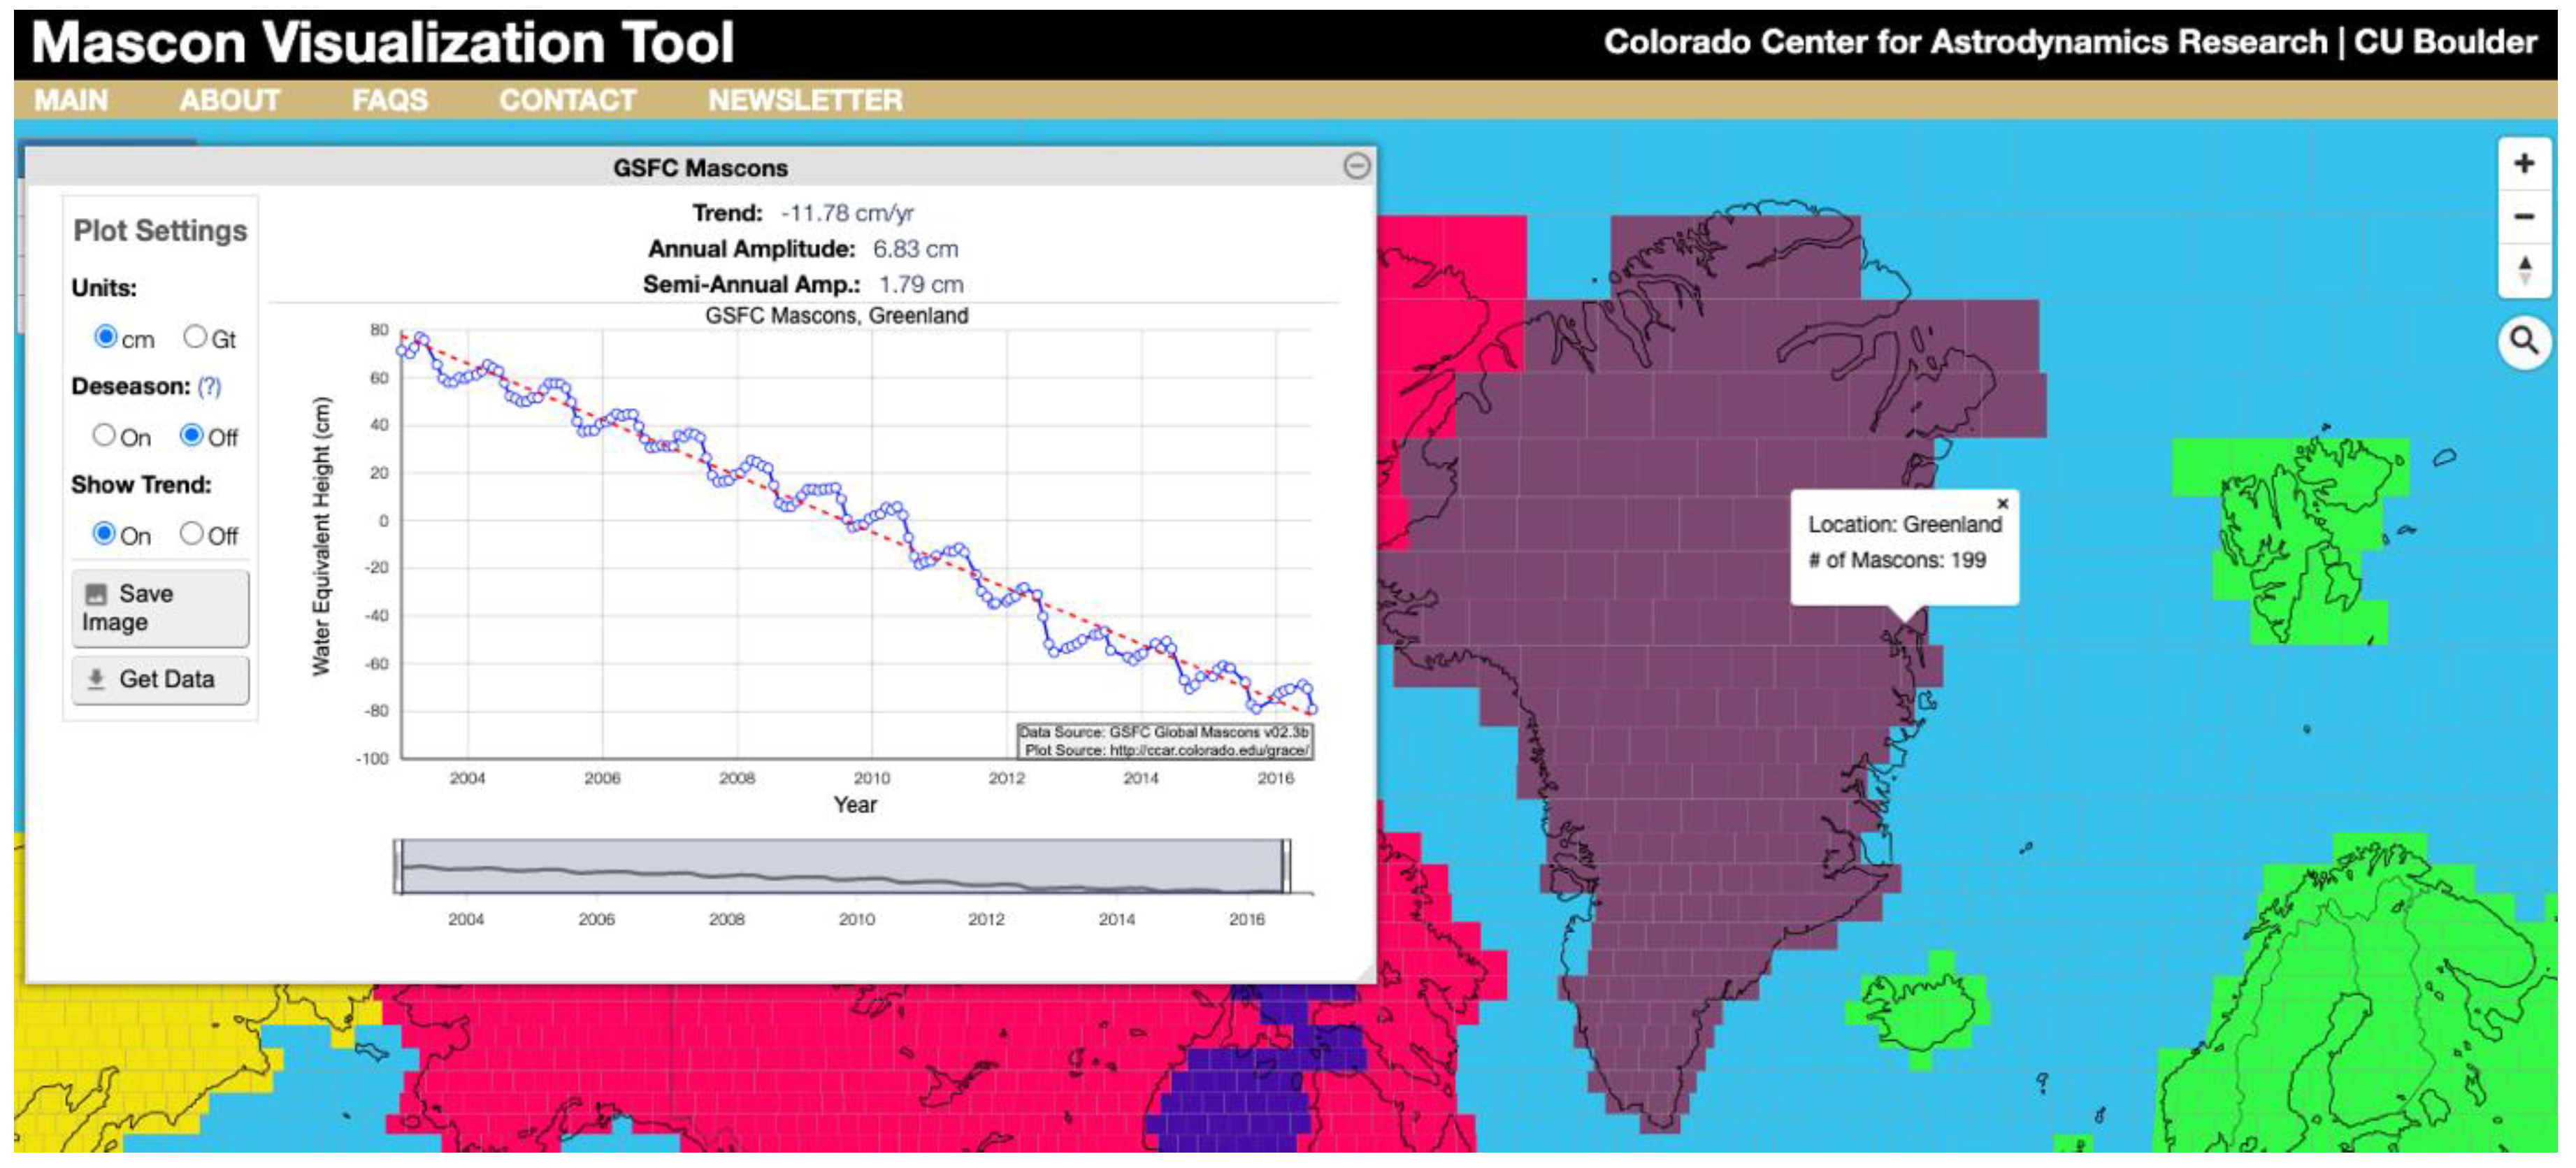
The first authentic task is built at the end of Section 2—Temporal Dimension of Satellite Data. In this activity, the student plays the role of the science advisor to a local government that wants to use its local water resources in a more sustainable and efficient manner. Specifically, students will analyze time series of satellite-based observations of Terrestrial Water Storage (TWS) at three different locations around the world to infer changes in the regional surface and subsurface water storage. For each time series, students will identify any temporal pattern (e.g., daily, seasonal, climatological cycles) and/or trend (Figure 3). Students will discuss possible physical or anthropogenic processes that may cause the observed patterns and trends. For instance, the unregulated extraction of groundwater may cause the depletion of the aquifers, which can be detected by remotely sensed TWS observations and from the trend analysis they performed. Based on their analysis, students will formulate recommendations to local managers or governments to ensure a more efficient and sustainable use of water resources in the future. In this task, students will learn about the NASA Gravity Recovery and Climate Experiment (GRACE, [42,43]) and the GRACE Follow On (FO) missions and how to use the Colorado Center for Astrodynamics Research tool to visualize time series of TWS data (https://ccar.colorado.edu/grace/). They will also use a software of choice (e.g., Excel, Python, MATLAB, R) to process the data and perform the statistical analyses.
In the second authentic task, students apply the concepts learned in Section 3—Spatial Dimension of Satellite Data and play the role of remote sensing experts hired by a local insurance company in Puerto Rico after Hurricane Maria that destroyed the island in 2017. Students are asked to locate the regions that were affected the most by the hurricane and to quantify the damage in terms of loss in vegetation, caused by flash flooding and strong winds. As part of this task, students will have the opportunity to learn about the NASA Moderate Resolution Imaging Spectroradiometer (MODIS), a key instrument aboard the Terra and Aqua satellites, and MODIS-derived products, such as the leaf area index (LAI), to monitor vegetation globally. They will also use state-of-the-art tools, such as the NASA Worldview (https://worldview.earthdata.nasa.gov/), to visualize, interpret, and download MODIS LAI data. Specifically, students will analyze MODIS LAI before and after the landfall of Hurricane Maria by computing basic statistics such as the mean and standard deviation and generating the histograms for both days. Students are then asked to interpret their results by explaining what the implications of vegetation loss may be on water resources on the island.
The third authentic task tests students on concepts presented in Section 4—Uncertainty and Error Assessment. Although the instructional content in this section points at the importance of validating satellite observations for their correct use in hydrologic applications, this task introduces students to a slightly different use of the validation tools learned in the section, which include a variety of continuous (e.g., bias, root mean square error, correlation coefficient) and categorical verification metrics (e.g., probability of detection, false alarm rate, critical success index). Specifically, they will use satellite data to validate model simulations. This is particularly critical in regions of the world where no ground observations are available and models and satellites are the only methods to provide information regarding water resources. Students will assess the performance of a water model that two counties in California are considering adopting and will present their findings at a town-hall style meeting. The model performance will be assessed in terms of soil moisture using a satellite-based product from the NASA SMAP (Soil Moisture Active Passive, [8]) mission, using a set of statistical metrics learned in Section 4.
6. Discussion
Although a relatively young science, satellite remote sensing is fast growing, thanks to several technological innovations, the wide distribution of a variety of satellite products, the wider and wider breadth of applications, and the development of novel tools to visualize and analyze satellite data. As a consequence, remote sensing education should also advance fast to provide students with the appropriate methodological expertise and skills [1]. Teaching remote sensing is also challenged by its intrinsic interdisciplinary nature that requires competence in several disciplines that form the backbone of the field (including physics, electrical engineering, and Earth sciences), but also familiarity with the field of application (that being biology, water resources engineering, or astronomy). This is challenged even further in an online teaching environment in which several issues arise, including learners’ expectations, readiness, identity, and participation in online courses, but also issues with the role of instructors in content development, integration of multimedia in the content, and the role of different instructional strategies [44]. However, the myriad of already available online educational platforms and remote sensing data visualization tools can overcome some of these issues.
In this manuscript, we shared our experience with developing an online module on Remote Sensing Applications in Hydrology that has the potential to address some of the challenges highlighted above. At the time of writing, no data on students’ performance were available. Rather than discussing the impact of the module on students’ learning, the goal of this manuscript was to disseminate our experience with developing a tool that has the potential to improve the learning and teaching of remote sensing in higher education and in the interdisciplinary context of environmental sciences (i.e., hydrology). Our hope is that our work will support and inspire other educators in this field to successfully design their courses and train our next generation.
Nevertheless, we will survey students to assess changes in their engagement and self-assessed learning after participating in this module. We will also interview students to explore their perceptions of the module and their engagement in the tasks. Lastly, we will examine students’ work on the authentic tasks to evaluate whether the module supported them in achieving the higher levels of Bloom’s Taxonomy called for in the tasks. These data will help us to understand the students’ engagement and achievement after participating in this module, as well as to make revisions to the module if areas of improvement are noted.
7. Conclusions
In this manuscript, we presented an online module on Remote Sensing Applications in Hydrology for teaching junior/senior undergraduate students or junior graduate students with no (or little background) in remote sensing, but with some basic background of environmental science, hydrology, programming, and statistics. The module utilizes active learning techniques within an online environment, HydroLearn (https://www.hydrolearn.org/), a free online platform sponsored by the National Science Foundation with the goal of promoting and sharing educational resources in hydrology and water resources engineering. This e-learning module takes advantage of a variety of freely available satellite products and a set of already existing visualization and analysis tools to improve students’ experience and attitude toward complex remote sensing concepts.
The module was created following a backward design approach, which started with identifying the learning objectives. Such objectives were formulated to address different learning levels, according to Bloom’s Taxonomy, from more basic objectives (e.g., remember, understand) to ones that require a higher level of abstraction (e.g., evaluate, create). Next, we created learning activities that provide evidence of the students’ achievement of the learning objectives. These activities are a combination of low-cognitive-demand tasks, formulated as multiple choice or checkbox questions, and three authentic tasks, which challenge students with real-life problems that they may have to face in their future professional career. For each authentic task, a rubric was created to set clear expectations for students, but also to make grading more streamlined and easily measure the achievement of the learning objectives at the higher levels of Bloom’s Taxonomy.
Lastly, we built the instructional content, which is organized in four sections. In Section 1, we introduced key concepts of satellite remote sensing, including the electromagnetic spectrum, the main features of satellite images, and the main steps of the remote sensing process. Section 2 and Section 3 focused on the temporal and spatial dimension of satellite data, respectively. Starting from the definitions of time series and spatial resolution, we presented common tools to analyze time series and maps of satellite observations. In Section 4, we stressed the importance of the validation process and introduced techniques for assessing uncertainties and errors in remote sensing observations. The content is presented using multiple modes of instruction, including numerous videos, images, and diagrams to guide students through the material and also promote active engagement with the content.
Although the design approach followed three sequential steps, the process was iterative to ensure constructive alignment between learning objectives, activities/assessments, and content. In order to verify the alignment between activities, objectives, and content, we used a self-assessment feedback tool provided by the educational and content guides. In this assessment, we asked ourselves questions such as “Do learning objectives use measurable verbs?”, “Does the rubric capture how well students do on the high-cognitive-demand learning objectives?”, or “Is the activity assessing only the listed learning objectives? Or more?” Thus, after developing a learning activity, we went back to check if the learning objectives aligned with the task and the rubric clearly defined criteria for assessing the achievement of such objectives. After the instructional content was finalized, we ensured that all tools and subject matter necessary for students to reach the objectives and complete the tasks were introduced and defined.
We consider the HydroLearn module that we presented here to be an ever-evolving tool, first designed by us but hopefully benefitting from any number of external interventions in the future. Sections that address high-resolution satellite products, UAVs imaging, and more hydrologic applications would be more than welcome and will make the module more attractive, comprehensive, and engaging.
Author Contributions
Conceptualization, M.G. and V.M.; writing—original draft preparation, V.M.; writing—review and editing, M.G., M.A.G., and E.H. All authors have read and agreed to the published version of the manuscript.
Funding
This material is based upon work supported by the National Science Foundation under Grant No. 1726965 Collaborative Research: Improving Student Learning in Hydrology and Water Resources Engineering by Enabling the Development, Sharing, and Interoperability of Active Learning Resources.
Acknowledgments
We would like to acknowledge Jenny Byrd and Laura Manuel for their technical support during the HydroLearn workshop and hackathon, and the 2020 HydroLearn fellows for their valuable feedback.
Conflicts of Interest
The authors declare no conflict of interest
References
- Hejmanowska, B.; Kaminski, W.; Przyborski, M.; Pyka, K.; Pyrchla, J. Modern remote sensing and the challenges facing education systems in terms of its teaching. In Proceedings of the 7th International Conference on Education and New Learning Technologies, Barcelona, Spain, 6–7 July 2015; pp. 6549–6558. [Google Scholar]
- Mesas-Carrascosa, F.-J.; Porras, F.P.; Triviño-Tarradas, P.; Meroño-Larriva, J.E.; García-Ferrer, A.; Meroño-Larriva, J.E. Project-based learning applied to unmanned aerial systems and remote sensing. Remote Sens. 2019, 11, 2413. [Google Scholar] [CrossRef] [Green Version]
- He, X.; Hua, X.; Montillet, J.-P.; Yu, K.; Zou, J.; Xiang, D.; Zhu, H.; Zhang, D.; Huang, Z.; Zhao, B. An Innovative virtual simulation teaching platform on digital mapping with unmanned aerial vehicle for remote sensing education. Remote Sens. 2019, 11, 2993. [Google Scholar] [CrossRef] [Green Version]
- Fras, M.K.; Grigillo, D. Implementation of active teaching methods and emerging topics in photogrammetry and remote sensing subjects. Int. Arch. Photogramm. Remote Sens. Spat. Inf. Sci. 2016, 41, 87–94. [Google Scholar] [CrossRef]
- Hodam, H.; Rienow, A.; Juergens, C. Bringing earth observation to schools with digital integrated learning environments. Remote Sens. 2020, 12, 345. [Google Scholar] [CrossRef] [Green Version]
- Yang, W. A Review of Remote Sensing Data Formats for Earth System Observations. In Earth Science Satellite Remote Sensing; Springer: Berlin/Heidelberg, Germany, 2007; pp. 120–145. [Google Scholar]
- Gerner, M.; Pause, M. Advancing learning assignments in remote sensing of the environment through simulation games. Remote Sens. 2020, 12, 735. [Google Scholar] [CrossRef] [Green Version]
- Entekhabi, D.; Njoku, E.G.; O’Neill, P.E.; Kellogg, K.H.; Crow, W.T.; Edelstein, W.N.; Entin, J.K.; Goodman, S.D.; Jackson, T.J.; Johnson, J.; et al. The soil moisture active passive (SMAP) mission. Proc. IEEE 2010, 98, 704–716. [Google Scholar] [CrossRef]
- Hou, A.Y.; Kakar, R.K.; Neeck, S.; Azarbarzin, A.A.; Kummerow, C.; Kojima, M.; Oki, R.; Nakamura, K.; Iguchi, T. The global precipitation measurement mission. Bull. Am. Meteorol. Soc. 2014, 95, 701–722. [Google Scholar] [CrossRef]
- López-Nuñez, J.A.; López-Belmonte, J.; Moreno-Guerrero, A.-J.; Pozo-Sánchez, S. Effectiveness of innovate educational practices with flipped learning and remote sensing in earth and environmental sciences—An exploratory case study. Remote Sens. 2020, 12, 897. [Google Scholar] [CrossRef] [Green Version]
- Freeman, S.; Eddy, S.L.; McDonough, M.; Smith, M.K.; Okoroafor, N.; Jordt, H.; Wenderoth, M.P. Active learning increases student performance in science, engineering, and mathematics. Proc. Natl. Acad. Sci. USA 2014, 111, 8410–8415. [Google Scholar] [CrossRef] [Green Version]
- Albanese, M.A.; Mitchell, S. Problem-based learning. Acad. Med. 1993, 68, 52–81. [Google Scholar] [CrossRef]
- Prince, M. Does active learning work? A review of the research. J. Eng. Educ. 2004, 93, 223–231. [Google Scholar] [CrossRef]
- Allen, D.E.; Donham, R.S.; Bernhardt, S.A. Problem-based learning. New Dir. Teach. Learn. 2011, 128, 21–29. [Google Scholar] [CrossRef]
- Major, C.H.; Palmer, B. Assessing the effectiveness of problem-based learning in higher education: Lessons from the literature. Acad. Exch. Q. 2001, 5, 4–9. [Google Scholar]
- Almaiah, M.A.; Al-Khasawneh, A.; Althunibat, A. Exploring the critical challenges and factors influencing the E-learning system usage during COVID-19 pandemic. Educ. Inf. Technol. 2020, 1, 1–20. [Google Scholar] [CrossRef] [PubMed]
- Joyce, K.; Boitshwarelo, B.; Phinn, S.; Hill, G.J.; Kelly, G.D. Interactive online tools for enhancing student learning experiences in remote sensing. J. Geogr. High. Educ. 2014, 38, 431–439. [Google Scholar] [CrossRef]
- Stubkjær, E. The World Wide Web and university education in remote sensing. ISPRS J. Photogramm. Remote Sens. 1997, 52, 281–293. [Google Scholar] [CrossRef]
- Ruddell, B.L.; Wagener, T. Grand challenges for hydrology education in the 21st century. J. Hydrol. Eng. 2015, 20, A4014001. [Google Scholar] [CrossRef]
- Seibert, J.; Uhlenbrook, S.; Wagener, T. Preface “Hydrology education in a changing world”. Hydrol. Earth Syst. Sci. 2013, 17, 1393–1399. [Google Scholar] [CrossRef]
- Habib, E.; Deshotel, M. towards broader adoption of educational innovations in undergraduate water resources engineering: Views from academia and industry. J. Contemp. Water Res. Educ. 2018, 164, 41–54. [Google Scholar] [CrossRef] [Green Version]
- Habib, E.; Deshotel, M.; Lai, G.L.; Miller, R. Student perceptions of an active learning module to enhance data and modeling skills in undergraduate water resources engineering education. Int. J. Eng. Educ. 2019, 35, 1353–1365. [Google Scholar]
- Habib, E.; Ma, Y.; Williams, D.; Sharif, H.O.; Hossain, F. HydroViz: Design and evaluation of a Web-based tool for improving hydrology education. Hydrol. Earth Syst. Sci. 2012, 16, 3767–3781. [Google Scholar] [CrossRef] [Green Version]
- Wiggins, G.; McTighe, J. Understanding by Design; ASCD: Paynesville, MN, USA, 2005. [Google Scholar]
- McTighe, J.; Thomas, R.S. Backward design for forward action. Educ. Lead. 2003, 60, 52–55. [Google Scholar]
- Bloom, B.S. Taxonomy of Educational Objectives. Vol. 1: Cognitive Domain; McKay: New York, NY, USA, 1956; Volume 20, p. 24. [Google Scholar]
- Biggs, J. Enhancing teaching through constructive alignment. High. Educ. 1996, 32, 347–364. [Google Scholar] [CrossRef]
- Kandlbinder, P. Constructive alignment in university teaching. HERDSA News 2014, 36, 5. [Google Scholar]
- Campbell, J.B.; Wynne, R.H. Introduction to Remote Sensing; Guilford Press: New York, NY, USA, 2011. [Google Scholar]
- Mann, H.B. Nonparametric tests against trend. Econometrica 1945, 13, 245–259. [Google Scholar] [CrossRef]
- Lillesand, T.; Kiefer, R.W.; Chipman, J. Remote Sensing and Image Interpretation; John Wiley & Sons: Hoboken, NJ, USA, 2015. [Google Scholar]
- Taylor, K.E. Summarizing multiple aspects of model performance in a single diagram. J. Geophys. Res. Space Phys. 2001, 106, 7183–7192. [Google Scholar] [CrossRef]
- Roebber, P. Visualizing multiple measures of forecast quality. Weather. Forecast. 2009, 24, 601–608. [Google Scholar] [CrossRef] [Green Version]
- Zimmerman, B.J. Attaining self-regulation: A social cognitive perspective. In Handbook of Self-Regulation; Boekaerts, M., Pintrich, P.R., Zeidner, M., Eds.; Academic Press: San Diego, CA, USA, 2000. [Google Scholar]
- Houborg, R.; McCabe, M.F. High-resolution NDVI from planet’s constellation of earth observing nano-satellites: A new data source for precision agriculture. Remote Sens. 2016, 8, 768. [Google Scholar] [CrossRef] [Green Version]
- Clark-Ibanez, M.; Scott, L. Learning to teach online. Teach. Sociol. 2008, 36, 34–41. [Google Scholar] [CrossRef]
- Suler, J.R. In class and online: Using discussion boards in teaching. CyberPsychol. Behav. 2004, 7, 395–401. [Google Scholar] [CrossRef] [Green Version]
- Tekkumru-Kisa, M.; Stein, M.K.; Schunn, C. A framework for analyzing cognitive demand and content-practices integration: Task analysis guide in science. J. Res. Sci. Teach. 2015, 52, 659–685. [Google Scholar] [CrossRef]
- Lien, Y.-C.N.; Wu, W.-J.; Lu, Y.-L. How well do teachers predict students’ actions in solving an Ill-defined problem in STEM education: A solution using sequential pattern mining. IEEE Access 2020, 8, 134976–134986. [Google Scholar] [CrossRef]
- Yadav, A.; Subedi, D.; Lundeberg, M.A.; Bunting, C. Problem-based learning: Influence on students’ learning in an electrical engineering course. J. Eng. Educ. 2011, 100, 253–280. [Google Scholar] [CrossRef]
- Schraw, G.; Dunkle, M.E.; Bendixen, L.D. Cognitive processes in well-defined and ill-defined problem solving. Appl. Cogn. Psychol. 1995, 9, 523–538. [Google Scholar] [CrossRef]
- Tapley, B.D.; Bettadpur, S.V.; Ries, J.; Thompson, P.F.; Watkins, M.M. GRACE Measurements of mass variability in the earth system. Science 2004, 305, 503–505. [Google Scholar] [CrossRef] [Green Version]
- Wahr, J.M.; Swenson, S.; Zlotnicki, V.; Velicogna, I. Time-variable gravity from GRACE: First results. Geophys. Res. Lett. 2004, 31. [Google Scholar] [CrossRef] [Green Version]
- Kebritchi, M.; Lipschuetz, A.; Santiague, L. Issues and challenges for teaching successful online courses in higher education. J. Educ. Technol. Syst. 2017, 46, 4–29. [Google Scholar] [CrossRef]
Figure 1.
Bloom’s Taxonomy adopted from the Vanderbilt University Center for Teaching.

Figure 2.
(a–c) Example of a drag-and-drop question in Section 3 to test students’ ability to choose the appropriate spatial resolution according to a specific hydrologic application. The images are adopted from Reference [35].

Figure 3.
Example of the students’ work for the learning activity in Section 2—Temporal Dimension of Satellite Data, in which they identify trends in time series of satellite Terrestrial Water Storage observations. This example is for a location in Greenland and clearly shows a decreasing trend, as well as a cyclic pattern.


Table 1.
Learning objectives of the HydroLearn Remote Sensing Applications in Hydrology module and corresponding Bloom’s Taxonomy.
Table 1.
Learning objectives of the HydroLearn Remote Sensing Applications in Hydrology module and corresponding Bloom’s Taxonomy.
| Section in Module | Learning Objectives (The Student Will Be Able To) | Learning Level (As Defined by the Bloom’s Taxonomy) |
|---|---|---|
| 1. Fundamentals of Satellite Remote Sensing for Hydrology |
|  |
| 2. The Temporal Dimension of Satellite Data |
|  |
| 3. The Spatial Dimension of Satellite Data |
|  |
| 4. Uncertainty and Error Assessment |
|  |
Table 2.
Structure of the HydroLearn Remote Sensing Applications in Hydrology module, including the main topics covered and the type of learning activities in each section.
Table 2.
Structure of the HydroLearn Remote Sensing Applications in Hydrology module, including the main topics covered and the type of learning activities in each section.
| Section in Module | Main Topics and Tools | Learning Activities |
|---|---|---|
| 1. Fundamentals of Satellite Remote Sensing for Hydrology | Definitions, concepts, and characteristics of remote sensing images and data acquisition. The electromagnetic spectrum. The main steps of the remote sensing process. |
|
| 2. The Temporal Dimension of Satellite Data | Concepts and definitions of temporal resolution and data latency, time series analysis, cyclic variations, and significant trends. Linear regression and hypothesis testing. Online Visualization Tool from the Colorado Center for Astrodynamics Research. |
|
| 3. The Spatial Dimension of Satellite Data | Concepts and definitions of spatial resolution, image interpretation, and change detection. Spatial statistical analysis tools. Worldview online visualization tool. |
|
| 4. Uncertainty and Error Assessment | Uncertainties and errors in remote sensing observations, continuous and categorical verification metrics. Worldview and Giovanni online visualization tools. |
|
Table 3.
Rubric of the learning activity in the Spatial Dimension of Satellite Data section (Section 3) of the Remote Sensing Applications in Hydrology module.
Table 3.
Rubric of the learning activity in the Spatial Dimension of Satellite Data section (Section 3) of the Remote Sensing Applications in Hydrology module.
| Learning Objective | Criterion | Level #1 (Does Not Meet Expectations) 0 Points | Level #2 (Meets Expectations) 4–7 Points | Level #3 (Exceeds Expectations) 10 Points |
|---|---|---|---|---|
| Objective #1: The student will be able to visualize and download satellite data. | Criterion #1: Download and create a maps using a visualization tool | Not included | Plots included, but incorrect. Or, one or more plots are missing. Or, plots are not properly labeled. | All plots are included, correct, and properly labeled. |
| Objective #2: Given a specific event and a satellite image/product, the student will be able to quantify and interpret changes in a hydrologic variable. | Criterion #1: Compute basic statistics and plot histograms | Not included | Values are included, but are incorrect or incomplete. Or, histograms are incorrect, incomplete, or not properly labeled. | All values and histograms are correct, complete, and presented in an organized manner. |
| Objective #2 | Criterion #2: Discussion and interpretation of maps and statistics | Not included | Part of the discussion and/or interpretation of results and maps is either missing or incomplete or incorrect. | Discussion and interpretation of results and maps are complete, correct, and well organized. |
| Objective #2 | Criterion #3: Quantify damage to vegetation caused by a hurricane and hydrologic implications | Not included | Damage quantification and/or related discussion are either incorrect or incomplete. | Damage quantification and related discussion are complete and correct. |
Table 4.
Rubric of the learning activity in the Uncertainty and Error Assessment section (Section 4) of the Remote Sensing Applications in Hydrology module.
Table 4.
Rubric of the learning activity in the Uncertainty and Error Assessment section (Section 4) of the Remote Sensing Applications in Hydrology module.
| Learning Objective | Criterion | Level #1 (Does Not Meet Expectations) 0 points | Level #2 (Meets Expectations) 4–7 Points | Level #3 (Exceeds Expectations) 10 Points |
|---|---|---|---|---|
| Objective #1: The student will be able to identify and apply techniques for assessing uncertainties and errors. | Criterion #1: Identify verification metrics and compute basic statistics | Not included | Values are included but are incorrect or incomplete. | All values are correct, complete, and presented in an organized manner. |
| Objective #2: Analyze remote sensing data and evaluate their performance. | Criterion #1: Plot time series and scatterplots | Not included | Plots are included, but are incorrect or incomplete. Or, plots are incorrect, incomplete, or not properly labeled. | All plots are included, correct and properly labeled. |
| Objective #2 | Criterion #2: Compute basic statistics | Not included | Values are included but are incorrect or incomplete. | All values are correct, complete, and presented in an organized manner. |
| Objective #3: Formulate and test hypotheses around causes and effects in hydrologic variables, based on uncertainty and error analyses | Criterion #1: Discussion and interpretation of plots and statistics | Not included | Part of the discussion and/or interpretation of results and plots is either missing or incomplete or incorrect. | Discussion and interpretation of results and plots are complete, correct, and well organized. |
| Objective #3 | Criterion #2: Identify remote sensing datasets whose dynamics might be cross related | Not included | Other variables are identified but the related discussion is either incorrect or incomplete. | Variables are identified and related discussion are complete and correct. |
© 2020 by the authors. Licensee MDPI, Basel, Switzerland. This article is an open access article distributed under the terms and conditions of the Creative Commons Attribution (CC BY) license (http://creativecommons.org/licenses/by/4.0/).
Share and Cite
MDPI and ACS Style
Maggioni, V.; Girotto, M.; Habib, E.; Gallagher, M.A. Building an Online Learning Module for Satellite Remote Sensing Applications in Hydrologic Science. Remote Sens. 2020, 12, 3009. https://doi.org/10.3390/rs12183009
AMA Style
Maggioni V, Girotto M, Habib E, Gallagher MA. Building an Online Learning Module for Satellite Remote Sensing Applications in Hydrologic Science. Remote Sensing. 2020; 12(18):3009. https://doi.org/10.3390/rs12183009
Chicago/Turabian StyleMaggioni, Viviana, Manuela Girotto, Emad Habib, and Melissa A. Gallagher. 2020. "Building an Online Learning Module for Satellite Remote Sensing Applications in Hydrologic Science" Remote Sensing 12, no. 18: 3009. https://doi.org/10.3390/rs12183009
Note that from the first issue of 2016, this journal uses article numbers instead of page numbers. See further details here.