Article

Overflows and Pyroclastic Density Currents in March-April 2020 at Stromboli Volcano Detected by Remote Sensing and Seismic Monitoring Data

1
Istituto Nazionale di Geofisica e Vulcanologia, Osservatorio Etneo—Sezione di Catania, 95125 Catania, Italy
2
Dipartimento di Scienze della Terra, Università degli Studi di Firenze, Via La Pira 4, 50121 Firenze, Italy
3
Istituto Nazionale di Geofisica e Vulcanologia, Osservatorio Vesuviano, 80124 Napoli, Italy
4
Università degli Studi di Firenze—Centro per la Protezione Civile, Piazza San Marco 4, 50121 Firenze, Italy
*
Author to whom correspondence should be addressed.
Remote Sens. 2020, 12(18), 3010; https://doi.org/10.3390/rs12183010
Submission received: 3 July 2020 / Revised: 12 September 2020 / Accepted: 13 September 2020 / Published: 16 September 2020

Abstract

:
Between 28 March and 1 April 2020, Stromboli volcano erupted, with overflows from the NE crater rim spreading along the barren Sciara del Fuoco slope and reaching the sea along the NW coast of the island. Poor weather conditions did not allow a detailed observation of the crater zone through the cameras monitoring network, but a clear view of the lower slope and the flows expanding in the area allowed us to characterize the flow features. This evidence was integrated with satellite, GBInSAR, and seismic data, thus enabling a reconstruction of the whole volcanic event, which involved several small collapses of the summit cone and the generation of pyroclastic density currents (PDCs) spreading along the slope and on the sea surface. Satellite monitoring allowed for the mapping of the lava flow field and the quantification of the erupted volume, and GBInSAR continuous measurements detected the crater widening and the deflation of the summit cone caused by the last overflow. The characterization of the seismicity made it possible to identify the signals that are associated with the propagation of PDCs along the volcano flank and, for the first time, to recognize the signal that is produced by the impact of the PDCs on the coast.

Graphical Abstract

1. Introduction

Rapid changes of the surface morphology often occur in open-conduit basaltic volcanoes that frequently erupt, such as Etna and Stromboli (Italy), Piton de la Fournaise (La Réunion Island), or Kilauea (Hawaii). Cinder-cones ~60 m high can form in just one or a few weeks [1,2], large lava flows can spread over roads or villages [3,4,5,6], and summit collapses following major lava withdrawal can involve large areas and result in new calderas [6,7,8,9]. However, as they are rapid in building new reliefs, the often loose and unstable mixture of breccia, ash, and spatter, which accumulates quickly and gets possibly destabilized by dike intrusion or overloading, can also suddenly collapse, affecting small portions of the summit cone [10,11,12,13,14] or even the volcano flank [15,16,17,18]. Magma drainage from the feeder conduit can cause significant summit collapses, such as those experienced at Stromboli in 2003 and 2007 [19,20,21], at Piton de la Fournaise in 2007 [8], and at Kilauea in 2018 [6,9]. Regardless of the cause, instability as well as the formation of pyroclastic density currents (PDC) at active and inhabited volcanoes can cause injuries and even loss of lives. This happened, for example, at Stromboli in 1930 and 2019 [22,23,24,25], at Unzen (Japan) in 1991 [26], at Merapi (Java) in 1994 and 2010 [27]. For this reason, PDCs are identified among the primary sources of fatalities at active volcanoes [28].
Stromboli volcano is the easternmost island of the Aeolian Archipelago (Italy; Figure 1a,b). It is known as the “Lighthouse of the Mediterranean”, because of its persistent explosive activity from the summit craters, with bursts occurring every few minutes [29,30,31]. The summit crater of the volcano is a depression ~300 m long in a NE-SW direction (Figure 1c), ~50 m wide, and ~50 m deep, located at ~750 m elevation [14,19]. Three crater areas are located within the summit depression: the NE crater zone (NEC), the Central crater zone (CC), and the SW crater zone (SWC), each of them comprising a variable number of active vents (Figure 1c). The capacity of the uppermost feeder conduit increased after the 2002–2003 and 2007 flank eruptions [20,32], but sudden changes in the magma level may result in a greater magmastatic pressure, which could cause the destabilization and collapse of portions of the summit cone [14,33].
The 2019 eruption at Stromboli has twice shown how dangerous PDCs can be to those tourists approaching the slopes of an active volcano, even from the seaside [34]. Being less dense than water, the PDC formed by 4–5 km high explosive column collapse managed to expand on the sea surface for several hundred meters, running towards a tourist boat sailing nearby (https://www.youtube.com/watch?v=RPKgS3sPP1Y). PDCs can also trigger tsunamis that can devastate the coast, as happened at Stromboli in 1930 and 1944 [22,23]. More recently, PDCs spreading along the Sciara del Fuoco (SdF) slope formed as a consequence of high magma level within the conduit, instability, and collapse of the summit cone [14,35]. PDCs are common at Stromboli especially during the initial phases of flank eruptions, when the opening of an eruptive fissure breaches the summit craters causing the spread of a mixture of hot debris made of lava blocks, lithics and pyroclastics running down the slope and towards the sea [36,37,38,39,40]. More recent examples of this phenomenon occurred in 2013 and 2014 [14,40,41], caused, respectively, by the erosion of the crater rim due to overflows and the opening of an eruptive fissure.
PDCs can result from the collapse of eruptive columns during paroxysmal explosive eruptions [13,19,23,39,42] or from gravitational instability (gravity-induced PDCs); e.g., [10,12,13,23,25,43,44]. PDCs are very mobile, thus being potentially very dangerous for people living close to or on the flanks of active volcanoes. This is why the monitoring of active volcanoes is becoming more and more complex and now integrates several different disciplines, spanning from volcanology, seismicity, geochemistry, and geodesy, in an attempt to obtain a complete picture of what happens not only on the surface, but also—and more importantly—within the shallow feeding system of the volcano, allowing for the prevention and forecasting of disasters and hence avoiding the loss of lives. At Stromboli PDCs normally expand along the barren slope of the SdF [14,19,35,44]. However, during the past century, they have emplaced along the inhabited slopes at least three times; in 1906, 1930, and 1944 [22,23,25,45]. We do not have a complete stratigraphy of PDCs on Stromboli, but three such sequences have been found also during the Neostromboli period (<12.5 ka; [46,47,48]), these last probably representing the most widespread PDC deposits found on the island.
Recently, the volcano has been the site of two paroxysmal explosive eruptions occurred on 3 July and 28 August 2019, which produced eruptive columns 4–5 km high and PDCs. On such occasions, they triggered fires and caused a death, while spreading along the SdF as well as on the sea surface. These episodes were accompanied by a lava overflow from the SWC that started on 3 July and lasted nearly two months, ending on 30 August [24,25,34]. Two more recent overflows from the NEC occurred on 18 January and 3 February 2020, lasting just 3.0 and 1.5 h, respectively. They resulted in a short lava flow field that expanded in the uppermost SdF and did not reach the coast.
The aim of this paper is to present our study of the eruptive activity occurred at Stromboli between 28 March and 1 April 2020, along with our interpretation and quantification of the eruptive processes that are based on the analysis of monitoring data, comprising time-lapse videos recorded by the camera network, satellite images, GBInSAR, and seismic stations.

2. Methods

The description of the events, the calculation of velocity for lava flows and PDCs spreading along the SdF and on the sea surface, and the count of the explosions occurring over time from the summit craters were obtained through the analysis of the videos recorded by the network of fixed monitoring cameras maintained by INGV-OE (Istituto Nazionale di Geofisica e Vulcanologia—Osservatorio Etneo). The volcano deformation was measured through two Ground-Based Interferometric Synthetic Aperture Radar (GBInSAR) devices that were installed by the University of Florence. Seismicity was analyzed using data from the broadband seismic network that was installed by INGV-OV (Istituto Nazionale di Geofisica e Vulcanologia—Osservatorio Vesuviano). Lava flow field area and volume, as well as an estimation of the effusion rate, were computed by the TechnoLab of INGV-OE while using multispectral infrared and optical satellite data.

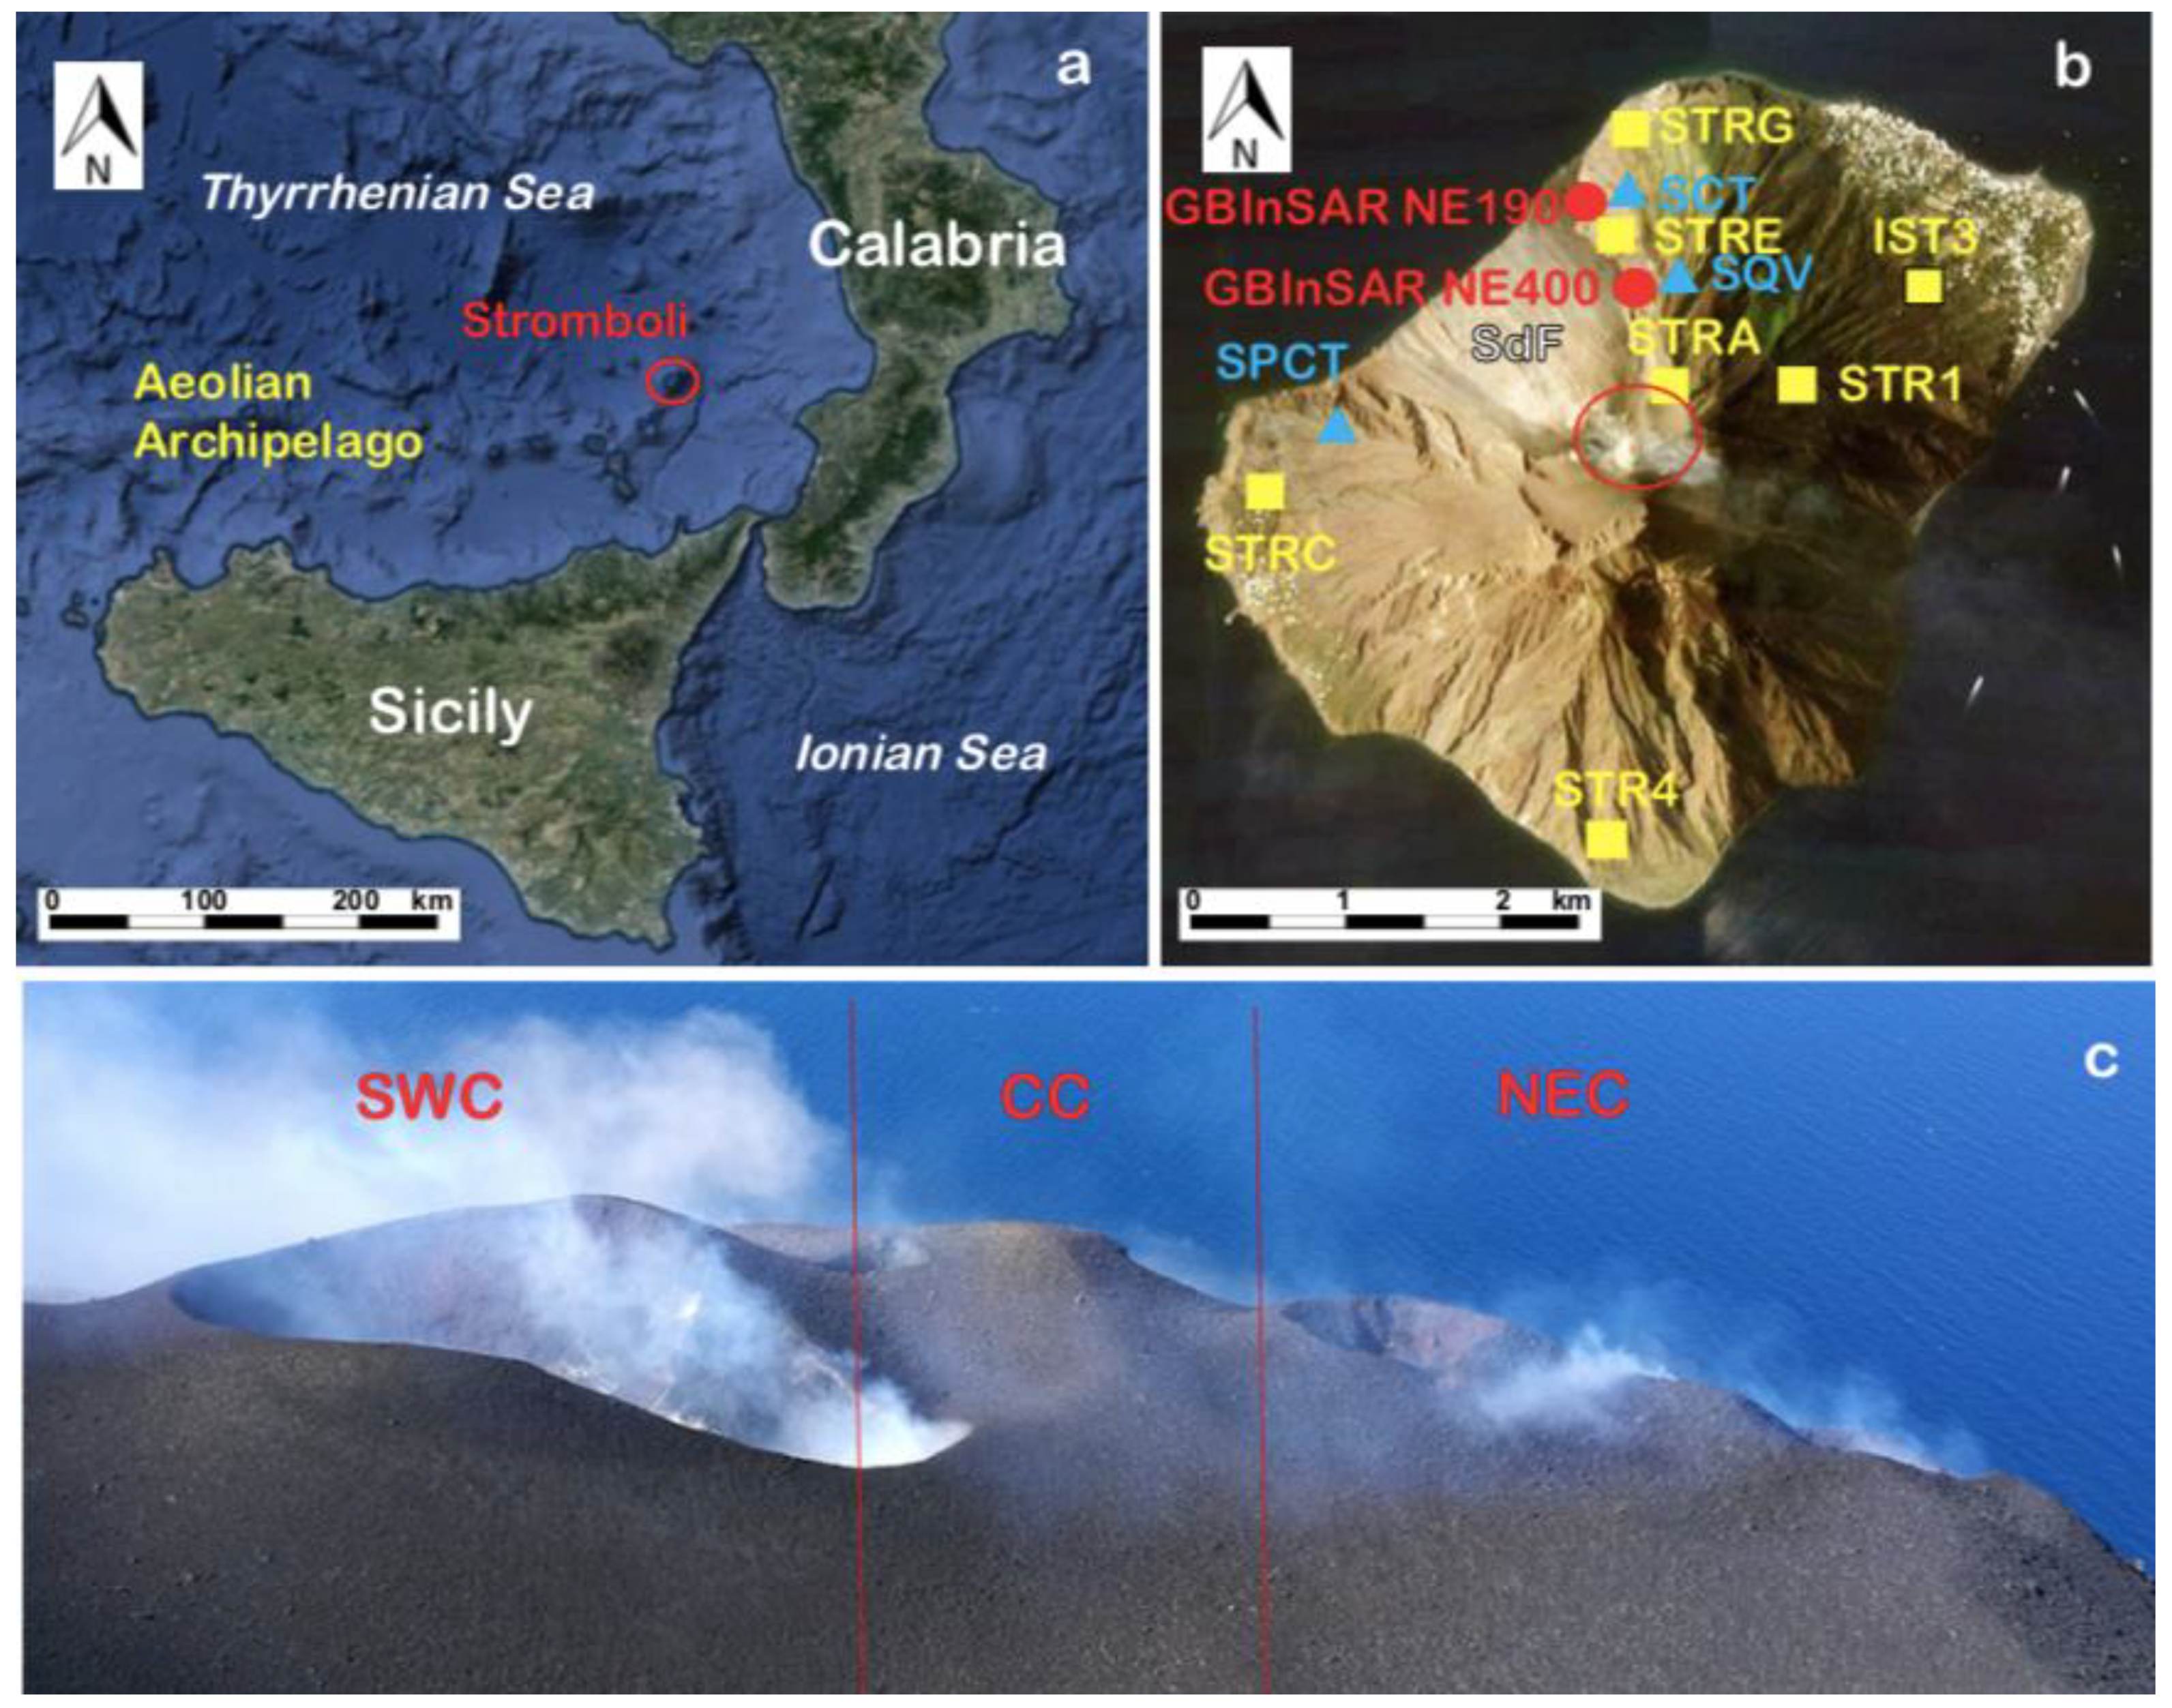
2.1. The INGV Cameras Monitoring Network

The INGV cameras monitoring network at Stromboli volcano in March–April 2020 comprised three fixed instruments, two thermals (SCT and SPCT) and a visual (SQV). Their details are listed in Table 1 and their location is shown in Figure 1. SQV acquires at a frequency of one image every two seconds, SCT one image every second, and SPCT two images every second. The difference in acquisition frequency, as well as in the distance from the crater area and viewing angle, result in a different count of the explosions, depending on the camera taken into consideration. The number of explosions is thought to represent an expression of the magma level within the feeder conduit [19,39,49,50]. We have manually counted the total number of events occurring within the whole crater area using only the thermal cameras (SCT and SPCT), because they allowed a comparison between day and night views. However, the presence of clouds and/or dust may limit or hide visibility, as happened during most of the day on 30 March and in the early h on 1 April 2020. The calculated velocity of PDCs and lava flows along the SdF slope, obtained from the images of the monitoring cameras, are average velocities, because they were calculated dividing the whole travelled path by the time. Some of the images were affected by shadows due to fog, clouds, or ash, resulting in a non-well-defined outline of the features. The cumulative error on these spatial measurements, which was due to the poor quality of some frames, is about 2%, and it was obtained from the number and size of uncertain pixels. All of the times are expressed here as UT.

2.2. GBInSAR

Measuring surface deformation, exploiting the phase difference between two spaceborne SAR images (differential InSAR, DInSAR; [51]) makes it possible to recognize ground displacements along the satellite line of sight (LOS) direction on a centimeter-scale. Processing a long stack of images using multi temporal (MT) InSAR techniques allows for the detection of millimeter-scale displacements over long time frames through the reduction of error sources [52,53]. GBInSAR has the additional advantage of producing frequent SAR images (on the order of seconds to minutes), resulting in very high frequency slope maps and time series. Moreover, the use of GBInSAR in the Ku-band (17.0–17.1 mm radar) can penetrate dust clouds, abundant especially during collapse events, and can work with variable light and atmospheric conditions [14]. The NE portion of the summit crater terrace at Stromboli and the northern portion of the SdF are monitored by two GBInSAR devices, which are located in a stable area N of the SdF (Figure 1). The first GBInSAR (GBInSAR NE400; Model: GB-InSAR LiSALab, Ellegi srl, Rovello Porro, Italy, http://lisalab.com/home/; Revisiting time; 11 min; [54]) was installed in February 2003, during the 2002–2003 flank eruption, whereas the second device (GBInSAR NE190; Model: GB-InSAR LiSAmobile k09, Ellegi srl – LiSALaB, Rovello Porro, Italy, http://lisalab.com/home/; Revisiting time; 2 min) was installed on 14 December 2014, after the flank eruption that took place that year.
Radar images were obtained through sampling techniques; for this reason, particular frequency and spatial steps had to be selected in order to avoid ambiguity in range and cross-range [54]. The system is able to measure line-of-sight (LoS) ground displacement in the time interval between two acquisitions and the displacement is calculated from the phase difference between the back-scattered signals received at different times, through the cross-correlation between two SAR images. Range and cross-range resolution are, on average, 2 × 2 m, with a measurement precision being referred to the displacement of less than 1 mm [54]. The displacement rate is the result of the mathematical division between the displacement measured in an interferogram (referred to the difference between two SAR images) and the elapsed time between the two images, allowing for the identification of very low displacement rates (0.010–0.001 mm/h) related to the creep of the northern sector of the SdF or very fast displacement rates (up to 300 mm/h) associated with effusive vent opening [55]. The capability of InSAR to detect ground displacement depends on the persistence of phase coherence over appropriate time intervals, therefore a SAR coherence mask (threshold = 0.5) was set to mask the noisy areas of the interferogram [54]. The phase values can be affected by ambiguity (unwrapped phase), but, due to the short-elapsed time between two subsequent measurements on Stromboli volcano, the interferometric displacements were usually smaller than half wavelength, so that no unwrapping procedures were needed.
The GBInSAR phase data are useful to detect: (i) the inflation/deflation of the summit plumbing system [40,44]; (ii) small-to-large scale slope instability, in response to eruptive (over-steepening and overloading; [14]) and magmatic activity (dike intrusions; [33,56]); (iii) the gravitational re-adjustment of the talus, sometimes evolving into rock-falls [35]; (iv) thermal contraction of the lava field, mainly in areas of lower pre-effusive slope angle [57]; and, (v) persistent flank motion [58].
Averaged power (amplitude squared) images produced by the GBInSAR NE400 were used to quantitatively evaluate the changes in the NEC’s morphology, as they were the closest devices to the NEC. Each analyzed image was derived-from-48-images averaged (≈ 1 every 4 h) in order to increase the signal to noise ratio and, in doing so, facilitate its interpretation. Because the NEC rim produced a shadow zone corresponding to the crater depression, it was possible to calculate the area of the crater itself as it changed over time [14]. The standard deviation was calculated as equal to 80 m2 (see [14]). A threshold was set at ~50 dB to map the area affected by the NEC widening and narrowing collapse.

2.3. Satellite Remote Sensing Monitoring

Multispectral satellite images processing is increasingly demonstrating its potential in providing both timely event detection for volcanic effusive events and, in the case of eruption, extraction of parameters that can help tracking the lava flow [59]. Even if the volcanic features of interest are usually much smaller than the nominal pixel size of the satellite image, moderate spatial resolution sensors (~1 km) can detect emitted radiance in the mid-infrared (MIR) wavelengths, a spectral region in which high temperature events, such as active lava flows, vents, and domes, emit copious amounts of energy. Satellite infrared data represented a useful means to describe the evolution of the eruptive event occurred during 28 March–1 April at Stromboli volcano. In particular, we used the HOTSAT system [60,61,62] to detect the presence of thermal anomalies through the analysis of multispectral infrared images acquired by a variety of satellite sensors with a revisit time of about 12 h per satellite, such as VIIRS (Visible Infrared Imaging Radiometer Suite), providing at-nadir pixel footprint of 375 m for I-bands, SLSTR (Sea and Land Surface Temperature Radiometer) on board of SENTINEL-3, and MODIS (Moderate Resolution Imaging Spectroradiometer), both providing 1 km pixels at-nadir. The combined use of sensors that differed for spatial characteristics (from 375 m to 1 km) and different acquisition times has proved to be a robust and reliable instrument for the thermal monitoring of active volcanoes [63,64,65]. The HOTSAT system locates the thermal anomalies (hotspot), computes the associated radiant heat flux summing up the contribute of each hotspot pixel, and, in the case of effusive eruption, provides the Time Averaged Discharge Rate (TADR) as proportional to the radiant heat flux [66]. The conversion from radiant heat flux to TADR was performed according to Harris et al. [67] using: TADR = Q/(ρ (cp ΔT + cL ΔΦ)), where Q is the total thermal flux obtained summing up the radiative power computed for each hotspot pixel, ρ is the lava density (2600 kg m–3), cp is the specific heat capacity (1150 J kg–1 K–1), ΔT is the eruption temperature minus temperature at which flow stops (100–200 K), cL is the latent heat of crystallization (3.5 × 10⁵ J kg–1, and ΔΦ is the volume percent of crystals that form while cooling through ΔT (30–54%).
The HOTSAT system was extended with a new module to process data acquired by Landsat 8 OLI and TIRS, Sentinel 2 MSI, and ASTER images in order to exploit higher spatial resolution multispectral images. Besides providing further information on the radiant heat flux, these data can be used to locate eruptive vents and describe the evolution of the lava flow field [68,69,70], based on the spatial and spectral resolution of the available bands and the phase and size of the eruption they catch. For example, in the case of an ongoing eruption, Sentinel-2 MSI, thanks to its bands in the SWIR (bands 11 and 12), can provide the position of an active vent and flow at the spatial resolution of 20 m, whereas Landsat-8 OLI, with its SWIR bands 6 and 7, can provide the same information at 30 m of spatial resolution. If a crusted lava flow is cooling, SWIR bands might not be able to detect it; on the other hand, it could still be visible in the thermal infrared TIR bands, i.e., Landsat 8 TIRS (bands 10 and 11) or ASTER (bands 10–14) at 100 and 90 m of spatial resolution, respectively. Due to the limited temporal resolution of these higher spatial resolution multispectral images, post-eruptive images occur more often than intra-eruptive ones and, in many cases, the flows cool too fast to be visible, even in the TIR bands.
Recently, the high spatial resolution and freely available information coming from the Multispectral Imager (MSI) on-board Sentinel-2 satellite has been used to facilitate the two-dimensional (2D) mapping of lava flows [71] through a new Machine Learning (ML) classifier, which discriminates the recent lava flows from pre- and post-eruptive multispectral images acquired by MSI, combined with pre-eruptive digital topography. Bands 2, 3, 4, and 8 at the spatial resolution of 10 m are used as input to the classifier. This ML approach relies on two steps: (i) a k-medoids unsupervised classifier separating input data in clusters whose pixels have the same properties; and, (ii) a Bayesian neural network mapping recent lava flows. In particular, the first step reveals pixels undergoing similar changes in time between pre- and post-eruptive images, adopting the correlation distance as a measure of similarity. Subsequently, in the second step, a small representative subset of each cluster is exploited to train the BNN, so that it provides us with the pixels belonging to the recent lava flow.
The advancement of satellite remote sensing techniques also has great potential for what concerns the three-dimensional mapping of volcanic products. Indeed, high spatial resolution data acquired in stereo, tri-stereo, or multi-view configuration (e.g., Pléiades, PlanetScope, ASTER) can be used to frequently update the topography and to estimate volcanic deposits by differencing successive topographies. Such estimates can improve the 2D mapping of lava flows while providing an independent maximum bound to lava flow volume that can be derived from the satellite infrared data [59,64,72,73]. We exploited the Pléiades constellation, which is composed of two optical satellites, Pléiades 1A and 1B, respectively, launched on December 2011 and 2012, in order to retrieve areas, volumes, and thickness distribution of the recent volcanic deposits in Stromboli. These satellites provide images at 50 cm spatial resolution in stereo and tri-stereo mode [74]. The 3D processing of the Pléiades imagery was performed using the free and open source MicMac photogrammetric library (available at http://micmac.ensg.eu), in this way 1-m Digital Elevation Models (DEMs) were obtained.
We derived two 1-m DEMs to further constrain the volume of volcanic deposits: a pre-eruptive one from the tri-stereo optical imagery acquired on 8 October 2019, and a post-eruptive one from the Pléaides-1 images of 7 April 2020. We differentiated them, so to obtain the thickness distributions of volcanic deposits emplaced between October 2019 and April 2020. The two DEMs were first co-registered using the Nuth and Kääb [75] method in order to avoid any errors that could derive from a misalignment.

2.4. The INGV Seismic Network

The seismic monitoring of Stromboli is based on a broadband seismic network [76] deployed on the island after the 2002–2003 effusive eruption. In the following years, the number of stations decreased due to the closure of some routes. Moreover, the seismic network was also damaged by the paroxysmal explosions of 2003, 2007, and 2019. The current configuration consists of seven stations (Figure 1, Table 2), managed by INGV-OV and INGV-OE. The data transmission is based on UHF radio links and the INGV wireless local area networking system. Seismic data are first transmitted to the centres in Stromboli and Lipari and then to the acquisition centres of the INGV-OV and the INGV-OE, in Napoli and Catania, respectively.
Stromboli seismicity is typically characterized by explosion-generated signals [77,78,79,80,81] and by persistent volcanic tremor [82]. Seismic signals that are associated with landslides [83,84], rolling blocks, PDCs, and lava flows were also recorded in the period 28 March–1 April 2020 (Figure 2). Although the explosion signals are transient events, compared to the recordings of tectonic and volcano-tectonic earthquakes, they (Figure 2a) are characterized by an emerging onset, so that a clear arrival of the P wave cannot be recognized on the seismogram. Moreover, they show a wide frequency band (0.05–10 Hz) containing a Very Long Period (VLP) event. The volcanic tremor (Figure 2b), typical of open conduit volcanoes, has a frequency content of between 1 and 3 Hz.
The signals that are caused by the typical landslides in loose pyroclastic deposits on the SdF (Figure 2c) have a fusiform envelope and are characterized by a relatively high frequency (4–15 Hz). An increase in the occurrence of these signals was a short-term precursor of the flank effusive eruption on 2007; therefore, they have been studied in detail in various works, especially from the point of view of their automatic and early detection [83,84]. Such signals are partly due to the morphogenetic processes of the SdF slope. Moreover, they can be related to the explosive activity that throws incoherent materials on the slope, which can be easily re-mobilized, thus generating landslides. These are also favored by effusive activity, as the lava front is often a source of incoherent material, which can move on the steep slope of the volcano’s flank [84]. Additionally, the signals that are caused by the rolling of large blocks (Figure 2d), in some cases, can be associated with detachments occurring at the lava flow front. They are similar to the ones associated with landslides in loose pyroclastic deposits, however some impulsive phases can be recognized in the waveform, and the spectrogram shows a less gradual onset when compared to that of the landslides in loose pyroclastic deposits. In the example of Figure 2d, the association of the seismic signal with the rolling of large blocks was based on its comparison with the images of the cameras. But an experienced seismic analyst is able to distinguish these signals, even on the basis of the visual analysis of the seismogram alone. This type of signal can also originate from rock-falls along the cliffs of the Labronzo area (North edge of the SdF). Occasionally, they were recorded on the southern side of the island, where there are steep morphologies. The signals caused by the rolling of large blocks (Figure 2d) are similar to the ones that were associated with landslides, however some impulsive phases can be recognized in the waveform, and the spectrogram shows a less gradual onset as compared to that of the landslides. These signals can also be associated with detachments occurring at the lava flow front. The signals that are linked to hot avalanches or PDCs (Figure 2e) are characterized by frequencies with a range 1–5 Hz and are due to incoherent hot materials that form massive flows. On 31 March 2020, the PDC mechanism generated seismic signals with large amplitude at the stations that are closest to the SdF slope.

3. Results

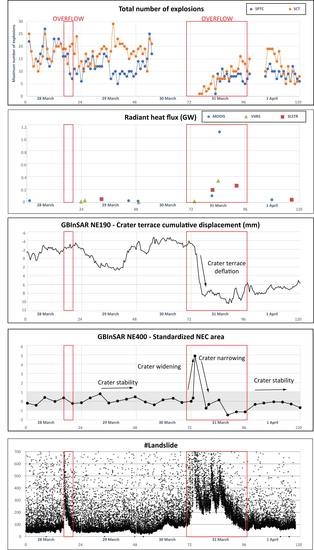
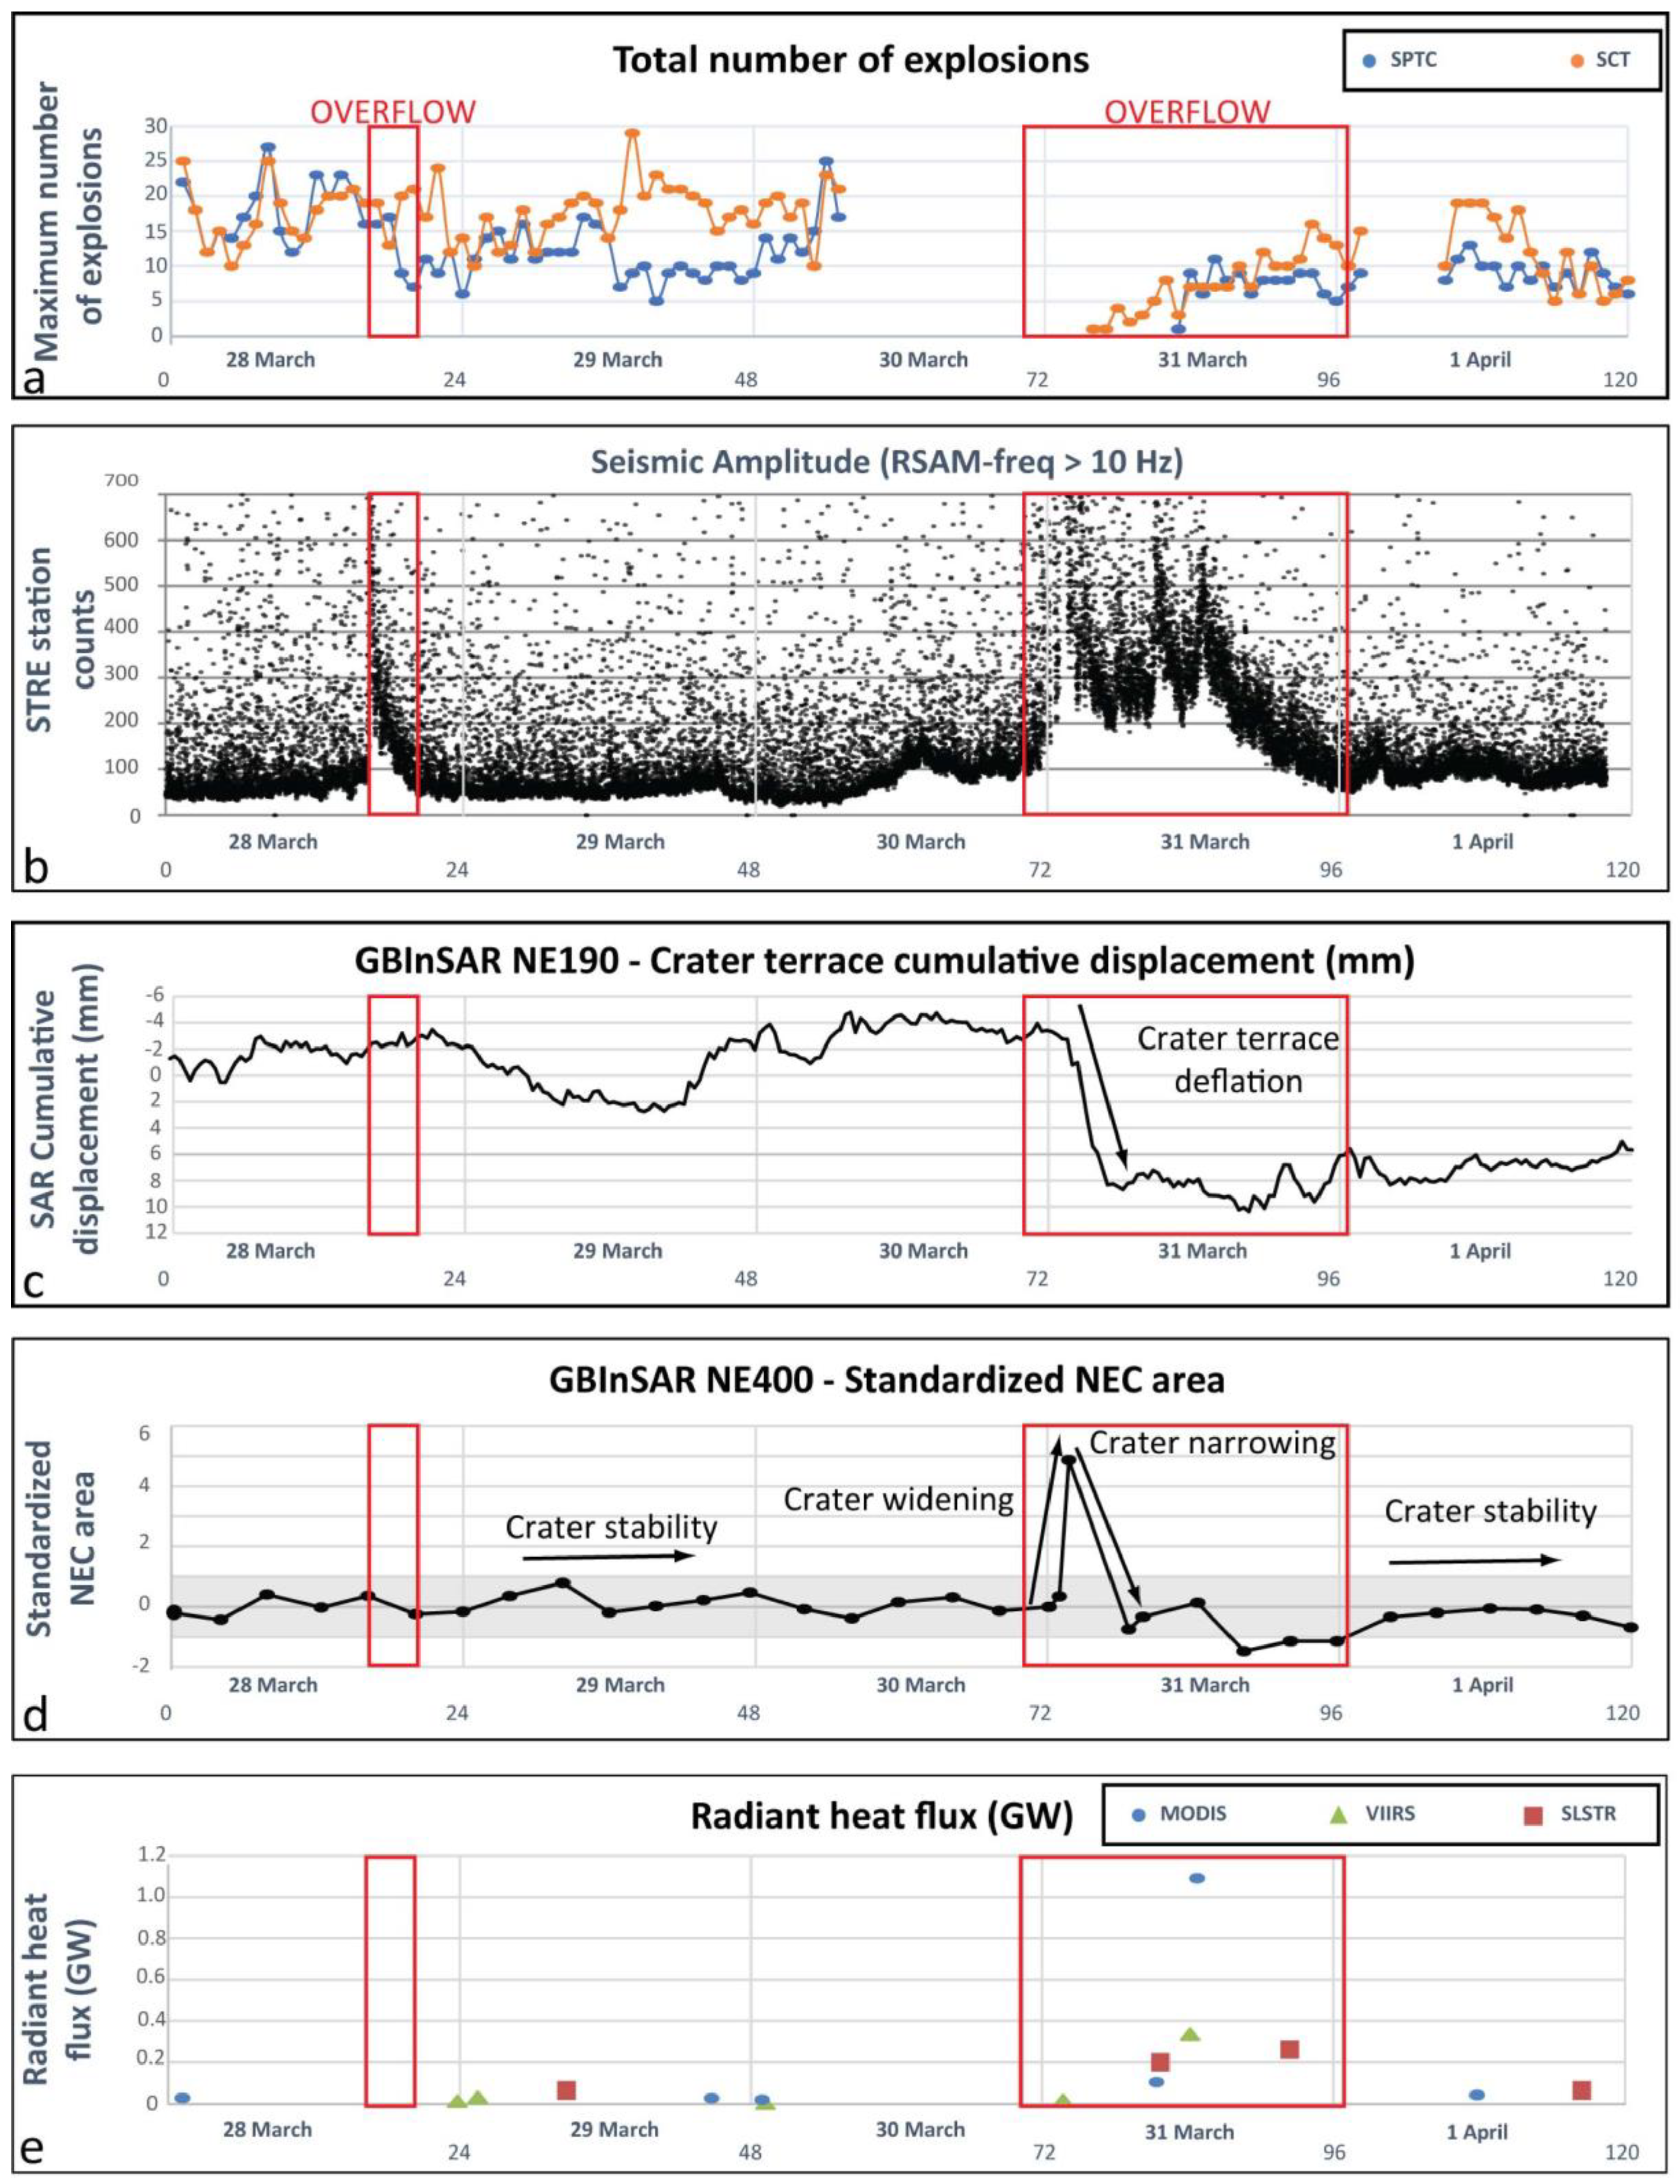
3.1. Eruptive Activity between 28 March and 1 April 2020
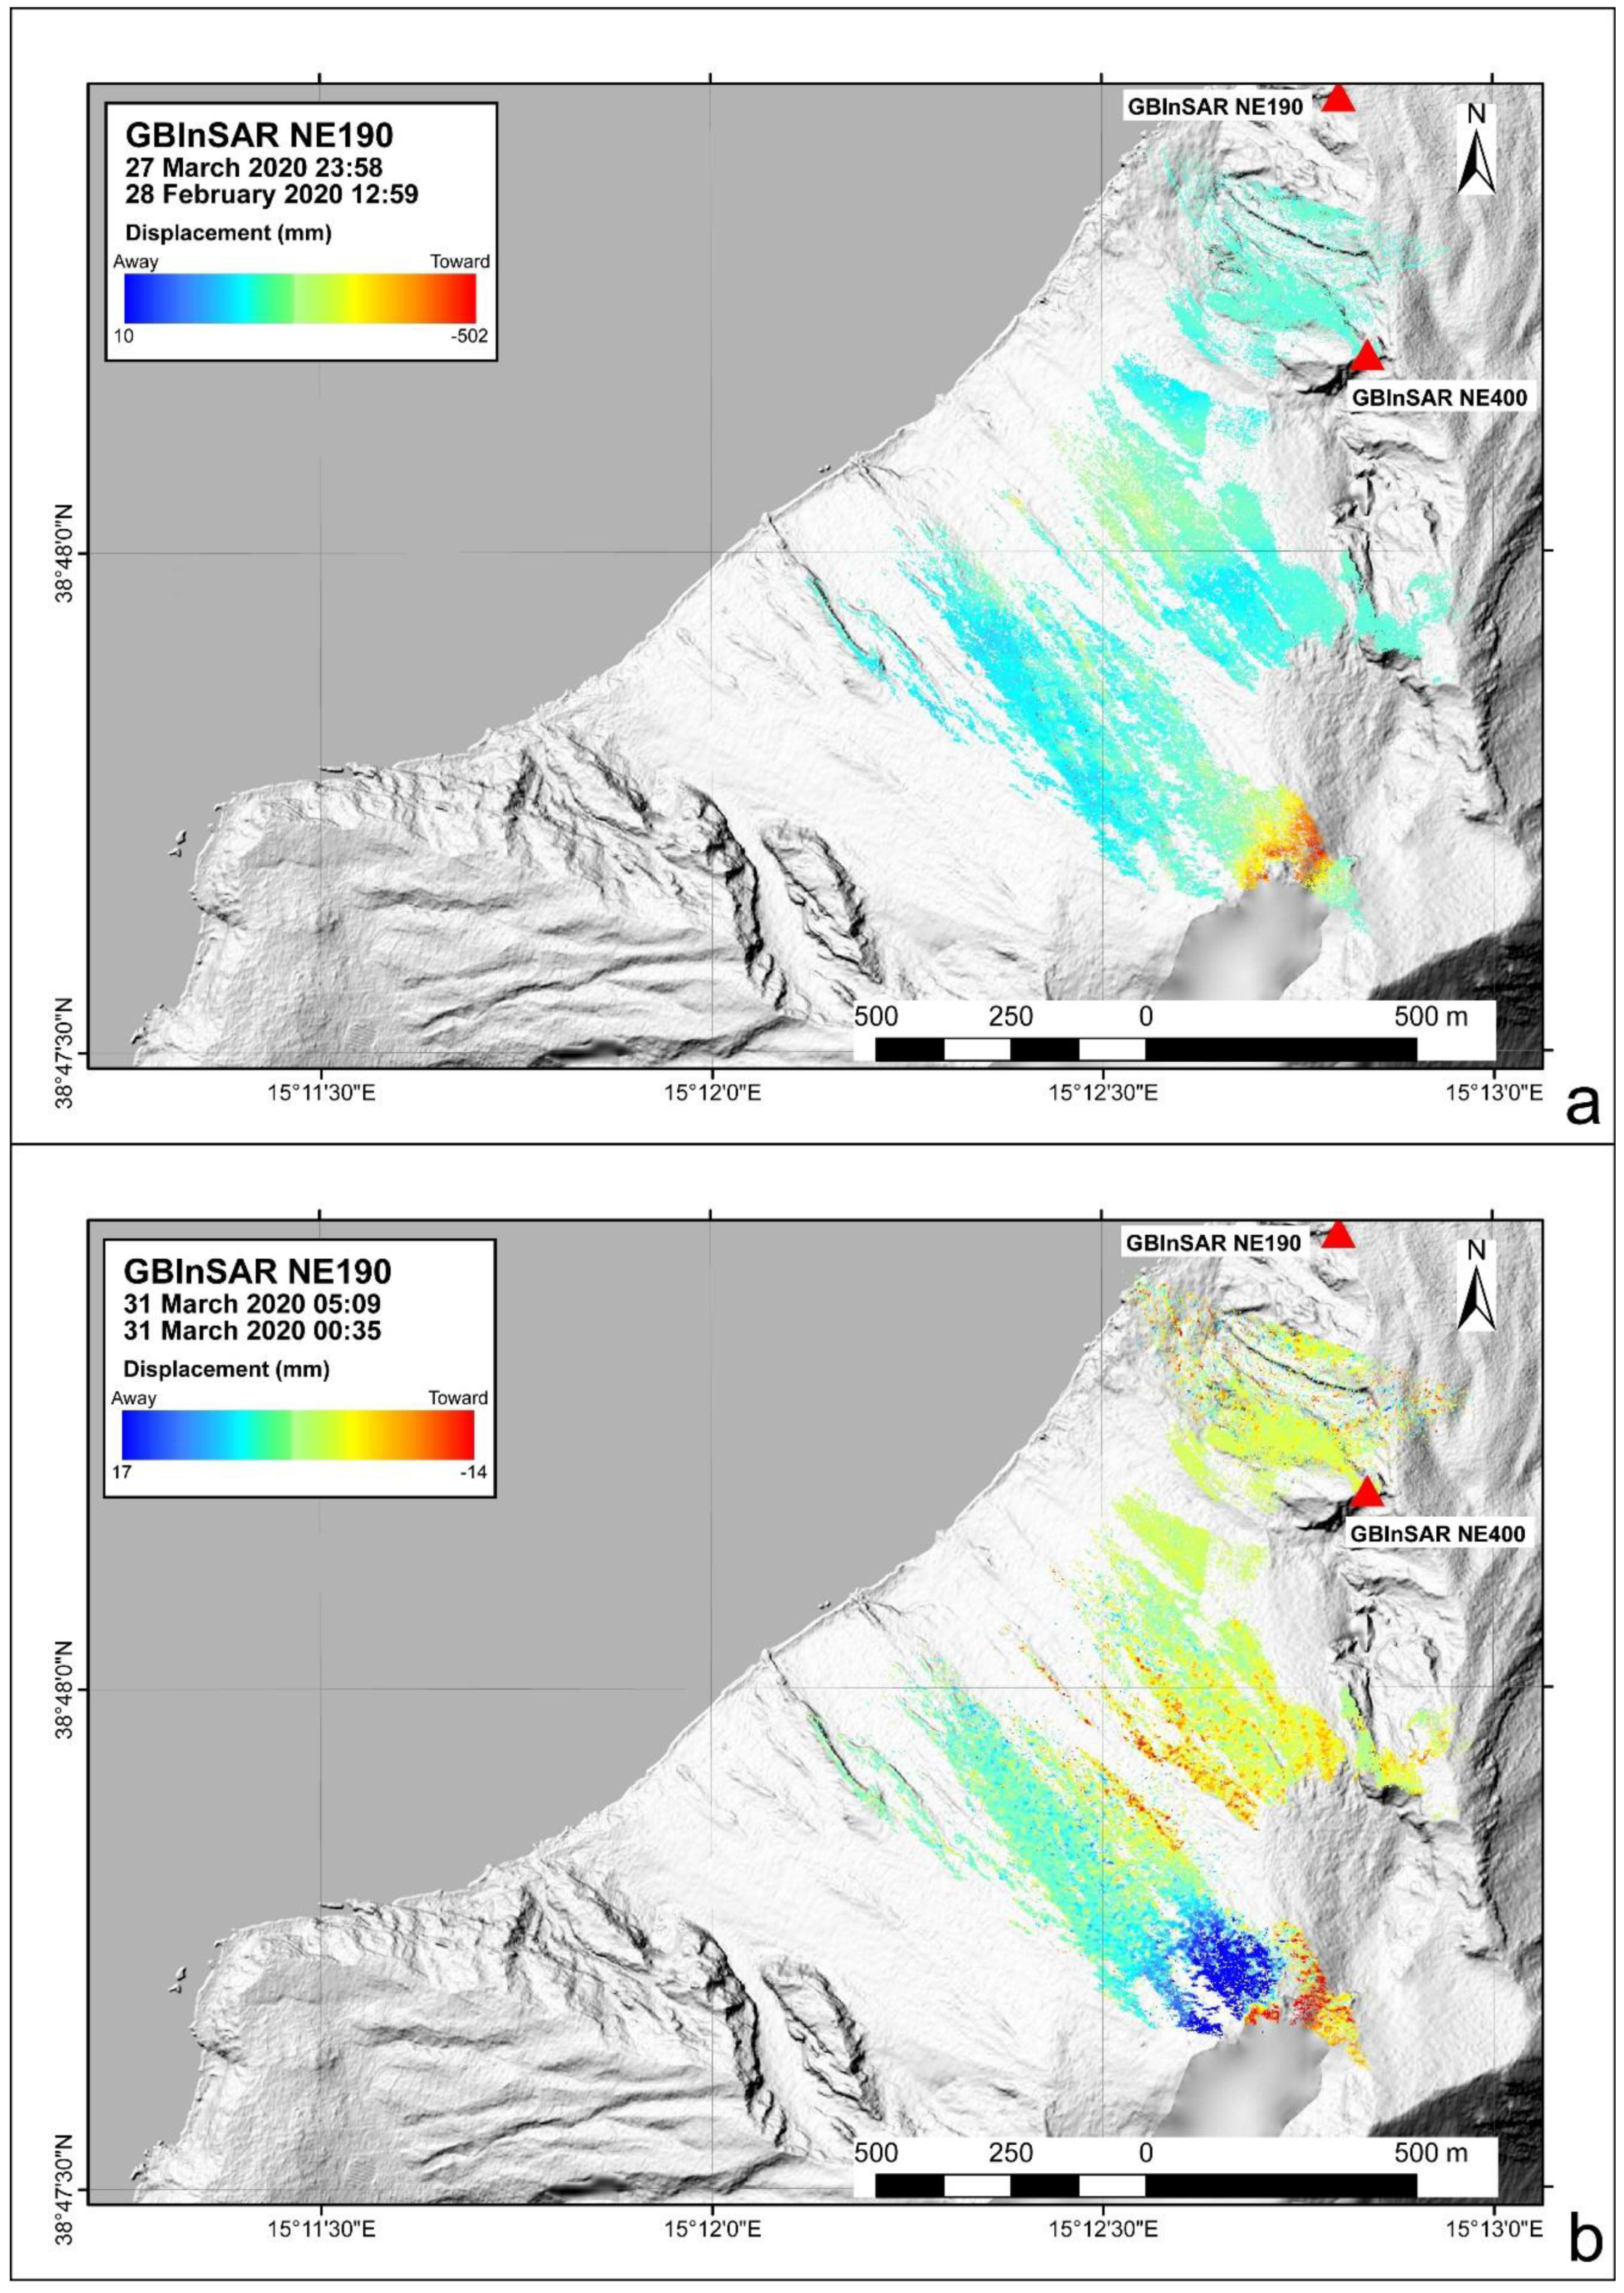
The eruptive activity taking place at Stromboli between 28 March and 1 April 2020 was studied using the images recorded both by satellites and by the INGV-OE monitoring cameras network. On 30 March and for the first half of the day on 1 April, poor weather conditions limited the visibility of the crater area.
The explosive activity at the summit vents was rather intense on 28 March, with 20–25 explosions/h obtained from both cameras SPCT (West flank) and SCT (East flank of the SdF, Figure 1 and Figure 3a). The eruptive activity took place at the NEC, featuring very intense explosions generating a spherical shape of incandescent spatters, which spread more laterally than vertically and all along the crater rim, fell on the NE outer flank and rolled down the SdF slope. This relationship between magma depth and column shape has been established previously [85], thus this shape of the explosions suggested that the level of magma within the vent was very shallow—estimated in a few tens of meters. Meanwhile, the explosions produced by the SWC were essentially of hot gas and ash with collimated jets extending more vertically than laterally, thus indicating that the level of magma within this vent was rather deep—estimated in a few hundred of meters [85]. At 15:38 the first landslide of hot debris coming from the NE rim of the NEC was observed, and it was followed by a powerful explosion. A similar landslide—the second reported on that day - occurred at 15:42, and it was apparently caused by the instability of the hot debris accumulated by the explosions on the steep slope of the NEC outer crater flank. Between 16:09 and 17:00 a series of small landslides from the NEC crater rim began, whose frequency increased in time until it became almost continuous. At 17:02 a lava flow started overflowing from a vent located at the base of the NE crater rim, and both thermal cameras suddenly recorded a significant decrease of the total number of explosions/h, from the previous 20–25 to 5–15 explosions/h (Figure 3a). At 17:44, the crater outline, as observed from SQV, showed a v-shaped cut in the crater rim, located above the effusive vent, which was caused by a collapse. The area of the missing block, estimated from the images recorded by the SQV camera, was ~110 m2. When considering a thickness of ~10 m for the missing block, the volume of the crater rim eroded by the landslides resulted in ~1.1 × 10³ m3. The erosion caused by the spreading of the lava flows on the North flank of the cone, forming a channel that was also widening by failures and erosion of the lateral margins, was ~1000 m2, estimated again by the images of the SQV camera. When considering a thickness of ~5 m for the collapsed area, a total volume of ~5.0 × 10³ m3 can be estimated. At 18:00, several incandescent blocks detaching from the lava flow fronts reached the sea, where formed an apron. After 19:00, the lava flow gradually decreased its output rate, and so did the number of landslides along the SdF, that had been triggered by the failure of incandescent blocks detaching from the flow fronts (Figure 3b). By midnight, the lava flow was no longer fed and, as soon as it stopped, the number of explosions per h gradually increased during the 29 March (Figure 3a). Poor visibility characterized most of 30 March between 07:00 and midnight, but from the images of SCT at 23:31 we could distinguish incandescent blocks that rolled over the NEC crater rim and down the SdF slope, signaling the start of another overflow. The number and size of the incandescent blocks rolling down the slope increased at 23:49, while two lava flows were spreading, one towards East and another towards North. The North flow was the longest and turned out to have the greater flux. The incandescent blocks detaching from the flow fronts accumulated along the coast and formed a hot talus that could be easily viewed during the early h of 31 March. At 01:46 and 01:49, two PDCs descended the SdF reaching the sea, and expanded as a cloud on the sea surface, followed by several other similar events, most of which are listed in Table 3. It is worth noting that the speed of the PDCs spreading on the sea surface was generally increasing from 6.9 m s−1 to 23.3 m s−1 between 01:50 and 02:51, and decreasing afterwards to 5.9 m s−1 until 03:41. The measured distance that was travelled by the PDC on the sea surface from the coast varied between 108 and 165 m, with speeds between 4.4 and 23.3 m s−1 (Table 3). Table 4 presents a list of several lava flows and PDCs that descended the SdF and reached the coast during 31 March. It shows the difference between the speed of the lava flows, from 2.8 to 5.2 m s−1, and the PDCs, which displayed velocities that were between 12.9 and 40.3 m s−1.
Table 4 also shows how the path to the coast decreased with time with the extension of the lava flows down the slope. This happens because many PDCs were starting from the lava flow fronts by detachment of hot blocks at breaks in slope. Once the PDCs reached the coast and spread on the sea surface, most of them formed ash clouds that expanded backwards and upslope to the crater area. Not all of the lava flows and PDCs that actually occurred are reported in Table 4, but only those where the visibility was clear enough to allow for an accurate measurement of the path and speed.
The alternation between lava flows and PDCs that descended the SdF slope indicates the gradual erosion of the summit cone that is caused by the emplacement of the lava flow and by the erosion of the summit cone. After 04:44 the lava flow widened at the coastline, forming a hot apron. Lava flows and PDCs continued during the morning at a decreasing rate corresponding to the gradual decrease of the supply to the lava flows, accompanied by a gradual increase of the explosions number from the summit craters (Figure 3a). The lava flow output decreased even more after 19:00 and, by 22:30 of 31 March, the lava flow was apparently no longer fed.
Figure 3 shows a comparison between different parameters measured during the period of interest (28 March–1 April 2020). Figure 3a shows how the number of explosions per h before this second lava flow was ~25 explosions/h, it decreased to below 5 explosions/h with the start of the lava flow output, and increased again after the end of the lava flows. This observation is consistent with the erupted volume for the 30–31 March lava flow, which was much greater when compared to that of the 28 March lava flow. After the emplacement of the 30–31 March lava flow, the NE flank of the summit cone outline was significantly modified. Being concave upwards at first, it appeared convex at the end, and the eroded surface was estimated at ~730 m2. When considering a depth of ~10 m, the eroded volume of the summit cone can be estimated to be ~7.3 × 10³ m3. This brings the total volume of the summit cone, collapsed from the uppermost NE flank between 28 and 31 March 2020, to 13.4 × 10³ m3.
Figure 3b displays the RSAM [86] of the STRE station (Figure 1) seismic signal (East–West component) filtered at a frequency >10 Hz, calculated within 15-s windows. RSAM stands for Real Time Seismic Amplitude Monitoring and it is based on the moving average of the seismic signal absolute value, optionally filtered in specific frequency bands. This parameter is sensitive to landslides, which generate frequencies >10 Hz in the seismic wave field of Stromboli that is generally dominated by frequencies <10 Hz. These signals can also be associated with lava overflows as the collapsing lava flow fronts can generate landslides. Therefore, the RSAM shown in Figure 3b clearly highlights both of the lava overflows that occurred on 28 and the 30–31 March 2020 as well as the PDCs spreading along the SdF.
Figure 3e shows the radiant heat flux registered between 28 March and 1 April. The first thermal anomalies were detected on 28 March (at 01:10) by MODIS, on 28 March (at 23:48) by VIIRS, and on 29 March (at 08:50) by SLSTR. Poor weather conditions and the short duration and magnitude of the activity prevented observation of the overflow that occurred on 28 March. The peak of activity was recorded by MODIS on 31 March at 12:45, with a radiant heat flux of about 1.1 GW, probably being associated with the maximum areal extent of the lava flow. The final thermal anomaly was detected by SLSTR on 1 April at 20:30.

3.2. GBInSAR Data

The eruptive activity reported between 28 March and 1 April 2020 was not accompanied by a long-term inflation of the summit area (Figure 3c,d and Figure 4), as was recorded for the 2012–2013 and 2014 eruptive activities [14,40,44,58]. Displacements that were recorded by the GBInSAR devices were located around the NEC and were mainly associated to the accumulation and instability of the newly emplaced material (Figure 3a). Abrupt change in deformation behavior (that is, movement away from the sensors) occurred between 01:50 on 31 March 2020 and 05:34 on 1 April 2020 (Figure 3c). Deflation was restricted to the very upper part (Figure 4b), as occurred on 27 February 2007 (lava flow), 15 February 2013 (overflow), and 7 August 2014 (lava flow). Along with summit deflation, localized movement toward the sensors was recorded in the NEC area and along the SdF, that was attributable to slope instability related to the outpouring of the overflows. In Figure 3d, it is possible to observe that the NEC area had remained roughly constant until 01:45 on 31 March 2020, when it increased almost abruptly, indicating strong crater widening. The NEC area returned quickly to its original dimensions at 06:40 on 1 April 2020.

3.3. Satellite-Derived Lava Flow Field Retrievals
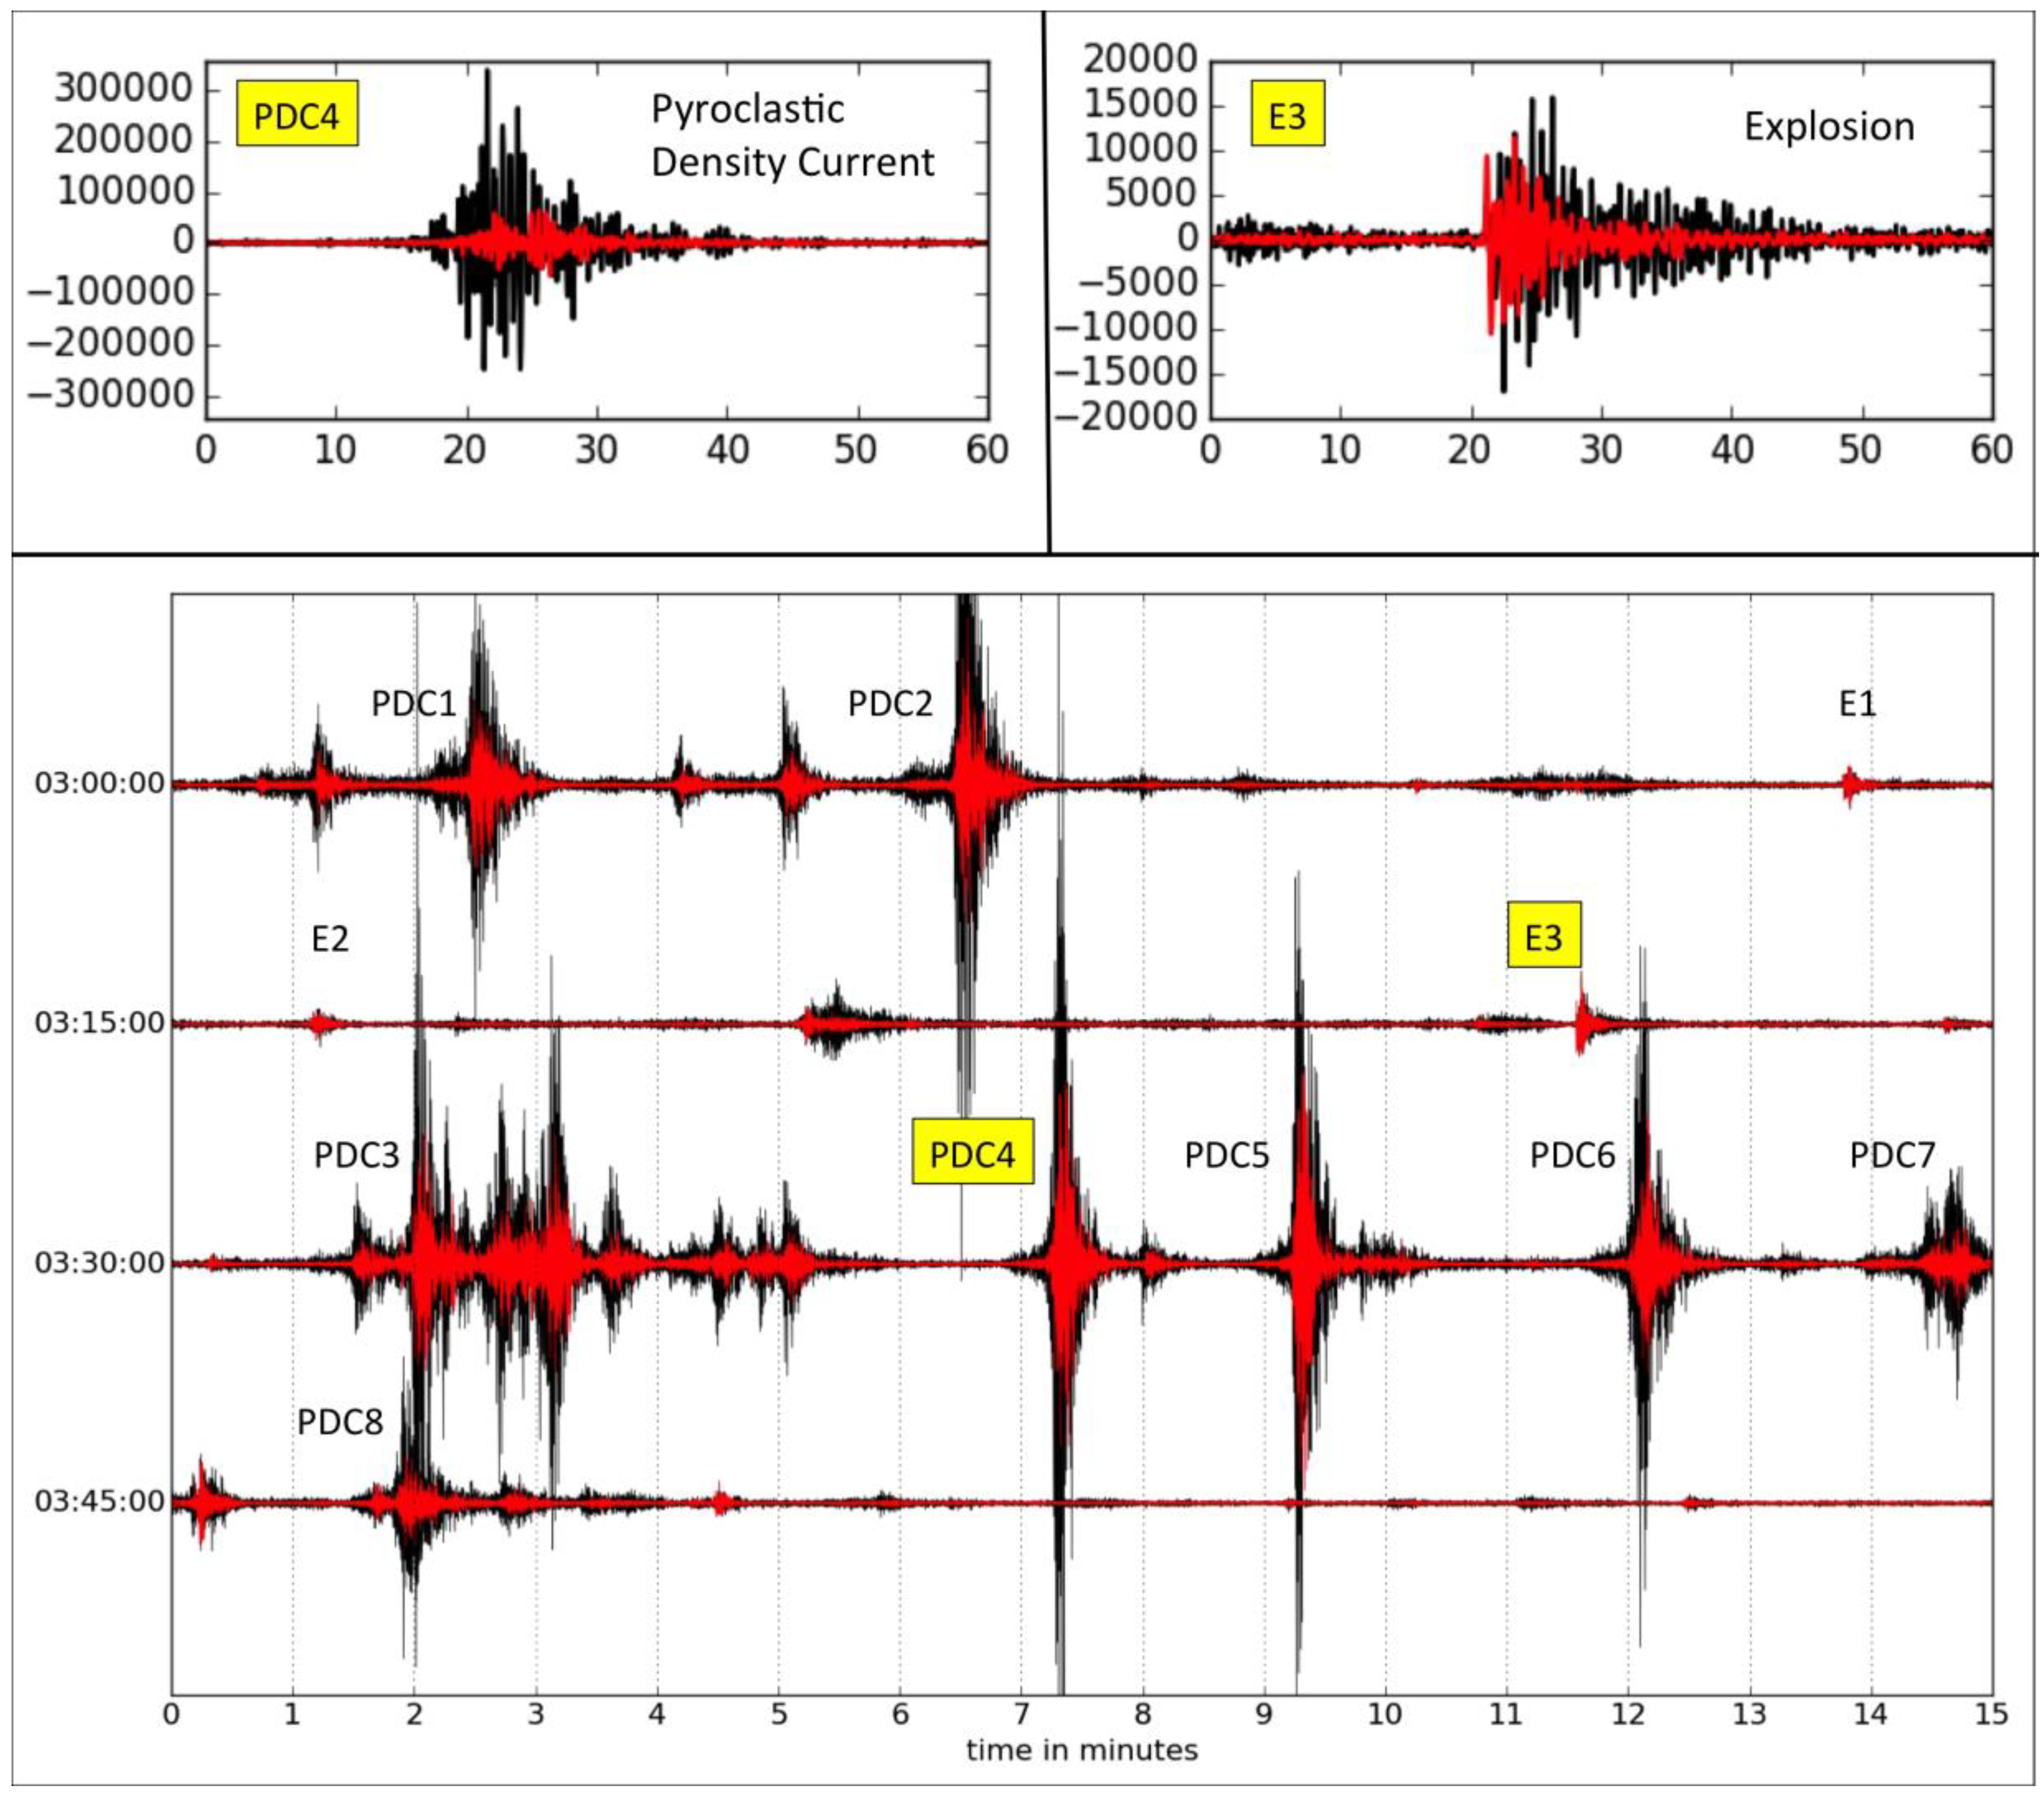
During the effusive phase that occurred between 30 March and 1 April, we converted the radiant heat flux (Figure 3e) into Time-Averaged Discharge Rate (TADR), which is an estimation of the effusion rate averaged over a certain duration ([87]; Figure 5). Integrating the TADR curve, we obtained an upper and lower bound for the erupted Dense Rock Equivalent (DRE) lava volume that can be placed between 37 and 69 × 103 m3. This compares to the volume of the NEC eroded during the overflows, which was estimated at 13.4 × 10³ m3.
The mapping of the lava overflow that occurred between 28 March and 1 April was performed through the ML classifier [72], using the Sentinel-2 MSI image acquired on 13 March as representative of the pre-eruptive, and the two images of 7 and 12 April 2020 as post-eruptive. As pre-eruptive topography, we used a 1-m Digital Elevation Model (DEM) that was generated by very high-resolution tri-stereo optical imagery acquired by the Pléiades-1 satellite constellation on 8 October 2019 [88]. Following the same steps that are discussed in [72], pixels with similar spectral properties were grouped in 50 clusters by the k-medoids unsupervised classifier. Subsequently, three pixels for each cluster were labelled to train the BNN, i.e., 150 pixels were used overall. To improve the accuracy, the lava flow field was then refined using the Pléiades image acquired on 7 April 2020, which provides a pixel resolution of 0.5 m.
Figure 6 shows the lava flow map resulting from the ML classifier. The area measures 94,500 ± 3380 m2. The uncertainty was calculated by multiplying the satellite-derived perimeter (6760 m) by the pixel resolution of the Péiades-1 imagery (0.50 m) [69].
In the area that was identified thanks to the ML classification (Figure 6), we found a thickness of volcanic deposits that goes from −14 m (due to the coastal erosion) to 14 m (in proximity of the NE crater) (Figure 7). The volume of the deposits accumulated near the NE crater amounts to 34,600 ± 9700 m3. For calculating the volume of the main lava flow spreading on the SdF, we analyzed the histogram of the thicknesses (inset in Figure 7), finding a peak to 0.8 m. Being the most frequent value, we assigned it to the pixels where the DEM difference was negative, thus estimating a volume of 144,400 ± 79,000 m3. Consequently, the total bulk volume of deposits thus amounts to 179,000 ± 89,000 m3. The uncertainty was computed by multiplying the areas by the residual vertical accuracy outside the margins of the deposits, i.e., the standard deviation (~1.7 m) of the DEM difference in the area that was not covered by deposits.

3.4. Seismicity

The observation of large amplitude signals that were associated with PDCs, in particular those that occurred on March 31, is the main peculiarity of the seismic data recorded during the March-April 2020 eruptive crisis at Stromboli. To gain insight into the nature of these signals, we compared the seismic recordings to the images of thermal cameras (Figure 8a), timed with the same reference system as the seismic network (UTC based on GPS). The signal due to a PDC consists of a landslide-type initial part and a near monochromatic phase (peak frequency around 3 Hz) with much larger amplitude. The spectrogram (Figure 8b) clearly highlights the transition between the two phases that occurs exactly at the time of the impact of the PDC on the coast. The landslide-type signal is shown in red in Figure 8c, whereas the near monochromatic phase is drawn in blue. This observation highlights that the PDCs flowing on the ground generate signals that are similar to those typical of landslides moving on the SdF. The material accelerates on the slope and then impacts on the coastline (or on the sea surface). The impact generates the large amplitude 1–3 Hz phase.
We also focused on the seismic amplitude of STRE station, near the SdF where the PDCs flow, and STR1 station, which is relatively far from the SdF. The comparison between different seismograms produced in one h at STRE and STR1 stations (Figure 1), including the major PDCs that occurred on 31 March, is displayed in Figure 9 and indicates the explosion (E) and PDC signals. We calculated the ratio between the amplitude of the E3 explosion and PDC4 signals (top of Figure 9) that were recorded at the two stations (STRE: black; STR1: red). In order to evaluate the seismic amplitude, we calculated the average of the absolute values (RSAM [86]) of 30-s windows of both the explosion and PDC signals, starting from the onsets of the transients recorded by the two different stations (vertical component). Subsequently, we calculated the amplitude ratios of the explosion signals and the PDC signals. We obtained E3 ratio (STRE RSAM)/(STR1 RSAM) ≈ 2 and PDC4 ratio (STRE RSAM)/(STR1 RSAM) ≈ 4. This observation highlights the rapid decay of the seismic signal amplitude moving away from SdF slope and confirms that the source of the seismic phase with dominant frequency around 3 Hz is on the surface.

4. Discussion

Between 28 March and 1 April 2020, the summit craters of Stromboli volcano produced two overflows, on 28 and 30–31 March. The two episodes lasted ~7 h and ~23 h, respectively, and were accompanied by the descent of PDCs down the SdF slope and on the sea surface. Integrating several monitoring data, comprising visual and thermal images from a network of fixed cameras, ground deformation from GBInSAR, seismicity, and satellite images, we could reconstruct the sequence of events that occurred between 28 March and 1 April 2020 and understand their eruptive processes, gaining useful insights for hazard assessment.
The explosive activity, in terms of the number of explosions versus time, increased before the 28 March and 30 March lava flows (Figure 3a), which suggested that the magma level was becoming shallower within the feeder conduit [19,39,49,50] prior to the lava flow output. Lava flows were heralded and followed by rock-falls and landslides, which triggered the descent of PDCs down the SdF slope (Figure 3b). The number and duration of these events, as recorded by the seismic network, appear much greater during the 30–31 March lava flow, which lasted longer than the previous event. The first effusive episode was not preceded by significant deformation of the summit zone as detected by the GBInSAR (Figure 3c,d and Figure 4), whereas the second was accompanied by a sudden widening and narrowing of the NE crater zone (Figure 3c,d), and followed by a deflation of the summit crater terrace (max 17 mm recorded away from the sensors, Figure 4b). It should be noted that deflation of the crater terrace (Figure 3c,d) did not occur after the 28 March lava flow, confirming that its erupted volume was probably much smaller compared to the 30–31 March event. The number of explosions at the summit craters decreased after both the lava flow outputs, but this decline was greater and lasted longer on 30–31 March (Figure 3a), yet again suggesting a greater drainage of the shallow conduit, consistent with a larger erupted volume, which generated this lava flow. Hence, during the eruptive phase that took place between 28 March and 1 April at Stromboli, the shift at the summit craters from the persistent Strombolian explosions to lava flow output was heralded by an increase in the rate of explosions, and by a shallower magma level within the feeder conduit [19,39,49,50]. Conversely, the decrease of explosive activity following the lava flow output suggests that the drainage of the uppermost conduit was efficient, requiring a certain amount of time (of the order of h, Figure 3a) in order to allow the magma level to rise again after drainage in order to restore the persistent Strombolian activity at the summit craters. This is consistent with similar events, which were observed during the much longer 2002–2003 and 2007 effusive phases [19,39,89,90,91]. Satellite data allowed us to obtain the map of the lava flows expanding on the SdF slope between 28 March and 1 April, which was estimated at 94,500 ± 3380 m2 (Figure 6), the radiant heat flux over time (Figure 3e), and, consequently, the TADR (Figure 5), providing an estimation of the cumulative erupted lava flow volume at 37–69 × 103 m3 DRE. This compares to the volume of the NEC flank eroded during the overflows that was obtained from the camera images, resulting in 13.4 × 10³ m3.
The behavior of the lava flow spreading from the craters down to the steep SdF slope was consistent with an increase of the lava viscosity and of the yield strength, caused by a decrease in gas-content and bulk temperature of the flow, as well as its crystallization [92]. As a consequence, the lava flow front fragmented and hot blocks detached and descended the slope, the fragmentation generating several PDCs [19,39,44]. Again, PDCs formation was more relevant during the 30–31 March lava flow than during the previous 28 March lava flow, confirming a lower volume and/or shorter extent of the former lava flow. Poor weather conditions impeded a clear view of the summit crater area from the camera monitoring network, which only detected the mid-lower portion of the slope along which the lava flowed and PDCs were spreading. However, we could obtain the average spreading velocity of several lava flows and PDCs descending down the SdF slope (Table 4) and on the sea surface (Table 3). These data show an increase of the speed of the PDCs spreading on the sea surface from 6.9 m s−1 to 23.3 m s−1 between 01:50 and 02:51 on 31 March, which later decreased to 5.9 m s−1 until 03:41. This is consistent with the greater speed of PDCs and lava flows along the SdF slope that was detected during the same lapse of time (Table 4), which led us to assume that the greater PDC velocity on the sea surface was probably caused by an initial greater thermal efficiency of the PDC starting from a higher elevation and flowing along the slope above the active, well-fed and hot lava flow. This might have increased PDC mobility, allowing for it to reach the coast and spread on the sea surface at high speed. By comparison, the velocity of some PDCs emplaced in 1997 at Montserrat by dome collapses whose velocity was between 8 and 21.9 m s−1 [93,94], whereas much greater values of ~100 m s−1 were obtained for the PDC that was emplaced during the 1888 phreatic eruption at Bandai Volcano [95]. Several PDCs on 30 and 31 March at Stromboli spread on the sea surface up to a maximum distance of ~165 m from the coast, with an estimated speed up to ~23 m s−1 (Table 3). This velocity compares pretty well to the measurement of more than 27.8 m s−1 (more than 100 km h−1; M. Pompilio, INGV unpublished report, 29 January 2003) obtained on a video of the PDC spreading on the sea surface for more than 100 m during the landslide and flank collapse of Stromboli on 30 December 2002. Similar PDCs spread on the sea surface at Stromboli in 2014 during the initial stages of the flank eruption, propagating for several tens of meters from the coast at speeds of 5.9 and 9.8 m s−1 [33].
The velocity to which the PDC expanded on the sea surface decreased along with the supply to the lava flow that was descending down the slope; at the same time, the PDC was travelling a shorter distance along the SdF slope (Table 4), thus causing a slower expansion of the PDC along the slope and reaching the coast at a lower speed. The measured distance that was travelled by the PDC on the sea surface from the coast varied between 108 and 165 m, with speeds between 4.4 and 23.3 m s−1 (Table 3). Hence, we understand that also small volume PDCs, like those produced during 28 March-1 April 2020 at Stromboli, can spread on the sea surface for hundred meters distance from the coast, causing a potential hazard for bathers, fishermen, or touristic boats sailing along the North coast of the island. Moreover, it must be considered that the ash cloud spreading backwards from the sea to the craters might produce ash fallout that could possibly reach tourists trekking along the SdF margins, even at lower heights.
PDCs spreading on the sea surface are not uncommon on Stromboli, and they surely represent an underestimated threat. They occurred during the subaerial and submarine landslide that caused a tsunami in December 2002 [16,17,96]; during the initial phases of flank effusive eruptions in 2002–2003, 2007, and 2014 [32,36,39]; after paroxysmal explosive eruptions triggered by column collapse [39,97,98]; and every time there is a small failure (with volumes of the order of 104 or 105 m3) of the summit craters due to overloading or instability [33,34]. The two most impressive episodes occurred in 2019 as a result of the 4–5 km high eruptive column collapse after the paroxysmal explosions of 3 July and 28 August. On these occasions, the PDCs expanded on the sea surface for several hundred meters threatening a boat with tourists onboard (https://www.youtube.com/watch?v=RPKgS3sPP1Y). Lava flow velocities are normally much lower when compared to the mobility of PDCs, with speeds normally below 10 m s−1 ([99], and references therein), because of their greater viscosity (e.g., [100]). Only rarely they pose a threat to people, with the exception of few cases of lava accumulated within a crater and suddenly drained by a fissure opening, such as on Nyiragongo [101,102]. However, at Stromboli, lava flows can represent an indirect threat because they can erode the base of the summit cone and trigger summit collapses [14].
Table 4 shows the very different speed along the same SdF slope between lava flows, which had velocities between 2.8 and 5.2 m s−1, and the PDCs, which displayed velocities between 12.9 and 40.3 m s−1. Several authors [103,104,105] observed that abrupt slope changes or variations in magma supply affect the velocity of lava flows. When the slope is greater than 24°, it can result in the detachment of blocks from the flow front to form talus and, when the slope is even greater, as in the case of the SdF on Stromboli that reaches 30–35° [44,106], the tensional stresses overcome the tensional strength, so that the lava cannot flow any longer. Instead, it breaks into incandescent blocks [103] rolling down the slope and forming a PDC and a distal pile of talus.
The monitoring of PDCs along the slope of steep volcanoes, like Stromboli, is therefore of crucial importance, because they unexpectedly evolve into flank collapses possibly triggering tsunamis, as happened at Stromboli in 2002 [16,17,96], and more recently at Anak Krakatau in 2018. On that occasion, the tsunami caused over 430 fatalities, injured 14,000 people, and displaced 33,000 more along the Sunda Strait [18,107]. Interesting enough, the precursory phase of the Anak Krakatau flank collapse was characterized by an increase of the eruptive activity that lasted for 175 days, and the collapse was preceded by two seismic signals consistent with minor mass movements as well as a momentary quiescence [18,107]. Luckily, the mass movements in the eruptive crisis of 28 March–1 April 2020 at Stromboli were of modest size, not comparable to the events that were described at Anak Krakatau. However, the PDC seismic recordings of Stromboli share some characteristics with the PDCs recorded on other volcanoes, such as Merapi [108] and Unzen [109]. In general, the PDC seismic signals have frequency content between 2 and 15 Hz, similar to that of signals due to landslides in loose clastic material. When PDCs originate from dome collapse, as in the case of Unzen [109], they may contain a lower frequency component caused by the collapse of the dome. In general, the onset of PDC seismic signals emerges with a gradual increase in amplitude, which then remains constant on average for the entire time of the event. These characteristics lead to the classification of PDC seismic signals as continuous and non-transient signals [110]. In addition to these characteristics, in the Stromboli PDC seismograms we were able for the first time to identify the seismic signals caused by the impact of PDCs on the coastline. They could be due to the development of a T phase that can be generated when a landslide enters the underwater environment ([89] and references therein). However, the very well defined peak frequency around 3 Hz (Figure 2e), within the tremor frequency band (Figure 2b), can also be attributed to the resonance of the shallow conduit located in the volcano edifice at a small depth below the SdF [77], which generates the volcanic tremor of Stromboli [82].
Processing and combining multispectral infrared images that were acquired by a variety of satellite sensors with different spatial characteristics and acquisition times allowed for us to derive the radiant heat flux from 28 March at 01:10 to 1 April at 20:30, finding a peak of thermal activity of ~1.1 GW on 31 March at 12:45 (Figure 3e). Poor weather conditions, as well as the limited time duration and small magnitude of the event, did not allow for the calculation of the TADR and volume of the lava overflow erupted on 28 March, but only that erupted from 30 to 31 March, obtaining a peak of TADR of ~2.3 m3 s−1 on 31 March at 12:45 and a volume of ~53 × 103 m3 for the 30–31 March overflow. Because it emplaced in 23 h, the Mean Output Rate (MOR) results ~0.65 m3 s−1. Using a ML approach, we were able to estimate a cumulated area over which the two lava overflows emplaced, which amounts to 94,500 m2. From DEM difference, we retrieved a total average bulk volume of ~179 × 103 m3 emplaced between 8 October 2019 and 7 April 2020, which reduces to a DRE volume of ~136 × 103 m3 when considering an average lava vesicularity of 25% [111]. This value includes four overflows, which all occurred in the same area, on 18 January, 3 February, 28 March and 30–31 March 2020. Comparing it to the satellite-derived estimate for 30–31 March, we found a DRE cumulative volume of ~83 × 103 m3 emitted during the three previous events. Due to the comparable duration (a few hours) of the overflows occurred on 18 January, 3 February, and 28 March, it is plausible to divide this volume equally, obtaining ~27.5 × 10³ m3 per each eruptive episode. Summing up this value with the one derived from multispectral infrared satellite images for the 30–31 March, a lava volume of ~ 80.5 × 10³ m3 could have been emitted during 28 March–1 April, eventually providing an average thickness of 0.85 m.

5. Conclusions

Even if eruption-induced mass-flows at Stromboli volcano are common, the triggering mechanisms are yet to be fully understood, also because of the great diversity of the observed phenomena. In this study, the mass-flows that were associated with overflows occurred between 28 March and 1 April 2020 have been analyzed through the use of remote sensing data, both with ground and satellite based sensors, and deriving from seismic sensors. The analysis of the videos recorded by the network of fixed monitoring cameras allowed for the description of the events, as well as the calculation of the velocity to which the lava flowed and the PDCs descended down the SdF and on the sea surface. These videos also made it possible to count the explosions occurring at the summit craters over time. Two GBInSAR devices detected both ground-deformation and morphological changes induced by the slope instability. Remote sensing data also include multispectral satellite data, used to constrain lava flow field area and volume, as well as an estimation of the effusion rate. Moreover, seismic data made it possible to characterize the various stages of the instability phenomena and, at the same time, to integrate the camera data for the description of the relationship between overflows and PDCs, and they were also useful for detecting the signal of the impact of PDCs on the sea surface.
The main results of this study can be summarized, as follows:
-
before the analyzed phase, the explosive activity at the summit vents was reasonably intense (20–25 explosions/h), with a prevalence of explosions that produced coarse material in the NEC (i.e., shallow magma level in the conduit);
-
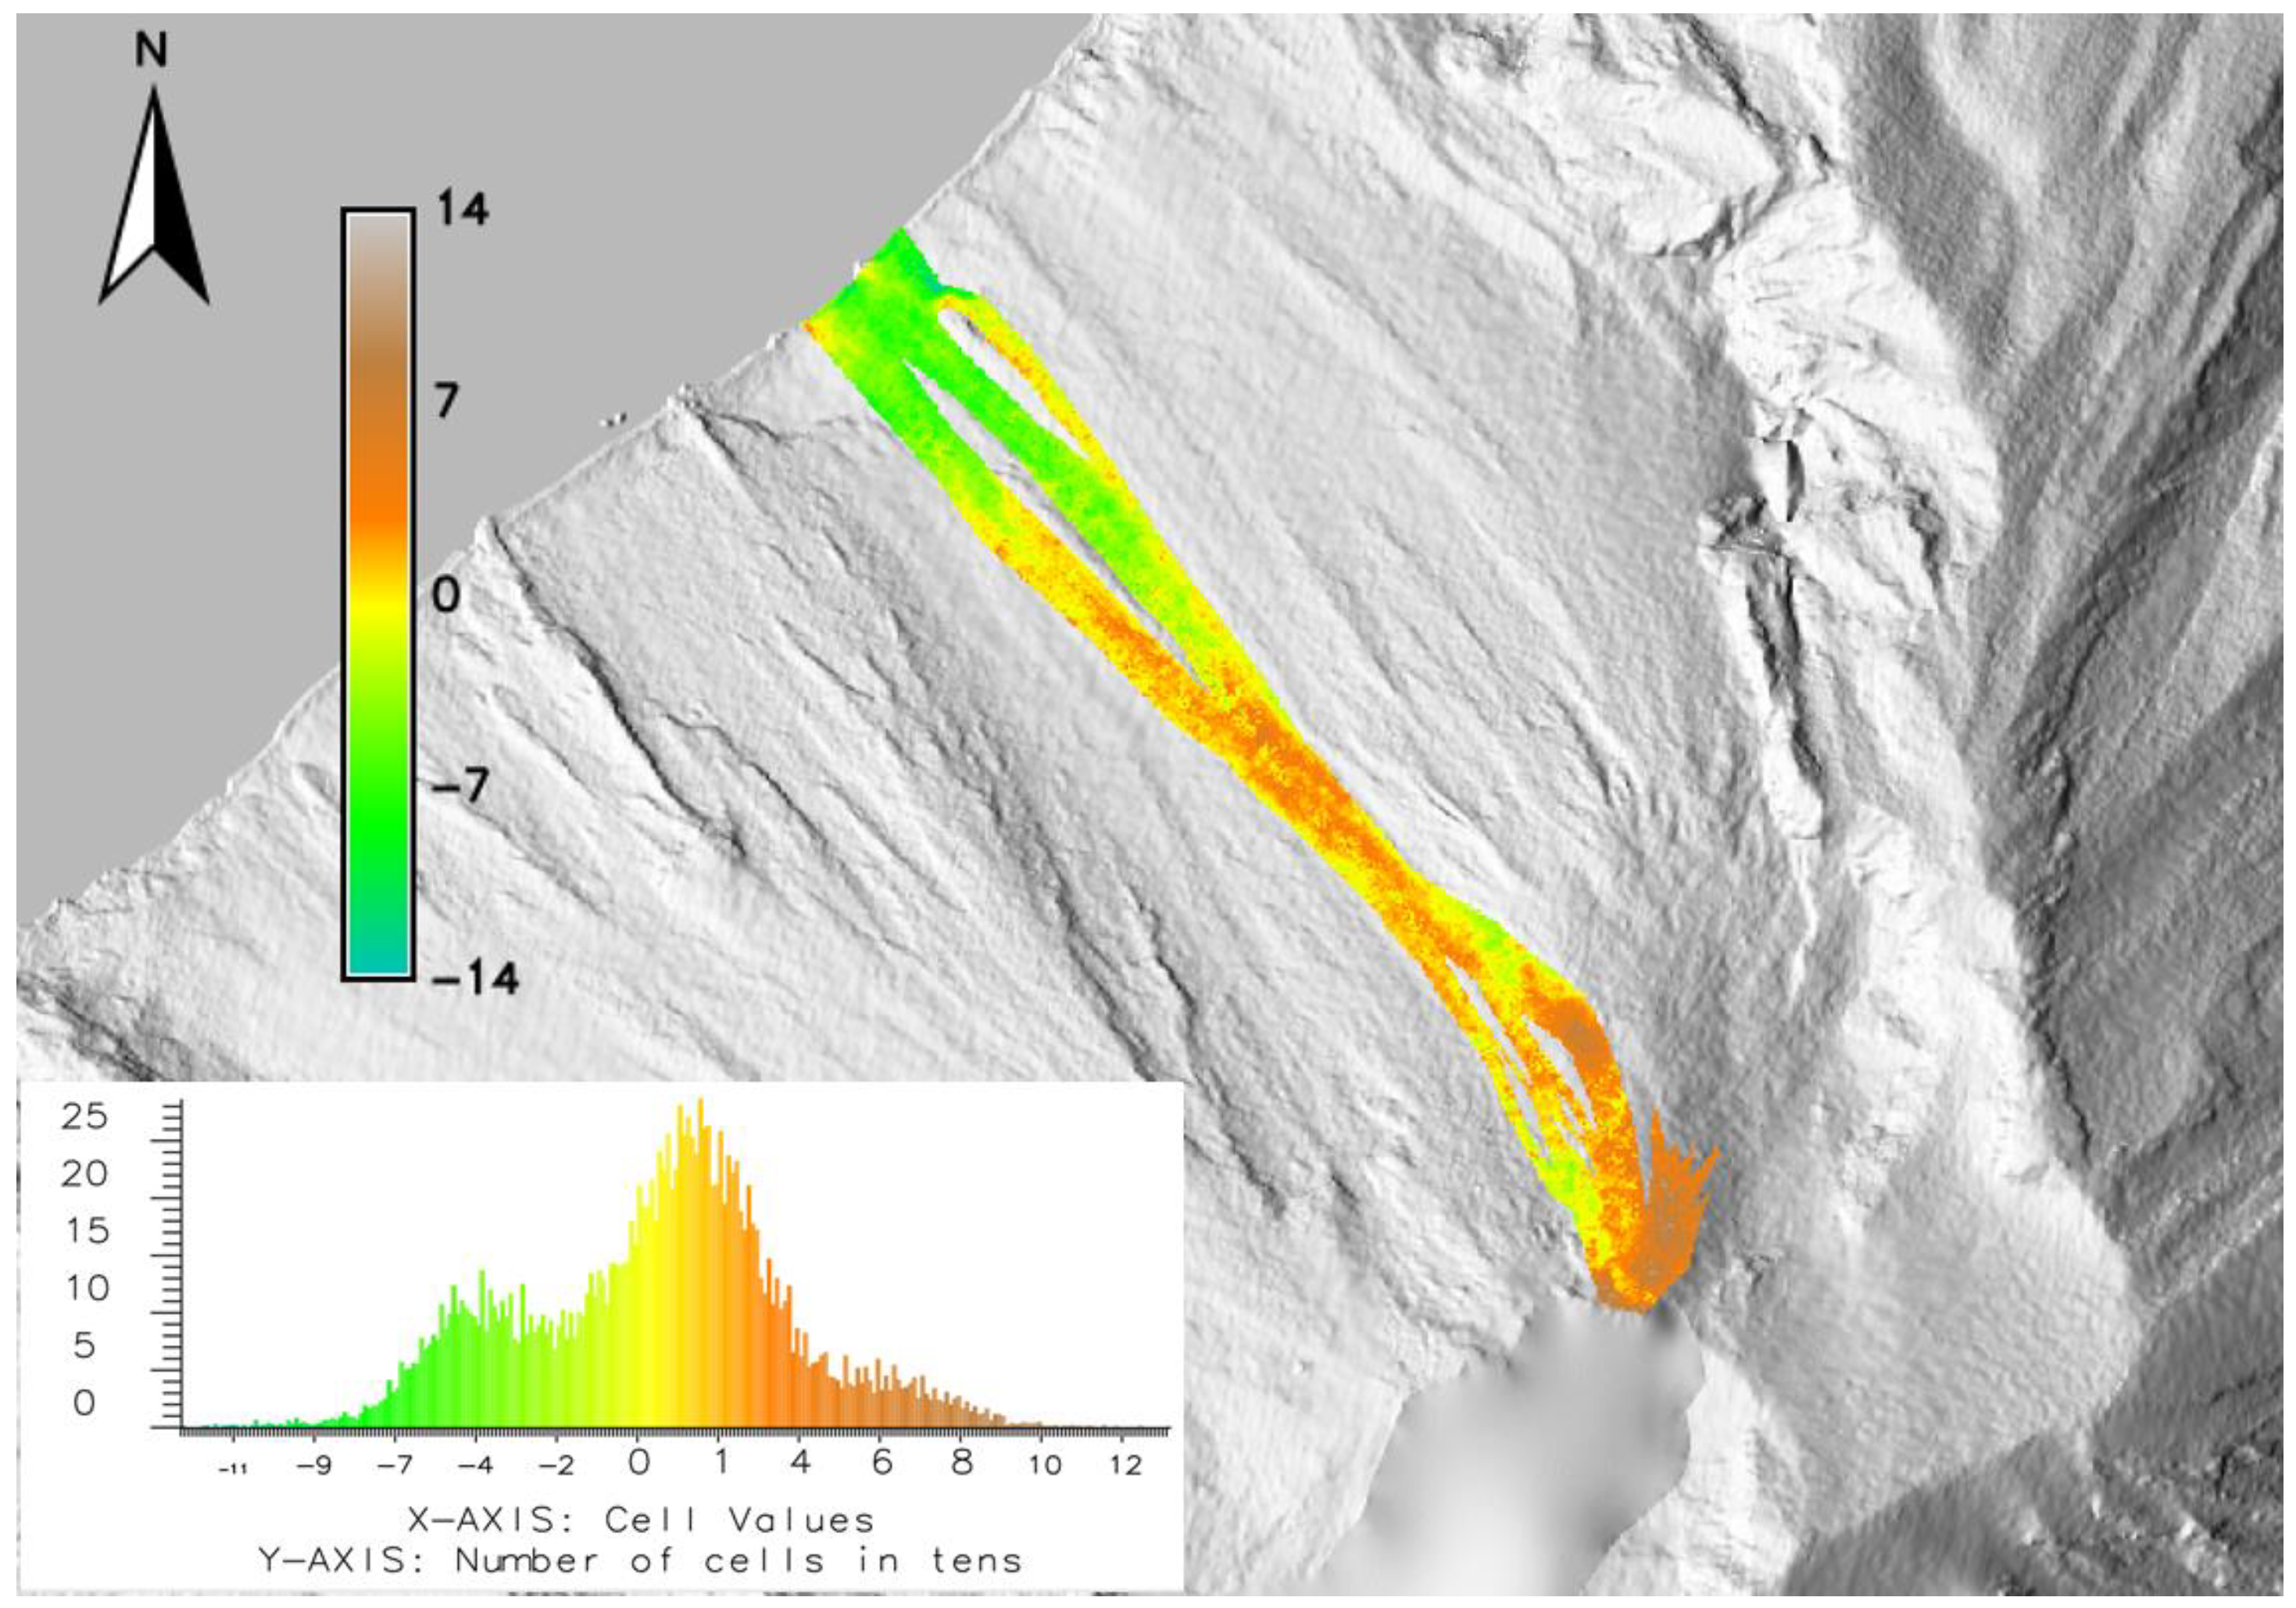
the 28 March 2020 overflow was anticipated by some landslides that involved the material accumulated in the areas around the NEC (total eroded volume ~5–6 × 10³ m3), even if these did not generate a substantial widening of the crater itself;
-
the first overflow was accompanied by a decrease of the total number of explosions/h (from the previous 20–25 to 5–15 explosions/h);
-
PDCs were also generated by the crumbling of the overflow front, they reached the sea and formed an apron on the coast;
-
no ground deformation was recorded before nor after the 28 March event, meaning that the lava flow volume was small;
-
after the first overflow, the number of landslides detected with the seismic network decreased, while the number of explosions increased again, suggesting a new upward movement of the magma level within the conduit;
-
the onset of the new overflow phase occurred on 30 March together with a new sharp reduction in the number of explosions, a new increase in the number of landslides, which produced a significant variation in the morphology of the crater and which were associated with the accumulation of incandescent material along the coast line;
-
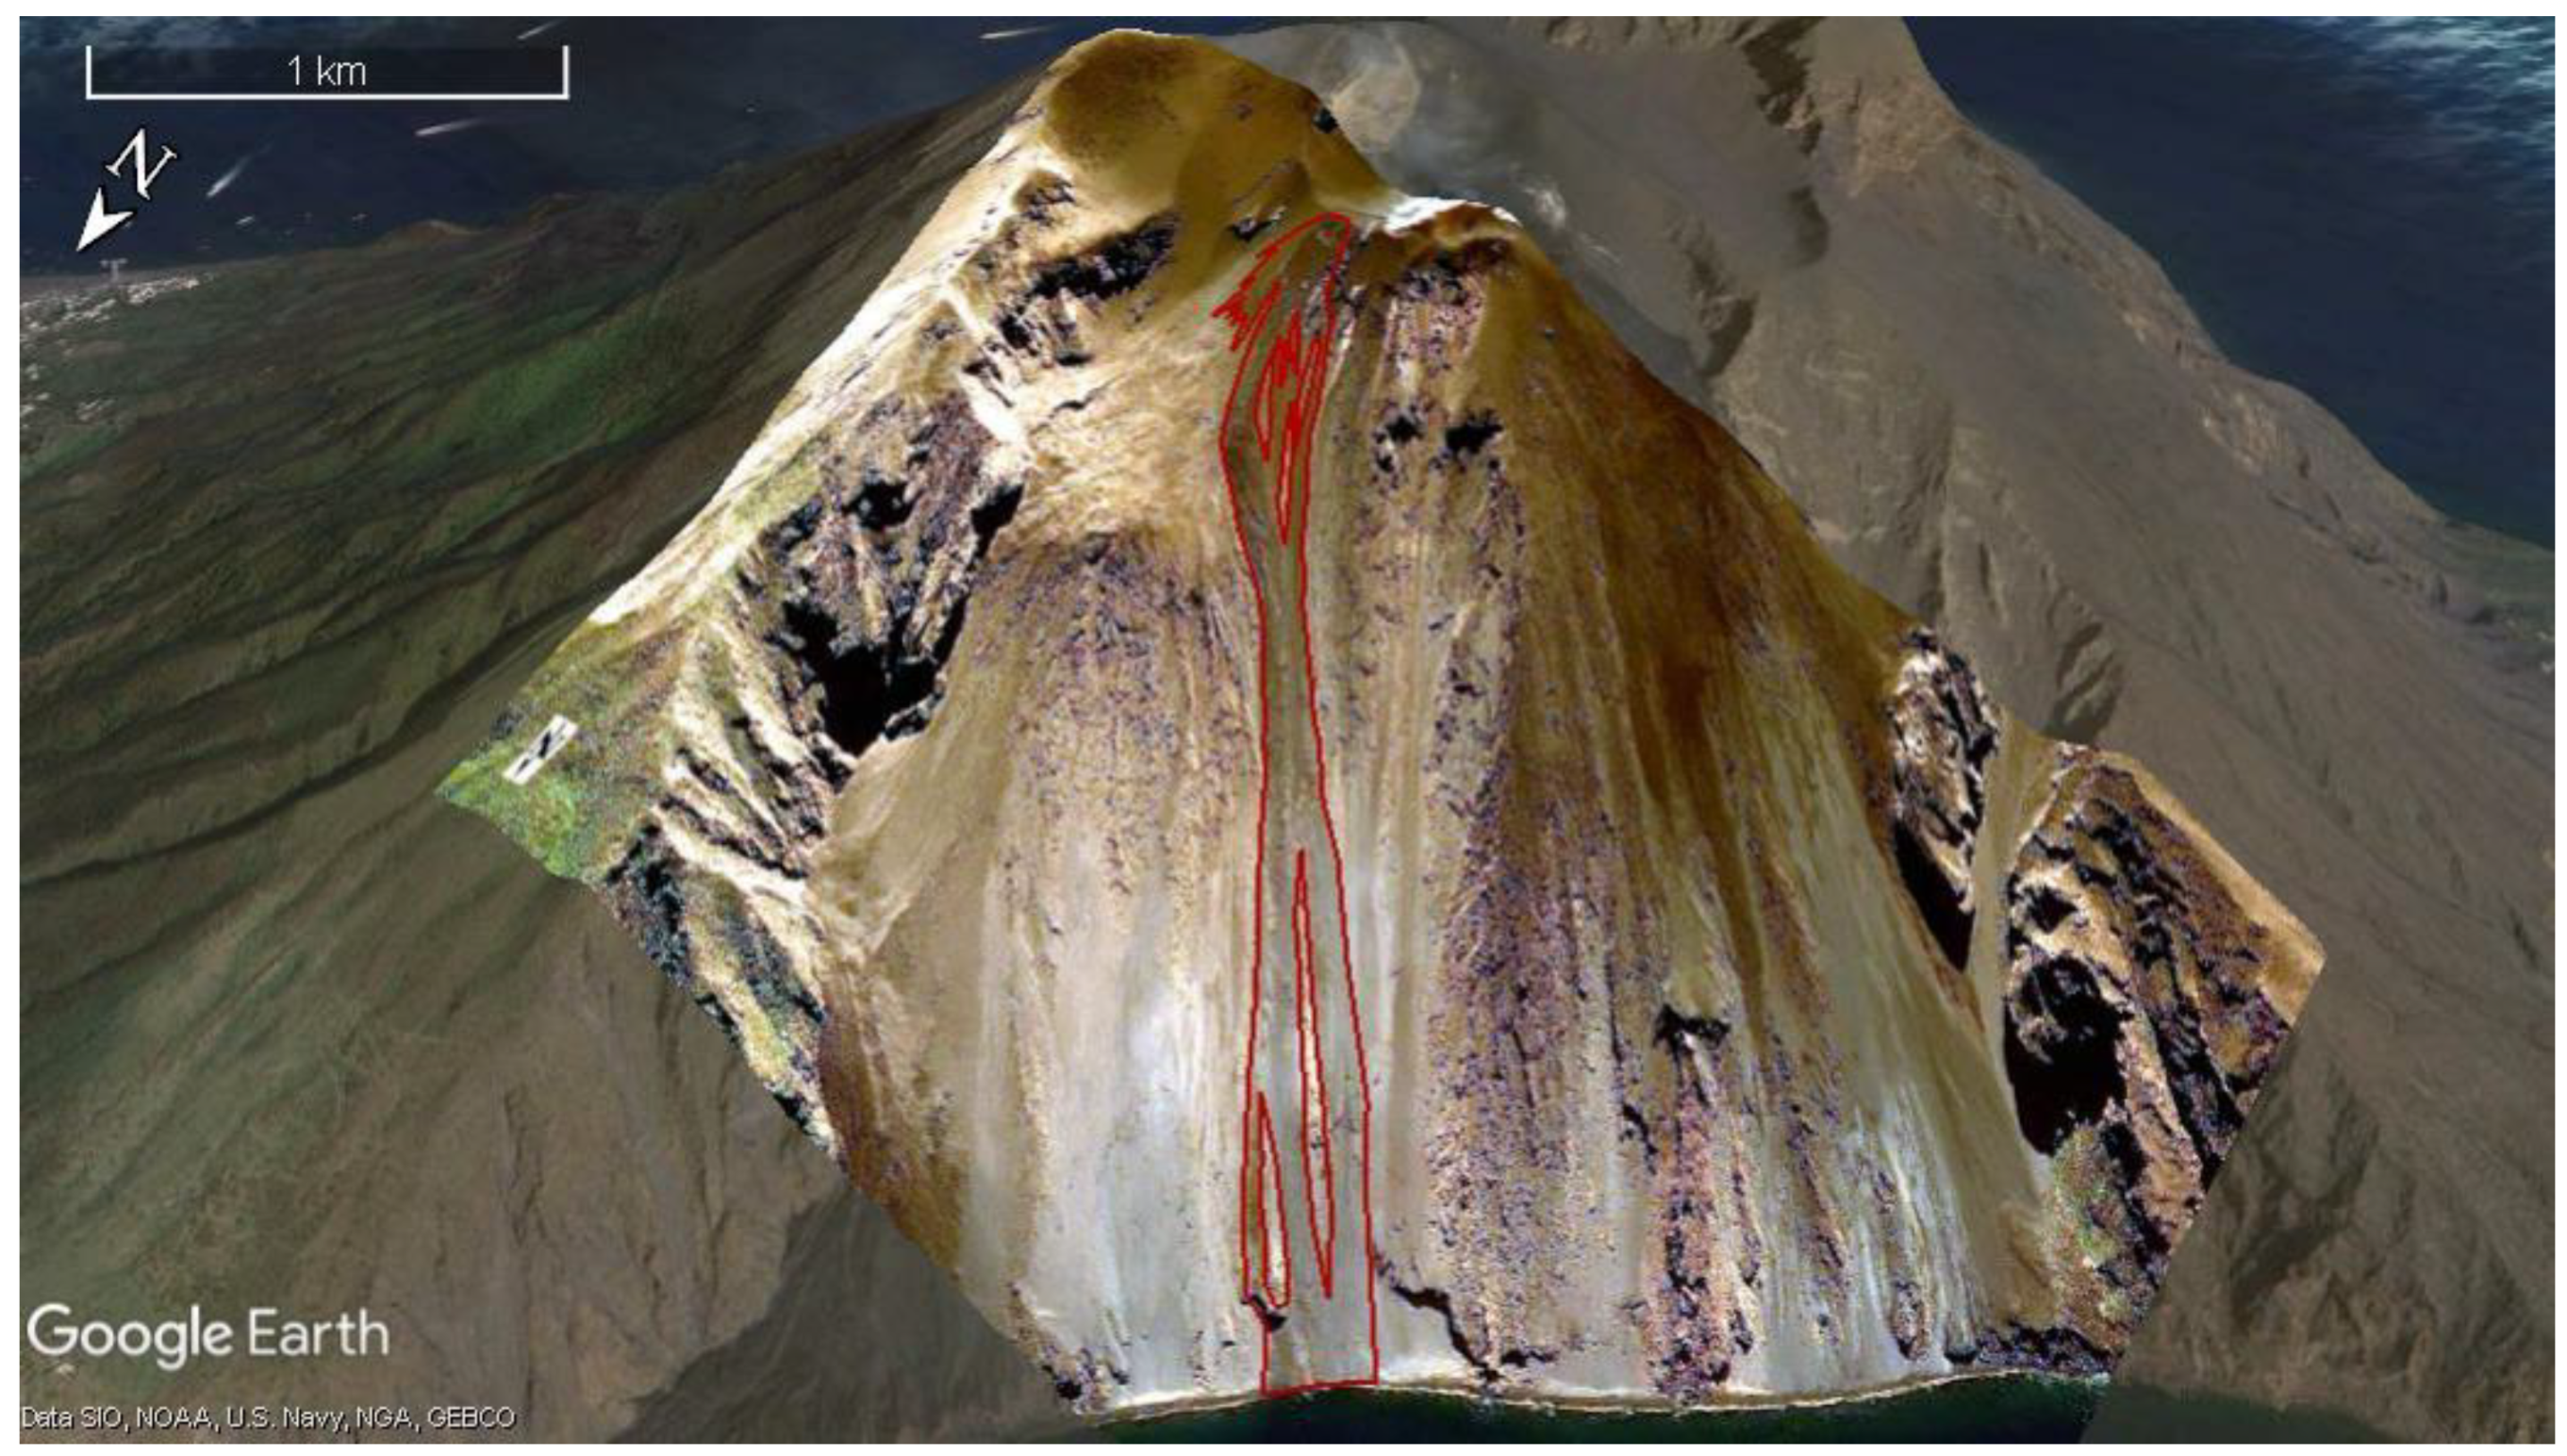
the PDCs linked to the initial phase originated from the NEC area (total eroded volume ~7.3 × 10³ m3), whereas, as the effusive phase progressed, the subsequent PDCs were generated directly by crumbling of lava flow front along the steep slope of the SdF;
-
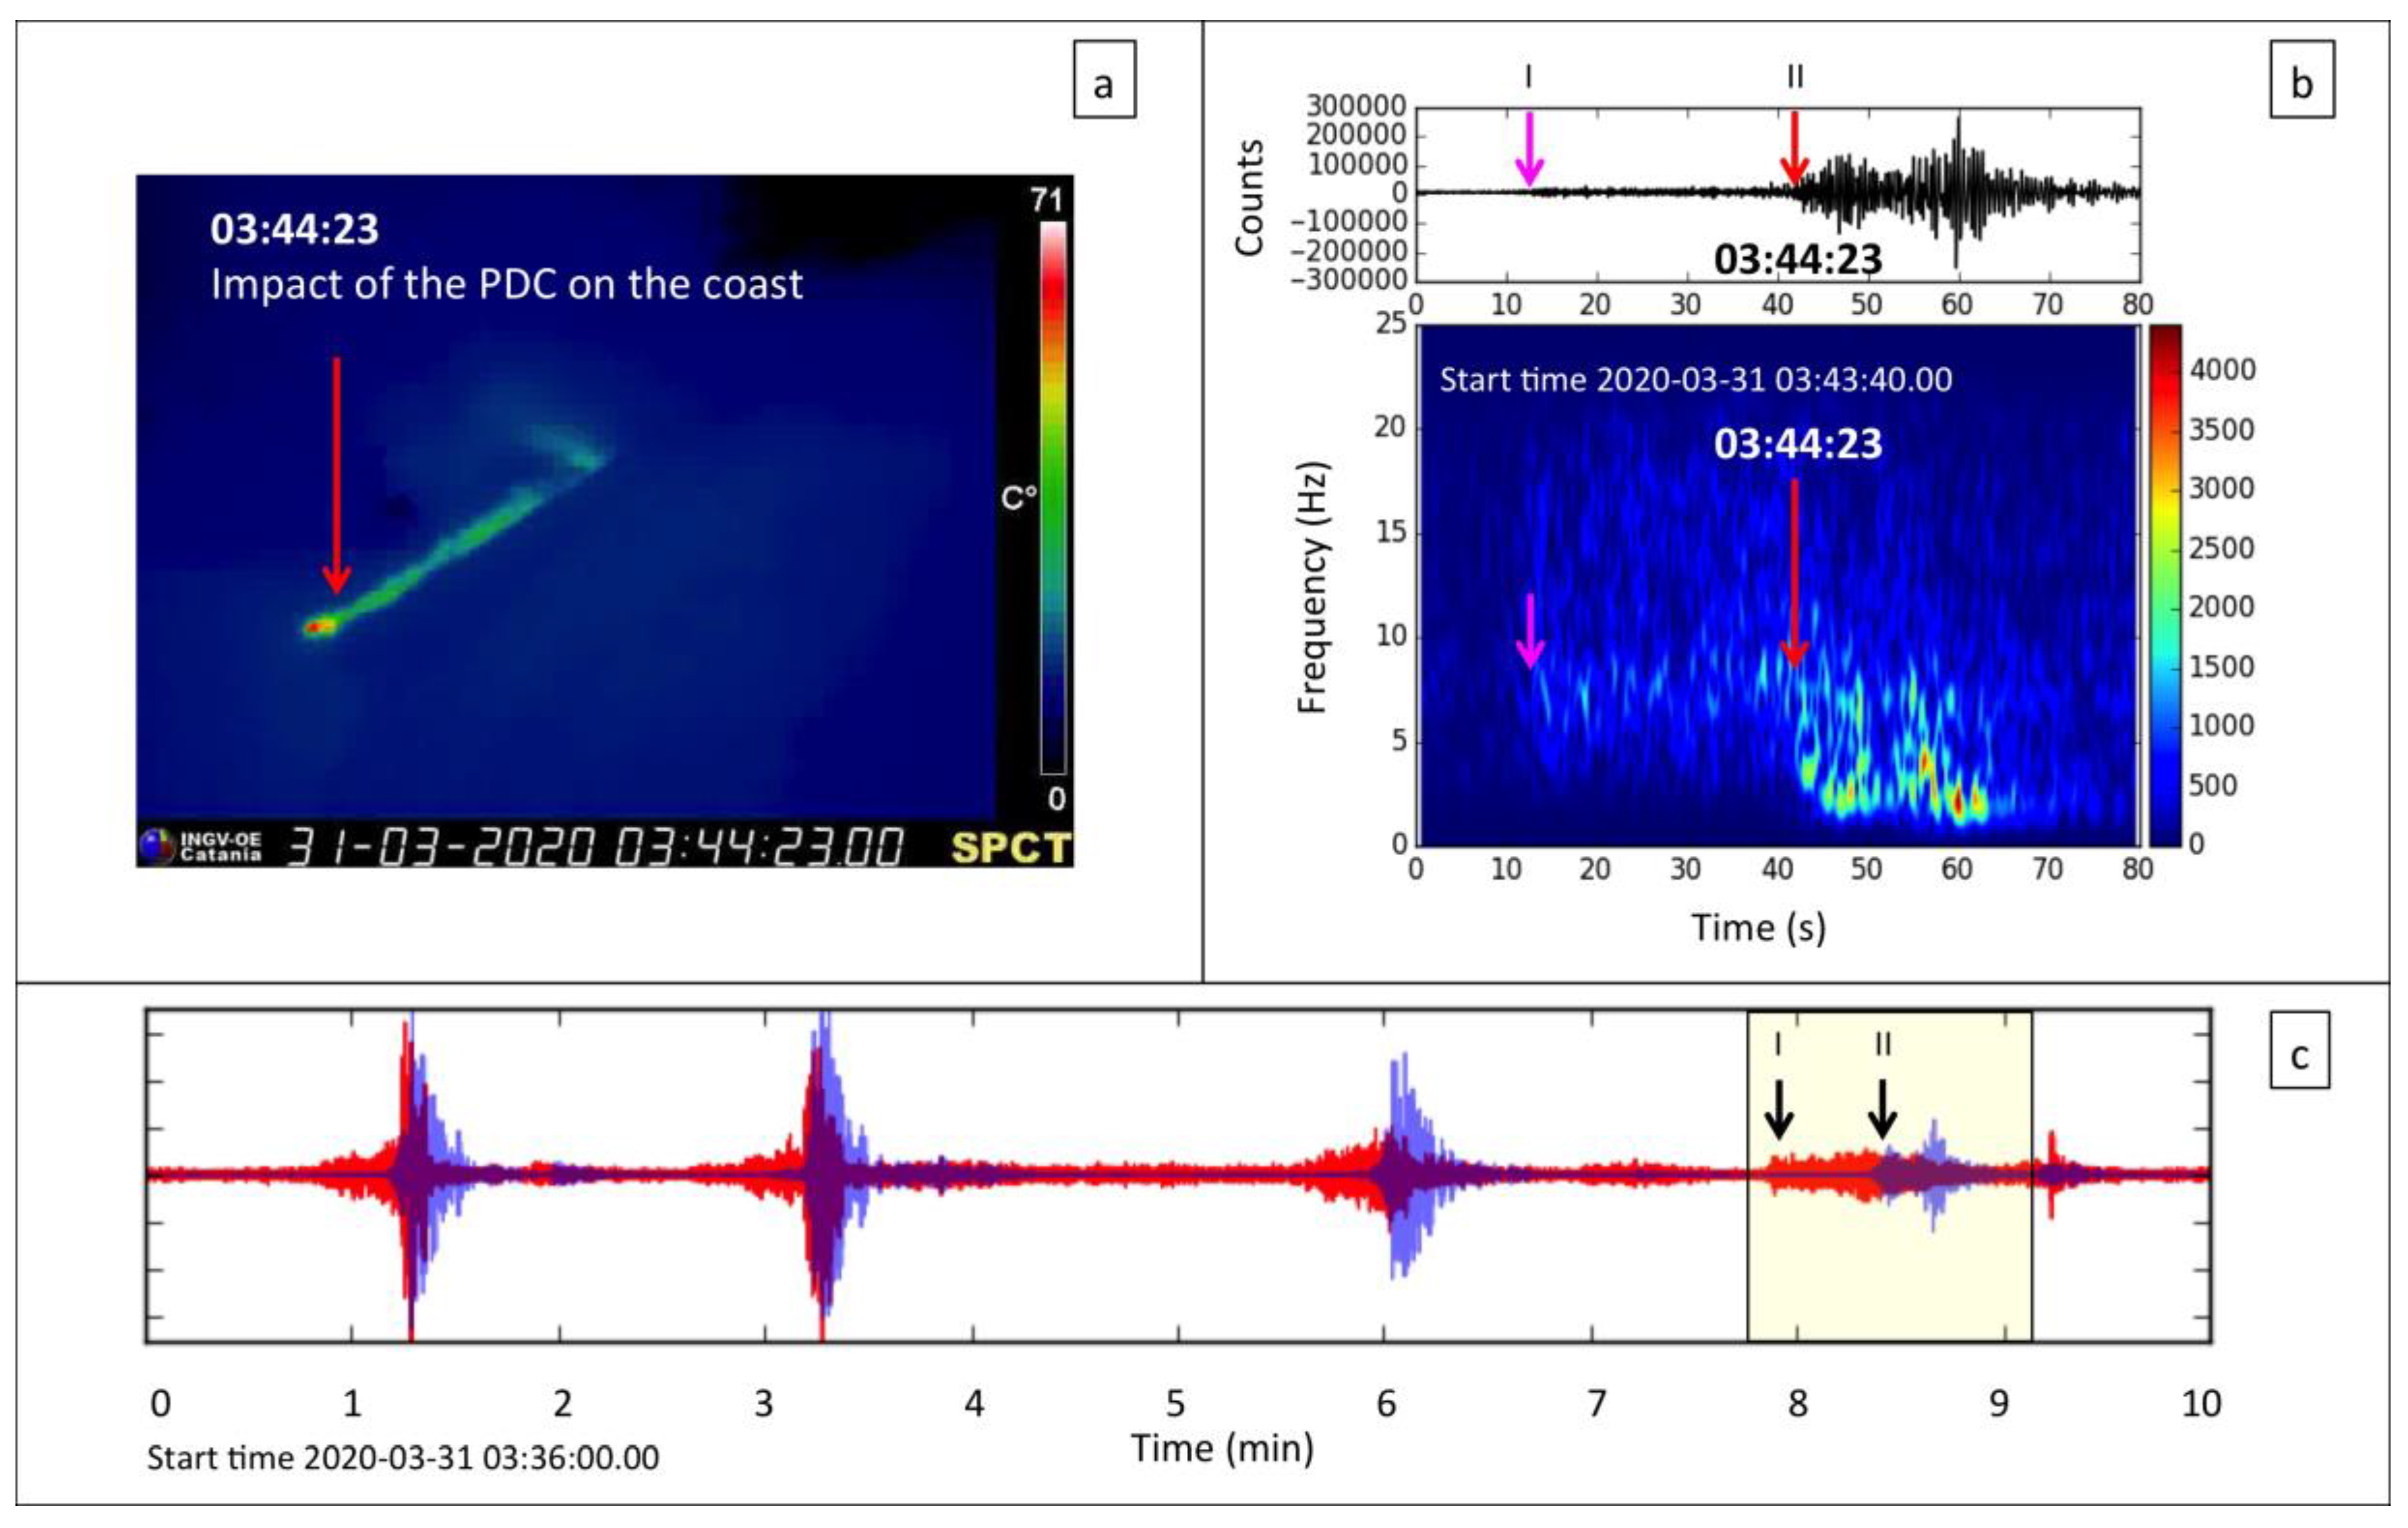
PDCs reached the sea with variable speed (between 12.9 and 40.3 ms−1), partly flowing on the water;
-
the entry into the sea of these mass-flows is associated with a strong variation in seismic signals, with the disappearance of the typical signal associated with the landslides in Stromboli (high frequency; 4–15 Hz) and the appearance of another one characterized by a large amplitude and lower frequency (1–3 Hz);
-
this change in the seismic signal could be due to the PDC entrance in the underwater environment, as well as to the resonance of the Stromboli conduit, which is located in the volcano edifice, at a small depth below the SdF;
-
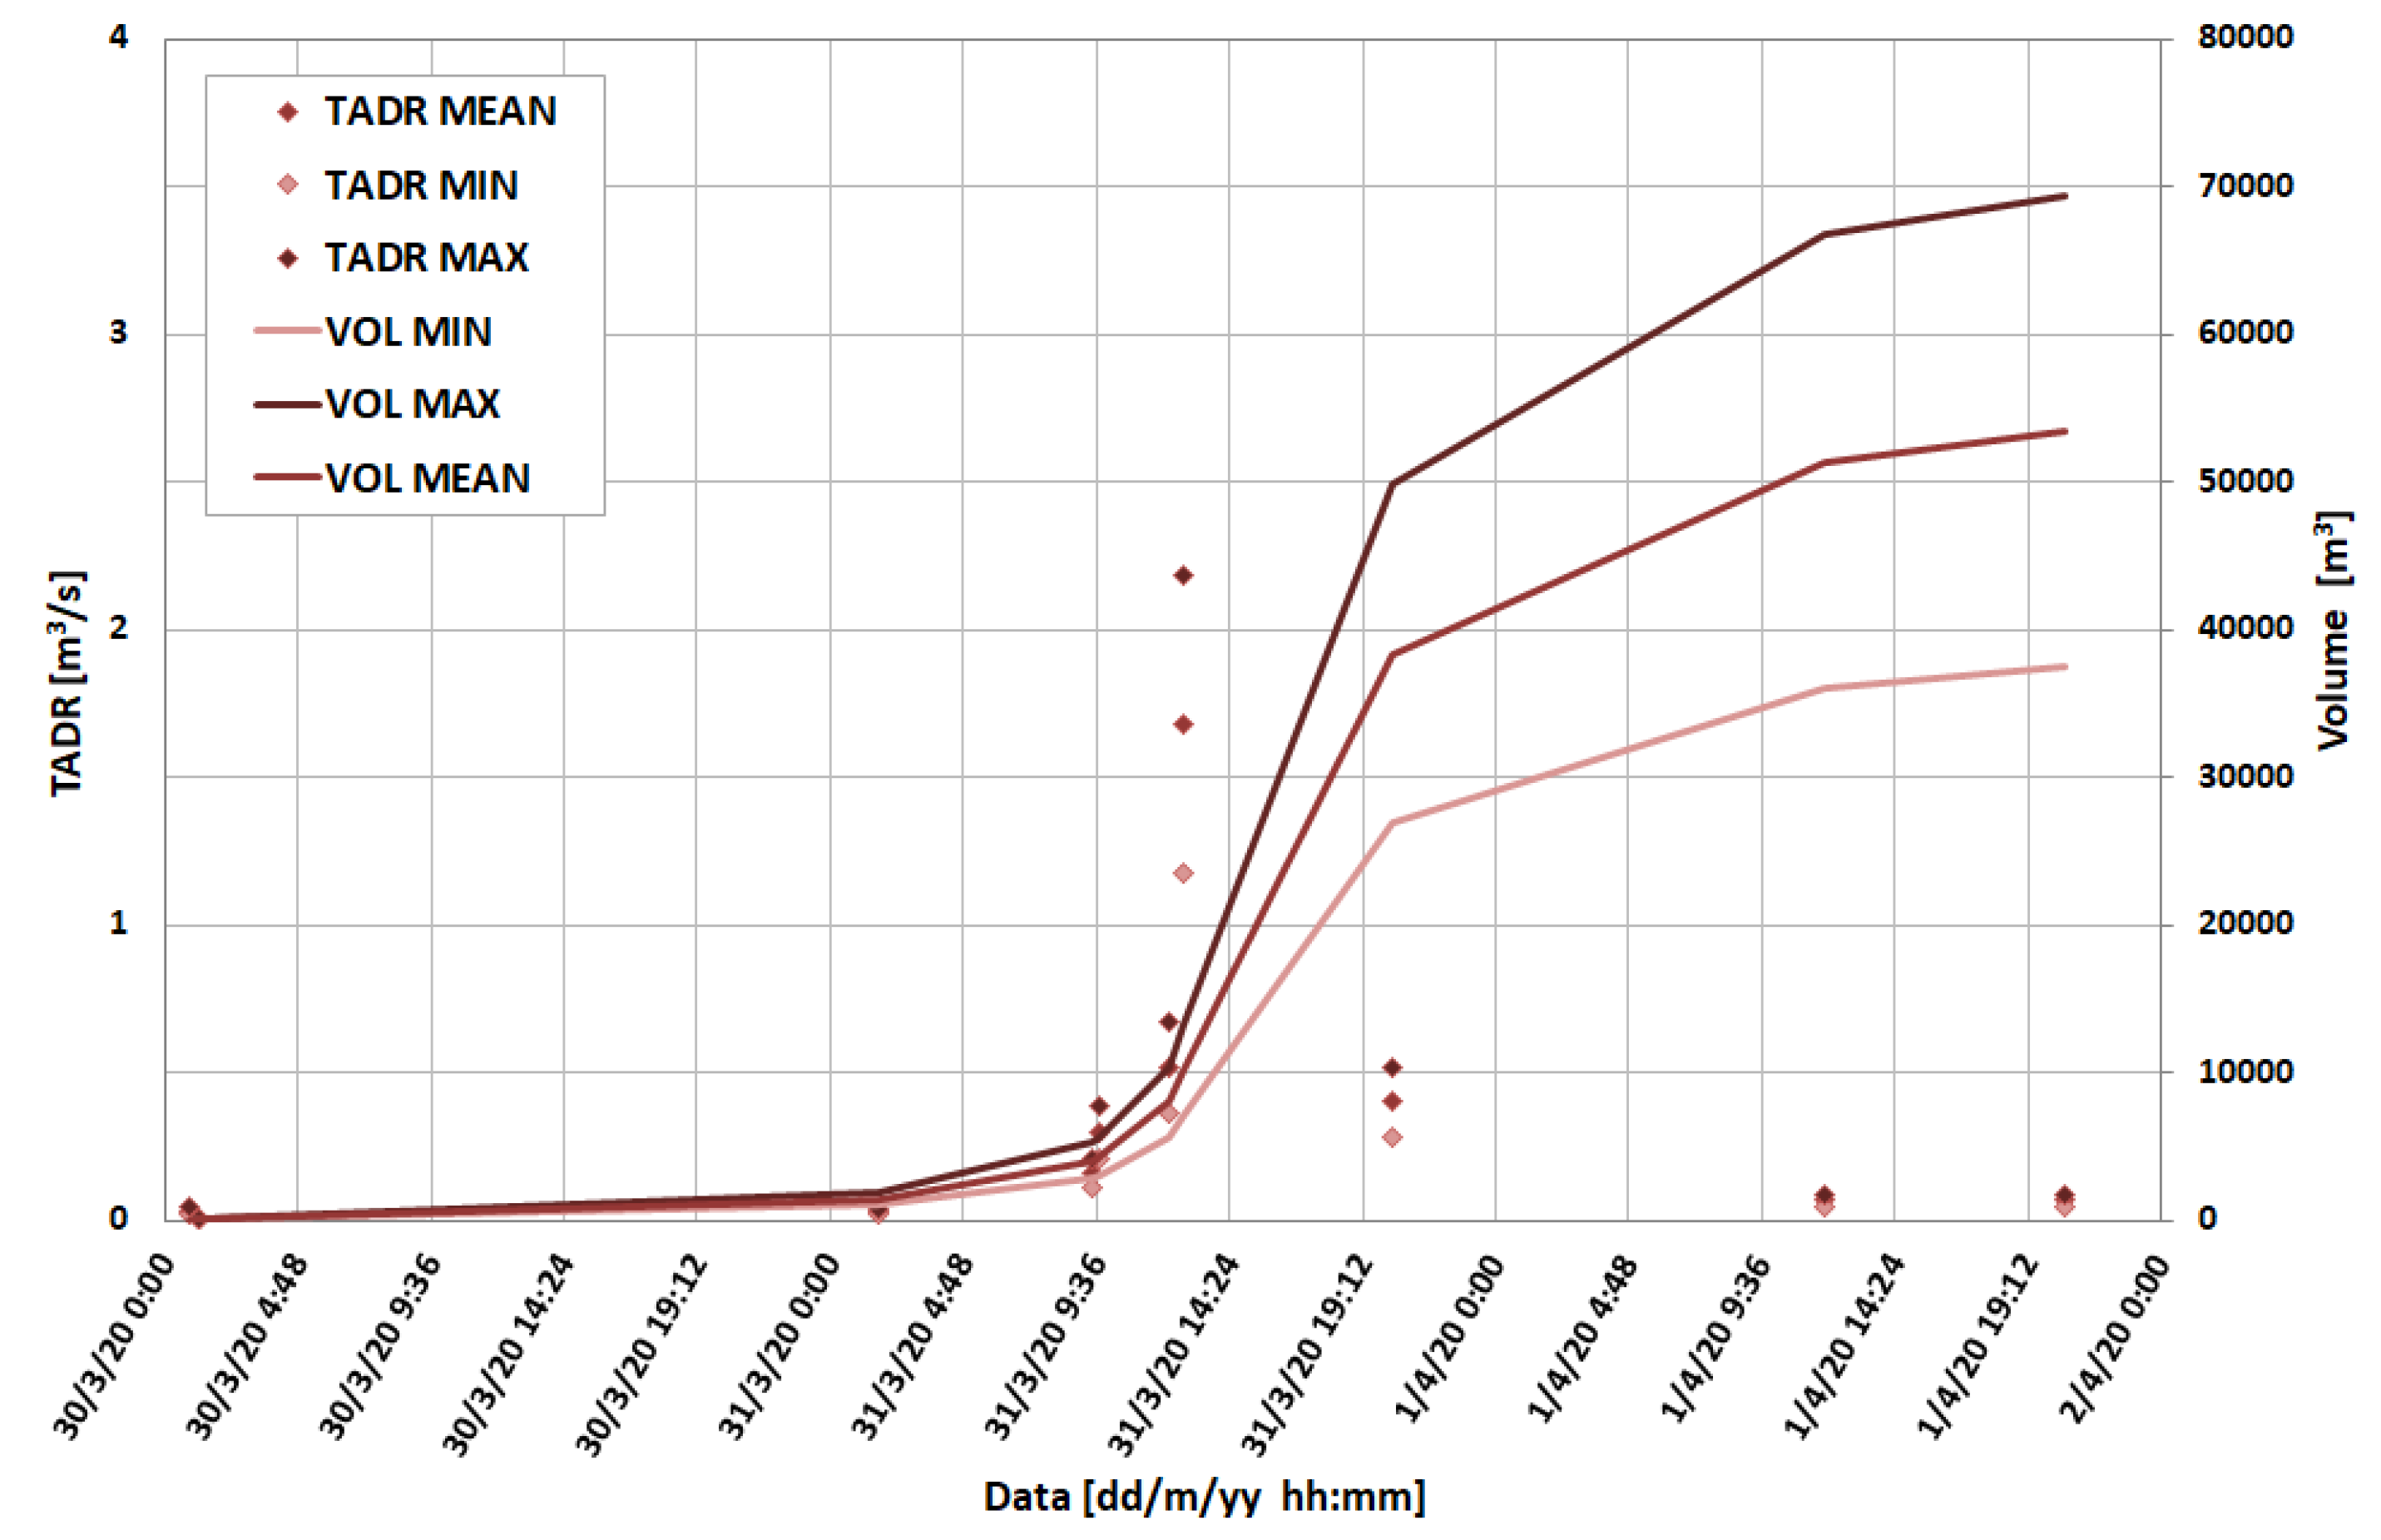
the lava overflows that were emplaced between 28 March and 1 April covered a total area of 94,500 ± 3380 m2;
-
the volume of the deposits accumulated from October 2019 to April 2020 near the NE crater amounts to 34,600 ± 9700 m3, whereas the volume in the overflows area was of 144,400 ± 79,000 m3, for a total amount of 179,000 ± 89,000 m3. Thermal satellite data also allowed for constraining the DRE lava volume between 37 and 69 × 103 m3 emplaced from 30 March to 1 April 2020; integrating this result with those that were obtained from DEM difference, a lava volume of ~80.5 × 10³ m3 could have been emitted during 28 March–1 April.

Author Contributions

Conceptualization, S.C., F.D.T., G.G., F.G. and G.M.; methodology, S.C., F.D.T., G.G., A.C., F.G., G.M., and E.P.; validation, S.C., F.D.T., G.G., F.G. and G.M.; formal analysis, S.C., F.D.T., G.G., F.G., G.M., T.N., E.P., and A.C.; data curation, S.C., F.D.T., G.G., F.G., G.M., E.P., A.C., G.B., C.C. and V.C.; writing—original draft preparation, S.C., F.D.T., G.G., F.G., G.M., A.C., and C.D.N.; writing—review and editing, S.C., F.D.T., G.G., F.G. and G.M.; visualization, S.C., F.D.T., G.G., F.G. and G.M.; supervision, S.C., F.D.T., G.G., F.G. and G.M.; project administration, S.C., T.N., G.G., F.G. and G.M.; funding acquisition, N.C. and C.D.N. All authors have read and agreed to the published version of the manuscript.

Funding

This work has been financially supported by the “Presidenza del Consiglio dei Ministri—Dipartimento della Protezione Civile” (Presidency of the Council of Ministers–Department of Civil Protection) (DPC-UNIFI Agreement 2019–2021; Scientific Responsibility: N.C.); this publication, however, does not necessarily reflect the position and the official policies of the Department. Additional funds for paper publication have been provided by INGV-OE.

Acknowledgments

We would like to acknowledge the essential work of INGV technicians for the installation and maintenance of the monitoring networks on Stromboli. Thanks are due to National Aeronautics and Space Administration (NASA) for MODIS data (modis.gsfc.nasa.gov), to National Oceanic and Atmospheric Administration (NOAA) for VIIRS data (https://www.bou.class.noaa.gov/) and to the Sentinel Hub services (https://scihub.copernicus.eu/) for Copernicus Sentinel data. We would like to acknowledge the constructive suggestions of four reviewers who have significantly improved the quality of the paper. The English text was corrected and significantly improved by Novella Tedesco.

Conflicts of Interest

The authors declare no conflict of interest.

References

  1. Calvari, S.; Pinkerton, H. Birth, growth and morphologic evolution of the “Laghetto” cinder cone during the 2001 Etna eruption. J. Volcanol. Geotherm. Res. 2004, 132, 225–239. [Google Scholar] [CrossRef]
  2. Behncke, B.; Neri, M.; Pecora, E.; Zanon, V. The exceptional activity and growth of the Southeast Crater, Mount Etna (Italy), between 1996 and 2001. Bull. Volcanol. 2006, 69, 149–173. [Google Scholar] [CrossRef]
  3. Del Negro, C.; Cappello, A.; Bilotta, G.; Ganci, G.; Herault, A.; Zago, V. Living at the edge of an active volcano: Risk from lava flows on Mt. Etna. Geol. Soc. Am. Bull. 2019. [Google Scholar] [CrossRef]
  4. Del Negro, C.; Cappello, A.; Ganci, G. Quantifying lava flow hazards in response to effusive eruption. Geol. Soc. Am. Bull. 2016, 128, 752–763. [Google Scholar] [CrossRef]
  5. Harris, A.J.L.; Chevrel, M.O.; Coppola, D.; Ramsey, M.S.; Hrysiewicz, A.; Thivet, S.; Villeneuve, N.; Favalli, M.; Peltier, A.; Kowalski, P.; et al. Validation of an integrated satellite-data-driven response to an effusive crisis: The April-May 2018 eruption of Piton de la Fournaise. Ann. Geophys. 2019, 62, VO230. [Google Scholar] [CrossRef]
  6. Neal, C.A.; Brantley, S.R.; Antolik, L.; Babb, J.L.; Burgess, M.; Calles, K.; Cappos, M.; Chang, J.C.; Conway, S.; Desmither, L.; et al. The 2018 rift eruption and summit collapse of Kīlauea Volcano. Science 2019, 363, 367–374. [Google Scholar] [CrossRef]
  7. Acocella, V. Understanding caldera structure and development: An overview of analogue models compared to natural calderas. Earth-Sci. Rev. 2007, 85, 125–160. [Google Scholar] [CrossRef]
  8. Michon, L.; Villeneuve, N.; Catry, T.; Merle, O. How summit calderas collapse on basaltic volcanoes: New insights from the April 2007 caldera collapse of Piton de la Fournaise volcano. J. Volcanol. Geotherm Res. 2009, 184, 138–151. [Google Scholar] [CrossRef] [Green Version]
  9. Tepp, G.; Hotovec-Ellis, A.; Shiro, B.; Johanson, I.; Thelen, W.; Haney, M.M. Seismic and geodetic progression of the 2018 summit caldera collapse of Kilauea volcano. Earth Plan. Sci. Lett. 2020, 540, 116250. [Google Scholar] [CrossRef]
  10. Calvari, S.; Pinkerton, H. Instabilities in the summit region of Mount Etna during the 1999 eruption. Bull. Volcanol. 2002, 63, 526–535. [Google Scholar] [CrossRef]
  11. Behncke, B.; Neri, M.; Carniel, R. An exceptional case of endogenous lava dome growth spawning pyroclastic avalanches: The 1999 Bocca Nuova eruption of Mt. Etna (Italy). J. Volcanol. Geotherm. Res. 2003, 124, 115–128. [Google Scholar] [CrossRef]
  12. Behncke, B.; Calvari, S.; Giammanco, S.; Neri, M.; Pinkerton, H. Pyroclastic density currents resulting from the interaction of basaltic magma with hydrothermally altered rock: An example from the 2006 summit eruptions of Mount Etna, Italy. Bull. Volcanol. 2008, 70, 1249–1268. [Google Scholar] [CrossRef]
  13. Cole, P.D.; Fernandez, E.; Duarte, E.; Duncan, A.M. Explosive activity and generation mechanisms of pyroclastic flows at Arenal volcano, Costa Rica between 1987 and 2001. Bull. Volcanol. 2005, 67, 695–716. [Google Scholar] [CrossRef]
  14. Calvari, S.; Intrieri, E.; Di Traglia, F.; Bonaccorso, A.; Casagli, N.; Cristaldi, A. Monitoring crater-wall collapse at active volcanoes: A study of the 12 January 2013 event at Stromboli. Bull. Volcanol. 2016, 78, 1–16. [Google Scholar] [CrossRef]
  15. Christiansen, R.L.; Peterson, D.W. The 1980 Eruptions of Mount St. Helens, Washington. Chronology of the 1980 Eruptive Activity; US Geological Survey: Reston, VA, USA, 1981; Volume 1250, pp. 17–30.
  16. Bonaccorso, A.; Calvari, S.; Garfì, G.; Lodato, L.; Patané, D. December 2002 flank failure and tsunami at Stromboli volcano inferred by volcanological and geophysical observations. Geophys. Res. Lett. 2003, 30, 1941–1944. [Google Scholar] [CrossRef]
  17. Tinti, S.; Manucci, A.; Pagnoni, G.; Armigliato, A.; Zaniboni, F. The 30 December 2002 landslide-induced tsunamis in Stromboli: Sequence of the events reconstructed from the eyewitness accounts. Nat. Hazards Earth Syst. Sci. 2005, 5, 763–775. [Google Scholar] [CrossRef]
  18. Walter, T.R.; Haghshenas Haghighi, M.; Schneider, F.M. Complex hazard cascade culminating in the Anak Krakatau sector collapse. Nat. Commun. 2019, 10, 4339. [Google Scholar] [CrossRef]
  19. Calvari, S.; Spampinato, L.; Lodato, L.; Harris, A.J.L.; Patrick, M.R.; Dehn, J.; Burton, M.R.; Andronico, D. Chronology and complex volcanic processes during the 2002-2003 flank eruption at Stromboli volcano (Italy) reconstructed from direct observations and surveys with a handheld thermal camera. J. Geophys. Res.-Solid Earth 2005, 110, B02201. [Google Scholar] [CrossRef] [Green Version]
  20. Neri, M.; Lanzafame, G. Structural features of the 2007 Stromboli eruption. J. Volcanol. Geotherm. Res. 2009, 182, 137–144. [Google Scholar] [CrossRef]
  21. Tioukov, V.; Alexandrov, A.; Bozza, C.; Consiglio, L.; D’Ambrosio, N.; De Lellis, G.; De Sio, C.; Giudicepietro, F.; Macedonio, G.; Miyamoto, S.; et al. First muography of Stromboli volcano. Sci. Rep. 2019, 9, 6695. [Google Scholar] [CrossRef]
  22. Rittmann, A. Der ausbruch des Stromboli am 11 September 1930. Zeitschrift für vulkanologie 1931, 14, 47–77. [Google Scholar]
  23. Di Roberto, A.; Bertagnini, A.; Pompilio, M.; Bisson, M. Pyroclastic density currents at Stromboli volcano (Aeolian Islands, Italy): A case study of the 1930 eruption. Bull. Volcanol. 2014, 76, 827. [Google Scholar] [CrossRef]
  24. Giudicepietro, F.; Lopez, C.; Macedonio, G.; Alparone, S.; Bianco, F.; Calvari, S.; De Cesare, W.; Delle Donne, D.; Di Lieto, B.; Esposito, A.M.; et al. Geophysical precursors of the July-August 2019 paroxysmal eruptive phase and their implications for Stromboli volcano (Italy) monitoring. Sci. Rep. 2020, 11, 1813. [Google Scholar] [CrossRef]
  25. Salvatici, T.; Di Roberto, A.; Di Traglia, F.; Bisson, M.; Morelli, S.; Fidolini, F.; Bertagnini, A.; Pompilio, M.; Hungr, O.; Casagli, N. From hot rocks to glowing avalanches: Numerical modelling of gravity-induced pyroclastic density currents and hazard maps at the Stromboli Volcano (Italy). Geomorphology 2016, 273, 93–106. [Google Scholar] [CrossRef] [Green Version]
  26. Yamamoto, T.; Takarada, S.; Suto, S. Pyroclastic flows from the 1991 eruption of Unzen volcano, Japan. Bull. Volcanol. 1993, 55, 166–175. [Google Scholar] [CrossRef]
  27. Baxter, P.; Jenkins, S.; Seswandhana, R.; Komorowski, J.-C.; Dunn, K.; Purser, D.; Voight, B.; Shelley, I. Human survival in volcanic eruptions: Thermal injuries in pyroclastic surges, their causes, prognosis and emergency management. Burns 2017, 43, 1051–1069. [Google Scholar] [CrossRef]
  28. Auker, M.R.; Sparks, R.S.J.; Siebert, L.; Crosweller, H.S.; Ewert, J. A statistical analysis of the global historical volcanic fatalities record. J. Appl. Volcanol. 2013, 2, 1–24. [Google Scholar] [CrossRef] [Green Version]
  29. Chouet, B.; Hamisevicz, N.; McGetchin, T.R. Photoballistics of volcanic jet activity at Stromboli, Italy. J. Geophys. Res.-Solid Earth 1974, 79, 4961–4976. [Google Scholar] [CrossRef]
  30. Ripepe, M.; Rossi, M.; Saccorotti, G. Image processing of explosive activity at Stromboli. J. Volcanol. Geotherm. Res. 1993, 54, 335–351. [Google Scholar] [CrossRef]
  31. Patrick, M.R.; Harris, A.J.L.; Ripepe, M.; Dehn, J.; Rothery, D.A.; Calvari, S. Strombolian explosive styles and source conditions: Insights from thermal (FLIR) video. Bull. Volcanol. 2007, 69, 769–784. [Google Scholar] [CrossRef]
  32. Calvari, S.; Bonaccorso, A.; Madonia, P.; Neri, M.; Liuzzo, M.; Salerno, G.G.; Behncke, B.; Caltabiano, T.; Cristaldi, A.; Giuffrida, G.; et al. Major eruptive style changes induced by structural modifications of a shallow conduit system: The 2007-2012 Stromboli case. Bull. Volcanol. 2014, 76, 841. [Google Scholar] [CrossRef]
  33. Di Traglia, F.; Calvari, S.; D’Auria, L.; Nolesini, T.; Bonaccorso, A.; Fornaciai, A.; Esposito, A.; Cristaldi, A.; Favalli, M.; Casagli, N. The 2014 effusive eruption at Stromboli: New insights from in-situ and remote sensing measurements. Remote Sens. 2018, 10, 2035. [Google Scholar] [CrossRef] [Green Version]
  34. Plank, S.; Marchese, F.; Filizzola, C.; Pergola, N.; Neri, M.; Nolde, M.; Martinis, S. The July/August 2019 Lava Flows at the Sciara del Fuoco, Stromboli–Analysis from Multi-Sensor Infrared Satellite Imagery. Remote Sens. 2019, 11, 2879. [Google Scholar] [CrossRef] [Green Version]
  35. Di Traglia, F.; Nolesini, T.; Ciampalini, A.; Solari, L.; Frodella, W.; Bellotti, F.; Fumagalli, A.; De Rosa, G.; Casagli, N. Tracking morphological changes and slope instability using spaceborne and ground-based SAR data. Geomorphology 2018, 300, 95–112. [Google Scholar] [CrossRef]
  36. Lodato, L.; Spampinato, L.; Harris, A.J.L.; Calvari, S.; Dehn, J.; Patrick, M. The Morphology and Evolution of the Stromboli 2002-03 Lava Flow Field: An Example of Basaltic Flow Field Emplaced on a Steep Slope. Bull. Volcanol. 2007, 69, 661–679. [Google Scholar] [CrossRef]
  37. Martini, M.; Giudicepietro, F.; D’Auria, L.; Esposito, A.M.; Caputo, T.; Curciotti, R.; De Cesare, W.; Orazi, M.; Scarpato, G.; Caputo, A.; et al. Seismological monitoring of the February 2007 effusive eruption of the Stromboli volcano. Ann. Geophys. 2007, 50, 775–788. [Google Scholar] [CrossRef]
  38. Pioli, L.; Rosi, M.; Calvari, S.; Spampinato, L.; Renzulli, A.; Di Roberto, A. The eruptive activity of 28 and 29 December 2002. In The Stromboli Volcano: An Integrated Study of the 2002–2003 Eruption; Calvari, S., Inguaggiato, S., Puglisi, G., Ripepe, M., Rosi, M., Eds.; American Geophysical Union Monograph Series; John Wiley & Sons: Hoboken, NJ, USA, 2008; Volume 182, pp. 105–116. ISBN 978-0-87590-447-0. [Google Scholar] [CrossRef] [Green Version]
  39. Calvari, S.; Lodato, L.; Steffke, A.; Cristaldi, A.; Harris, A.J.L.; Spampinato, L.; Boschi, E. The 2007 Stromboli flank eruption: Chronology of the events, and effusion rate measurements from thermal images and satellite data. J. Geophys. Res.-Solid Earth 2010, 115, B04201. [Google Scholar] [CrossRef] [Green Version]
  40. Di Traglia, F.; Battaglia, M.; Nolesini, T.; Lagomarsino, D.; Casagli, N. Shifts in the eruptive styles at Stromboli in 2010–2014 revealed by ground-based InSAR data. Sci. Rep. 2015, 5, 13569. [Google Scholar] [CrossRef] [Green Version]
  41. Rizzo, A.L.; Federico, C.; Inguaggiato, S.; Sollami, A.; Tantillo, M.; Vita, F.; Bellomo, S.; Longo, M.; Grassa, F.; Liuzzo, M. The 2014 effusive eruption at Stromboli volcano (Italy): Inferences from soil CO2 flux and 3He/4He ratio in thermal waters. Geophys. Res. Lett. 2015, 42, 2235–2243. [Google Scholar] [CrossRef]
  42. Pistolesi, M.; Delle Donne, D.; Pioli, L.; Rosi, M.; Ripepe, M. The 15 March 2007 explosive crisis at Stromboli volcano, Italy: Assessing physical parameters through a multidisciplinary approach. J. Geophys. Res.-Solid Earth 2011, 116, B12206. [Google Scholar] [CrossRef]
  43. Davies, D.K.; Quearry, M.W.; Bonis, S.B. Glowing avalanches from the 1974 eruption of the volcano Fuego, Guatemala. Geol. Soc. Am. Bull. 1978, 89, 369–384. [Google Scholar] [CrossRef]
  44. Di Traglia, F.; Intrieri, E.; Nolesini, T.; Bardi, F.; Del Ventisette, C.; Ferrigno, F.; Frangioni, S.; Frodella, W.; Gigli, G.; Lotti, A.; et al. The Ground-Based InSAR monitoring system at Stromboli volcano: Linking changes in displacement rate and intensity of persistent volcanic activity. Bull. Volcanol. 2014, 76, 1–18. [Google Scholar] [CrossRef]
  45. Barberi, F.; Rosi, M.; Sodi, A. Volcanic hazard assessment at Stromboli based on review of historical data. Acta Vulcanol. 1993, 3, 173–187. [Google Scholar]
  46. Bertagnini, A.; Landi, P. The Secche di Lazzaro pyroclastics of Stromboli volcano: A phreatomagmatic eruption related to the Sciara del Fuoco sector collapse. Bull. Volcanol. 1996, 58, 239–245. [Google Scholar] [CrossRef]
  47. Giordano, G.; Porreca, M.; Musacchio, P.; Mattei, M. The Holocene Secche di Lazzaro phreatomagmatic succession (Stromboli, Italy): Evidence of pyroclastic density current origin deduced by facies analysis and AMS flow directions. Bull. Volcanol. 2008, 70, 1221–1236. [Google Scholar] [CrossRef]
  48. Lucchi, F.; Francalanci, L.; De Astis, G.; Tranne, C.A.; Braschi, E.; Klaver, M. Geological evidence for recurrent collapse-driven phreatomagmatic pyroclastic density currents in the Holocene activity of Stromboli volcano, Italy. J. Volcanol. Geotherm. Res. 2019, 385, 81–102. [Google Scholar] [CrossRef]
  49. Burton, M.R.; Calvari, S.; Spampinato, L.; Lodato, L.; Pino, N.A.; Marchetti, E.; Murè, F. Volcanic and seismic activity at Stromboli preceding the 2002–2003 eruption. In: Calvari S, Inguaggiato S, Puglisi G, Ripepe M, Rosi M (eds) The Stromboli volcano: An integrated study of the 2002–2003 eruption. AGU Geophys. Monogr. Ser. 2008, 182, 93–104. [Google Scholar] [CrossRef]
  50. Ripepe, M.; Delle Donne, D.; Lacanna, G.; Marchetti, E.; Ulivieri, G. The onset of the 2007 Stromboli effusive eruption recorded by an integrated geophysical network. J. Volcanol. Geotherm. Res. 2009, 182, 131–136. [Google Scholar] [CrossRef]
  51. Massonnet, D.; Feigl, K.L. Radar interferometry and its application to changes in the Earth’s surface. Rev. Geophys. 1998, 36, 441–500. [Google Scholar] [CrossRef] [Green Version]
  52. Ferretti, A.; Prati, C.; Rocca, F. Permanent scatterers in SAR interferometry. IEEE Trans. Geosci. Remote Sens. 2001, 39, 8–20. [Google Scholar] [CrossRef]
  53. Berardino, P.; Fornaro, G.; Lanari, R.; Sansosti, E. A new algorithm for surface deformation monitoring based on small baseline differential SAR interferograms. IEEE Trans. Geosci. Remote Sens. 2002, 40, 2375–2383. [Google Scholar] [CrossRef] [Green Version]
  54. Antonello, G.; Casagli, N.; Farina, P.; Leva, D.; Nico, G.; Sieber, A.J.; Tarchi, D. Ground-based SAR interferometry for monitoring mass movements. Landslides 2004, 1, 21–28. [Google Scholar] [CrossRef]
  55. Di Traglia, F.; Nolesini, T.; Intrieri, E.; Mugnai, F.; Leva, D.; Rosi, M.; Casagli, N. Review of ten years of volcano deformations recorded by the ground-based InSAR monitoring system at Stromboli volcano: A tool to mitigate volcano flank dynamics and intense volcanic activ-ity. Earth-Sci. Rev. 2014, 139, 317–335. [Google Scholar] [CrossRef] [Green Version]
  56. Casagli, N.; Tibaldi, A.; Merri, A.; Del Ventisette, C.; Apuani, T.; Guerri, L.; Fortuny-Guasch, J.; Tarchi, D. Deformation of Stromboli volcano (Italy) during the 2007 eruption revealed by radar interferometry, numerical modelling and structural geological field data. J. Volcanol. Geotherm. Res. 2009, 182, 182–200. [Google Scholar] [CrossRef]
  57. Schaefer, L.N.; Di Traglia, F.; Chaussard, E.; Lu, Z.; Nolesini, T.; Casagli, N. Monitoring volcano slope instability with Synthetic Aperture Radar: A review and new data from Pacaya (Guatemala) and Stromboli (Italy) volcanoes. Earth-Sci. Rev. 2019, 192, 236–257. [Google Scholar] [CrossRef]
  58. Di Traglia, F.; Nolesini, T.; Solari, L.; Ciampalini, A.; Frodella, W.; Steri, D.; Allotta, B.; Rindi, A.; Marini, L.; Monni, N.; et al. Lava delta deformation as a proxy for submarine slope instability. Earth Plan. Sci. Lett. 2018, 488, 46–58. [Google Scholar] [CrossRef]
  59. Ganci, G.; Cappello, A.; Bilotta, G.; Del Negro, C. How the variety of satellite remote sensing data over volcanoes can assist hazard monitoring efforts: The 2011 eruption of Nabro volcano. Remote Sens. Environ. 2020, 236, 111426. [Google Scholar] [CrossRef]
  60. Ganci, G.; Vicari, A.; Bonfiglio, S.; Gallo, G.; Del Negro, C. A texton-based cloud detection algorithm for MSG-SEVIRI multispectral images. Geomat. Nat. Hazards Risk 2011, 2, 279–290. [Google Scholar] [CrossRef]
  61. Ganci, G.; Vicari, A.; Fortuna, L.; Del Negro, C. The HOTSAT volcano monitoring system based on a combined use of SEVIRI and MODIS multispectral data. Ann. Geophys. 2011, 54, 5. [Google Scholar] [CrossRef]
  62. Ganci, G.; Bilotta, G.; Cappello, A.; Hérault, A.; Del Negro, C. HOTSAT: A multiplatform system for the satellite thermal monitoring of volcanic activity. Geol. Soc. Lond. Spec. Publ. 2016, 426, 207–221. [Google Scholar] [CrossRef]
  63. Cappello, A.; Ganci, G.; Calvari, S.; Pérez, N.M.; Hernández, P.A.; Silva, S.V.; Cabral, J.; Del Negro, C. Lava flow hazard modeling during the 2014–2015 Fogo eruption, Cape Verde. J. Geophys. Res.-Solid Earth 2016, 121. [Google Scholar] [CrossRef] [Green Version]
  64. Ganci, G.; Cappello, A.; Bilotta, G.; Hérault, A.; Zago, V.; Del Negro, C. Mapping volcanic deposits of the 2011–2015 Etna eruptive events using satellite remote sensing. Front. Earth Sci. 2018, 6, 83. [Google Scholar] [CrossRef]
  65. Spampinato, L.; Oppenheimer, C.; Cannata, A.; Montalto, P.; Salerno, G.G.; Calvari, S. On the time-scale of thermal cycles associated with open-vent degassing. Bull. Volcanol. 2012, 74, 1281–1292. [Google Scholar] [CrossRef]
  66. Rogic, N.; Cappello, A.; Ganci, G.; Maturilli, A.; Rymer, H.; Blake, S.; Ferrucci, F. Spaceborne EO and a Combination of Inverse and Forward Modelling for Monitoring Lava Flow Advance. Remote Sens. 2019, 11, 3032. [Google Scholar] [CrossRef] [Green Version]
  67. Harris, A.J.L.; Blake, S.; Rothery, D.; Stevens, N. A chronology of the 1991 to 1993 Mount Etna eruption using advanced very high-resolution radiometer data: Implications for real-time thermal volcano monitoring. J. Geophys. Res. 1997, 102, 7985–8003. [Google Scholar] [CrossRef]
  68. Del Negro, C.; Cappello, A.; Neri, M.; Bilotta, G.; Herault, A.; Ganci, G. Lava flow hazards at Mount Etna: Constraints imposed by eruptive history and numerical simulations. Sci. Rep. 2013, 3, 3493. [Google Scholar] [CrossRef] [Green Version]
  69. Cappello, A.; Ganci, G.; Bilotta, G.; Hérault, A.; Zago, V.; Del Negro, C. Satellite-driven modeling approach for monitoring lava flow hazards during the 2017 Etna eruption. Ann. Geophys. 2019, 61. [Google Scholar] [CrossRef]
  70. Calvari, S.; Cannavò, F.; Bonaccorso, A.; Spampinato, L.; Pellegrino, A.G. Paroxysmal Explosions, Lava Fountains and Ash Plumes at Etna Volcano: Eruptive Processes and Hazard Implications. Front. Earth Sci. 2018, 6, 107. [Google Scholar] [CrossRef]
  71. Corradino, C.; Ganci, G.; Cappello, A.; Bilotta, G.; Hérault, A.; Del Negro, C. Mapping Recent Lava Flows at Mount Etna Using Multispectral Sentinel2 Images and Machine Learning Techniques. Remote Sens. 2019, 11, 1916. [Google Scholar] [CrossRef] [Green Version]
  72. Ganci, G.; Cappello, A.; Zago, V.; Bilotta, G.; Hérault, A.; Del Negro, C. 3D Lava flow mapping of the 17–25 May 2016 Etna eruption using tristereo optical satellite data. Ann. Geophys. 2019, 62, VO220. [Google Scholar] [CrossRef]
  73. Ganci, G.; Cappello, A.; Bilotta, G.; Corradino, C.; Del Negro, C. Satellite-Based Reconstruction of the Volcanic Deposits during the December 2015 Etna Eruption. Data 2019, 4, 120. [Google Scholar] [CrossRef] [Green Version]
  74. Di Traglia, F.; Fornaciai, A.; Favalli, M.; Nolesini, T.; Casagli, N. Catching Geomorphological Response to Volcanic Activity on Steep Slope Volcanoes Using Multi-Platform Remote Sensing. Remote Sens. 2020, 12, 438. [Google Scholar] [CrossRef] [Green Version]
  75. Nuth, C.; Kääb, A. Co-registration and bias corrections of satellite elevation data sets for quantifying glacier thickness change. Cryosphere 2011, 5, 271–290. [Google Scholar] [CrossRef] [Green Version]
  76. De Cesare, W.; Orazi, M.; Peluso, R.; Scarpato, G.; Caputo, A.; D’Auria, L.; Giudicepietro, F.; Martini, M.; Buonocunto, C.; Capello, M.; et al. The broadband seismic network of Stromboli volcano, Italy. Seism. Res. Lett. 2009, 80, 435–439. [Google Scholar] [CrossRef]
  77. Chouet, B.; Dawson, P.; Ohminato, T.; Martini, M.; Saccorotti, G.; Giudicepietro, F.; De Luca, G.; Milana, G.; Scarpa, R. Source mechanisms of explosions at Stromboli volcano, Italy, determined from moment-tensor inversions of very- long-period data. J. Geophys. Res.-Solid Earth 2003, 108, 2019. [Google Scholar] [CrossRef]
  78. D’Auria, L.; Giudicepietro, F.; Martini, M.; Peluso, R. Seismological insight into the kinematics of the 5 April 2003 vulcanian explosion at Stromboli volcano (southern Italy). Geophys. Res. Lett. 2006, 33, 8. [Google Scholar] [CrossRef]
  79. Esposito, A.M.; Giudicepietro, F.; D’Auria, L.; Scarpetta, S.; Martini, M.G.; Coltelli, M.; Marinaro, M. Unsupervised neural analysis of very-long-period events at Stromboli volcano using the self-organizing maps. Bull. Seism. Soc. Am. 2008, 98, 2449–2459. [Google Scholar] [CrossRef]
  80. Giudicepietro, F.; D’Auria, L.; Martini, M.; Caputo, T.; Peluso, R.; De Cesare, W.; Scarpato, G. Changes in the VLP seismic source during the 2007 Stromboli eruption. J. Volcanol. Geotherm. Res. 2009, 182, 162–171. [Google Scholar] [CrossRef]
  81. Calvari, S.; Büttner, R.; Cristaldi, A.; Dellino, P.; Giudicepietro, F.; Orazi, M.; Peluso, R.; Spampinato, L.; Zimanowski, B.; Boschi, E. The 7 September 2008 Vulcanian explosion at Stromboli volcano: Multi-parametric characterisation of the event and quantification of the ejecta. J. Geophys. Res.-Solid Earth 2012, 117, B05201. [Google Scholar] [CrossRef]
  82. Chouet, B.; Saccorotti, G.; Martini, M.; Dawson, P.; De Luca, G.; Milana, G.; Scarpa, R. Source and path effects in the wavefields of tremor and explosions at Stromboli Volcano, Italy. J. Geophys. Res. 1997, 102, 15129–15150. [Google Scholar] [CrossRef]
  83. Esposito, A.M.; Giudicepietro, F.; Scarpetta, S.; D’Auria, L.; Marinaro, M.; Martini, M. Automatic discrimination among landslide, explosion-quake, and microtremor seismic signals at Stromboli volcano using neural networks. Bull. Seismol. Soc. Am. 2006, 96, 1230–1240. [Google Scholar] [CrossRef]
  84. Esposito, A.M.; D’Auria, L.; Giudicepietro, F.; Peluso, R.; Martini, M. Automatic recognition of landslides based on neural network analysis of seismic signals: An application to the monitoring of Stromboli volcano (Southern Italy). Pure Appl. Geophys. 2013, 170, 1821–1832. [Google Scholar] [CrossRef]
  85. Taddeucci, J.; Valentine, G.A.; Sonder, I.; White, J.D.L.; Ross, P.-S.; Scarlato, P. The effect of pre-existing craters on the initial development of explosive volcanic eruptions: An experimental investigation. Geophys. Res. Lett. 2013, 40, 507–510. [Google Scholar] [CrossRef]
  86. Endo, E.T.; Murray, T. Real-time seismic amplitude measurement (RSAM): A volcano monitoring and prediction tool. Bull. Volcanol. 1991, 53, 533–545. [Google Scholar] [CrossRef]
  87. Harris, A.J.L.; Dehn, J.; Calvari, S. Lava effusion rate definition and measurement: A review. Bull. Volcanol. 2007, 70, 1–22. [Google Scholar] [CrossRef]
  88. Ganci, G.; Bilotta, G.; Calvari, S.; Cappello, A.; Corradino, C.; Del Negro, C. Integrating tri-stereo Pleiades images with infrared satellite data to monitor volcanoes: The 2019 Stromboli eruption. EGU Gen. Assem. 2019, 16172. [Google Scholar] [CrossRef]
  89. Okal, E.A. The generation of T waves by earthquakes. Adv. Geophys. 2008, 49, 1–65. [Google Scholar]
  90. Ripepe, M.; Marchetti, E.; Ulivieri, G.; Harris, A.; Dehn, J.; Burton, M.; Caltabiano, T.; Salerno, G. Effusive to explosive transition during the 2003 eruption of Stromboli volcano. Geol. Soc. Am. 2005, 33, 341–344. [Google Scholar] [CrossRef]
  91. Marotta, E.; Calvari, S.; Cristaldi, A.; D’Auria, L.; Di Vito, M.A.; Moretti, R.; Peluso, R.; Spampinato, L.; Boschi, E. Reactivation of Stromboli’s summit craters at the end of the 2007 effusive eruption detected by thermal surveys and seismicity. J. Geophys. Res. 2015, 120, 7376–7395. [Google Scholar] [CrossRef]
  92. Lipman, P.W.; Banks, N.G. Aa Flow dynamics, Mauna Loa 1984. US Geol. Surv. Prof. Pap. 1987, 1350, 1527–1567. [Google Scholar]
  93. Calder, E.S.; Luckett, R.; Sparks, R.S.J.; Voight, B. Mechanisms of lava dome instability and generation of rockfalls and pyroclastic flows at Soufrière Hills Volcano, Montserrat. Geol. Soc. Mem. Lond. 2002, 21, 173–190. [Google Scholar] [CrossRef]
  94. Loughlin, S.C.; Calder, E.S.; Clarke, A.; Cole, P.D.; Luckett, R.; Mangan, M.T.; Pyle, D.M.; Sparks, R.S.J.; Voight, B.; Watts, R.B. Pyroclastic flows and surges generated by the 25 June 1997 dome collapse, Soufrière Hills Volcano, Montserrat. Geol. Soc. Mem. Lond. 2002, 21, 191–209. [Google Scholar] [CrossRef]
  95. Yamamoto, T.; Nakamura, Y.; Glicken, H. Pyroclastic density current from the 1888 phreatic eruption of Bandai volcano, NE Japan. J. Volcanol. Geotherm. Res. 1999, 90, 191–207. [Google Scholar] [CrossRef]
  96. Pino, N.A.; Ripepe, M.; Cimini, G.B. The Stromboli volcano landslides of December 2002: A seismological description. Geophys. Res. Lett. 2004, 31, L02605. [Google Scholar] [CrossRef]
  97. Calvari, S.; Spampinato, L.; Lodato, L. The 5 April 2003 vulcanian paroxysmal explosion at Stromboli volcano (Italy) from field observations and thermal data. Jour. Volc. Geotherm. Res. 2006, 149, 160–175. [Google Scholar] [CrossRef]
  98. Bonaccorso, A.; Calvari, S.; Linde, A.; Sacks, S.; Boschi, E. Dynamics of the shallow plumbing system investigated from borehole strainmeters and cameras during the 15 March 2007 Vulcanian paroxysm at Stromboli volcano. Earth Plan. Sci. Lett. 2012, 357–358, 249–256. [Google Scholar] [CrossRef]
  99. Calvari, S. Understanding basaltic lava flow morphologies and structures for hazard assessment. Ann. Geophys. 2019, 62, VO217. [Google Scholar] [CrossRef] [Green Version]
  100. Giordano, D.; Russell, J.K. Towards a structural model for the viscosity of geological melts. Earth Plan. Sci. Lett. 2018, 501, 202–212. [Google Scholar] [CrossRef]
  101. Tazieff, H. An Exceptional Eruption: Mt. Niragongo, Jan. 10th, 1977. Bull. Volc. 1977, 40, 189–200. [Google Scholar] [CrossRef]
  102. Komorowski, J.C. The January 2002 flank eruption of Nyiragongo volcano (Democratic Republic of Congo): Chronology, evidence for a tectonic rift trigger, and impact of lava flows on the city of Goma. Acta Vulc. 2003, 15, 27–62. [Google Scholar]
  103. Borgia, A.; Linneman, S.; Spencer, D.; Morales, L.; Andre, L. Dynamics of the flow fronts, Arenal Volcano, Costa Rica. J. Volcanol. Geotherm. Res. 1993, 19, 303–329. [Google Scholar] [CrossRef]
  104. Cigolini, C.; Borgia, A.; Casertano, L. Intra-crater activity, aa-block lava, viscosity and flow dynamics: Arenal Volcano, Costa Rica. J. Volcanol. Geotherm. Res. 1984, 20, 155–176. [Google Scholar] [CrossRef]
  105. Kilburn, C.R.J.; Guest, J.E. Aa lavas of Mount Etna, Sicily. In Active Lavas: Monitoring and Modelling; Kilburn, C.R.J., Luongo, G., Eds.; UCL Press: London, UK, 1993; pp. 73–106. [Google Scholar]
  106. Apuani, T.; Corazzato, C.; Cancelli, A.; Tibaldi, A. Stability of a collapsing volcano (Stromboli, Italy): Limit equilibrium analysis and numerical modelling. J. Volcanol. Geotherm. Res. 2005, 144, 191–210. [Google Scholar] [CrossRef]
  107. Perttu, A.; Caudron, C.; Assink, J.D.; Metz, D.; Tailpied, D.; Perttu, B.; Hibert, C.; Nurfiani, D.; Pilger, C.; Muzli, M.; et al. Reconstruction of the 2018 tsunamigenic flank collapse and eruptive activity at Anak Krakatau based on eyewitness reports, seismo-acoustic and satellite observations. Earth Plan. Sci. Lett. 2020, 541, 116268. [Google Scholar] [CrossRef]
  108. Darmawan, H.; Yuliantoro, P.; Rakhman, A.; Santoso, A.B.; Humaida, H.; Suryanto, W. Dynamic velocity and seismic characteristics of gravitational rockfalls at the Merapi lava dome. J. Volcanol. Geotherm. Res. 2020, 404, 107010. [Google Scholar] [CrossRef]
  109. Uhira, K.; Yamasato, H.; Takeo, M. Source mechanism of seismic waves excited by pyroclastic flows observed at Unzen volcano, Japan. J. Geophys. Res. Solid Earth 1994, 99, 17757–17773. [Google Scholar] [CrossRef]
  110. Wassermann, J. Volcano Seismology. In IASPEI New Manual of Seismological Observatory Practice; Bormann, P., Ed.; GFZ Potsdam: Potsdam, Germany, 2002; Volume 1, p. 42. [Google Scholar]
  111. Fornaciai, A.; Landi, P.; Armienti, P. Dissolution/crystallization kinetics recorded in the 2002–2003 lavas of Stromboli (Italy). Bull. Volcanol. 2009, 71, 631–641. [Google Scholar] [CrossRef]
Figure 1. (a) Google map of southern Italy, with the red circle showing the position of Stromboli volcano, at the NE end of the Aeolian Archipelago. (b) Stromboli island with the position and labels of the monitoring instruments used in this study. The blue triangles are the monitoring cameras; the red circles are the Ground-Based Interferometric Synthetic Aperture Radar (GBInSAR) stations; the yellow squares are the seismic stations. The empty red circle outlines the position of the summit craters displayed in c. SdF = Sciara del Fuoco slope. (c) View from South of Stromboli summit craters, taken on 21 February 2020, showing the names of the active crater areas. NEC = NE Crater zone; CC = Central Crater zone; SWC = SW Crater zone. The field of view is about 300 m wide. Photo courtesy of F. Ciancitto, INGV.
Remotesensing 12 03010 g001
Figure 2. Examples of seismograms and spectrograms of seismic signals recorded at Stromboli in the studied period. Recording start times are reported at the bottom of each plot. The duration of the plots is one minute. (a) seismic signal and spectrogram produced by strombolian explosion; (b) seismic signal and spectrogram produced by volcanic tremor; (c) seismicity and spectrogram resulting from loose landslides; (d) seismic signal and spectrogram generated by blocks rolling down the Sciara del Fuoco slope; (e) seismic signal and spectrogram caused by pyroclastic density currents; (f) seismic trace and spectrogram recorded during the emplacement of lava flows.
Remotesensing 12 03010 g002
Figure 3. Comparative graphs of monitoring data collected between 28 March and 1 April 2020, with the two red rectangles displaying the duration of the two overflows from the NE crater rim occurred on 28 and 30–31 March. (a) Number of explosions per h detected from the thermal monitoring cameras SCT (red line) and SPCT (blue line) between 28 March and 1 April 2020. The parts with no data are caused by poor weather conditions with clouds obscuring the summit area; (b) Real Time Seismic Amplitude Monitoring (RSAM) of the STRE station (Figure 1) seismic signal (East–West component) filtered at a frequency > 10 Hz, calculated on 15-s windows); (c) GBInSAR NE190 cumulative displacement (positive values refer to the increasing distance between the sensor and the target area, representing the deflation of the summit area; (d) Standardized NEC area measured using GBInSAR NE400 power images (one image every four h; xn  =  xu μ/σ; where xn is the standardized data, xu is the original data, μ is the mean and σ is the standard deviation of the time series); and, (e) Radiant heat flux estimated by HOTSAT using Moderate Resolution Imaging Spectroradiometer (MODIS) (blue dots), Sea and Land Surface Temperature Radiometer (SLSTR) (red dots), and Visible Infrared Imaging Radiometer Suite (VIIRS) (green dots) data from 28 March to 1 April 2020.
Remotesensing 12 03010 g003
Figure 4. (a) 28 February 2020−27 March 2020, representing the pre-effusive period. Measured displacement was restricted to the NEC area and related to the accumulation and gravitational instability of the newly emplaced volcanic material; and, (b) 31 March 2020 cumulative displacement, highlighting the syn-eruptive deflation that occurred between 00:35 and 05:09.
Remotesensing 12 03010 g004
Figure 5. Minimum, mean, and maximum estimates for Time-Averaged Discharge Rate (TADR) and volume estimated during the effusive phase occurred from 30 March to 1 April 2020.
Remotesensing 12 03010 g005
Figure 6. Google Earth view of the satellite-derived lava overflows from the NE crater rim spreading along the Sciara del Fuoco. The lava flow field (red contour) has been superimposed from the Pléiades image acquired on 7 April 2020.
Remotesensing 12 03010 g006
Figure 7. Three-dimensional (3D) mapping of the deposit in the area obtained using the ML classifier emplaced between 8 October 2019 and 7 April 2020.
Remotesensing 12 03010 g007
Figure 8. Comparison of a PDC seismic signal, starting at 03:43:54, 31 March 2020 (labeled “I”) with the thermal camera images. (a) Impact of the PDC on the coast line recorded by the SPCT camera (see Figure 1 for camera location). (b) Seismogram and spectrogram of the PDC signal that occurred on 31 March at 03:43:54. The magenta arrows, labeled “I”, indicate the onset of the landslide-type seismic signal. The red arrows, labeled “II”, indicate the beginning of the 1–3 Hz frequency signal generated by the impact of the PDC on the coast line at 03:44:23 UTC. (c) 10 min of seismic signal highpass-filtered in frequencies >10 Hz (red) and bandpass-filtered in the 1–3 Hz band (blue) containing the recordings of some of the major PDCs that occurred on 31 March 2020. The amplitude of the highpass-filtered signal (red) is multiplied × 20. The yellow box highlights the PDCs represented in panels (a) and (b).
Remotesensing 12 03010 g008
Figure 9. Comparison of one-h (2020-03-31T03: 00:00–2020-03-31T04: 00:00 UTC) of the vertical component seismic signals of the STRE (black line) and STR1 (red line) stations. The E and PDC labels followed by an integer represent the signals of the most significant explosions and PDCs respectively, recorded in the considered time interval. At the top of the figure, the seismograms of the PDC4 and E3 explosion are shown in detail.
Remotesensing 12 03010 g009
Table 1. List of the INGV monitoring cameras and of their main features.
LabelType and ModelLocationDistance from the CratersOpticsField of View
SPCTThermal, FLIR A320West SdF flank, 85 m a.s.l.1698 m90°90° × 73°
2150 × 1613 m
SCTThermal, FLIR A655sc East SdF flank, 165 m a.s.l.1538 m25°25° × 19°
807 × 605 m
SQVVisual, Sony FCB-EX480CPEast SdF flank, 390 m a.s.l.1027 m18×48° (wide end) × 2.8° (tele end)
657 × 493 m
Table 2. Technical characteristics of the seismic network stations.
StationSensorSampling Rate Sps
STR1Guralp CMG40T50
STR4Guralp CMG40T50
STRAGuralp CMG40T50
STRCGuralp CMG40T50
STREGuralp CMG40T50
STRGGuralp CMG40T50
IST3Nanometrics Trillium120PA100
Table 3. List of the pyroclastic density currents (PDCs) spreading on the sea surface on 31 March 2020, as detected from the SPCT camera. The start time indicates when the flow reached the coast, the end time when it reached the maximum distance out to sea.
Start Time (hh:mm:ss)End Time (hh:mm:ss)Distance on the Sea (m)Speed (m s−1)
01:50:00.001:50:20.51416.9
02:35:25.502:35:50.01084.4
02:45:10.002:45:21.011810.7
02:48:36.502:48:47.512010.9
02:51:41.502:51:47.514023.3
02:54:15.502:54:27.014012.2
03:02:25.003:02:42.51347.7
03:06:23.003:06:40.01659.7
03:37:09.003:37:25.51458.8
03:39:07.503:39:22.01419.7
03:41:46.503:42:13.01555.9
Table 4. List of the pyroclastic density currents (PDCs) and lava flows that descended the Sciara del Fuoco slope on 31 March 2020, as detected from the SPCT camera. The distance on the slope is intended as the path length measured along the slope from the starting point to the coast.
Start Time (hh:mm:ss)End Time (hh:mm:ss)Distance on the Slope (m)Speed (m/s)Flow Type
01:46:36.501:47:02.0102840.3PDC
02:34:45.502:35:27.0102824.7PDC
02:38:50.002:42:32.010284.6Lava flow
02:40:00.002:45:07.08642.8Lava flow
02:50:54.502:51:42.086418.0PDC
02:55:13.002:56:03.574014.8PDC
03:00:19.003:01:04.069915.5PDC
03:05:43.003:06:23.074018.5PDC
03:30:00.003:31:27.04525.2Lava flow
03:41:17.003:41:57.051412.9PDC

