Article

Stand Structural Diversity and Species with Leaf Nitrogen Conservation Drive Aboveground Carbon Storage in Tropical Old-Growth Forests

1
Jianshui Research Station, School of Soil and Water Conservation, Beijing Forestry University, Beijing 100083, China
2
Key Laboratory of State Forestry Administration on Soil and Water Conservation, Beijing Forestry University, Beijing 100083, China
3
Institute of Desertification Studies, Chinese Academy of Forestry, Beijing 100091, China
4
Breeding Base for State Key Laboratory of Land Degradation and Ecological Restoration in Northwest China, Ningxia University, Yinchuan 750021, China
5
Academy of Forest Inventory and Planning, National Forestry and Grassland Administration, Beijing 100714, China
*
Author to whom correspondence should be addressed.
Forests 2020, 11(9), 994; https://doi.org/10.3390/f11090994
Submission received: 24 July 2020 / Revised: 10 September 2020 / Accepted: 11 September 2020 / Published: 16 September 2020
(This article belongs to the Section Forest Ecology and Management)

Abstract

:
Tropical old-growth forests are essential for global carbon regulation. Although there is increasing evidence that species and functional diversity, stand structural diversity, functional compositions, and elevation play roles in ecosystem functioning, the relative strengths of these drivers and the underlying mechanisms (mass-ratio hypothesis or niche complementarity hypothesis) are not clear. Aboveground carbon storage, species diversity, stand structural diversity, community-weighted mean (CWM), and functional diversity (FDvar) of 12 leaf traits were analyzed using data from 56 old-growth forest communities in the Dawei Mountain area of Southwest China. Multiple regression models were used to test the relative importance of the predictor variables and the structural equation model was used to explore the direct and indirect influences on aboveground carbon storage. High structural diversity moderately enhanced aboveground carbon storage. CWM leaf nitrogen concentration in young leaves weakly affected aboveground carbon storage. Our final multiple regression model showed that aboveground carbon storage is mostly affected by diameter at breast height (DBH) diversity, followed by FDvar of dry matter concentration in mature leaves and CWM nitrogen concentration in young leaves. The structural equation model indicated that elevation negatively affects aboveground carbon storage via diameter at breast height (DBH) diversity. Our results suggest that niche complementarity effects moderately drive aboveground carbon storage in tropical old-growth forests, but do not fully support the importance of the mass-ratio hypothesis.

1. Introduction

Tropical forests play an important role in global carbon (C) regulation [1]. Understanding the relationship between biodiversity and ecosystem functioning is essential for the regulation global climate change and to avoid biodiversity loss caused by anthropogenic activities [2,3]. There is substantial evidence that ecosystem functioning and biodiversity in natural forests are closely related [2,3,4]. Although numerous studies showed that high species diversity enhances aboveground C storage [4,5], this is still subject of debate [6,7,8] and the relationships between ecosystem functioning and biodiversity need to be further clarified [4,8], particularly regarding the multivariate mechanisms simultaneously affecting ecosystem functioning and biodiversity [4]. Since specific resource limitations correspond to plant growth and survival in different forest types; more information about the drivers and mechanisms influencing ecosystem functioning is needed to adequately protect and manage old-growth forests [3,9].
The mass-ratio hypothesis [10] and the niche complementarity hypothesis [11] are the two main mechanisms by which species diversity can influence ecosystem functioning. Based on the niche complementarity hypothesis, functional diversity (FDvar) and species diversity can increase the efficiency of resource use, thereby increasing C storage [12]. Using functional diversity, an index that reflects the variability of traits, is a more mechanistic way to explain ecosystem function compared to species diversity [3]. The mass-ratio hypothesis predicts that the dominant main species in the community determine ecosystem functions, which can be examined by the correlations between ecosystem functioning and community-weighted mean (CWM) functional traits [13]. Species that enhance ecosystem functioning may have conservative or acquisitive traits [9,14,15]. Conservative traits are consistently associated with low C inputs through photosynthesis and low C losses through decomposition; they are a combination of attributes such as low specific leaf area (SLA), low leaf concentrations of nitrogen (LNC) and phosphorous (LPC), high leaf thickness (LT), and high leaf dry matter content (LDMC) [14]. Acquisitive traits have the opposite attributes [14]. Several studies supported either the niche complementarity hypothesis [16,17,18] or the mass-ratio hypothesis [4,19], which were found to be nonexclusive with each other [4]. However, it is still unclear how these two mechanisms influence ecosystem functioning.
Recently, studies showed that stand structural diversity facilitates niche differentiation and drives ecosystem functions [3,5,20]. Multilayered stand structures promote efficient light use via improved crown space allocation [21], while functional diversity and species diversity indirectly affect ecosystem functioning through stand structural diversity [22,23,24]. Thus, it is crucial to simultaneously consider species diversity, stand structural diversity, functional dominance, and functional diversity to test the relative importance of the underlying mechanisms and drivers [4,8].
Abiotic factors are important drivers of aboveground C storage as they determine plant survival and growth [4,25]. The microclimate strongly impacts species abundances and distribution [26], which in turn affects both biological and physical stand attributes [27]. Thus, abiotic factors can indirectly affect C storage by affecting biotic factors [4,8]. In general, elevation, a comprehensive factor reflecting climate, affects ecosystem functioning [8]. For example, Cavanaugh [18] reported that elevation was negatively correlated with species diversity and functional diversity, although it had no impact on C storage. However, whether elevation influences aboveground C storage indirectly via biotic factors is still a considerable knowledge gap.
Karst landforms, fragile ecosystems characterized by water deficit and soil erosion, account for 15% of the global land area and are mainly distributed in Southwest China [28]. The authors of a previous study found a significant difference in primary productivity between karst and non-karst areas [29]; however, ecosystem functioning and its influencing factors in old-growth forests in karst and non-karst need to be further investigated.
In this study, we investigated 56 plots in tropical old-growth forests in Southwest China to address the following question: How do biotic (species diversity, stand structural diversity, functional diversity, and functional composition) and abiotic (elevation gradients and karst and non-karst landscapes) factors affect aboveground C storage? We hypothesized that (1) species diversity, stand structural diversity, and functional diversity simultaneously enhance aboveground C storage, and (2) elevation and soil types directly or indirectly affect aboveground C storage via biotic factors.

2. Materials and Methods

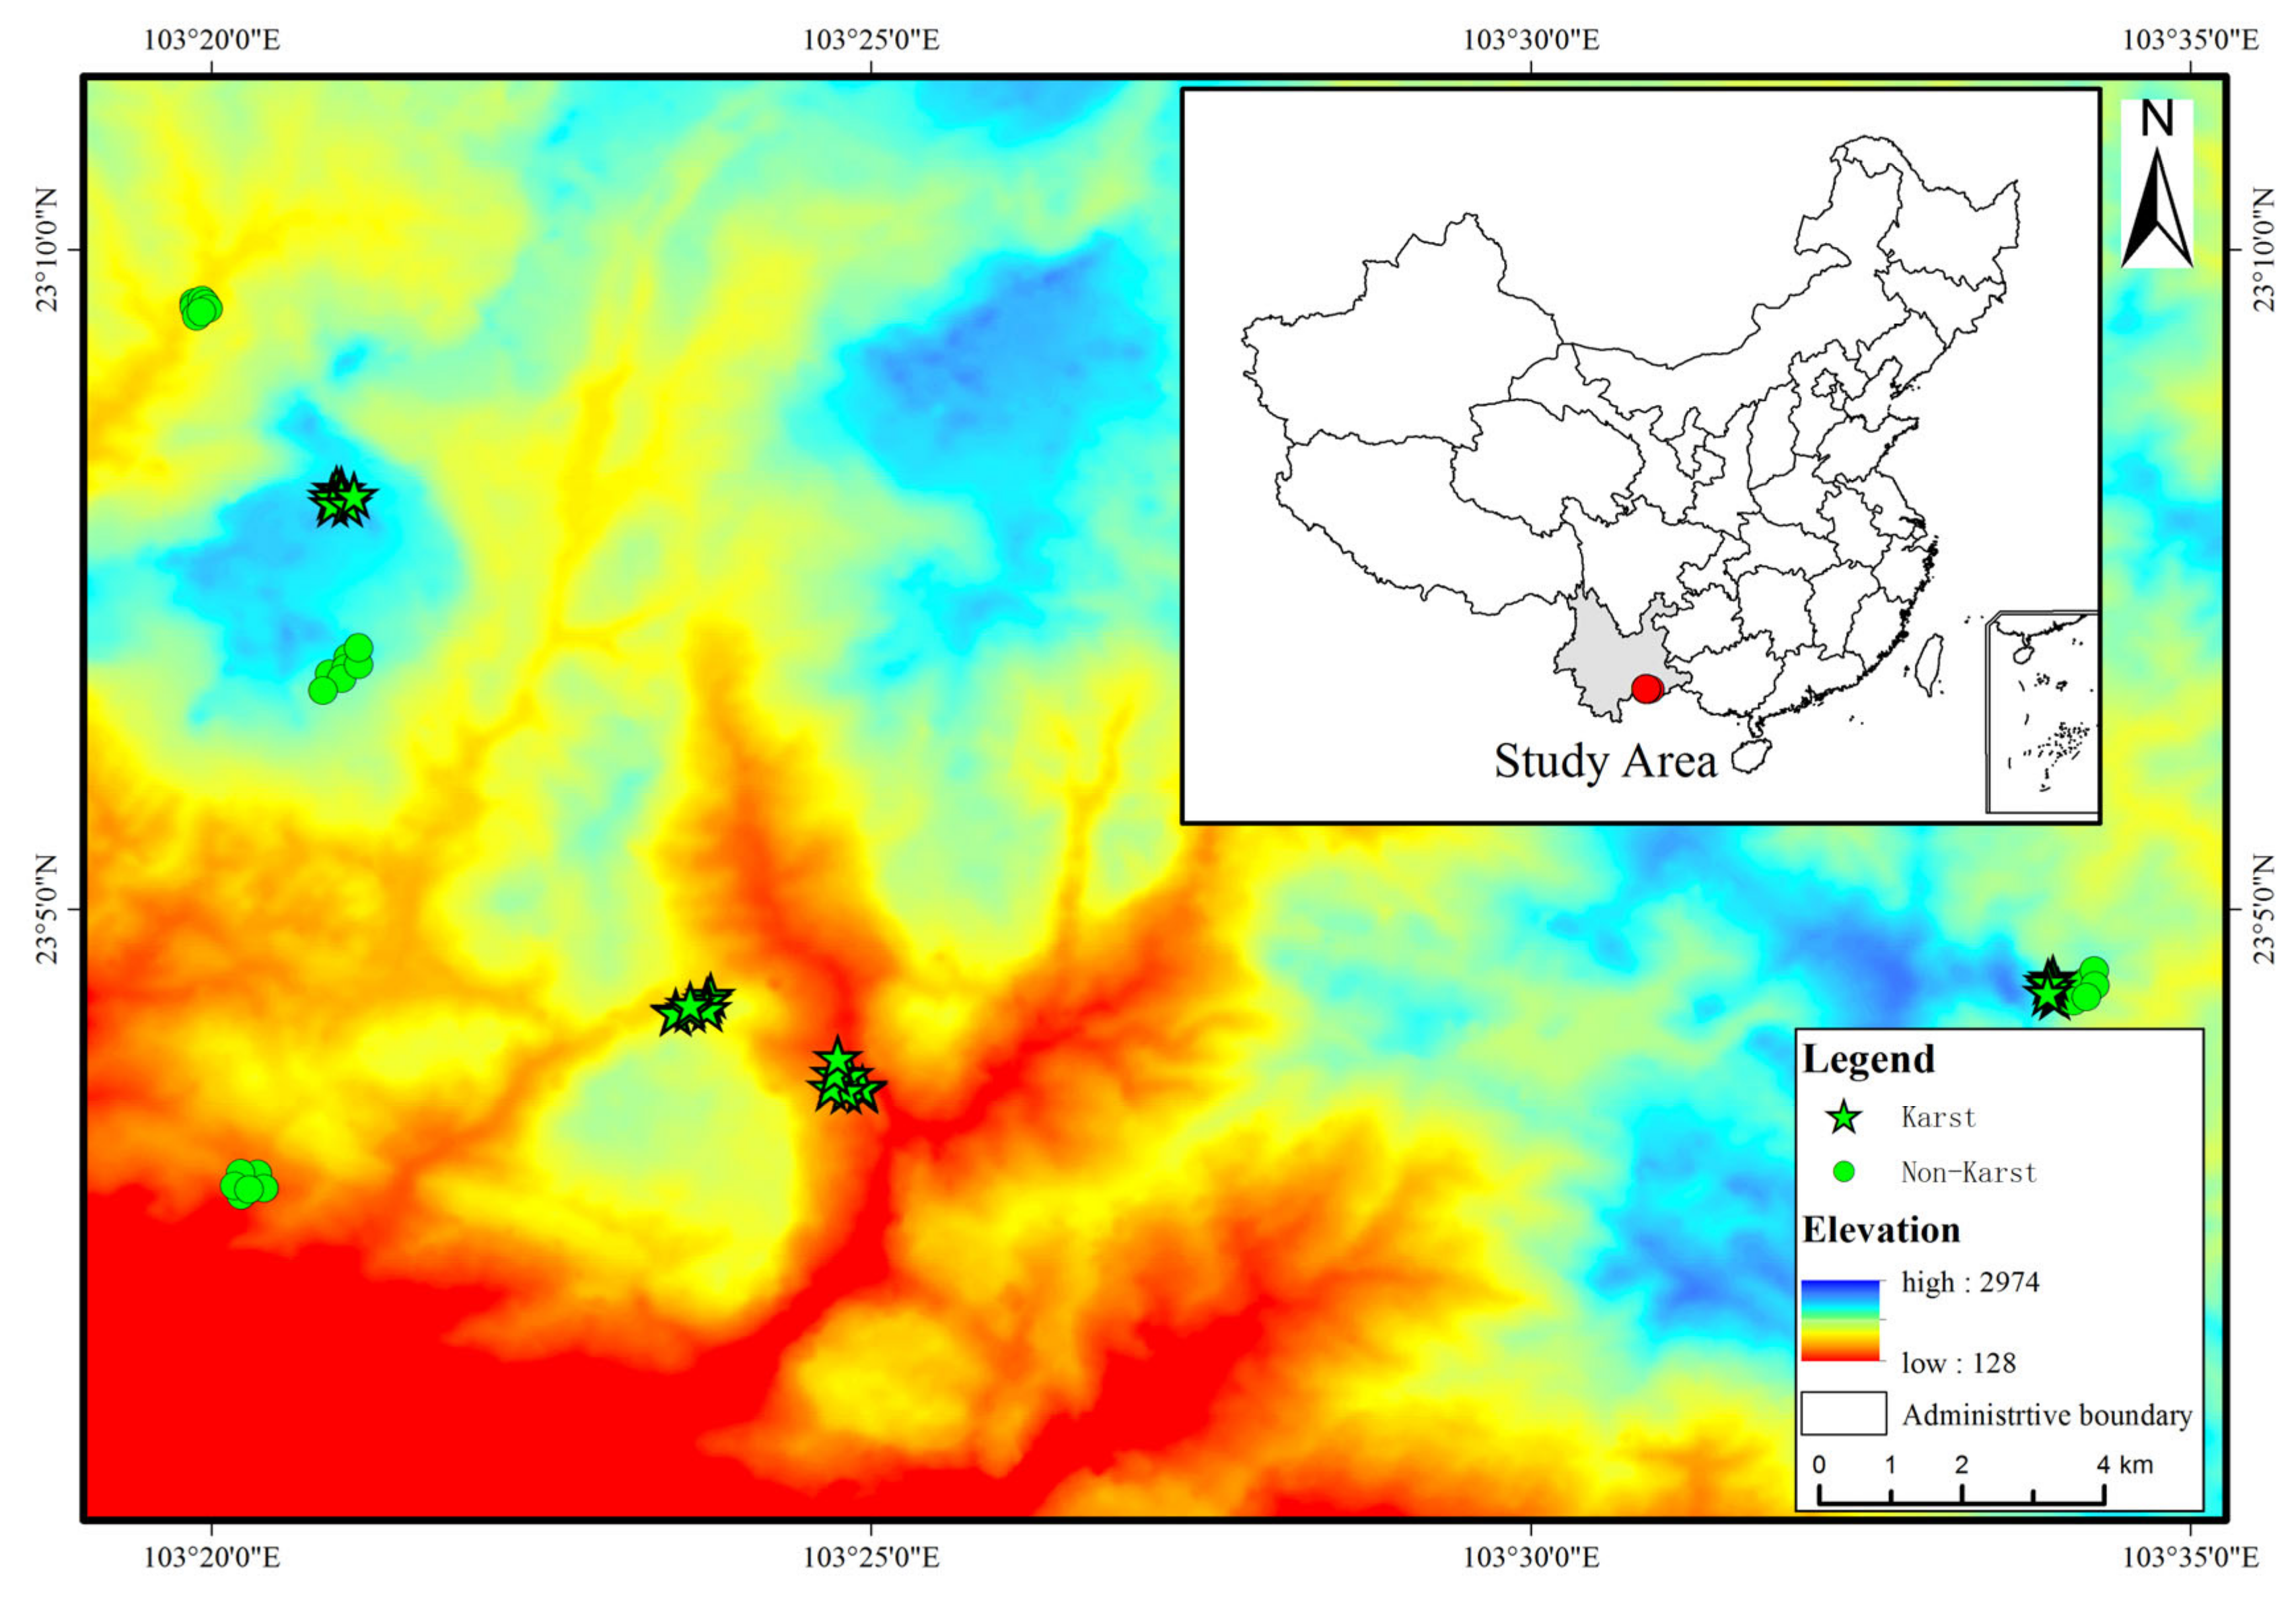
2.1. Site Description and Plots

Our study was conducted in the Dawei Mountain area (22°35′–23°10′ N, 103°20′–104°03′ E), located in Yunnan Province, Southwest China. Mean annual rainfall is 1700–1900 mm, at a mean annual temperature of 22.6 °C. Mean temperature of the coldest month (January) is 15.2 °C, while that of the hottest month (July) is 27.7 °C. The area is frost-free throughout the year. Elevation ranges between 225 and 2365 m (the highest peak of Dajian Mountain). The forest types change significantly from the bottom to the top of the mountain [30].
To ensure the comparability of forest communities at different elevation gradients, only old-growth forests, away from human life and almost without anthropogenic disturbance, were selected. Most of the old-growth forests were located in steep terrain, especially in karst areas. Supported by the local forestry department, we established one gradient with four elevations, namely 800, 1200, 1600, and 2000 m, and two soil types (karst and non-karst). Because of the strong heterogeneity of karst habitat, seven 20 × 20 m repeated plots were established, with a distance of more than 100 m between plots for each group to improve representativeness. In total, 56 plots (four elevations × two soil types × seven replicates) were selected. Between 2017 and 2018, all individual trees were identified at the species level in the plot or in the laboratory via samples [4]. Table 1 and Table S1 show the basic information of the plots and the important values of dominant species. Figure 1 shows the locations of the sampling plots. The importance value (IV) was calculated as follows:
IV   =   ( relative   density   +   relative   frequency   +   relative   dominance ) / 3 × 100 %

2.2. Quantification of Aboveground C Storage

In each plot, we measured the diameter at breast height (DBH) of all trees with a DBH greater than 5 cm. A telescopic pole was used to measure tree height lower than 18 m, and a clinometer was used for the height measurements of taller trees. Because our study areas were relatively widely distributed and there were no species-specific biomass models corresponding to the 152 species in our study sites, the global allometric equation, which considers height, DBH, and wood density, was used to calculate the aboveground biomass of individuals with a DBH greater than 5 cm [31]. Aboveground C storage was calculated by multiplying the aboveground biomass by 0.5 [32]. Wood density values were obtained for 81% of the species, with wood density levels based on average levels for the family or average levels of the corresponding plot for the remaining species [18]. The global allometric equation was calculated as follows:
A G B = 0.0673   ×   ρ   ×   D B H 2   × H 0.976 ,
where 𝜌 represents wood density (g cm−3), H represents height (m), and DBH represents diameter at breast height (cm).

2.3. Quantification of Stand Structural and Species Diversity

Species and stand structural (height and DBH) diversity were quantified via the Shannon–Wiener biodiversity index [23]. As recommended by Ali et al. [23], different DBH classes (8, 6, 4, and 2 cm) and height classes (5, 4, 3, and 2 m) were used to calculate stand structural diversity. The proportions of individual species, height class, and DBH class were represented by the relative basal area [23,33]. Because the height and DBH diversity based on different discrete classes may predict aboveground C storage differently, relationships between aboveground C storage and each class of stand structural diversity were evaluated, and the lowest Akaike information criterion (AIC) values were used to select the classes used for the models in Table 2 [34].

2.4. Functional Traits

LNC, LPC, N:P ratio, SLA, LDMC, and LT parameters, which are crucial for plant survival and growth [23,33,35], were determined for all species in the plots in both young and mature leaves, considering that central plant trade-offs strongly correlate with leaf longevity [9,36]. In total, 152 species, 1684 trees, and 33,564 leaves were sampled. In the field, three to five healthy mature plants per species were randomly selected in sunlit positions, preferably totally unshaded or minimally shaded (to avoid the effect of the canopy). Five branches were collected as far as possible from five different positions on each tree, i.e., from the four sides and the upper position of the sunlit side of the tree crown. Samples from different branches of one tree were considered as one sample. Moist paper towels were used to cover the samples during transportation. After arriving at the laboratory, the young leaves, mature leaves, and branches were separated, and approximately 10 healthy leaves were selected from each sample to measure average weight, thickness, and specific leaf area. Leaf thickness and weight were measured at an accuracy of 0.1 mm and 0.0001 g, respectively. A leaf area meter (LI-3100C, Li-Cor, Lincoln, NE, USA) was used to scan the corresponding leaves. Subsequently, leaf samples were oven-dried at 80 °C until constant weight to determine leaf dry mass for the calculation of LDMC and SLA. The LDMC was calculated as the oven-dried mass of a leaf divided by its water-saturated fresh mass, while SLA was calculated as the one-sided area of a leaf divided by its oven-dried mass. Leaf N and P concentrations were measured using a flow injection automatic analyzer (Skalar-1000, The Netherlands).
CWM trait values in each plot were calculated using the following equation [9,14]:
CWM ( trait X )   = i = 1 s p i × x i ,
where CWM (traitX) represents the CWM X trait, s represents the species number in each plot, pi represents the ith species’ relative abundance in the plot, and xi represents the ith species’ trait value.
Functional diversity was calculated as follows [14]:
FDvar   =   2 / π arctan 5 V   and   V = i = 1 s p i lnx i - lnx 2 ,
where p i =   a i / i = 1 s a i , ai represents ith species’ relative abundance in the plot, xi represents the ith species’ trait value, and lnx = i = 1 s p i lnx i . The variation range of FDvar values was 0 to 1.

2.5. Statistical Analysis

We used one-way ANOVA and least square difference (LSD) multiple comparison tests to determine the differences in aboveground C storage and abiotic factors. The Shapiro–Wilk test was used to examine data normality [17]. Prior to data analysis, non-normal continuous variables were natural-logarithm-transformed to improve normality and linearity [4,17].
Simple and multiple linear regressions were employed to explore the relationships between aboveground C storage and explanatory variables [4]. The bivariate relationships between elevation and exogenous variables were showed in Figure 2. The combination of 28 indices yielded a total of 268,435,455 models, which was beyond the capacity of R [9]. To select the optimal subset of predictor variables of aboveground C storage, ordinary least squares multiple regression analysis was first conducted with all 12 CWM indices (CWM SLA, LDMC, LT, LNC, LPC, and N:P ratio in both young and mature leaves), resulting in 4095 possible models. Subsequently, we used the other 15 biotic indices (FDvar of SLA, LDMC, LT, LNC, LPC, and N:P ratio in both young and mature leaves, species diversity, DBH, and height diversity) to conduct multiple regression analyses, which resulted in 32,367 possible models. Finally, we combined the elevation with the two former best subsets of predictors to conduct multiple analyses, and the eight predicted variables resulted in 255 possible models. All possible models were evaluated with the corrected Akaike information criterion (AICc), and the best-fit regression model was selected based on the lowest AICc values [4,37]. Multicollinearity was diagnosed using the variance inflation factor (VIF); all VIF values were lower than 10 in the best-fit regression model, suggesting that our results were not affected by collinearity among predictor variables [38]. For model selection, we used the “glmulti” package in R 3.6.1 [39].
The structural equation model (SEM), which is widely used to explore the complex relationships between ecosystem functioning and predictor variables [40], was applied to investigate how biotic and abiotic factors affect aboveground C storage (directly or indirectly). The variables retained in the best-fit regression model were used to construct the SEM [9,36]. We hypothesized partial mediation among the variables. The soil types were replaced by categorical variables, the karst area was coded as 1, and the non-karst area was coded as 2. The comparative fit index (CFI), the goodness-of-fit index (GFI), the root mean square error of approximation (RMSEA), the Chi-square (χ2) test, and the AIC were employed to test the fitness of the SEM [20]. The SEM was implemented using AMOS 21.0 software.

3. Results

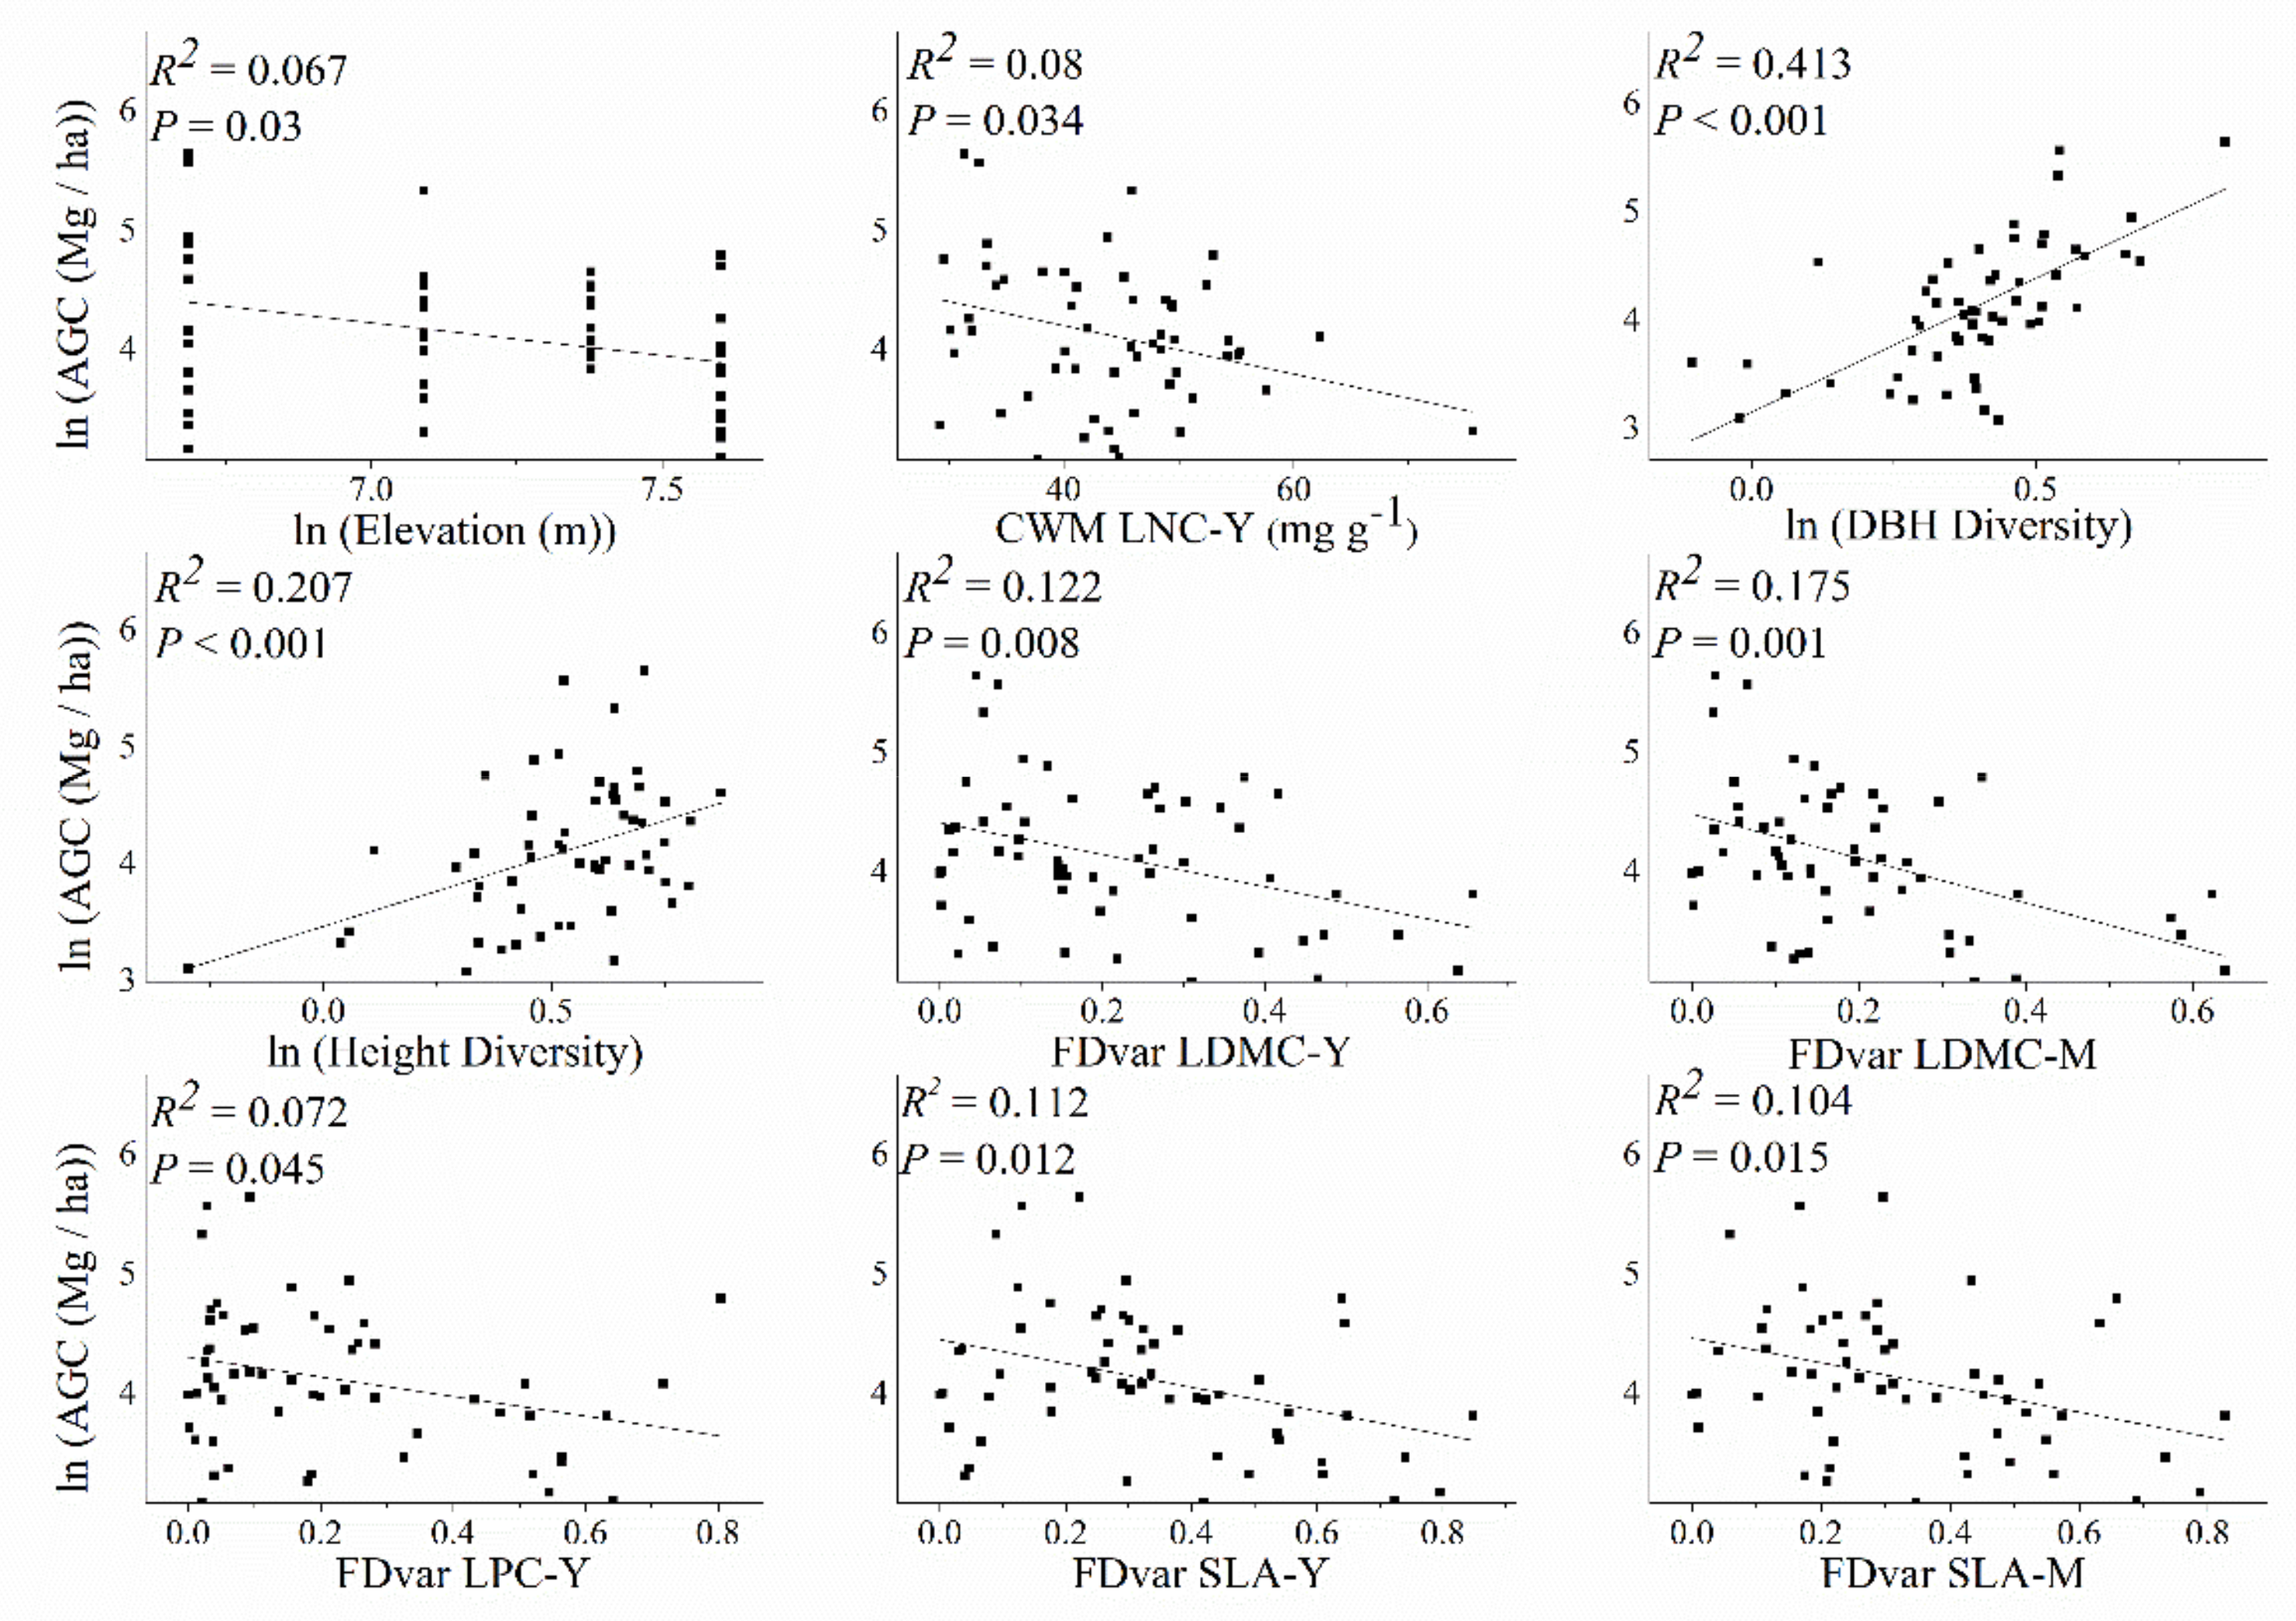
3.1. Effects of Influencing Factors on Aboveground C Storage

Aboveground C storage was moderately affected by DBH (R2 = 0.413, p < 0.001) and height diversity (R2 = 0.207, p < 0.001) (Figure 3). The CWM nitrogen concentration of young leaves weakly affected aboveground C storage (R2 = 0.08, p = 0.034). Aboveground C storage decreased with FDvar of LDMC and SLA in both young and mature leaves. The FDvar of P concentration in young leaves (R2 = 0.072, p = 0.045) and elevation (R2 = 0.067, p = 0.03) also weakly affected aboveground C storage. Carbon storage in the karst area at 2000 m was significantly higher than that in the non-karst area, while no differences were observed for the other three elevations (Table S2).

3.2. Relative Importance of all Predictor Variables for Aboveground C Storage

Only four predictor variables were retained in the optimal multiple regression model, accounting for 57.21% of the total variation in aboveground C storage (Table 3). The DBH diversity still mostly affected aboveground C storage (p < 0.001, β = 0.47). The FDvar of leaf dry matter content in mature leaves (p = 0.009, β = −0.27) and the CWM nitrogen concentrations of young leaves (p = 0.011, β = −0.25) both negatively affected aboveground C storage, while height diversity showed no impact on aboveground C storage in the final multiple regression model (p = 0.081, β = −0.18).

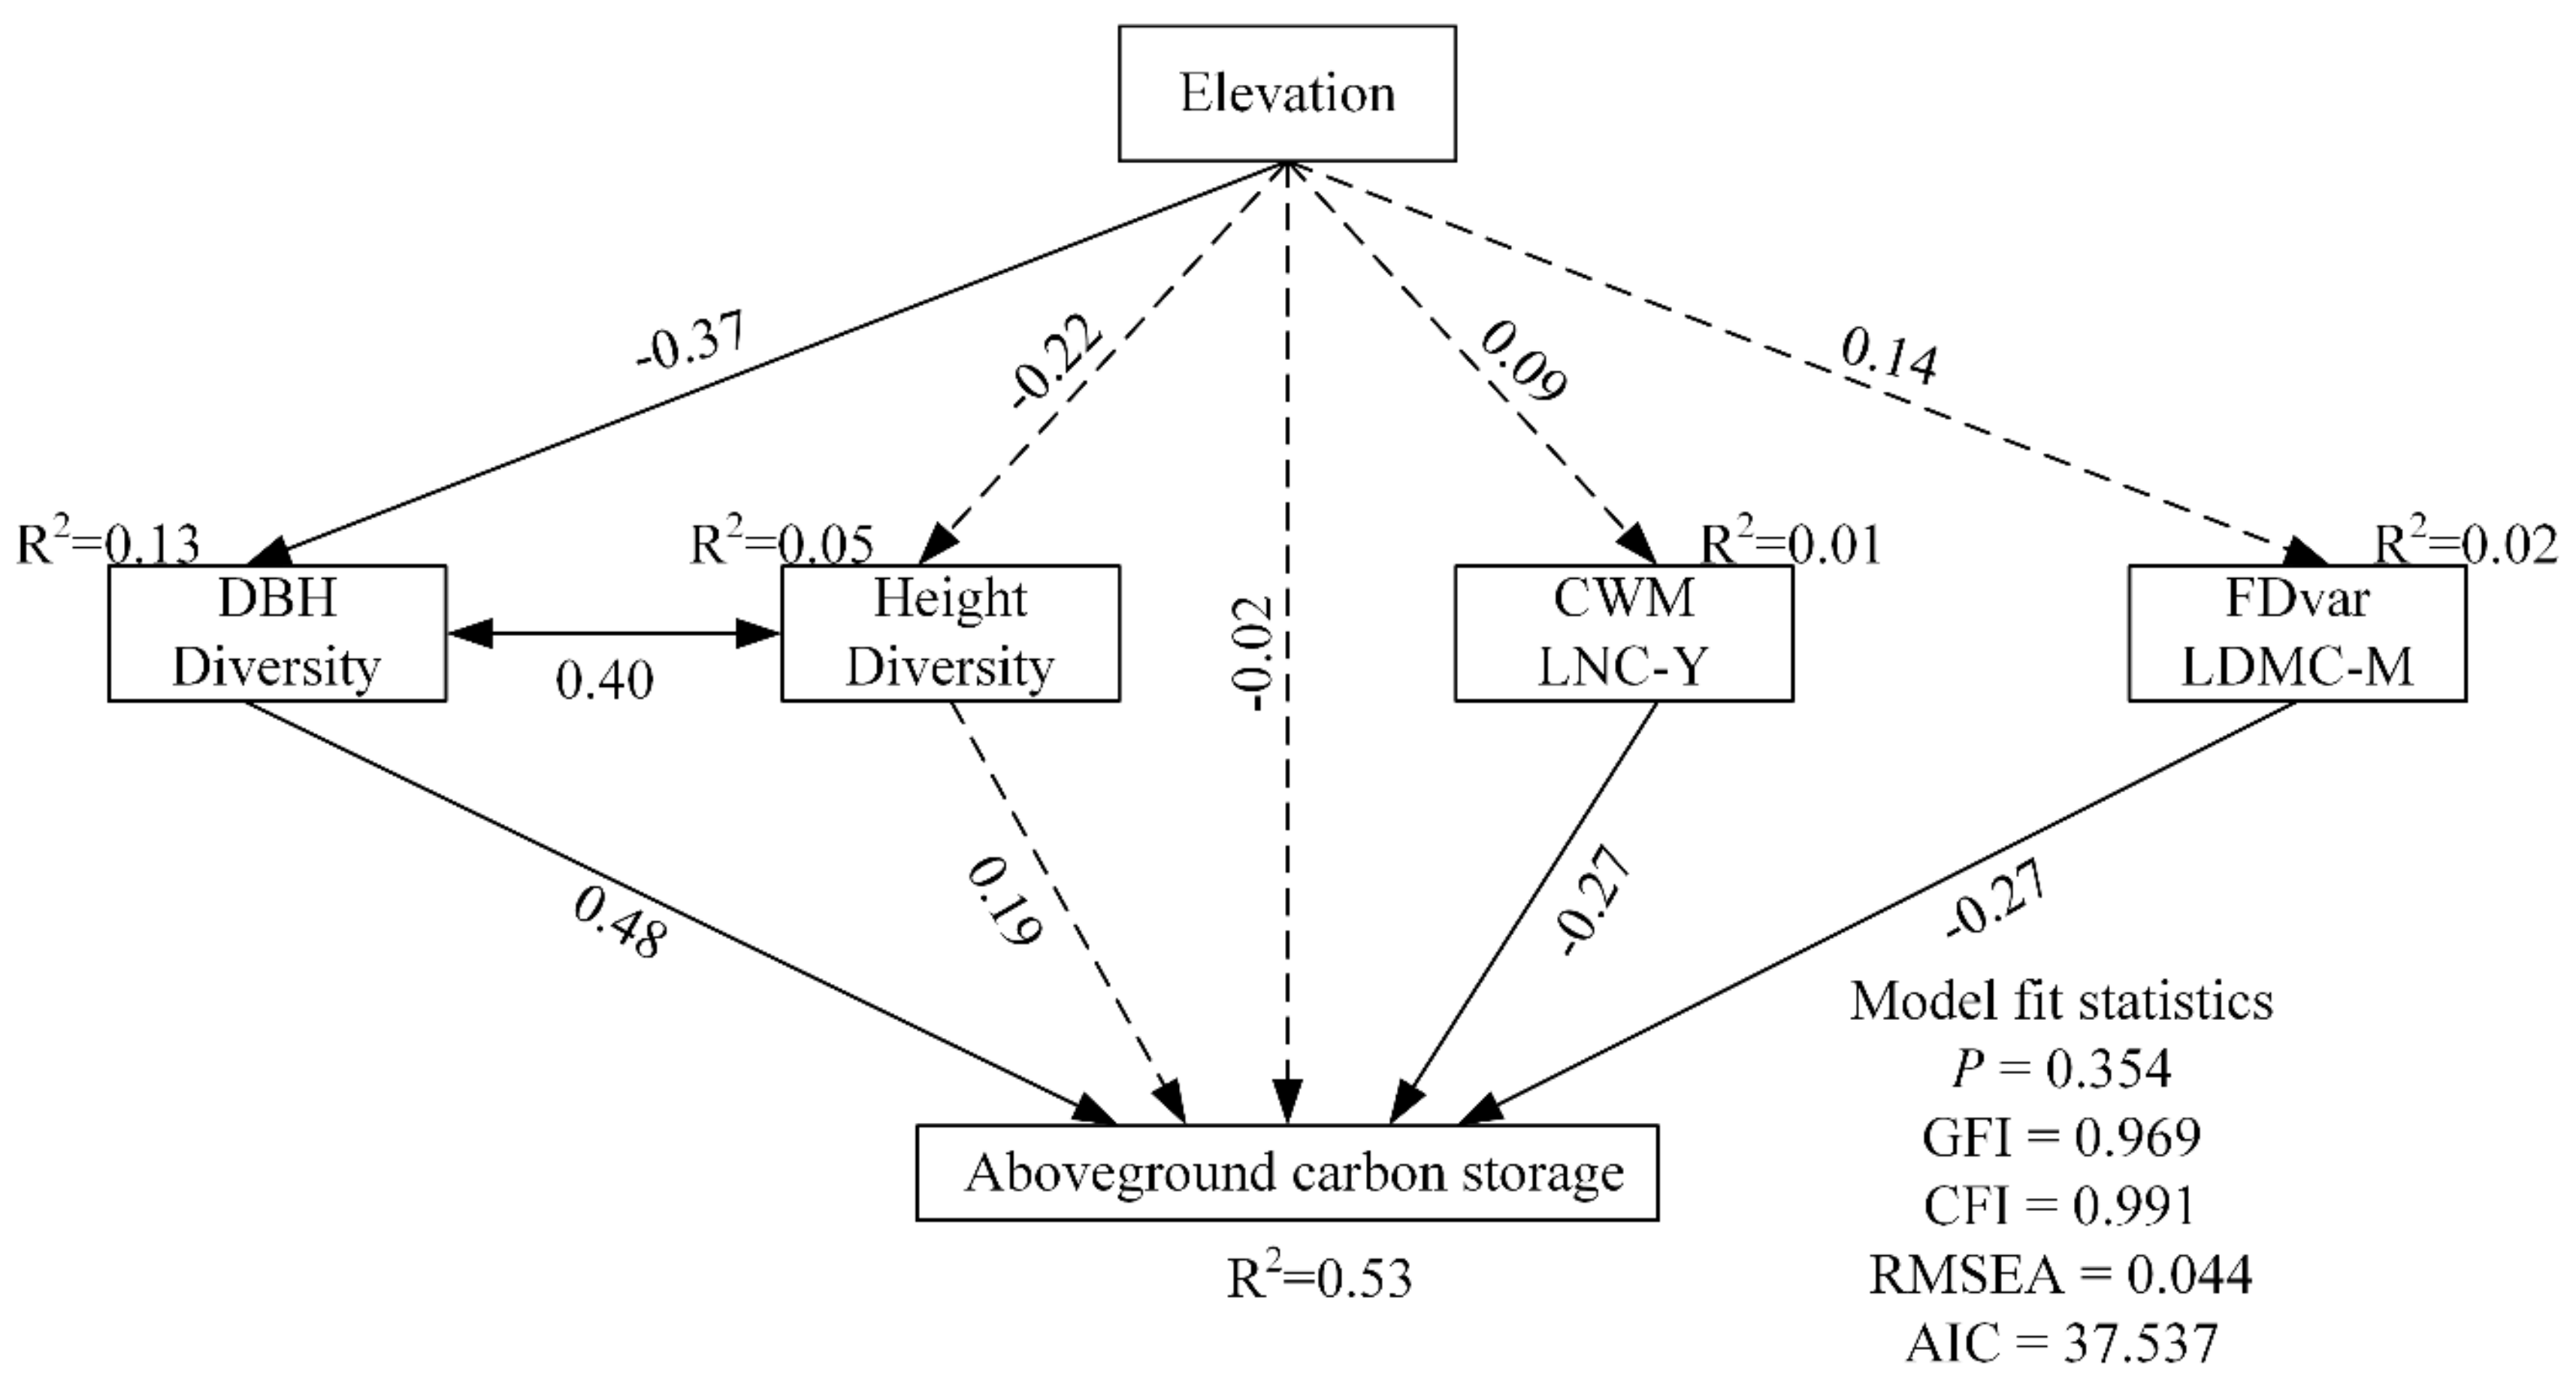
3.3. Direct and Indirect Impacts on Aboveground C Storage

The optimal SEM accounted for 53, 13, 5, 2, and 1% of the total variation in aboveground C storage, DBH diversity, height diversity, FDvar of LDMC in mature leaves, and CWM nitrogen concentration in young leaves, respectively (Figure 4). Higher DBH diversity directly enhanced aboveground C storage (p = 0.002, β = 0.48), whereas CWM young leaf nitrogen concentration (p = 0.009, β = −0.27) and FDvar of mature leaf dry matter content (p = 0.034, β = −0.27) both showed negative direct effects (Figure 4, Table 4). Elevation negatively and directly affected DBH diversity (p < 0.001, β = −0.37), but demonstrated no direct impact on aboveground C storage (p = 0.906, β = −0.02). However, elevation showed a moderately strong negative indirect effect via DBH diversity (p = 0.002, β = −0.18). The total effect of elevation was significant (p = 0.044, β = −0.30).

4. Discussion

Our hypothesis that aboveground C storage is affected by species diversity was not supported by the results, which were consistent with some previous studies [8,20,24]. This may be due to a potent effect of the dominant productive species [8,41,42] or competition exclusion [23,43,44]. In natural forests, species richness may achieve saturation and the ecological niches of most species may overlap, potentially reducing the influence of species diversity on ecosystem functioning [45,46]. As expected, both DBH and height diversity promoted ecosystem functioning, consistent with recent findings [8,23,24,47]. This may have been a result of the multilayered forest structure, enhancing the capture of water, light, and soil nutrients [5,47]. Our outcomes were similar to those of recent European studies [48,49], where structural heterogeneity was not shown to be correlated with tree species diversity in old-growth forests.
Unexpectedly, we found weak negative associations between FDvar of leaf functional traits and aboveground C storage, which was not consistent with the niche complementarity hypothesis and some previous results [8,23]. Low trait diversity may be caused by large dominated species [50]. Such results provide a potential solution to stand structure [8,20,23,24,42] as the niche complementarity mechanism maintaining ecosystem functioning, but not species diversity [6,23] or functional diversity [8,14,18,35].
The CWM nitrogen concentration of young leaves negatively affected aboveground C storage, consistent with our hypothesis and previous studies [9,35]. The only weak effect of CWM LNC in young leaves on aboveground C storage did not fully support the mass-ratio hypothesis. Our results led us to infer that the leaf economic spectrum of plants correlates with aboveground C storage [51]. The high aboveground C storage was accompanied by a low CWM leaf nitrogen concentration, indicating that “slow” forests result in high aboveground C accumulation in old-growth forests [52]. Conservative resource-use syndromes are associated with low C losses through mortality [35] or decomposition [13,53]. In old-growth communities, forests dominated by conservative species might have lower biomass turnover rates and higher aboveground C storage [14]. The insignificant effect of nitrogen concentrations of old leaves on aboveground C storage was inconsistent with previous result in second subtropical forests [9]. However, a previous study [9] showed that CWM leaf nitrogen concentration of young leaves had a stronger effect on aboveground biomass than that of mature leaves, which was similar to our results. This outcome may have resulted from the nutrient transfer efficiency of leaves, which was mainly reflected in the transfer of nutrients from mature branches and leaves to new leaves when there were not enough nutrients for plant growth [54,55].
As expected, aboveground C storage decreased significantly with increasing elevation, which was consistent with previous results [8]. The DBH diversity, CWM SLA, and LPC decreased while CWM LT increased with increasing elevation (Figure 2), indicating that elevation has a significant filtering effect [56]. These leaf conservative resource-use syndromes and the low stand structural diversity at higher elevations may result from adaptations of plants to the harsh environment at higher elevations [57]. As hypothesized, elevation was also shown to indirectly affect aboveground C storage via stand structural diversity, consistent with previous studies where climate factors indirectly affected aboveground C storage via forest composition [4,40]. Unexpectedly, we found no significant difference in AGC between karst and non-karst areas, which was not consistent with Wang [29], who observed differences in net primary productivity between karst and non-karst areas. The outcome of our study may have resulted from the same precipitation and forest types in karst and non-karst areas, which are crucial factors regarding biomass or C storage [3,4].
In our study, stand structure diversity was the most important driver of aboveground C storage, followed by CWM, LNC, and FDvar leaf traits, suggesting that the predicted variables supporting the niche complementarity hypothesis are more important than the variables supporting the mass-ratio hypothesis in enhancing aboveground C storage. These results indicate that niche complementarity may exert a more important effect on the promotion of ecosystem function than the mass-ratio effect. Considering both niche complementarity and the mass-ratio effect simultaneously may lead to an improved understanding of the mechanisms of ecosystem function (Table 3). However, it must be noted that some other functional traits, such as plant diameter [18,33], wood traits [9], and leaf anatomical traits [58], can also affect ecosystem functioning, although these were not measured in this study. The dynamics of other ecosystem functioning parameters (e.g., aboveground productivity) may not be consistent with aboveground C storage [59]. Ecosystem functioning and biotic factors change considerably with succession [2,9,23] and changes in other abiotic factors, such as soil nutrients [3,20] and climate factors [4]. Thus, we encourage further studies investigating the relationships between ecosystem functioning and biodiversity, taking into consideration the predictor variables in communities in different successional stages.

5. Conclusions

Our data, obtained from 56 old-growth forest plots, indicate that the niche complementarity effect is essential in the promotion of ecosystem functioning. Greater complex stand structural diversity moderately enhanced aboveground C storage. Species with leaf nitrogen conservation was shown to drive aboveground C storage. Elevation showed a significant filtering effect on DBH diversity and CWM leaf functional traits, indirectly affecting aboveground C storage via DBH diversity. Our results indicate that complex stand structure and species with leaf nitrogen conservation can maximize aboveground C storage in tropical old-growth forests.

Supplementary Materials

The following are available online at https://www.mdpi.com/1999-4907/11/9/994/s1, Table S1: Importance values of the dominant species of different old-growth forest communities in the Dawei Mountain area in Yunnan Province, Southwestern China, Table S2: Community characteristics of tropical old-growth forest communities in the Dawei Mountain area in Yunnan Province, Southwestern China.

Author Contributions

Conceptualization, J.Z. and G.W.; methodology, J.Z and Y.L.; software, G.W. and X.Y.; validation, G.W.; formal analysis, G.W.; investigation, Y.L. and G.W.; resources, J.Z. and G.W.; data curation, J.Z., D.P., and G.W.; writing—original draft preparation, G.W.; writing—review and editing, J.Z., G.W., Y.L., D.P., X.W., X.Y., and A.H.; visualization, J.Z. and G.W.; supervision, J.Z. and G.W.; project administration, J.Z., X.W., and Y.L.; funding acquisition, J.Z., X.W., and Y.L. All authors read and agreed to the published version of the manuscript.

Funding

This study was supported by the National Natural Science Foundation of China (31870707, 41671080) and the National Key R&D Program of China (2016YFC0502504). We are grateful to the Beijing Municipal Education Commission for financial support through the Innovative Transdisciplinary Program “Ecological Restoration Engineering”.

Acknowledgments

We gratefully acknowledge all those who participated in the field investigation and laboratory test. We are also grateful to Pinrong Li, Yongxing Chu, and Yong Chai for their help with species identification in the field and the laboratory.

Conflicts of Interest

The authors declare no conflict of interest.

References

  1. Saatchi, S.S.; Harris, N.L.; Brown, S.; Lefsky, M.; Mitchard, E.T.; Salas, W.; Zutta, B.R.; Buermann, W.; Lewis, S.L.; Hagen, S.; et al. Benchmark map of forest carbon stocks in tropical regions across three continents. Proc. Natl. Acad. Sci. USA 2011, 108, 9899–9904. [Google Scholar] [CrossRef] [PubMed] [Green Version]
  2. Lohbeck, M.; Bongers, F.; Martinez-Ramos, M.; Poorter, L. The importance of biodiversity and dominance for multiple ecosystem functions in a human-modified tropical landscape. Ecology 2016, 97, 2772–2779. [Google Scholar] [CrossRef] [PubMed]
  3. Yuan, Z.Q.; Ali, A.; Wang, S.P.; Gazol, A.; Freckleton, R.; Wang, X.G.; Lin, F.; Zhou, L.; Hao, Z.Q.; Loreau, M. Abiotic and biotic determinants of coarse woody productivity in temperate mixed forests. Sci. Total Environ. 2018, 630, 422–431. [Google Scholar] [CrossRef] [PubMed]
  4. Li, Y.; Bao, W.; Bongers, F.; Chen, B.; Chen, G.K.; Guo, K.; Jiang, M.X.; Lai, J.S.; Lin, D.M.; Liu, C.J.; et al. Drivers of tree carbon storage in subtropical forests. Sci. Total Environ. 2019, 654, 684–693. [Google Scholar] [CrossRef]
  5. Poorter, L.; van der Sande, M.T.; Thompson, J.; Arets, E.J.M.M.; Alarcón, A.; Álvarez-Sánchez, J.; Ascarrunz, N.; Balvanera, P.; Barajas-Guzmán, G.; Boit, A.; et al. Diversity enhances carbon storage in tropical forests. Glob. Ecol. Biogeogr. 2015, 24, 1314–1328. [Google Scholar] [CrossRef]
  6. Cavard, X.; Bergeron, Y.; Chen, H.Y.H.; Pare, D. Mixed-species effect on tree aboveground carbon pools in the east-central boreal forests. Can. J. For. Res. 2010, 40, 37–47. [Google Scholar] [CrossRef]
  7. Ruiz-Benito, P.; Gómez-Aparicio, L.; Paquette, A.; Messier, C.; Kattge, J.; Zavala, M.A. Diversity increases carbon storage and tree productivity in Spanish forests. Glob. Ecol. Biogeogr. 2014, 23, 311–322. [Google Scholar] [CrossRef]
  8. Fotis, A.T.; Murphy, S.J.; Ricart, R.D.; Krishnadas, M.; Whitacre, J.; Wenzel, J.W.; Queenborough, S.A.; Comita, L.S. Above-ground biomass is driven by mass-ratio effects and stand structural attributes in a temperate deciduous forest. J. Ecol. 2018, 106, 561–571. [Google Scholar] [CrossRef]
  9. Ali, A.; Yan, E.R.; Chang, S.X.; Cheng, J.Y.; Liu, X.Y. Community-weighted mean of leaf traits and divergence of wood traits predict aboveground biomass in secondary subtropical forests. Sci. Total Environ. 2017, 574, 654–662. [Google Scholar] [CrossRef]
  10. Grime, J.P. Benefits of plant diversity to ecosystems: Immediate, filter and founder effects. J. Ecol. 1998, 86, 902–910. [Google Scholar] [CrossRef]
  11. Tilman, D.; Knops, J.; Wedin, D.; Reich, P.; Ritchie, M.; Siemann, E. The influence of functional diversity and composition on ecosystem processes. Science 1997, 277, 1300–1302. [Google Scholar] [CrossRef] [Green Version]
  12. Díaz, S.; Quétier, F.; Cáceres, D.M.; Trainor, S.F.; Pérez-Harguindeguy, N.; Bret-Harte, M.S.; Finegan, B.; Peña-Claros, M.; Poorter, L. Linking functional diversity and social actor strategies in a framework for interdisciplinary analysis of nature’s benefits to society. Proc. Natl. Acad. Sci. USA 2011, 108, 895–902. [Google Scholar] [CrossRef] [PubMed] [Green Version]
  13. Diaz, S.; Lavorel, S.; de Bello, F.; Quetier, F.; Grigulis, K.; Robson, M. Incorporating plant functional diversity effects in ecosystem service assessments. Proc. Natl. Acad. Sci. USA 2007, 104, 20684–20689. [Google Scholar] [CrossRef] [PubMed] [Green Version]
  14. Conti, G.; Díaz, S. Plant functional diversity and carbon storage—An empirical test in semi-arid forest ecosystems. J. Ecol. 2013, 101, 18–28. [Google Scholar] [CrossRef]
  15. Prado-Junior, J.A.; Schiavini, I.; Vale, V.S.; Arantes, C.S.; van der Sande, M.T.; Lohbeck, M.; Poorter, L. Conservative species drive biomass productivity in tropical dry forests. J. Ecol. 2016, 104, 817–827. [Google Scholar] [CrossRef] [Green Version]
  16. Morin, X.; Fahse, L.; Scherer-Lorenzen, M.; Bugmann, H. Tree species richness promotes productivity in temperate forests through strong complementarity between species. Ecol. Lett. 2011, 14, 1211–1219. [Google Scholar] [CrossRef]
  17. Zhang, Y.; Chen, H.Y.H.; Reich, P.B. Forest productivity increases with evenness, species richness and trait variation: A global meta-analysis. J. Ecol. 2012, 100, 742–749. [Google Scholar] [CrossRef]
  18. Cavanaugh, K.C.; Gosnell, J.S.; Davis, S.L.; Ahumada, J.; Boundja, P.; Clark, D.B.; Mugerwa, B.; Jansen, P.A.; O’Brien, T.G.; Rovero, F.; et al. Carbon storage in tropical forests correlates with taxonomic diversity and functional dominance on a global scale. Glob. Ecol. Biogeogr. 2014, 23, 563–573. [Google Scholar] [CrossRef]
  19. Lin, D.; Anderson-Teixeira, K.J.; Lai, J.; Mi, X.; Ren, H.; Ma, K. Traits of dominant tree species predict local scale variation in forest aboveground and topsoil carbon stocks. Plant Soil 2016, 409, 435–446. [Google Scholar] [CrossRef]
  20. Zhang, Y.; Chen, H.Y.H. Individual size inequality links forest diversity and aboveground biomass. J. Ecol. 2015, 103, 1245–1252. [Google Scholar] [CrossRef]
  21. Yachi, S.; Loreau, M. Does complementary resource use enhance ecosystem functioning? A model of light competition in plant communities. Ecol. Lett. 2007, 10, 54–62. [Google Scholar] [CrossRef] [PubMed]
  22. Chiang, J.M.; Spasojevic, M.J.; Muller-Landau, H.C.; Sun, I.F.; Lin, Y.; Sus, S.H.; Chen, Z.; Chen, C.T.; Swenson, N.G.; McEwan, R.W. Functional composition drives ecosystem function through multiple mechanisms in a broadleaved subtropical forest. Oecologia 2016, 182, 829–840. [Google Scholar] [CrossRef] [Green Version]
  23. Ali, A.; Yan, E.R.; Chen, H.Y.H.; Chang, S.X.; Zhao, Y.T.; Yang, X.D.; Xu, M.S. Stand structural diversity rather than species diversity enhances aboveground carbon storage in secondary subtropical forests in eastern China. Biogeosciences 2016, 13, 4627–4635. [Google Scholar] [CrossRef] [Green Version]
  24. Dǎnescu, A.; Albrecht, A.T.; Bauhus, J. Structural diversity promotes productivity of mixed, uneven-aged forests in southwestern Germany. Oecologia 2016, 182, 1–15. [Google Scholar] [CrossRef]
  25. Sullivan, M.J.; Talbot, J.; Lewis, S.L.; Phillips, O.L.; Qie, L.; Begne, S.K.; Chave, J.; Cuni-Sanchez, A.; Hubau, W.; Lopez-Gonzalez, G.; et al. Diversity and carbon storage across the tropical forest biome. Sci. Rep. 2017, 7, 39102. [Google Scholar] [CrossRef] [PubMed] [Green Version]
  26. Murphy, S.J.; Audino, L.D.; Whitacre, J.; Eck, J.L.; Wenzel, J.W.; Queenborough, S.A.; Comita, L.S. Species associations structured by environment and land-use history promote beta-diversity in a temperate forest. Ecology 2015, 96, 705–715. [Google Scholar] [CrossRef] [Green Version]
  27. Fahey, R.T.; Fotis, A.T.; Woods, K.D. Quantifying canopy complexity and effects on productivity and resilience in late successional hemlock-hardwood forests. Ecol. Appl. 2015, 25, 834–847. [Google Scholar] [CrossRef]
  28. Jiang, Z.C.; Lian, Y.Q.; Qin, X.Q. Rocky desertification in Southwest China: Impacts, causes, and restoration. Earth-Sci. Rev. 2014, 132, 1–12. [Google Scholar] [CrossRef]
  29. Wang, B.; Yang, S.; Lu, C.; Zhang, J.; Wang, Y. Comparison of net primary productivity in karst and non-karst areas: A case study in Guizhou Province, China. Environ. Earth Sci. 2010, 59, 1337–1347. [Google Scholar] [CrossRef]
  30. Wang, J.; Ma, Q.Y.; Du, F. Flora diversity characteristics of seed plants in Dawei mountain national nature reserve in Yunnan province, China. Sci. Silvae Sin. 2005, 42, 7–15. [Google Scholar]
  31. Chave, J.; Rejou-Mechain, M.; Burquez, A.; Chidumayo, E.; Colgan, M.; Delitti, W.; Duque, A.; Eid, T.; Fearnside, P.; Goodman, R.; et al. Improved allometric models to estimate the aboveground biomass of tropical trees. Glob. Chang. Biol. 2014, 20, 3177–3190. [Google Scholar] [CrossRef] [PubMed]
  32. Chave, J.; Andalo, C.; Brown, S.; Cairns, M.A.; Chambers, J.Q.; Eamus, D.; Folster, H.; Fromard, F.; Higuchi, N.; Kira, T.; et al. Tree allometry and improved estimation of carbon stocks and balance in tropical forests. Oecologia 2005, 145, 87–99. [Google Scholar] [CrossRef] [PubMed]
  33. Finegan, B.; Peña-Claros, M.; Oliveira, A.; Ascarrunz, N.; Bret-Harte, M.S.; Carreño-Rocabado, G.; Casanoves, F.; Díaz, S.; Eguiguren Velepucha, P.; Fernandez, F.; et al. Does functional trait diversity predict above-ground biomass and productivity of tropical forests? Testing three alternative hypotheses. J. Ecol. 2015, 103, 191–201. [Google Scholar] [CrossRef] [Green Version]
  34. Yuan, Z.Q.; Wang, S.P.; Ali, A.; Gazol, A.; Ruiz-Benito, P.; Wang, X.G.; Lin, F.; Ye, J.; Hao, Z.Q.; Loreau, M. Aboveground carbon storage is driven by functional trait composition and stand structural attributes rather than biodiversity in temperate mixed forests recovering from disturbances. Ann. For. Sci. 2018, 75. [Google Scholar] [CrossRef] [Green Version]
  35. Wright, S.J.; Kitajima, K.; Kraft, N.J.B.; Reich, P.B.; Wright, I.J.; Bunker, D.E.; Condit, R.; Dalling, J.W.; Davies, S.J.; Díaz, S.; et al. Functional traits and the growth–mortality trade-off in tropical trees. Ecology 2010, 91, 3664–3674. [Google Scholar] [CrossRef]
  36. Aerts, R.; Chapin, F.; Fitter, A.; Raffaelli, D. The mineral nutrition of wild plants revisited: A re-evaluation of processes and patterns. Adv. Ecol. Res. 2000, 30, 1–67. [Google Scholar]
  37. Wen, Z.; Zheng, H.R.; Smith, J.; Zhao, H.; Liu, L.; Ouyang, Z.Y. Functional diversity overrides community-weighted mean traits in linking land-use intensity to hydrological ecosystem services. Sci. Total Environ. 2019, 682, 583–590. [Google Scholar] [CrossRef]
  38. Graham, M. Confronting multicollinearity in ecological multiple regression. Ecology 2003, 84, 2809–2815. [Google Scholar] [CrossRef] [Green Version]
  39. Calcagno, V. glmulti: Model Selection and Multimodel Inference Made Easy; R Package Version 1.0.7.1; 2013. Available online: http://CRAN.R-project.org/package=glmulti, (accessed on 15 August 2013).
  40. Van der Sande, M.T.; Peña-Claros, M.; Ascarrunz, N.; Arets, E.J.M.M.; Licona, J.C.; Toledo, M.; Poorter, L. Abiotic and biotic drivers of biomass change in a Neotropical forest. J. Ecol. 2017, 105, 1223–1234. [Google Scholar] [CrossRef] [Green Version]
  41. Cardinale, B.J.; Matulich, K.L.; Hooper, D.U.; Byrnes, J.E.; Duffy, E.; Gamfeldt, L.; Balvanera, P.; O′Connor, M.I.; Gonzalez, A. The functional role of producer diversity in ecosystems. Am. J. Bot. 2011, 98, 572–592. [Google Scholar] [CrossRef] [Green Version]
  42. Tobner, C.M.; Paquette, A.; Gravel, D.; Reich, P.B.; Williams, L.J.; Messier, C. Functional identity is the main driver of diversity effects in young tree communities. Ecol. Lett. 2016, 19, 638–647. [Google Scholar] [CrossRef] [PubMed]
  43. Grime, J.P. Competitive exclusion in herbaceous vegetation. Nature 1973, 242, 344–347. [Google Scholar] [CrossRef]
  44. Grace, J.B.; Anderson, T.M.; Seabloom, E.W.; Borer, E.T.; Adler, P.B.; Harpole, W.S.; Hautier, Y.; Hillebrand, H.; Lind, E.M.; Partel, M.; et al. Integrative modelling reveals mechanisms linking productivity and plant species richness. Nature 2016, 529, 390–393. [Google Scholar] [CrossRef] [PubMed]
  45. Silver, W.L.; Brown, S.; Lugo, A.E. Effects of changes in biodiversity on ecosystem function in tropical forests. Conserv. Biol. 1996, 10, 17–24. [Google Scholar] [CrossRef]
  46. Hooper, D.U.; Chapin, F.S.; Ewel, J.J.; Hector, A.; Inchausti, P.; Lavorel, S.; Lawton, J.H.; Lodge, D.M.; Loreau, M.; Naeem, S.; et al. Effects of biodiversity on ecosystem functioning: A consensus of current knowledge. Ecol. Monogr. 2005, 75, 3–35. [Google Scholar] [CrossRef]
  47. Forrester, D.I. The spatial and temporal dynamics of species interactions in mixed-species forests: From pattern to process. For. Ecol. Manag. 2014, 312, 282–292. [Google Scholar] [CrossRef]
  48. Keren, S.; Medarević, M.; Obradović, S.; Zlokapa, B. Five Decades of Structural and Compositional Changes in Managed and Unmanaged Montane Stands: A Case Study from South-East Europe. Forests 2018, 9, 479. [Google Scholar] [CrossRef] [Green Version]
  49. Keren, S.; Svoboda, M.; Janda, P.; Nagel, T.A. Relationships between Structural Indices and Conventional Stand Attributes in an Old-Growth Forest in Southeast Europe. Forests 2020, 11, 4. [Google Scholar] [CrossRef] [Green Version]
  50. Van Gelder, H.A.; Poorter, L.; Sterck, F.J. Wood mechanics, allometry, and life-history variation in a tropical rain forest tree community. New Phytol. 2006, 171, 367–378. [Google Scholar] [CrossRef]
  51. Garnier, E.; Cortez, J.; Billes, G.; Navas, M.L.; Roumet, C.; Debussche, M.; Laurent, G.; Blanchard, A.; Aubry, D.; Bellmann, A.; et al. Plant functional markers capture ecosystem properties during secondary succession. Ecology 2004, 85, 2630–2637. [Google Scholar] [CrossRef]
  52. Quesada, C.A.; Phillips, O.L.; Schwarz, M.; Czimczik, C.I.; Baker, T.R.; Pati o, S.; Fylla, N.M.; Hodnett, M.G.; Herrera, R.; Almeida, S.; et al. Basin-wide variations in Amazon forest structure and function are mediated by both soils and climate. Biogeosciences 2012, 9, 2203–2246. [Google Scholar]
  53. Wright, I.J.; Reich, P.B.; Westoby, M.; Ackerly, D.D.; Baruch, Z.; Bongers, F.; Cavender-Bares, J.; Chapin, T.; Cornelissen, J.H.; Diemer, M.; et al. The worldwide leaf economics spectrum. Nature 2004, 428, 821–827. [Google Scholar] [PubMed]
  54. Brant, A.N.; Chen, H.Y.H. Patterns and Mechanisms of Nutrient Resorption in Plants. Crit. Rev. Plant Sci. 2015, 34, 471–486. [Google Scholar] [CrossRef]
  55. Zhang, H.; Guo, W.H.; Yu, M.K.; Wang, G.G.; Wu, T.G. Latitudinal patterns of leaf N, P stoichiometry and nutrient resorption of Metasequoia glyptostroboides along the eastern coastline of China. Sci. Total Environ. 2018, 618, 1–6. [Google Scholar] [CrossRef]
  56. Grime, J.P. Trait convergence and trait divergence in herbaceous plant communities: Mechanisms and consequences. J. Veg. Sci. 2006, 17, 255–260. [Google Scholar] [CrossRef]
  57. Read, Q.D.; Moorhead, L.C.; Swenson, N.G.; Bailey, J.K.; Sanders, N.J. Convergent effects of elevation on functional leaf traits within and among species. Funct. Ecol. 2014. [Google Scholar] [CrossRef]
  58. He, N.P.; Liu, C.C.; Tian, M.; Li, M.L.; Yang, H.; Yu, G.R.; Guo, D.L.; Smith, M.D.; Yu, Q.; Hou, J.H. Variation in leaf anatomical traits from tropical to cold-temperate forests and linkage to ecosystem functions. Funct. Ecol. 2017, 00, 1–10. [Google Scholar] [CrossRef] [Green Version]
  59. Chisholm, R.A.; Muller-Landau, H.C.; Abdul Rahman, K.; Bebber, D.P.; Bin, Y.; Bohlman, S.A.; Bourg, N.A.; Brinks, J.; Bunyavejchewin, S.; Butt, N.; et al. Scale-dependent relationships between tree species richness and ecosystem function in forests. J. Ecol. 2013. [Google Scholar] [CrossRef]
Figure 1. Locations of plots in Dawei Mountain area in Yunnan Province, Southwestern China.
Forests 11 00994 g001
Figure 2. Bivariate relationships between elevation (dependent) and exogenous (independent) variables (n = 56). Only significant relationships are shown (p < 0.05). CWM, community-weighted mean; FDvar, functional diversity; SLA-Y, specific leaf area of young leaf; LT-Y, leaf thickness of young leaf; LPC-Y, leaf phosphorus concentration of young leaf; N:P-Y, N:P ratio of young leaf; SLA-M, specific leaf area of mature leaf; LT-M, leaf thickness of mature leaf; N:P-M, N:P ratio of mature leaf; DBH: diameter at breast height.
Forests 11 00994 g002
Figure 3. Significant bivariate relationships between aboveground carbon storage (AGC) and predictor variables (n = 56). CWM, community-weighted mean; LNC-Y, young leaf nitrogen concentration; DBH Diversity, diameter at breast height diversity; FDvar, functional diversity; LDMC-Y, leaf dry matter content of young leaf; LDMC-M, leaf dry matter content of mature leaf; LPC-Y, leaf phosphorus concentration of young leaf; SLA-Y, specific leaf area of young leaf; SLA-M, specific leaf area of mature leaf.
Forests 11 00994 g003
Figure 4. Optimal structural equation model relating aboveground carbon storage to predictor variables. Model-fit statistics and standardized regression coefficients of each path are shown in the figure. Significant and nonsignificant routes at the level of 0.05 are represented by solid arrows and dashed arrows, respectively. The total variation of the explained variable is shown as R2, which is explained by all explanatory variables. CWM, community-weighted mean; LNC-Y, young leaf nitrogen concentration; DBH diversity, diameter at breast height diversity; FDvar, functional diversity; LDMC-M, mature leaf dry matter content.
Forests 11 00994 g004
Table 1. Basic vegetation and soil characteristics of the established plots in the Dawei Mountain area in Yunnan Province, Southwestern China.
Elevation800 m1200 m1600 m2000 m
Region TypesKarstNon-KarstKarstNon-KarstKarstNon-KarstKarstNon-Karst
Soil typeRed soilsBrown soilsRed soilsBrown soilsRed soilsBrown soilsRed soilsBrown soils
Slope (°)2527423527303640
Rock bare rate (%)700700450550
Height (m)8.77 (3.5, 22.8)9.78 (4.1, 23.8)9.08 (3.6, 18.2)14.57 (3.4, 25.5)8.34 (3.1, 29)8.18 (3.2, 25)6.38 (4.2, 18.9)11.08 (4, 20)
DBH (cm)13.25 (5, 116.1)15.42 (5, 220)22.03 (4.8, 82.1)24.19 (5, 166.3)10.48 (5, 76.2)9.11 (4.9, 163.8)8.56 (4.9, 111.5)21.79 (4.9, 170)
Density (plants/hm2)989 (765, 1083)833 (698, 936)533 (324, 725)322 (278, 365)1500 (1263, 1786)1622 (1359, 1827)811 (524, 1254)411 (316, 625)
Note: DBH, diameter at breast height; mean (minimum, maximum).
Table 2. General linear relationship between aboveground C storage and stand structural (tree diameter at breast height (DBH) and height) diversity of different classes across the plots. The bold discrete classes were selected.
DBH Class (cm)AICR2p-ValueHeight Class (m)AICR2p-Value
2 105.840.1680.0022 105.840.207<0.001
489.370.38<0.0013 107.160.1750.001
6 87.270.402<0.0014 108.140.1330.006
885.040.413<0.0015 106.130.195<0.001
Note: AIC, Akaike information criterion; DBH, diameter at breast height.
Table 3. The optimal model resulted from a sequence of regression analyses of aboveground carbon storage. The regression coefficient (Coeff.), the standardized regression coefficient (Beta), the t-test, and the p-value are given for each predictor variable. For the model, the coefficient of determination (R2), the p-value, and the Akaike Information Criterion (AICc) are also given. p-values of <0.05 are in bold.
Model and Predictor Coeff.BetatpR2AICc
Effects of community-weighted mean (CWM)
Model1 <0.0010.28105.52
Constant9.2007.21<0.001
CWM SLA-Y−0.01−0.39−2.330.024
CWM LT-Y−2.66−0.46−3.210.002
CWM LNC-Y−0.02−0.34−2.700.009
CWM LDMC-M−5.35−0.44−0.280.007
Effects of functional diversity (FDvar), species diversity, and stand structural diversity
Model2 <0.0010.5180.80
Constant3.35014.36<0.001
FDvar LDMC-M−1.17−0.27−2.590.012
DBH Diversity1.850.494.24<0.001
Height Diversity0.530.171.600.116
Joint effect of all predicted variables
Model3 <0.0010.5776.18
Constant4.14011.15<0.001
CWM LNC-Y−0.02−0.25−2.650.011
FDvar LDMC-M−1.16−0.27−2.730.009
DBH Diversity1.780.474.30<0.001
Height Diversity0.560.181.780.081
Note: CWM, community-weighted mean; FDvar, functional diversity; DBH, diameter at breast height; SLA-Y, specific leaf area of young leaf; LT-Y, leaf thickness of young leaf; LNC-Y, leaf nitrogen concentration of young leaf; LDMC-M, leaf dry matter content of mature leaf; Model1, the optimal model resulted from 12 CWM leaf functional traits; Model2, the optimal model resulted from functional diversity, species diversity and stand structural diversity; Model3, the optimal model resulted from the combination of the elevation and the two former best subsets of predictors.
Table 4. Direct, indirect, and total standardized effects on aboveground carbon storage based on the structural equation model. The indirect effect of elevation was calculated by multiplying the standardized effects of all paths on one route, from elevation to mediator, and then to aboveground carbon storage, while the total effect was calculated by adding standardized direct and indirect effects.
PredictorPathway to Aboveground Carbon StorageEffectp-Value
ElevationDirect effect−0.020.906
Indirect effect via DBH diversity−0.180.002
Indirect effect via height diversity−0.040.057
Indirect effect via CWM LNC-Y−0.020.412
Indirect effect via FDvar LDMC-M−0.040.245
Total effect−0.300.044
DBH DiversityDirect effect0.48<0.001
Height DiversityDirect effect0.190.057
CWM LNC-YDirect effect−0.270.003
FDvar LDMC-MDirect effect−0.270.004
Note: CWM, community-weighted mean; LNC-Y, young leaf nitrogen concentration; DBH diversity, diameter at breast height diversity; FDvar, functional diversity; LDMC-M, mature leaf dry matter content.

