Abstract
We examine deforestation processes in Apuí, a deforestation hotspot in Brazil’s state of Amazonas and present processes of land-use change on this Amazonian development frontier. Settlement projects attract agents whose clearing reflects land accumulation and the economic importance of deforestation. We used a mixed-method approach in the Rio Juma Settlement to examine colonization and deforestation trajectories for 35 years at three scales of analysis: the entire landscape, cohorts of settlement lots divided by occupation periods, and lots grouped by landholding size per household. All sizes of landholdings are deforesting much more than before, and current political and economic forces favoring the agribusiness sector foreshadow increasing rates of forest clearing for pasture establishment in Apuí. The area cleared per year over the 2013–2018 period in Apuí grew by a percentage more than twice the corresponding percentage for the Brazilian Amazon as a whole. With the national congress and presidential administration signaling impunity for illegal deforestation, wealthy actors, and groups are investing resources in land grabbing and land accumulation, with land speculation being a crucial deforestation factor. This paper is unique in providing causal explanations at the decision-maker’s level on how deforestation trajectories are linked to economic and political events (period effects) at the larger scales, adding to the literature by showing that such effects were more important than aging and cohort effects as explanations for deforestation trajectories. Additional research is needed to deepen our understanding of relations between land speculation, illegal possession of public lands, and the expansion of agricultural frontiers in Amazonia.
Introduction
Commodity exports drive current global tropical-forest loss (Fearnside 2005; Nepstad et al. 2006; Koh and Wilcove 2008; Rudel et al. 2009; Koh and Ghazoul 2010), which increased by 2101 km2 year−1 between 2001 and 2012 (Hansen et al. 2013). This effect is attributed to more medium and large clearings (Austin et al. 2017). All Amazonian countries followed this trend, except for Brazil. Annual deforestation rates in the Brazilian Amazon decreased by 80% from 2005 to 2012, associated with lower participation of large and medium landholders (Godar et al. 2012) due to commodity price decreases and unfavorable currency exchange rates, policy interventions, and voluntary market agreements (Ricketts et al. 2010; Nepstad et al. 2014; Fearnside 2017a, b; West et al. 2019). Nevertheless, by 2019 the annual deforestation rate in Brazilian Amazonia had increased by 122% since the low point in 2012 (Brazil, INPE Instituto Nacional de Pesquisas Espaciais 2020).
There are important reasons to be alarmed by accelerated deforestation in the Amazon basin. First are the concerns about the so-called “tipping point” involving the breakdown in rainfall recycling that sustains moisture conditions and, therefore, Amazonia’s rainforest ecosystems. Climate models project that the tipping point will be reached in only 15–30 years, at which time a considerable portion of Amazonia’s rainforest would transition into a new equilibrium state of either savanna or woody scrub vegetation (Oyama and Nobre 2003; Sampaio et al. 2007, 2018; Lovejoy et al. 2018; Asher 2020). Amazonian deforestation also affects precipitation in other parts of South America, North America, and Europe (Gedney and Valdes 2000; Werth and Avissar 2002; Avissar and Werth 2005; Hasler et al. 2009; Arraut et al. 2012). A decrease in precipitation in the midwestern and eastern United States and in southern South America would jeopardize the production of agricultural commodities and threaten regional and continental food security (Lapola et al. 2011).
Second, we should be worried about the increase in greenhouse gas (GHG) emissions from forest clearing. Brazil is the world’s sixth largest GHG emitter, but different from other countries, around half of its emissions come from land-use change (SEEG 2020). While there has been a global reduction in GHG emissions with the COVID-19 pandemic (IEA 2020), estimates for Brazil indicate an increase of 10–20% due to Amazonian deforestation. Brazil’s emissions for 2020 are expected be 2.1–2.3 GtCO2-eq, thus swamping the country’s efforts to honor its commitment under the Paris Agreement to reduce emissions to 1.3 GtCO2-eq by 2025 (SEEG 2020). Finally, the combination of climatic events, reduced moisture, and increased forest fragmentation produce more frequent and intense droughts, creating positive feedbacks with fire and resulting in more-damaging fire seasons (Cochrane and Barber 2009; Davidson et al. 2012). Forest fires increase fuel loads, fire intensity, and the susceptibility of forests to fire, meaning that successive fire outbreaks can accelerate the process in which large areas of tropical forests become scrubby savanna (Balch et al. 2015). Thus, besides massive loss of habitats and the region’s enormous terrestrial biodiversity (Stropp et al. 2009; Malhado et al. 2013), Amazonian forest loss influences rainfall regimes at global scales and reduces agricultural yields far beyond the region’s boundaries. The tipping point could come quickly if deforestation follows an accelerated pace, given the rapidity of infrastructure construction (Simmons et al. 2018; Walker et al. 2019).
Current high deforestation rates are found at the central basin, mainly in the Tapajós and Madeira River sub-basins in southwestern Pará and southern Amazonas, respectively (Walker et al. 2019; Brazil, INPE Instituto Nacional de Pesquisas Espaciais 2020). Pará State continues to have Amazonia’s highest annual forest loss, although this loss now takes place primarily in the southwestern part of the state, unlike earlier decades. The state of Amazonas, which contributed to only 4.8% of the country’s annual Amazonian deforestation during the 1990s and 2000s, increased to 12% during the 2010–2019 period (Brazil, INPE Instituto Nacional de Pesquisas Espaciais 2020). This current scenario for deforestation is not well represented in the literature on Amazonian land-use change. It is well known that cheap land and low law enforcement favor speculative investments to capture land rents (Margulis 2003; Barbier 2012; Schielein and Börner 2018; Waroux et al. 2017). It is also known that transaction costs for southern Amazonas are declining due to mounting government investments in infrastructure, which increases agricultural profitability (Margulis 2003; Simmons et al. 2007; Walker and Richards 2013; Simmons et al. 2018). These issues have been well explored elsewhere and will not be the focus of this paper.
This paper aims to analyze colonization and deforestation trajectories at the level of the decision-maker in Apuí, southern Amazonas, showing how deforestation patterns reflect economic and political events at the national and regional levels. We show that decisions involving current deforestation might differ from those that were made decades ago in other regions of the basin. We focus on understanding the immediate processes of land-use change related to colonization and deforestation trajectories over 35 years at three scales of analysis: the entire landscape, cohorts of settlement lots grouped by occupation periods, and lots grouped by class of landholding size per household. Because settlements like the one in Apuí serve as logistical, service, social, and labor hubs in these remote areas, it is crucial to understand how the different processes and actors in settlements contribute to the region’s deforestation and economy.
We use the case of the PA Rio Juma settlement to illustrate this agricultural development process. This is the settlement with the most cumulative area deforested in all of Brazilian Amazonia. The paper is organized as follows. We first describe agrarian reform in Amazonia, the processes of establishing settlement projects, and their contribution to overall deforestation. We discuss the process of land accumulation (concentration of farm lots in the hands of a few families). After explaining the methods used in our study, we present results for the three scales of analysis, focusing on identifying factors that influence decisions to speed up forest loss in settlement projects and the relation of these decisions to the profiles of different groups of land managers. We end by discussing land tenure and land-speculation issues affecting Apuí’s high deforestation rates and the implications for future research.
Settlement Projects in the Amazon
Land Tenure and Agrarian Reform
Brazil’s Land Statute, or the “Estatuto da Terra” (Law 4330 of 1964), provides instructions for land expropriation and distribution, while the 1988 Constitution lists the “social function of the land” as a fundamental right of citizens (Article 5) and as a means of promoting agrarian reform (Article 186). Brazil’s National Institute of Colonization and Agrarian Reform (INCRA) was created in 1970 and has since been the primary federal agency for land administration. Based on these rights as operationalized by INCRA, different ways for public lands to become private property have prevailed in different political periods.
During the military regime (1964–1985), sealed tenders (licitações) favored large private owners, but lots were also sold to small farmers in settlement projects at token prices and financed by low interest loans with 5-year grace periods before beginning payment (Hecht 1985; Fearnside 2001). For migrant families, INCRA created seven “Settlement Projects for Integration and Colonization” (PICs) from 1970 to 1978, and seven “Directed Settlement Projects” (PADs) from 1974 to 1982, mainly in Rondônia, Acre, and Pará. From that time onwards what motivated creation of private land was private interests capturing land rents propelled by government investments in infrastructure, cattle ranching, and mining. Investments grew rapidly with the PoloAmazônia (Polos Agropecuários e Agrominerais da Amazônia) program and through subsidies for large cattle ranches provided by the regional development agency SUDAM (Superintendência do Desenvolvimento da Amazônia) in Pará and Mato Grosso states (Hecht et al. 1988; Mahar 1989).
From 1985 onwards, informal “occupations” (i.e., squatter invasions) of public lands with later government sanction were the primary approach for converting public land into private property (Fearnside 2001), while a significant portion of more-recent settlements has been from expropriating private landholdings (Pacheco 2009). These settlements are called [Conventional] Settlement Projects or “Projetos de Assentamento” (PAs). PAs consist of groups of individual farm lots, each with 50–100 ha (Yanai et al. 2016). PAs are similar to PICs in that both are for promoting agricultural production. However, PAs did not have the same level of support that the PICs received from government infrastructure investments and agricultural credit. PAs are created by INCRA, but the stimulus to create them usually comes from individuals and groups who used the Land Statute and other legislation to promote agrarian reform for themselves, which became known as “direct-action land reform” (Simmons et al. 2010). The Brazilian Amazon is home to over 2400 PAs resulting from these policies. Other categories of “special settlements” were also created from mid-1990s onwards, such as Sustainable Development Projects (PDSes), Agroforestry Projects, and Agroextractive Projects (PAEs). Agricultural conversion in these special settlements should (theoretically) be minimal, and livelihoods should rely primarily on forest extraction in a regime of communal lands (Yanai et al. 2016). By 2010, 670,000 farm lots had been distributed, while more than 300,000 squatters were waiting to be legally titled (Tourneau and Bursztyn 2010).
Deforestation in Settlement Projects
Municipalities (counties) currently considered to be deforestation hotspots are those receiving major infrastructure projects (i.e., hydroelectric dams, ports, waterways, and road paving) (see Branford and Torres 2017; Walker and Simmons 2018), or those with abundant accessible forests into which settlement projects often expand (see Tourneau and Bursztyn 2010; Alencar et al. 2016; Gouvêa et al. 2009). Over time, deforestation in settlement projects has increased as a contribution to total deforestation. Settlements were responsible for 11.3% of total Amazonian deforestation up to 2003 (Pacheco 2009), for 24% from 2004 to 2008, and for 30% from 2010 to 2014 (Alencar et al. 2016; Yanai et al. 2016). By 2014, the PA category accounted for 72% of the total deforestation in settlements (Yanai et al. 2016).
At the municipality level, settlements are spatially linked to deforestation and fire events (Schneider and Peres 2015). Biophysical and social limitations and environmental impacts are rarely considered during the creation of settlement projects (Mahar 1989; Caviglia-Harris and Harris 2011). Investments in infrastructure and services without appropriate environmental compliance (Araújo 2006) generate social and political conditions that modify the landscape. The infrastructure projects form new population clusters, change productive patterns, and influence the creation of new municipalities and districts (administrative units within a municipality) (Heredia et al. 2003; Franco and Lima 2008; Simmons et al. 2010). Deforestation seems to be especially favored by the creation of new municipalities, as this brings a variety of government money transfers (“repasses”) and infrastructure investments.
The contribution of agrarian reform to Amazonian deforestation is contingent on spatiotemporal dynamics (Pacheco 2009; Yanai et al. 2016). Up to 2010 most deforestation was confined to the southern and eastern flanks of the basin (known as the “arc of deforestation”), an area that now has consolidated agricultural lands (Sathler et al. 2018; Schielein and Börner 2018). For the 2013–2018 period, the 20 municipalities with the most substantial cumulative deforestation lay closer to the center of the basin, and these municipalities were responsible for 90% of the total area deforested in the entire Brazilian Amazon (Fig. 1). In some of these 20 municipalities, such as Porto-Velho (Rondônia), Altamira and Novo Progresso (Pará), deforestation is mostly driven by large infrastructure projects (i.e., hydroelectric dams and paved roads) (Fearnside 2015; Walker and Simmons 2018). These municipalities also contain the settlements with the highest cumulative deforestation for the 2013–2018 period, usually those created in the late 1990s and early 2000s (Brazil, INCRA Instituto Nacional de Colonização e Reforma Agrária 2015; Alencar et al. 2016; Yanai et al. 2016). For the other municipalities, deforestation is driven only by agricultural expansion centered on settlement projects, such as Apuí, Novo Aripuanã, Lábrea, Boca do Acre, and Manicoré (Amazonas), Machadinho D’Oeste and Cujubim (Rondônia), and Colniza (Mato Grosso) (Brazil, INPE Instituto Nacional de Pesquisas Espaciais 2020).

A portion of the Brazilian Amazon showing the “arc of deforestation” and the 20 municipalities and settlement projects with the highest cumulative deforestation in the 2013–2018 period
Land Concentration in Settlement Projects
Various scholars have reported on the consequences of migration and the settling of landless people in the Amazon. During the 1980s, Rondônia and Pará states experienced massive waves of land speculation with state-led colonization and spontaneous migration, with landholdings of squatters (posseiros) being deforested and sold to more-capitalized actors (Alston et al. 1995; Fearnside 1989; Mahar 1989). These land-concentration processes have intensified deforestation (Moran 1977; Fearnside 1986, 1989; Mahar 1989; Walker et al. 2000) and created conflicts between wealthy landed elites and small homesteaders (Alston et al. 2000; Aldrich et al. 2012).
Figure 2 indicates that land concentration is also severe in settlement projects with recent extensive cumulative deforestation. When we analyze the size of areas deforested in the 20 settlements with the largest cumulative deforestation for the 2013–2018 period, only 15.8% of this area was in patches <10 ha in area. Clearings up to 10 ha are conservatively attributed to colonist families that were formally settled by the government (Wood et al. 2001; Godar et al. 2012). Clearings larger than 10 ha indicate the work of actors with resources that cannot be attributed to colonists. As Fig. 2 shows, 45.7% of the area deforested was in polygons 10–50 ha in area, 15.6% in those with 50–100 ha, 19.2% with 100–500 ha, and 3.6% over 500 ha, including three polygons larger than 1000 ha.

Cumulative deforestation (2013–2018) of the 20 settlement projects with largest cumulative area in the Brazilian Amazon divided by class of polygon size. Sources: Brazil, INPE Instituto Nacional de Pesquisas Espaciais (2020), and Brazil, INCRA Instituto Nacional de Colonização e Reforma Agrária (2015)
Studies have reported that isolation, lack of infrastructure and land titling, and poor implementation of public services lead to high lot turnover, with colonists illegally selling their farm lots to more-capitalized farmers (Fearnside 1989, 2001; Ludewigs et al. 2009; Parry et al. 2010; Carrero and Fearnside 2011). This farm turnover has promoted land concentration in settlements in Pará (Fearnside 1986, 2001; Pacheco 2009; Godar et al. 2012), Amazonas (Carrero and Fearnside 2011), Rondônia (Fearnside 1989), and Acre (Franco and Lima 2008; Ludewigs et al. 2009). Nevertheless, the questions of how land accumulation occurs and evolves over time and how it contributes to the local economy have not been well explored by scholars.
Capitalized actors from urban areas have been investing in buying farms in settlement projects (Simmons 2004; Carrero and Fearnside 2011; Yanai et al. 2020). These become medium and largeholders who benefit from being in settlements because it allows them to use the labor pool and infrastructure in these areas, as well as helping them hide from law enforcement because they are harder to find when their landholding is a collection of small lots surrounded by those of smallholders (Alencar et al. 2016). Worse, in special settlements such as PDSes or PAEs, the land is not officially separated into individual farm lots, which makes it more challenging to find the real culprits for deforestation.
We now address the case of PA Rio Juma in Apuí as an example of how settlements have contributed to the agricultural expansion in southern Amazonas and other recent deforestation frontiers. By analyzing colonization and deforestation trajectories of households in this settlement, we provide an account of the mechanisms through which deforestation decision-making responds to economic and policy shifts and find evidence of why deforestation has been accelerating in the region.
Materials and Methods
The Study Area
Apuí municipality in southeastern Amazonas (7.20° S latitude, 59.89° W longitude) has annual precipitation between 2200 and 2800 mm, and a yearly average temperature of 26 °C. The predominant soil type is red-yellow latosol in the Brazilian classification (a haplic ferralsol) (Brazil, EMBRAPA Empresa Brasileira de Pesquisa Agropecuária 2006). Apuí encompasses 54,240 km2, of which 67% is in state and federal protected areas. Apui’s population totaled 22,000 inhabitants in 2018 (Brazil, IBGE Instituto Brasileiro de Geografia e Estatística 2018). The primary sector represented 55% of its gross domestic product (GDP) in 2016 (Brazil, IBGE Instituto Brasileiro de Geografia e Estatística 2018), mainly from cattle ranching, with more than 160,000 head in 2015 (da Silva and Carrero 2017). Around 25,000 animals are slaughtered yearly (Carrero et al. 2015), and annual milk production totals 7.5 million liters (da Silva and Carrero 2017). Credit for cattle ranching has been a significant government investment in Apuí, with R$6 million (US$1.5 million) in 2013 alone (Carrero et al. 2014).
Apuí was declared a municipality in 1987. It grew from the central village of the PA Rio Juma settlement, created in 1982. The settlement represents roughly 12% of Apuí’s area, is located along a 150-km stretch of the Transamazon Highway (BR-230), and has more than 140 access roads (“vicinais”) totaling roughly 1300 km. Unpaved roads make travel to neighboring towns take at least 4–6 h during the dry season when road conditions are relatively good. However, during the rainy season (December to April), the same trips may take several days, or the roads may be impassable for weeks, thus jeopardizing the local economy. Such conditions make transportation of agricultural output from rural properties—either to the town of Apuí or to more distant markets—time-consuming and more expensive than in most of Brazil’s agricultural areas.
PA Rio Juma’s area was initially composed of 98% ombrophilous (“shade-loving” or closed) rainforest; 50.3% dense submontane, and 47.7% open lowland forests with palms (Brazil, IBGE Instituto Brasileiro de Geografia e Estatística 2004) with average total biomasses (above + belowground) of 385 and 363 Mg ha−1, respectively (Table 5 in Nogueira et al. 2008). Species of economic interest in submontane forests include Handroanthus spp., Cedrela spp., Parkia spp., Dinizia excelsa Ducke, Bertholletia excelsa Bonpl., and Aniba rosaeodora Ducke, whereas in open lowland forests include Copaiffera spp, Caryocar villosum (Aubl.)Pers., and the palms Euterpe precatoria Mart., Oenocarpus spp., and Mauritia flexuosa (L.f) (Carrero et al. 2017).
Mapping Deforestation in the Farm Lots of PA Rio Juma
The PA Rio Juma layer was obtained from an INCRA cartographic map of polylines at 1:100,000 scale. The polylines are subsequently converted into polygons of farm lots. We applied a 5-km buffer surrounding the 420,243-ha area of demarcated lots to delimit a study area totaling 700,338 ha. Each lot was assigned a unique identifier resulting in 5424 unique lots totaling 420,243 ha (Fig. 3). The area encompassing all individual farm lots includes some medium and large landholdings that predate the settlement’s creation.

Deforested areas in the Rio Juma settlement project and its 5-km buffer from 1981 to 2016. All farm lots (n = 5424) appear outlined in gray
We used 13 remotely sensed images from Landsat 5, 7, and 8 (path 230, row 65), Landsat 2 (path 247, row 65), and ResourceSat-2 (path 314, row 83) (Table 1) to analyze PA Rio Juma´s deforestation. Images downloaded from the Division for Imagery Generation of Brazil’s National Institute of Space Research (http://www.dgi.inpe.br/CDSR/) are shown in Table 1Footnote 1. The deforestation polygons were delimited by visual interpretation at a fixed scale of 1:30,000 using a false-color composition (shortwave infrared-Red, near-infrared-Green, and red-Blue), producing an information layer for each date. Polygons of deforestation were drawn over all visible areas of bare soil on the image. This layer was used together with the next image, and a group of polygons for the next image was drawn. Polygons in each subsequent year were overlaid with the polygons of the previous year and then clipped to ensure no overlap of deforestation between information layers. Areas of non-forest vegetation (savanna) identified by PRODES (Brazil, INPE Instituto Nacional de Pesquisas Espaciais 2020) were not included in the total deforested area. The resulting map represents the total cumulative deforestation. This does not consider as “deforestation” the clearing of vegetation under secondary regrowth.
The minimum unit manually mapped was 1200 m2 (0.12 ha, or four pixels of 30 × 30 m), which is smaller than the minimum unit used by the National Institute for Space Research (INPE) in its PRODES dataset, which is 6.25 ha (Brazil, INPE Instituto Nacional de Pesquisas Espaciais 2020). Although impractical in large areas, our manual mapping method identifies areas deforested by smallholders, which is considered to be critical for our analysis. Even though small areas are needed, in order to control for possible geolocation errors we excluded polygons smaller than 1 ha (i.e., 2.5% of the total deforested area mapped). To restrict consideration to farm lots that are actively being managed, the analysis considered only those with more than 2 ha of cumulative deforestation by 2016. This value is based on the size of the area that newly arrived families clear in a year using only family labor for planting annual crops (e.g., Moran 1981; Fearnside 1986; Vosti et al. 2002).
Deforestation Trajectories in PA Rio Juma
The deforested area was used to conduct temporal analyses over 35 years in three different units or scales: first, for the entire landscape of PA Rio Juma and its 5-km buffer; second, for the farm lots across cohorts or groups of landholdings representing the same occupation period; and lastly, for the landholdings of households, meaning that the same household may have one or several farm lots. By looking into these three units of analysis, nesting farm lots and households in regional, spatial, and temporal scales, we shed light on what processes contribute to forest clearing over time. Scholars usually depict these as three different groups of processes related to deforestation: the time of arrival (“cohort effect”), the farm land-use consolidation (“aging effect”), and external events, which are shaped by policies and economic impacts of particular periods (“period effects”) (for more detail, see Perz 2001; Brondizio et al. 2002; Walker 2004). There is a fourth process related to a spatial effect of economies of agglomeration and the role of new institutional economics, in which clustering farms could help with market information and innovation exchange and could affect deforestation either positively or negatively at a given location (Jepson 2006; Garrett et al. 2013; Richards 2017).
Regional Deforestation and Colonization Phases
We present an analysis of colonization and deforestation trajectories for PA Rio Juma contrasted with what has happened in Brazilian Amazonia as a whole (represented by the arc of deforestation). Qualitative data were gathered during a 5-day workshop held in April 2017 in Apuí, which was attended by 25 local leaders and by staff of state and local government institutions, labor unions, the private-sector, and civil society. Attendees built a shared vision for past, present, and future development scenarios for Apuí. The workshop was conducted as a participatory process that exposed triggers of socioeconomic development and land-use change, as well as interests, perspectives, and positions among the different actors. Workshop participants divided Apui’s history into five main phases of colonization to reflect the successive waves of migration to the area: Phase 0—pre-settlement occupation (<1981); Phase 1—first colonist wave to PA Rio Juma (1982–1992); Phase 2—second colonist wave (1992–2002); Phase 3—capitalized farmers’ wave (2002–2010); and Phase 4—highly capitalized actors’ wave (2011 to present).
Modeling Deforestation at the Farm-Lot Level across Cohorts
We used generalized additive models (GAMs) for analyzing the quantity and frequency of deforestation in lots grouped into cohorts by the time of first deforestation, where the impact of the predictive variables is captured through nonparametric smoothing terms. We fit two models using the mgcv package in R software (Wood 2018). For Model 1, we used only farm lots smaller than 200 ha (n = 4516) to control for the size of clearings. The dependent variable was the annual area deforested (ha) in each lot for each period, that is, the total area deforested in the period divided by the number of years in the period (Table 1). Model 1 relies on a scaled t model to account for potential outliers (Wood et al. 2016). Model 2 is a logistic regression that considers the presence or absence of deforestation in each farm lot in each period as the dependent variable. We used all farm lots with more than 2 ha of cumulative deforestation by 2016 (n = 4546) for Model 2. Both models relied on smoothing splines, in which a 2D penalized thin-plate spline on the geographical coordinates is used to account for spatial correlation, and a 1D penalized cubic spline is used to model time trends (Wood 2018). We ran both models for all lots together and for the lots grouped into cohorts corresponding to Phases 0–4.
Deforestation by Class of Landholding Size per Household
We analyzed a combined sample of 407 households. Using the official metric of “fiscal modules” of land defined by INCRA, which in Apuí is 100 ha, we divided households into classes of microholders (up to 100 ha), smallholders (100–400 ha), medium holders (400–1000 ha) and largeholders (1000–6000 ha) (see Landau et al. 2012), where, for instance, if a household possesses 400 ha it would be placed in the smallholder group. Data on landholding size per household were combined from three sources. One is the household survey presented in Carrero and Fearnside (2011), which consists of a random sample (n = 83) that has all landholding size classes. The other consists of household surveys of 315 households classified as “colonists” (settlers officially settled through the agrarian-reform program) surveyed from 2014 to 2016 by the Institute for Conservation and Sustainable Development of the Amazon, a Brazilian nongovernmental organization that officially provided technical assistance to colonists. The third source comes from open interviews conducted in 2017 and 2019 with twelve key long-term local informants who were able to identify landholdings and draw them on cartographic maps of PA Rio Juma using high-resolution 2016 satellite imagery from Sentinel II. These informants also provided information on the costs and labor arrangements for forest clearing presented in the results. Deforestation data were overlaid on the farm lot or lots comprising each landholding, and descriptive statistics for the area were calculated for subsets of the data based on landholding sizes and colonization phases. An analysis of variance was used to compare the means of annual deforestation among the colonization phases and among landholding sizes, with Tukey HSD used to distinguish differences between means.
Results and Discussion
In this section we first present the colonization process in the Rio Juma settlement and its deforestation trajectory, which contrasts with what happened in the Brazilian Amazon as a whole. Second, we present the deforestation trajectories of cohorts of lots divided by periods of occupation. We then present and discuss the contribution of the landholding size classes per household to forest clearing over time, as well as the region’s deforestation economy. Finally, we discuss the current underlying forces of deforestation in Brazil and the mechanisms through which these forces affected land-use change in PA Rio Juma.
Colonization and Deforestation in PA Rio Juma
Thirteen lot sub-cohorts were generated based on the year in which farm lots first reached the threshold of 2 ha deforested. These sub-cohorts were grouped into five cohort classes totaling 4546 farm lots (Table 2) averaging 77.7 ha (SD ± 49.2), representing the pre-colonization phase and four colonization phases according to the workshop results. The spatial configuration of the colonization process in PA Rio Juma is presented in Fig. 4, where the farm lots are colored by the period of occupation related to the colonization phases.

Farm lots with >2 ha deforested by 2016 (n = 4546) in the Rio Juma settlement divided into five cohorts or colonization phases. Lots are color-coded based on the year interval (phase of colonization) in which they first deforested more than 2 ha
The total cumulative area deforested within the 5-km buffer by 2016 was 217,556 ha, which comprises more than 80% of the total deforestation in the municipality of Apuí (Brazil, INPE Instituto Nacional de Pesquisas Espaciais 2020). PA Rio Juma’s deforestation trajectory is overlaid with the trajectory in the Brazilian Amazon in Fig. 5, showing that the first peak of deforestation in the Brazilian Amazon in 1995, a result of macro-economic effects (i.e., Plano Real economic stabilization), appears to be reflected in Apuí with a delay of 2 years. In PA Rio Juma the first peak (1996–1998) during Phase 2 was enlarged by the massive arrival of a second colonist wave with the occupation of 1954 farm lots (42% of all occupied farm lots); deforestation also increased thanks to optimal conditions for burning the felled forest due to prolonged dry seasons induced by the El Niño phenomenon (1997–1998). This phase was also marked by the first investments in perennial crops (coffee and cacao) by the Program for Special Credit for Agrarian Reform (PROCERA) under the Constitutional Fund for Financing in the North. A significant portion of these crops failed due to lack of experience in farming in the Amazonian region and lack of market access, leading some colonists to abandon their landholdings or to switch to cattle ranching (Carrero 2009).

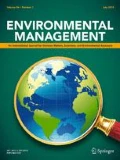
Average annual deforestation in the Brazilian Amazon and in the Rio Juma settlement (including its 5-km buffer) in each phase of colonization (year intervals). The Brazilian Amazon average deforestation rates were taken from Brazil, INPE Instituto Nacional de Pesquisas Espaciais (2020), obtained from summing those in each year interval (e.g., 1982–1985) divided by the number of years in the interval. Deforestation rates in the Rio Juma settlement are based on satellite imagery interpreted in the present study
Similarly, deforestation in PA Rio Juma’s second deforestation peak (2006–2007), in Phase 3, was also delayed by 2 years when compared to the peak in the Brazilian Amazon (2004). The 2004 Amazon-wide deforestation peak reflected investments in cattle and soy expansion and intensification in response to growing global demand (Walker et al. 2009; Pacheco and Poccard-Chapuis 2012). To respond to this peak, the government created the Plan of Action to Prevent and Control Deforestation in Legal Amazonia in the same year, with surveillance concentrated in Mato Grosso, Pará, and Rondônia. Furthermore, Amazonas had a substantial reduction in the price of arable land in 2006, while other regions had increased prices (Gasques and Bastos 2008). The abundant unregulated lands with little surveillance in southern Amazonas were a major attraction for those seeking to capture rents from land and cattle in Amazonia (Carrero and Fearnside 2011; Waroux et al. 2017; Faleiros and Sá 2018). Ranchers in areas where soy plantations flourished sold their land to soy farmers and moved northward to areas where abundant forestland was available at low prices (Barona et al. 2010; Arima et al. 2011; Walker and Richards 2013). In Apuí this migration is evident as shown by Carrero and Fearnside (2011), where 41% of sampled households migrated from Rondônia in the 2000s and bought farms from colonists or occupied forested lands, thus helping speed forest clearing and land accumulation with the purchase of multiple farm lots. For old residents, the adoption of cattle ranching can be explained in part by the socioeconomic life-cycle theory of colonists, known as the “aging effect” related to household economic activities. The aging effect results in families that started with annual crops later switching to perennial crops and pasture (e.g., Brondizio et al. 2002; McCracken et al. 2002; Walker et al. 2002, 2003). Cattle-ranching investments and credit were much less pronounced in Apuí than in other areas because the outputs of ranching were not export-oriented. Nevertheless, a dairy plant was constructed, and credit lines (state and federal) were available to promote raising cattle for both beef and dairy, which might have influenced the deforestation peak in 2006–2007.
The most striking trend was the steep increase in deforestation in PA Rio Juma at the end of the “Phase 4” period, rising from 99 km2 year−1 in 2013 to 241 km2 year−1 in 2016—an increase of 143% (Fig. 5). In comparison, for Brazilian Amazonia as a whole in this period rose from 5981 to 7893 km2 year−1, an increase of 34% (Brazil, INPE Instituto Nacional de Pesquisas Espaciais 2020). The most critical policy change in the period was the weakening of environmental protection through the approval of the new Forest Code (Law 12,651 of 2012) that pardoned illegal deforestation done up to 2008. This trend suggests that PA Rio Juma amplified what had been dominating land-use change in the Brazilian Amazon since 2012, as this area is representative of the agricultural frontier. Workshop participants claimed that PA Rio Juma was invaded by very wealthy individuals and other capitalized groups that are amassing large areas (dozens of farm lots at once) as the most significant contributors to the high deforestation rates recently reported. We will discuss this current trend in more detail after exploring the deforestation trajectories of farm lots and cohorts.
Deforestation Trajectories for Cohorts of Farm Lots in PA Juma
The GAM results for Models 1 and 2 indicate that time and location were statistically significant variables when considering deforestation for all lots (cohorts) (p < 0.001). Interestingly, there were very similar period effects across all cohorts in both models (Fig. 6). This trend of very marked period effects influencing all lots is shown in the top row of each graph in Fig. 6, with narrow dashed lines representing the 95% confidence intervals.

Results of Model 1 for deforestation/year (ha) in farm lots <200 ha in area for all lots, and for lots grouped into cohorts representing five phases of occupation of the Rio Juma settlement; results of Model 2 for the proportion of lots deforesting per period, for all lots, and for lots grouped by cohorts representing five phases of occupation. Solid lines are the predicted means and dashed lines are the 95% confidence intervals
Model 1 shows that deforestation rates are higher in the lots of more-recent cohorts (3 and 4). The initial rates show similar patterns for Cohorts 0, 1, and 2, remaining at <2 ha year−1 (on average) up to the 2000s. Also, Cohorts 1 and 2 have much narrower 95% confidence intervals, which might be due to greater homogeneity of the landholders (i.e., the first and second waves of the original colonists). Cohort 4 exhibits an annual average area deforested per farm lot that is double that of other cohorts, with high variation. Lots in this cohort could be part of small, medium, or large ranches that consist of several lots and are performing more extensive forest clearings.
The logistic regression GAM model (Model 2) shows the proportion of lots that had deforestation activity in each period. Similar to the results for Model 1, both location and time were highly significant variables for all cohorts (p < 0.001). Cohorts exhibit similar valleys in 1992, 2007, and 2015, and peaks in 1998, 2010, and 2016, indicating similar period effects on the proportion of lots being cleared across all cohorts. Again, there is a much greater width of the 95% confidence intervals for Cohorts 0, 3, and 4, whereas Cohorts 1 and 2 have much narrower intervals. The higher heterogeneity for Cohort 0 is likely because the model does not account for deforestation that took place from 1974 to 1981.
Migration waves affected the rates of colonization and farm-lot occupation, whereas the trajectories of deforestation rates and events appear to be most affected by period effects influencing all farm lots, although with different intensities. The results suggest weak effects related to household characteristics and occupation (i.e., aging effect and cohort effect) than would be expected based on the colonist footprint (Brondizio et al. 2002). In Apuí, this can be understood when we consider the high percentage of lot turnover (77%) (Carrero and Fearnside 2011). Thus, because most farm lots changed hands at least once and often many times, deforestation and farm consolidation processes do not reflect the action of one single household, but rather of successive households over time. This high lot turnover in the remote area of PA Rio Juma seems to be related to the contagious nature of the deforestation process, which is dispersed through roads to areas that lack formal protection (Pfaff et al. 2007; Rosa et al. 2013) and have relatively easy access to land available to be either claimed or bought at low prices (Waroux et al. 2017).
Deforestation by Household Area Class
Land and total cumulative deforestation by the 407 household samples are presented in Table 3, resulting in 38,695 ha (59% of the total area analyzed) being deforested by 2016. Largeholders represented 2% of landholders but were responsible for 29% of deforestation. The sample includes practically all colonists who were officially settled by INCRA and were still in compliance with its regulations (315 households). Thus, although informative, the results misrepresent the current proportions because they consider most of the micro-landholders but only a few households of other classes. Out of the 315 colonist households, 290 own only one farm lot. Thus, small, medium, and large landholders who are not INCRA-settled colonists might own all other occupied lots (around 4200). Considering the total area occupied in 2016 (353,267 ha, Table 2), colonists represented <6% of this area, and they were not responsible for most of the deforestation.
Average annual deforestation per class of landholding over time is presented in Fig. 7. Household means of Phases 3 (2003–2010) and 4 (2011–2016) were significantly different (TSD Tukey test, p < 0.05) from Phases 0, 1, and 2, which did not differ significantly from each other. All differences between deforestation means of the different landholding area classes were highly significant (p < 0.01), although when microholders were compared to smallholders, the significance was 0.02, still below 0.05.

Annual average deforestation per class of household in each phase of colonization in the Rio Juma settlement
Apuí’s Deforestation Economy and Actors
Based on the key-informant interviews, households of all sizes depend on hiring labor for deforestation through informal agreements that average R$645 per hectare deforested, burned, and sowed with grass seeds. Smallholders usually count on household manual labor, allowing these families to reduce their cash outlays to R$269 (US$62) per hectare. Medium and largeholders form groups to jointly hire the services of small airplanes for areas larger than 100 ha, which reduces costs of labor input by 25–40%, depending on the distance from the airport. Back-of-the-envelope calculations suggest that forest clearing and pasture formation activities in 2016 poured R$10.32 million (US$3.17 million) into local markets for tools, equipment, seeds, fuel, and labor. Without considering logistical costs and revenues from illegal logging, this amount corresponds to 29% of the municipality’s GDP from services in that year (Brazil, IBGE Instituto Brasileiro de Geografia e Estatística 2018).
All landholders’ investments in deforestation must come from external sources because returns from current activities on their properties do not provide enough capital (Margulis 2003, p. 41). While micro and smallholders often raise money by working for others or having community positions in education and health, medium landholders have other economic activities besides the ranch, such as small or medium market enterprises or a paid job (Carrero and Fearnside 2011). Largeholders who are residents of Apuí invest in deforestation using resources from businesses such as retail stores, gas stations, and the processing and logistics companies that buy and transport much of Apuí’s agricultural production and external inputs. These actors are wealthy, active, respected citizens who have local political influence. Most of these largeholders either officially completed most of their deforestation before 2008 or bought titled farms with areas cleared before that year. For large landholders who do not reside in Apuí, our local informants reported that these absentee largeholders use funds from sources such as urban commercial establishments, money laundering, and misappropriation of public funds. Although it is not possible to infer how much each of these sources contributes to the advancement of large-scale deforestation in Apuí, it is highly likely that illegal sources are present and causing extensive deforestation, such as a single 1200-ha polygon deforested in June 2018 (Weisse and Lyons 2018; Brazil, INPE Instituto Nacional de Pesquisas Espaciais 2020). We documented evidence that these groups offset deforestation costs by selling standing trees to loggers. Loggers use subterfuges to make illegal timber appear to be legal (known as “warming-up” the timber) and sell it on international markets (Brindis 2014; Brancalion et al. 2018; Keating 2018; Carvalho et al. 2019).
Political and Economic Effects on the Current Deforestation Scenario
A combination of political and economic factors is motivating the current increase in deforestation rates in tropical forests. This increase is rooted in the shift from state-sponsored to export-oriented industrial-scale deforestation for agricultural production (Rudel et al. 2009; Lambin and Meyfroidt 2011; Austin et al. 2017). In the Brazilian Amazon, after a period of reduced deforestation (2005–2012), these economic forces have rebounded and deforestation rates have been rising since 2012 (Brazil, INPE Instituto Nacional de Pesquisas Espaciais 2020). A significant part of this increase is due to the political power of the “ruralists,” a coalition of legislative representatives of large landowners and agribusiness interests. These politicians have taken the lead in the National Congress and since 2012 have been pushing constitutional amendments that weaken environmental protection and facilitate infrastructure development and agribusinessFootnote 2 (Metzger et al. 2010; Soares-Filho et al. 2014; Fearnside 2016, 2017a, b; Tollefson 2018). The ruralists’ impact on legislation has increased substantially since president Jair Bolsonaro took office in January 2019 (Ferrante and Fearnside 2019)Footnote 3. The resulting changes in the laws undermine the likelihood of future compliance with environmental measures that are preconditions for the many investments in infrastructure being made in the region (Meirelles et al. 2018; Simmons et al. 2018). The infrastructure also prompts more migration (Perz et al. 2010).
We argue that these changes in markets, policies, and institutions influence local processes related to deforestation with greater intensity on agricultural frontiers that have abundant forestland, such as Apuí, where deforestation has sky-rocketed since 2016. More roads, higher agricultural prices, lower wages, and shortages of off-farm employment generally lead to more deforestation (Angelsen and Kaimowitz 1999; Chomitz 2007; Pfaff et al. 2007). A local complicating factor has been the population’s misinterpretation of the conflicting federal and state laws concerning land titling and environmental issues, which has led Apuí residents to deforest more (Cenamo and Lima 2015)Footnote 4.
Amazonas produces only 30% of the beef its population consumes (Carrero et al. 2015), and, assuming no intensification, the state would have to increase its area of pastures at the expense of forests to meet its domestic demand for consumption. Increased deforestation for pasture has also been motivated by Amazonas State having gained its long-awaited status of being free of foot-and-mouth disease, which was declared in December 2017 (Brazil, MAPA Ministério da Agropecuária e Abastecimento 2017). With the prospect of exporting frozen beef and live animals to other states and countries, Amazonas might now expand pastures for cattle fattening by largeholders and produce calves among smallholders as an input for more productive areas in other states. This new exporting opportunity triggers forces that foreshadow increased forest clearing for pasture establishment, corroborated by the fact that Apuí’s deforestation in 2019 totaled 288.7 km2, or 69.8% more than its previous record in 2017 (Brazil, INPE Instituto Nacional de Pesquisas Espaciais 2020).
Finally, the relative improvement in infrastructure, services, and credit has spurred the growth of the rural sector in Apuí, enabling products to supply the Manaus market and stimulating investments in the rural economy in a positive-feedback process (Sathler et al. 2018). By clearing more land for agricultural expansion, household assets grow via increases in income, which results in the accumulation of wealth over the long term (Mullan et al. 2017). In sum, economic and political momentum has enabled households to clear larger patches of forest independent of landholding size. The activity of large landholders has significantly increased in an attempt to capture land and production rents. Recent changes in laws (Fearnside 2020) signaled that illegal deforesters will again be pardoned in future “amnesties” (as many violators were in 2012 under the new Forest Code), in addition to the presumption that they would not be caught due to the paucity of law enforcement.
Land-Tenure Insecurity and Land Speculation
For researchers focused on frontier land-use change, tropical forests are considered to be open-access resources, and the agents deforest if the costs involved lead to additional profits, whether from agriculture or from land sales (Rindfuss et al. 2007; Barbier et al. 2011). The lower and middle-income tropical countries are experiencing foreign investors acquiring large swathes of land for agricultural development that already totaled forty million hectares (Agrawal et al. 2019). Such land grabs also occur in Brazil, where land tenure and regulation represent an unsolved issue that has persisted for centuries, contributing to high land concentration and unproductive latifundios (very large estates), and promoted continuous speculation in markets for rural properties (Deininger and Byerlee 2012; Sauer and Leite 2012; Reydon et al. 2015).
Brazil has fifty-four to sixty-five million hectares of undesignated public lands that are open to land grabbing (Azevedo-Ramos and Moutinho 2018; Sparovek et al. 2019). Any expenditure made in public forestland (e.g., clearing forest and planting pastures) increases its value, an effect that is even greater in landholdings without land titles (Reydon 2011; Sauer and Leite 2012). Thus, lack of secure land tenure and the unsustainable nature of rural settlement policies promote high deforestation rates and represent essential underlying factors of deforestation in the Brazilian Amazon (Alston et al. 1995, 2000; Fearnside 2001; Caviglia-Harris and Harris 2011; Alencar et al. 2016; Moutinho et al. 2018). Lack of property rights and weak government control of forests rich in timber and minerals induce the typical behavior of a race for rent-seeking from extractive activities, with short-term, high-payoff investments (Barbier 2004).
Only 18% of the households in Apuí had land titles in 2008 (Carrero and Fearnside 2011), and many colonists and capitalized ranchers who bought land claims only have as documentation an INCRA registration or a purchase contract that has no legal value (contrato de gaveta). Both titled and untitled landholdings have often been sold to newcomers, while public forest areas became new pasturelands and ranches, thus expanding the land markets. INCRA’s lack of personnel and resources to do inspections for issuing titles in this region, where lot turnover and land accumulation are persistent, has resulted in a legal imbroglio that has been awaiting a solution for decades. The land-tenure system in the Amazon is a central institutional failure that favors excessive deforestation and might push forest loss beyond what would otherwise be possible (Grainger 1995; Barbier et al. 2011; Reydon et al. 2015). Brazil must end its practice of “regularizing” illegal land claims if the country is to end the pattern of invasion, deforestation, and subsequent titling that continues to drive forest loss in Amazonia (Fearnside 1979, 2001). Deforestation is considered an “improvement” (benfeitoria), helping to justify granting land titles.
Legislative changes led by the ruralists have favored speculative land markets. The most important was MP-759 of 2016, known as the “Provisional Measure for Land Grabbing,” later converted to Law 13,465 of 2017. This law modified a number of laws with the result that land titling was facilitated for the large holdings of rural elites, with payments to the government for illegally occupied land at prices well below market value; the law also regularized illegal land sales in settlement projects (Sauer 2017; Leite et al. 2018). On the one hand, these laws might temporally solve some old barriers to land titling in the Amazon. It could reduce lot turnover because titled lands cannot be sold before 10 years. On the other hand, these changes significantly increase the possibility of land titling occurring after illegal occupation. This scenario attracts more actors seeking rents from land speculation, after which the land could be subdivided into parcels and sold to small farmers.
On 10 December 2019 President Bolsonaro issued a provisional measure (MP-910) allowing titles to be granted for illegal land claims on the basis of a mere “self-declaration.” Provisional measures remain in effect for 120 days, after which their continued validity requires a congressional vote. In April 2020, at the end of the temporary period, the measure was converted to a proposed law (PL-2633/20) known as the “land-grabbers’ law” (lei da grilagem) (Fearnside 2020). Approval is likely given the presidential administration’s support and the strong ruralist influence in the National Congress.
In sum, land speculation in southern Amazonas is more attractive than in the arc of deforestation. It materializes in Apuí as investments by wealthy newcomers, anticipating infrastructure improvements have moved from regions with higher conservation-policy governance. Land grabbing is particularly evident in PA Rio Juma, where large landholdings (1000–6000 ha) are present in a settlement that is supposed to have only micro landholdings (up to 100 ha). The impact of land concentration in speeding deforestation and undermining agrarian-reform objectives has also been found in the PA Matupi settlement area, also in southern Amazonas (Yanai et al. 2020). Thus, land speculation is still a crucial deforestation factor (Mann et al. 2014). Speculation makes extensive cattle ranching highly profitable on remote forest frontiers in Amazonia (Bowman et al. 2012; Miranda et al. 2019).
Conclusions
This study unveils processes of land accumulation and the economic importance of deforestation in frontier areas in the Brazilian Amazon where settlement projects function as centers that agglutinate agents of forest destruction. The empirical findings provide evidence that these processes reflect changes in the national economy and in policies on the environment, agriculture and agrarian reform, as well as the dynamics of migration. Annual rates of deforestation (either for all lots together or for each cohort) show apparent period effects, rather than following patterns based on the time the lots have been occupied. Up to 2012, the deforestation trajectory in the Rio Juma settlement project followed the same trend as deforestation rates in Brazilian Amazonia as a whole, but with a delay of 1–2 years, reflecting similar political and economic period effects.
Apuí is a deforestation hotspot where annual rates of clearing have been increasing much faster than in Brazilian Amazonia as a whole. The findings reported for the Rio Juma settlement confirm that the areas deforested in hectares per lot and per household have increased sharply, similar to what has been observed in other highly deforested settlement projects in Amazonia. All sizes of landholdings are deforesting much more than before; the Rio Juma settlement has evolved from an area intended for agriculture by “micro” farmers living in isolated conditions to a regional center of cattle ranching that is market-oriented.
What seems to be different, though, is that the current scenario of mounting deforestation in Apuí stems from wealthy individual and group actors who are investing in forest clearing and pasture formation, illegally amassing dozens of farm lots in the Rio Juma settlement as a form of land speculation, likely using undeclared funds (money laundering). With both a strong coalition of “ruralists” in the National Congress and the presidential administration signaling impunity regarding deforestation, southern Amazonas is being incorporated into the “arc of deforestation” as this area of intense clearing activity spreads northward from the southern edge of the Amazon biome.
The findings of this study have significant implications for future research and policies on Amazonia’s current frontiers. We identified the need to deepen our understanding of the processes of illegal possession of public lands on this agricultural frontier. In addition to individuals investing in agricultural production, there appears to be an array of actors involved in land grabbing. Important questions remain unanswered. Who are the actors and what are their roles for grabbing public lands? What is the source of capital inflow to the region and how does it affect labor regimes and social and environmental outcomes? How do different actors coordinate to exploit land and natural resources for speculative purposes? Research efforts focused on finding such answers will offer insights into the role of the illegal land trade on agricultural expansion and environmental change in Amazonia, allowing better responses to the current scenario by those policymakers who see environmental protection as important.
Notes
The images were manipulated in a GIS environment (ArcGIS 10.1) using UTM planar coordinates (Zone 21S) and datum SAD 69. All images were georeferenced using control points obtained in the field surveys, and associated with the mosaic of images of Sentinel 2A (scenes T20MQS, T20MQT, T20MRS, T20MRT, and T21MRN) in RBG composition 438, from 6 August 2016 downloaded from the Copernicus sci-hub website. The images used are virtually cloud free over the study area.
As one of the major moves toward the “flexibilization” of laws, Provisional Measure (MP) 867 would completely dismantle the Forest Code, removing obligations such as the need to restore around five million hactares of forests in areas that were illegally deforested (before 2000) outside Amazonia, and, unless formally notified, landholders would be exempted from registering in the “Rural Environmental Registry” (CAR) under the Program of Environmental Regularization (Domingues 2019). These measures will not be well received by the 5.6 million landholders who have registered in the CAR Program since it was launched in 2012, as it would reward those who have not registered, pardoning their environmental crimes.
This extreme conservative president has been using authoritarian measures to dismantle environmental protection and education programs and the government’s environmental agencies, as well as pushing proposed laws and constitutional amendments that promote resource extraction (minerals, oil, and agribusiness) for export at the expense of environmental destruction (Ferrante and Fearnside 2019; The Guardian 2019a, b).
This refers to the Rural Environmental Registry (CAR), a law that regulates environmental status of a farm. Lack of information, misinterpretation, and confounding land titling with environmental laws have led many families in Apuí to believe that they could deforest more before adhering to the CAR (Cenamo and Lima 2015), and the results show that they did, indeed, deforest more.
References
Agrawal A, Brown DG, Sullivan JA (2019) Are global land grabs ticking socio-environmental bombs or just ineffient investments? One Earth 1:159–162
Alencar A, Pereira C, Castro I, Cardoso A, Souza L, Costa R, Bentes AJ, Stella O, Azevedo A, Gomes J, Novaes, R (2016) Desmatamento nos assentamentos da Amazônia: histórico, tendências e oportunidades. Instituto de Pesquisas Ambientais da Amazônia (IPAM), Brasília, DF, Brazil, p 93
Alston LJ, Libecap GD, Schneider R (1995) Property rights and the preconditions for markets: the case of the Amazon frontier. J Inst Theor Econ 151(1):89–107
Alston LJ, Libecap GD, Mueller B (2000) Land reform policies, the sources of violent conflict, and implications for deforestation in the Brazilian Amazon. J Environ Econ Manag 39(2):162–188. https://doi.org/10.1006/jeem19991103
Aldrich S, Walker RT, Simmons CS, Caldas MM, Perz SG (2012) Contentious land change in the Amazon’s arc of deforestation. Ann Assoc Am Geogr 102(1):103–128
Angelsen A, Kaimowitz D (1999) Rethinking the causes of deforestation: lessons from economic models. World Bank Res Obs 14:73–98
Araújo FC (2006) Reforma Agrária e gestão ambiental: encontros e desencontros. PhD thesis, University of Brasília, Brasília, DF, Brazil, https://repositorio.unb.br/handle/10482/2541
Arima EY, Richards P, Walker R, Caldas MM (2011) Statistical confirmation of indirect land use change in the Brazilian Amazon. Environ Res Lett 6(2):024010. https://doi.org/10.1088/1748-9326/6/2/024010
Arraut JM, Nobre C, Barbosa HMJ, Obregon G, Marengo J (2012) Aerial rivers and lakes: looking at large-scale moisture transport and its relation to Amazonia and to subtropical rainfall in South America. J Clim 25:543–556. https://doi.org/10.1175/2011JCLI4189.1
Asher C (2020) Catastrophic Amazon tipping point less than 30 years away: study. Mongabay series. https://news.mongabay.com/2020/01/catastrophic-amazon-tipping-point-less-than-30-years-away-study/
Austin KG, Gonzalez-Roglich M, Schaffer-Smith D, Schwantes AM, Swenson JJ (2017) Trends in size of tropical deforestation events signal increasing dominance of industrial-scale drivers. Environ Res Lett 12:054009
Avissar R, Werth D (2005) Global hydroclimatological teleconnections resulting from tropical deforestation. J Hydrometeor 6:134–145
Azevedo-Ramos C, Moutinho P (2018) No man’s land in the Brazilian Amazon: could undesignated public forests slow Amazon deforestation? Land Use Policy 73:125–127. https://doi.org/10.1016/jlandusepol201801005
Balch JK, Brando PM, Nepstad DC, Coe MT, Silvério D, Massad TJ, Davidson EA et al. (2015) The susceptibility of Southeastern Amazon forests to fire: insights from a large-scale burn experiment. BioSci 65(9):893–905. https://doi.org/10.1093/biosci/biv106
Barbier EB (2004) Agricultural expansion, resource booms and growth in Latin America: implications for long-run economic development. World Dev 32:137–157
Barbier EB (2012) Scarcity, frontiers and development. Geogr J 178(2):110–122. https://doi.org/10.1111/j1475-4959201200462x
Barbier EB, Burgess JC, Grainger A (2011) The forest transision: towards a more comprehensive theoretical framework. Land Use Policy 27:98–107
Barona E, Ramankutty N, Hyman G, Coomes OT (2010) The role of pasture and soybean in deforestation of the Brazilian Amazon. Environ Res Lett 5(2):024002. https://doi.org/10.1088/1748-9326/5/2/024002
Bowman MS, Soares-Filho BS, Merry FD, Nepstad DC, Rodrigues ASSOC, Almeida OT (2012) Persistence of cattle ranching in the Brazilian Amazon: a spatial analysis of the rationale for beef production. Land Use Policy 29:558–568
Brancalion PHS, de Almeida DRA, Vidal E, Molin PG, Sontag VE, Souza SEXF, Schulze MD (2018) Fake legal logging in the Brazilian Amazon. Sci Adv 4(8):eaat1192. 101126/sciadvaat1192
Branford S, Torres M (2017) Getting there: the rush to turn the Amazon into a soy transport corridor. Mongabay series. https://news.mongabay.com/2017/02/getting-there-the-rush-to-turn-the-amazon-into-a-soy-transport-corridor/
Brazil, EMBRAPA Empresa Brasileira de Pesquisa Agropecuária (2006) Sistema brasileiro de classificação de solos, 2a edn. Centro Nacional de Pesquisas de Solos (CNPS) EMBRAPA Solos, Rio de Janeiro, RJ, Brazil
Brazil, IBGE Instituto Brasileiro de Geografia e Estatística (2004). Mapa de Vegetação do Brasil, 3rd edn. Instituto Brasileiro de Geografia e Estatística, Brazil. https://mapas.ibge.gov.br/tematicos/vegetacao
Brazil, IBGE Instituto Brasileiro de Geografia e Estatística (2018) IBGE Cidades: Apuí. IBGE, Brazil. https://cidadesibge.gov.br/brasil/am/apui/panorama
Brazil, INCRA Instituto Nacional de Colonização e Reforma Agrária (2015) Acervo fundiário. INCRA, Brasília, DF, Brazil. http://acervofundiario.incra.gov.br/acervo/acv.php. Accessed 12 Mar 2015
Brazil, INPE Instituto Nacional de Pesquisas Espaciais (2020) Projeto PRODES—monitoramento do desmatamento na Amazônia legal por satélite INPE, São José dos Campos, SP, Brazil. http://www.obt.inpe.br/OBT/assuntos/programas/amazonia/prodes. Accessed 27 Jun 2020
Brazil, MAPA Ministério da Agropecuária e Abastecimento (2017) MAPA reconhece o Amazonas livre de febre aftosa, com vacinação. MAPA, Brazil. http://www.agriculturagovbr/noticias/blairo-maggi-reconhece-o-amazonas-livre-de-aftosa-com-vacinacao-1
Brindis D (2014) Illegal timber from Brazilian Amazon sold all over the world. Greenpeace. https://www.greenpeace.org/usa/new-greenpeace-investigation-illegal-timber-brazilian-amazon-sold-world-legal-paperwork/
Brondizio ES, McCracken SD, Moran EF, Siqueira AD, Nelson DR, Rodrigues-Pedraza C (2002) The colonist footprint: towards a conceptual framework of land use and deforestation trajectories among small farmers in the Amazonian Frontier. In: Wood C, Porro R (eds) Deforestation and land use in the Amazon. Florida University Press, Gainesville, FL, USA, p 133–171
Carrero GC (2009) Dinâmica do desmatamento e consolidação de propriedades rurais na fronteira de expansão agropecuária no sudeste do Amazonas. Masters thesis, Instituto Nacional de Pesquisas da Amazônia (INPA), Manaus, AM, Brazil
Carrero GC, Fearnside PM (2011) Forest clearing dynamics and the expansion of landholdings in Apuí, a deforestation hotspot on Brazil’s Transamazon highway. Ecol Soc 16(2):26. http://Assoc.ecologyandsociety.org/vol16/iss2/art26/
Carrero GC, Albuja G, Cenamo MC, Bettarello MM, Vicente A (2014) Viabilidade econômica da pecuária semi-intensiva no sul do Amazonas, uma oportunidade para reduzir o avanço do desmatamento. Idesam, Manaus, AM, Brazil, http://www.idesam.org.br/viabilidade-economica-da-pecuaria-semi-intensiva-no-sul-do-amazonas/
Carrero GC, Albuja G, Frizo P, Hoffmann EK (2015) A cadeia produtiva da carne bovina no Amazonas. Idesam, Manaus, AM, Brazil, http://www.idesam.org.br/a-cadeia-produtiva-da-carne-bovina-no-amazonas/
Carrero GC, Pereira RS, Jacauna MA, Lima Jr MJV (2017) Árvores do sul do Amazonas: guia de espécies de interesse econômico e ecológico, 2nd edn. IDESAM, Manaus, AM, Brazil, p 111. https://idesam.org/publicacao/idesam-guia-especies_2ed.pdf
Carvalho WD, Mustin, K, Hilário RR, Vasconcelos, IM, Eilers V, Fearnside PM (2019) Deforestation control in the Brazilian Amazon: a conservation struggle being lost as agreements and regulations are subverted and bypassed. Perspect Ecol Conserv. https://doi.org/10.1016/j.pecon.2019.06.002
Caviglia-Harris J, Harris D (2011) The impact of settlement design on tropical deforestation rates and resulting land cover patterns. Agric Resour Econ Rev 40:451–470. https://doi.org/10.1017/S1068280500002896
Cenamo MC, Lima L (2015) CAR no Amazonas—oportunidades e desafios para a gestão territorial: Análise dos 3 anos (2011–2014) de implementação do Cadastro Ambiental Rural. Idesam, Manaus, AM, Brazil, p 56. http://www.idesam.org.br/publicacao/cadastro-ambiental-rural-amazonas.pdf
Chomitz KM (2007) At loggerheads: agricultural expansion, poverty reduction, and environment in the tropical forests. World Bank, Washington, DC, USA, http://site.resources.worldbank.org/INTTROPICALFOREST/Resources/2463822-1161184206155/3060670-1161608416166/PRR-AL_SAOverviewwebnonembargo.pdf
Cochrane MA, Barber CP (2009) Climate change, human land use and future fires in the Amazon. Glob Change Biol 15(3):601–612. https://doi.org/10.1111/j.1365-2486.2008.01786.x
da Silva ACB, Carrero GC (2017) Sistemas silvipastoris com pastejo rotacional: viabilidade técnica e econômica para uma nova pecuária de leite na Amazônia. Idesam, Manaus, AM, Brazil. https://idesam.org/viabilidade-pecuaria-sustentavel-leite/
Davidson EA, Araújo AD, Artaxo P, Balch JK, Brown IF, Mercedes MM, Coe MT et al. (2012) The Amazon Basin in transition. Nature 481(7381):321–328. https://doi.org/10.1038/nature10717
Deininger K, Byerlee D (2012) The rise of large farms in land abundant countries: do they have a future? World Dev 40(4):701–714
Domingues F (2019) Entenda o debate sobre a MP 867, que altera o Código Florestal. G1. https://g1.globo.com/natureza/noticia/2019/05/29/entenda-o-debate-sobre-a-mp-867-que-altera-o-codigo-florestalg.html. Accessed 1 Jun 2019
Faleiros G, Sá MI (2018) Purus-Madeira: the Amazon arc of deforestation marches north. Mongabay series. https://news.mongabay.com/2018/11/purus-madeira-the-amazon-arc-of-deforestation-marches-north/
Fearnside PM (1979) The development of the Amazon rain forest: Priority problems for the formulation of guidelines. Interciencia 4(6):338–343
Fearnside PM (1986) Human carrying capacity of the Brazilian rainforest. Columbia University Press, New York, NY, USA, p 286
Fearnside PM (1989) A ocupação humana de Rondônia: impactos, limites e planejamento. Conselho Nacional de Desenvolvimento Científico e Tecnológico (CNPq), Brasila, DF, Brazil, p 76
Fearnside PM (2001) Land-tenure issues as factors in environmental destruction in Brazilian Amazonia: the case of southern Pará. World Dev 29(8):1361–1372. https://doi.org/10.1016/S0305-750X(01)00039-0
Fearnside PM (2005) Deforestation in Brazilian Amazonia: history, rates and consequences. Conserv Biol 19:680–688. https://doi.org/10.1111/j1523-1739200500697x
Fearnside PM (ed) (2015) Hidrelétricas na Amazônia: impactos ambientais e sociais na tomada de decisões sobre grandes obras, vol. 1. Editora INPA, Manaus, AM, Brazil, p 296
Fearnside PM (2016) Brazilian politics threaten environmental policies. Science 353:746–748. https://doi.org/10.1126/scienceaag0254
Fearnside PM (2017a) Business as usual: a resurgence of deforestation in the Brazilian Amazon. Yale Environment 360, New Haven, CT, USA. https://e360yale.edu/features/business-as-usual-a-resurgence-of-deforestation-in-the-brazilian-amazon
Fearnside PM (2017b) Deforestation of the Brazilian Amazon. In: Shugart ASSOC (ed) Oxford Research Encyclopedia, Environmental Science. Oxford University Press, New York, NY, USA. https://doi.org/10.1093/acrefore/9780199389414013102
Fearnside PM (2020) Brazil’s ‘land-grabbers law’ threatens Amazonia (commentary). Mongabay. https://news.mongabay.com/2020/05/brazils-land-grabbers-law-threatens-amazonia-commentary/
Ferrante L, Fearnside PM (2019) Brazil’s new president and “ruralists” threaten Amazonia’s environment, traditional peoples and the global climate. Environ Conserv 46(4):261–263. https://doi.org/10.1017/S0376892919000213
Franco CA, Lima DS (2008) Dinâmica populacional dos projetos de assentamentos da regional do Baixo Acre. In: Ann Congresso da Sociedade Braslleira da Economia, Administração e Sociologia Rural 46. SOBER, Brasília, DF, Brazil
Gasques JG, Bastos ET (2008) Preços da terra no Brasil. Agroanalysis 28(4):14–15
Garrett RD, Lambin EF, Naylor RL (2013) The new economic geography of land use change: supply chain configurations and land use in the Brazilian Amazon. Land Use Pol 34:265–275. https://doi.org/10.1016/jlandusepol201303011
Gedney N, Valdes PJ (2000) The effect of Amazonian deforestation on the northern hemisphere circulation and climate. Geophys Res Lett 27:3053–3056
Godar J, Tizado EJ, Pokorny B, Johnson J (2012) Who is responsible for deforestation in the Amazon? A spatially explicit analysis along the Transamazon Highway in Brazil. Ecol Manag 267:58–73
Gouvêa DC, Ávila PC, Ribeiro SB (2009) A regularização fundiária urbana na Amazônia Legal. Rev Bras Estud Urban Reg 11(2):73–93. https://doi.org/10.22296/2317-15292009v11n2p73
Grainger A (1995) The forest transition: an alternative approach. Area 27(3):242–251
Hansen MC, Potapov PV, Moore R, Hancher M, Turubanova SA, Tyukavina A, Townshend JRG (2013) High-resolution global maps of 21st-century forest cover change. Science 342:850–853. https://doi.org/10.1126/science1244693
Hasler N, Werth D, Avissar R (2009) Effects of tropical deforestation on global hydroclimate: a multimodel ensemble analysis. J Clim 22:1124–1141
Hecht SB (1985) Environment, development and politics: capital accumulation and the livestock sector in Eastern Amazonia. World Dev 13(6):663–684. https://doi.org/10.1016/0305-750X(85)90114-7
Hecht SB, Norgaard RB, Possio G (1988) The economics of cattle ranching in Eastern Amazonia. Interciencia 13:233–240
Heredia B, Medeiros L, Lopes JSL, Palmeira M, Cintrão R (2003) Os impactos regionais da reforma agrária: um estudo sobre áreas selecionadas. Lusotopie 1:59–90. https://www.persee.fr/doc/luso_1257-0273_2003_num_10_1_1543
IEA (2020) Global energy review 2020. IEA, Paris. https://www.iea.org/reports/global-energy-review-2020
Jepson W (2006) Producing a modern agricultural frontier: firms and cooperatives in eastern Mato Grosso, Brazil. Econ Geogr 82(3):289–316. https://doi.org/10.1111/j.1944-8287.2006.tb00312.x
Keating D (2018) Wood laundering brings illegal Amazon timber to Europe—report. DW Environment. https://www.dw.com/en/wood-laundering-brings-illegal-amazon-timber-to-europe-report/a-43065620
Koh LP, Ghazoul J (2010) Spatially explicit scenario analysis for reconciling agricultural expansion, forest protection, and carbon conservation in Indonesia. Proc Natl Acad Sci USA 107:11140–11144
Koh LP, Wilcove DS (2008) Is oil palm agriculture really destroying tropical biodiversity? Conserv Lett 1:60–64
Lambin EF, Meyfroidt P (2011) Global land use change, economic globalization, and the looming land scarcity. Proc Natl Acad Sci 108(9):3465–3472. https://doi.org/10.1073/pnas.1100480108
Landau EC, Cruz RK, Hirsch A, Pimenta FM, Guimarães DP (2012) Variação geográfica do tamanho dos módulos fiscais no Brasil. Documentos 146, Embrapa Milho e Sorgo, Sete Lagoas, MG, Brazil. https://www.embrapa.br/milho-e-sorgo/busca-de-publicacoes/-/publicacao/949260/variacao-geografica-do-tamanho-dos-modulos-fiscais-no-brasil
Lapola DM, Schaldach R, Alcamo J, Bondeau A, Msangi S, Priess JA, Silvestrini R, Soares-Filho BS (2011) Impacts of climate change and the end of deforestation on land use in the Brazilian Legal Amazon. Earth Interact 15:1–29
Leite AZ, Castro LFP, Sauer S (2018) A questão agrária no momento político brasileiro: liberalização e mercantilização da terra no estado mínimo de Temer. Okara: Geogr em debate 12(2):247–274
Lovejoy TE, Nobre CA (2018) Amazon tipping point. Sci Adv 4:eaat2340
Ludewigs T, D’Antona AO, Brondízio ES, Hetrick S (2009) Agrarian structure and land-cover change along the lifespan of three colonization areas in the Brazilian Amazon. World Dev 37(8):1348–1359. https://doi.org/10.1016/jworlddev200808018
Mahar DJ (1989) Government policies and deforestation in Brazil’s Amazon region. The World Bank, Washington, DC, USA, p 66
Malhado A, Ladle R, Whittaker R, Neto A, Malhi Y, ter Steege H (2013) The ecological biogeography of Amazonia. Front Biogeogr 5:103–112
Mann ML, Kaufmann RK, Bauer DM, Gopal S, Nomack M, Womack JY, Sullivan K, Soares-Filho BS (2014) Pasture conversion and competitive cattle rents in the Amazon. Ecol Econ 97:182–190. https://doi.org/10.1016/jecolecon201311014
Margulis S (2003) Causes of deforestation of the Brazilian Amazon. World Bank Working Paper n 22. The World Bank, Washington, DC, USA
McCracken SD, Siqueira AD, Moran EF, Brondízio ES (2002) Land use patterns on an agricultural frontier in Brazil: insights and examples from a demographic perspective. In: Wood CH, Porro R (eds) Deforestation and land use in the Amazon. University Press of Florida, Gainesville, FL, USA, p 162–192
Meirelles FA, Carrero GC, Neto JGF, Cenamo MC, Guarido PCP (2018) Análise ambiental e socioeconômica dos municípios sob influência da rodovia BR-319. Idesam, Manaus, AM, Brazil, p 112
Metzger JP, Lewinsohn T, Joly CA, Verdade LM, Rodrigues RR (2010) Brazilian law: full speed in reverse. Science 329:276–277
Miranda J, Börner J, Kalkuhl M, Soares-Filho B (2019) Land speculation and conservation policy leakage. Environ Res Lett 14(4):045006. https://doi.org/10.1088/1748-9326/ab003a
Moran EF (1977) Estratégias de sobrevivência: o uso de recursos ao longo da rodovia Tranzamazônica. Acta Amazonica 7(3):363–379
Moran EF (1981) Developing the Amazon. Indiana University Press, Bloomington, IN, USA
Moutinho P, Guerra R, Azevedo-Ramos C (2018) Achieving zero deforestation in the Brazilian Amazon: what is missing? Elementa: Sci Anthropocene 4:000125. https://doi.org/10.12952/journalelementa000125
Mullan K, Sills E, Pattanayak S, Caviglia-Harris J (2017) Converting forests to farms: the economic benefits of clearing forests in agricultural settlements in the Amazon. Environ Resour Econ. https://doi.org/10.1007/s10640-017-0164-1
Nepstad DC, Stickler CM, Almeida OT (2006) Globalization of the Amazon soy and beef industries: opportunities for conservation. Conserv Biol 20(6):1595–1603. https://doi.org/10.1111/j1523-1739200600510x
Nepstad D, McGrath D, Stickler C, Alencar A, Azevedo A, Swette B, Hess L (2014) Slowing Amazon deforestation through public policy and interventions in beef and soy supply chains. Science 344:1118–1123. https://doi.org/10.1126/science1248525
Nogueira EM, Fearnside PM, Nelson BW, Barbosa RI, Keizer EWH (2008) Estimates of forest biomass in the Brazilian Amazon: new allometric equations and adjustments to biomass from wood-volume inventories. Ecol Manag 256:1853–1867. https://doi.org/10.1016/j.foreco.2008.07.022
Oyama MD, Nobre CA (2003) A new climate-vegetation equilibrium state for Tropical South America. Geophys Res Lett 30(23):2199. https://doi.org/10.1029/2003GL018600
Pacheco P (2009) Agrarian reform in the Brazilian Amazon: its implications for land distribution and deforestation. World Dev 37:1337–1347. https://doi.org/10.1016/jworlddev200808019
Pacheco P, Poccard-Chapuis R (2012) The complex evolution of cattle ranching development amid market integration and policy shifts in the Brazilian Amazon. Ann Assoc Am Geogr 102(6):1366–1390. https://doi.org/10.1080/000456082012678040
Parry L, Day B, Amaral S, Peres CA (2010) Drivers of rural exodus from Amazonian headwaters. Popul Environ 32:137–176. https://doi.org/10.1007/s11111-010-0127-8
Perz SG (2001) Household demographic factors as life cycle determinants of land use in the Amazon. Popul Res Policy Rev 20(3):159–186. https://doi.org/10.1023/A:1010658719768
Perz SG, Cabrera L, Carvalho LA, Hurtado JC, Barnes G (2010) Global economic integration and local community resilience: New infrastructure projects and demographic change in the southwestern Amazon. Rural Socio 75(2):300–325
Pfaff A, Robalino J, Walker RT, Aldrich S, Caldas MM, Reis E, Kirby K (2007) Road investments, spatial spillovers, and deforestation in the Brazilian Amazon. J Reg Sci 47(1):109–123. https://doi.org/10.1111/j1467-9787200700502x
Reydon BP (2011) O desmatamento da floresta amazônica: causas e soluções. Política Ambiental 8:143–155
Reydon BP, Fernandes VB, Telles TS (2015) Land tenure in Brazil: the question of regulation and governance. Land Use Policy 42:509–516
Richards P (2017) It’s not just where you farm; it’s whether your neighbor does too: how agglomeration economies are shaping new agricultural landscapes. J Econ Geogr 1–24. https://doi.org/10.1093/jeg/lbx009
Ricketts TH, Soares-Filho B, da Fonseca GAB, Nepstad D, Pfaff A, Petsonk A, Victurine R (2010) Indigenous lands, protected areas, and slowing climate change. PLoS Biol 8(3):6–9. https://doi.org/10.1371/journalpbio1000331
Rindfuss RR, Entwisle B, Walsh SJ, Mena CF, Erlien M, Gray CL, Grayt CL (2007) Land use change: frontier synthesis, challenges, and next steps. Ann Assoc Am Geogr 97(4):739–754. https://doi.org/10.1111/j1467-8306200700580x
Rosa IMD, Purves D, Souza Jr C, Ewers RM (2013) Predictive modelling of contagious deforestation in the Brazilian Amazon. Plos ONE 8(10):e77231. https://doi.org/10.1371/journalpone0077231
Rudel TK, Defries R, Asner GP, Laurance WF (2009) Changing drivers of deforestation and new opportunities for conservation. Conserv Biol 23(6):1396–1405. https://doi.org/10.1111/j1523-1739200901332x
Sampaio G, Nobre CA, Costa MH, Satyamurty P, Soares-Filho BS, Cardoso M (2007) Regional climate change over eastern Amazonia caused by pasture and soybean cropland expansion. Geophys Res Lett 34(17):L17709. https://doi.org/10.1029/2007GL030612
Sampaio G, Borma LS, Cardoso M, Alves LM, von Randow C, Rodriguez DA, Nobre CA, Alexandre FF (2018) Assessing the possible Impacts of a 4 °C or higher warming in Amazonia. In: Nobre CA et al. (eds) Climate change risks in Brazil. Springer, Amsterdam, p 201–218. https://doi.org/10.1007/978-3-319-92881-4_8
Sathler D, Adamo SB, Lima EEC (2018) Deforestation and local sustainable development in Brazilian Legal Amazonia: an exploratory analysis. Ecol Soc 23(3):30. https://doi.org/10.5751/ES-10062-230230
Sauer S (2017) Rural Brazil during the Lula administrations: agreements with agribusiness and disputes in Agrarian polcies. Lat Am Perspect 46(4):103–121. https://doi.org/10.1177/0094582X16685176
Sauer S, Leite SP (2012) Agrarian structure, foreign investment in land, and land prices in Brazil. J Peas Stud 39:873–898
Schielein J, Börner J (2018) Land use policy recent transformations of land-use and land-cover dynamics across different deforestation frontiers in the Brazilian Amazon. Land Use Policy 76:81–94. https://doi.org/10.1016/jlandusepol201804052
Schneider M, Peres CA (2015) Environmental costs of government-sponsored agrarian settlements in Brazilian Amazonia. Plos ONE 10(8):e0134016. https://doi.org/10.1371/journal.pone.0134016
SEEG (2020) Impacto da pandemia de Covid-19 nas emissões de gases de efeito estufa no Brasil. Nota Técnica
Simmons CS (2004) The political economy of land conflict in the eastern Brazilian Amazon. Ann Assoc Am Geogr 94(1):183–206. https://doi.org/10.1111/j1467-8306200409401010x
Simmons CS, Walker RT, Arima EA, Aldrich SP, Caldas MM (2007) The Amazon land war in the south Pará. Ann Assoc Am Geogr 97(3):567–592. https://doi.org/10.1111/j1467-8306200700564x
Simmons CS, Walker RT, Perz SG, Aldrich SP, Caldas MM, Pereira R, Arima EA (2010) Doing it for themselves: direct action land reform in the Brazilian Amazon. World Dev 38(3):429–444. https://doi.org/10.1016/jworlddev200906003
Simmons CS, Famolare L, Macedo MN, Walker RT, Coe MT, Scheffers B, Galvan YM (2018) Science in support of Amazonian conservation in the 21st century: the case of Brazil. Biotropica 50(6):850–858. https://doi.org/10.1111/btp12610
Soares-Filho BS, Rajão R, Macedo M, Carneiro A, Costa W, Coe M, Rodrigues H, Alencar A (2014) Cracking Brazil’s forest code. Science 344:363–364. https://doi.org/10.1126/science1246663#_blank
Sparovek G, Reydon BP, Pinto LFG, Ribeiro V (2019) Who owns Brazilian lands? Land Use Policy 87:104062. https://doi.org/10.1016/j.landusepol.2019.104062
Stropp J, Ter Steege H, Malhi Y (2009) Disentangling regional and local tree diversity in the Amazon. Ecography 32:46–54
The Guardian (2019a) Exterminator of the future: Brazil’s Bolsonaro denounced for environmental assault, by Kaiser AJ. https://www.theguardian.com/world/2019/may/09/jair-bolsonaro-brazil-amazon-rainforest-environment
The Guardian (2019b) Deforestation of Brazilian Amazon surges to record high, by Jonathan Watts. https://www.theguardian.com/world/2019/jun/04/deforestation-of-brazilian-amazon-surges-to-record-high-bolsonaro
Tollefson J (2018) Brazil’s lawmakers push to weaken environmental rules. Nature 557:17
Tourneau FM, Bursztyn M (2010) Assentamentos Rurais na Amazônia: contradições entre política agrária e política ambiental. Ambient Soc 8(1):111–130
Vosti SA, Witcover J, Carpentier CL (2002) Agricultural intensification by smallholders in the western Brazilian Amazon. Research Report 30, International Food Policy Research Institute, Washington, DC, USA
Walker RT (2003) Mapping process to pattern in the landscape change of the Amazonian frontier. Ann Assoc Am Geogr 93(2):376–398. https://doi.org/10.1111/1467-83069302008
Walker RT (2004) Theorizing land-cover and land-use change: the case of tropical deforestation. Int Reg Sci Rev 23(3):247–270
Walker RT, DeFries R, Vera-Diaz MC, Shimabukuro Y, Venturieri A (2009) The expansion of intensive agriculture and ranching in the Brazilian Amazon Amazonia and global change. Geophys Monogr Series 186, American Geophysical Union (AGU), Washington, DC, USA
Walker RT, Moran E, Anselin L (2000) Deforestation and cattle ranching in the Brazilian Amazon: external capital and household processes. World Dev 28(4):683–699. https://doi.org/10.1016/S0305-750X(99)00149-7
Walker RT, Perz S, Caldas M, Silva LGT (2002) Land use and land cover change in forest frontiers: the role of household life cycles. Int Reg Sci Rev 25(2):169–199. https://doi.org/10.1177/016001760202500202
Walker RT, Richards P (2013) The ghost of Von Thunen lives: a political ecology of the disappearance of the Amazonian forest. In: Brannstrom C, Vadjunec JM (eds) Land change science, political ecology, and sustainability: synergies and divergences. Taylor and Francis, London, UK, p 24–47. https://doi.org/10.4324/9780203107454
Walker RT, Simmons CS (2018) Endangered Amazon: an Indigenous tribe fights back against hydropower development in the Tapajós Valley. Environ Sci Policy Sustain Dev 60(2):4–15. https://doi.org/10.1080/0013915720181418994
Walker RT, Simmons CS, Arima, E, Galvan-Miyoshi Y, Antunes A, Waylen M (2019) Perspective avoiding Amazonian catastrophes: prospects for conservation in the 21st century. One Earth 1. https://doi.org/10.1016/j.oneear.2019.09.009
Waroux YL, Garrett RD, Graesser J, Nolte C, White C, Lambin EF (2017) The restructuring of South American soy and beef production and trade under changing environmental regulations. World Dev 121:188–202. https://doi.org/10.1080/24694452.2018.1489215
Weisse M, Lyons K (2018) Places to watch: 3 hotspots for forest clearing right now. Global Forest Watch Blog. https://blog.globalforestwatch.org/places-to-watch/places-to-watch-june-2018
Werth D, Avissar R (2002) The local and global effects of Amazon deforestation. J Geophys Res 107:8087
West TAP, Börner J, Fearnside PM (2019) Climatic benefits from the 2006–2017 avoided deforestation in Amazonian Brazil. Front For Glob Change 2:52. https://doi.org/10.3389/ffgc.2019.00052
Wood CH, Walker RT, Toni F (2001) Os efeitos da posse de título da terra sobre o uso do solo e investimentos entre pequenos agricultores na Amazônia Brasileira. Cadernos de Ciência & Tecnologia 18(2):95–111
Wood S, Pya N, Safken B (2016) Smoothing parameter and model selection for general smooth models. J Am Stat Assoc 111(516):1548–1563. https://doi.org/10.1080/0162145920161180986
Wood S (2018) Package ‘mgcv’—mixed GAM computation vehicle with automatic smoothness estimation. V18-23 R CRAN
Yanai AM, Nogueira EM, Graça PMLA, Fearnside PM (2016) Deforestation and carbon-stock loss in Brazil’s Amazonian settlements. Environ Manag 59(3):393–409. https://doi.org/10.1007/s00267-016-0783-2
Yanai AM, Graça PMLA, Escada MIS, Ziccardi LG, Fearnside PM (2020) Deforestation dynamics in Brazil’s Amazonian settlements: effects of land-tenure concentration. Jour Environ Manag 268:110555. https://doi.org/10.1016/j.jenvman.2020.110555
Funding
This research was supported by the National Council for Scientific and Technological Development [(CNPq) Proc. 575853/2008-5; 305880/2007-1; 573810/2008-7)], the Amazonas Sustainable Foundation (FAS), the BECA program of the International Institute of Education of Brazil (IIEB) through the Gordon & Betty Moore Foundation, and the National Institute for Research in Amazonia [(INPA) PPI. PRJ05.57]. The State Secretariat for the Environment and Sustainable Development of Amazonas (SEMA-AM) provided logistical support. Colonists interviews were applied by 15 staff of the Institute for Conservation and Sustainable Development of the Amazon (IDESAM). World Wildlife Fund—Brazil, IDESAM and the University of Florida supported the workshop presented in the study.
Author information
Authors and Affiliations
Corresponding author
Ethics declarations
Conflict of Interest
The authors declare that they have no conflict of interest.
Additional information
Publisher’s note Springer Nature remains neutral with regard to jurisdictional claims in published maps and institutional affiliations.
Rights and permissions
About this article

Cite this article
Carrero, G.C., Fearnside, P.M., do Valle, D.R. et al. Deforestation Trajectories on a Development Frontier in the Brazilian Amazon: 35 Years of Settlement Colonization, Policy and Economic Shifts, and Land Accumulation. Environmental Management 66, 966–984 (2020). https://doi.org/10.1007/s00267-020-01354-w
Received:
Accepted:
Published:
Issue Date:
DOI: https://doi.org/10.1007/s00267-020-01354-w