Article

Evaluating Treatment Requirements for Recycled Water to Manage Well Clogging during Aquifer Storage and Recovery: A Case Study in the Werribee Formation, Australia

CSIRO Land and Water, Locked Bag 2, Glen Osmond, SA 5064, Australia
*
Author to whom correspondence should be addressed.
Water 2020, 12(9), 2575; https://doi.org/10.3390/w12092575
Submission received: 11 August 2020 / Revised: 11 September 2020 / Accepted: 12 September 2020 / Published: 15 September 2020

Abstract

:
Managed aquifer recharge (MAR) is the intentional recharge of water to suitable aquifers for subsequent beneficial use or to achieve environmental benefits. Well injection techniques for MAR, such as Aquifer Storage and Recovery (ASR), rely on implementing appropriate design and defining the operational parameters to minimise well clogging and maintain sustainable rates of recharge over the long term. The purpose of this study was to develop water quality targets and pre-treatment requirements for recycled water to allow sustained recharge and recovery in a medium-coarse siliceous aquifer. The recharge water is a blend of 40% Class A recycled water and 60% reverse osmosis (RO)-treated Class A recycled water. Four source waters for MAR were evaluated: (1) this blend with no further treatment, and this blend with additional treatment using: (2) a 20 µm sediment cartridge filter, (3) a 5 µm sediment cartridge filter, or (4) a 5 µm granular activated carbon (GAC) cartridge filter. All four treatment options were also further disinfected with chlorine. The four blended and treated recycled waters were used in laboratory columns packed with aquifer material under saturated conditions at constant temperature (20.7 °C) with light excluded for up to 42 days. Substantial differences in the changes in hydraulic conductivity of the columns were observed for the different treatments within 14 days of the experiment, despite low turbidity (<2 NTU) of the blend waters. After 14 days, the GAC-treated water had a 7% decline in hydraulic conductivity, which was very different from the other three blend waters, which had declines of 39–52%. Based on these results and consistent with previous studies, a target biodegradable dissolved organic carbon (BDOC) level of <0.2 mg/L was recommended to ensure a biologically stable source of water to reduce clogging during recharge.

1. Introduction

Water recycling and reuse is becoming increasingly common throughout the world [1,2,3]. Coupling water recycling with managed aquifer recharge (MAR) can optimise the volume of water available for reuse by storing it in the aquifer for use in periods of high demand [4], provide water quality treatment [5,6], and assist with public acceptance of recycled water [7]. Aquifer Storage and Recovery (ASR) is a type of MAR that uses a single well for injection and recovery [4,8], which is successful in storing water in deeper confined aquifers [9].
The most common operational issue affecting injection rate and well lifespan in all MAR operations is aquifer clogging [10,11], which can be a result of biological, physical, and/or chemical processes [12,13]. Management strategies for clogging include both prevention (minimisation) and remediation. Martin [11] reports that prevention through control of source water quality is the most cost-effective solution for clogging but is unlikely to address all clogging processes. Operational remediation strategies for ASR are challenging and include regular backflushing, airlift redevelopment, vacuuming, chemical treatment, scrubbing, or well-enlargement, all of which require understanding of the nature of clogging (biological, physical, chemical) [11].
For ASR to be feasible, the receiving aquifer must be of appropriate permeability to receive recharge water [14], with appropriate management practices also needed to avoid irreversible well clogging. Understanding the potential clogging mechanisms that may impact on an ASR operation and how these may be managed through source water quality control (treatment prior to injection) are knowledge gaps which are only just being understood in the uptake of recycled water ASR.
Multiple studies have assessed the impact and management of potential clogging mechanisms, such as irrecoverable accumulation of particulate matter present in the recharge source water [4,8,15,16,17,18,19], precipitation of minerals due to chemical or bacterial processes [20,21], swelling or dispersion of reactive clays [22,23], bacterial biomass growth due to nutrients present in the source water [13,20,24,25,26], and entrapment of gas through air entrainment, cavitation, or biological processes [27,28]. ASR in Australia and Southeast USA often targets limestone aquifers for storage; notably, well clogging can be offset by the dissolution of the carbonate aquifer matrix [6,25,29,30,31].
Recent studies [18,32,33] evaluated the potential for clogging when river water and urban stormwater were used for ASR in siliceous aquifers, targeting an unconsolidated medium-coarse sand aquifer or low transmissivity fractured rock aquifer, respectively. Both these studies recommended source water pre-treatment to remove particulates and biodegradable dissolved organic carbon (BDOC) in order to minimise physical and biological clogging. ASR in siliceous aquifers generally requires a higher level of source water pre-treatment than for ASR in carbonate aquifers, where carbonate dissolution can offset clogging impacts [25]. Previous studies have reported a greater tendency for clogging when nutrient-rich recycled water is used in ASR, but the impact of clogging and source water quality targets and pre-treatment requirements have only recently begun to be assessed in detail [18] and to date have not been reported for recycled water ASR in a siliceous aquifer.
The objective of this study was to assess the potential for clogging processes to impact on the feasibility of an ASR operation to store recycled water in the heterogeneous sand, silt, clay, and coal Werribee Formation, located in Victoria, Australia. Specifically, a laboratory column experiment was undertaken using four options for pre-treatment, to address two main objectives:
  • To determine the dominant clogging mechanisms impacting recycled water ASR in the Werribee Formation.
  • To determine water quality targets to minimise clogging and allow sustainable operation of the ASR scheme.

2. Materials and Methods

A laboratory column experiment was designed to compare the potential for clogging during ASR in a heterogeneous sand, silt, clay, and coal aquifer using recycled water approved for non-potable household use.

2.1. Aquifer Material and Groundwater

The study site has previously been documented by Stuyfzand and Osma [15]. Briefly, the Werribee Formation comprises a complex, heterogeneous sequence of sand, silt, clay, and coal and is overlain by 200 m of unconsolidated sediments, including the marls of the Fyansford Formation intersected with the Batesford Limestone, the Brighton Group clays and sands, the Newer Volcanics Basalt and the Werribee Delta. The Werribee sands are typically found between 230 and 250 m below ground surface (bgs) and are of varying thickness (3–22 m) over short horizontal distances. At this site, the Werribee sands are typically poorly sorted, and are composed of fine- to coarse-grained, sub-rounded to sub-angular quartz grains, with 5–15% silt and traces of lignite. Pumping test-derived transmissivities range from 50 to 110 m2/d on the ASR field site [15,34].
Aquifer core material for the laboratory column study was collected from the Werribee Formation (219–238 m depth) during drilling of ASR well 20 by rotary air hammer. On collection, the core was wrapped in plastic film, placed in a sealed plastic crate, purged with nitrogen, and stored at 4 °C, to minimise exposure to the atmosphere.
Aquifer column material was prepared by collecting 500 g sub-samples from the midway point along each of four 1 m core depth intervals. These four intervals, 221–222, 222–223, 229–230, and 234–235 m bgs, were composed largely of fine to coarse sand and gravel, with some traces of coal and silt. The aquifer material was unconsolidated so required no crushing, but was tapped apart, dried in an oven at 45 °C for three days, combined, and dry sieved to <2 mm (d50 530 µm).
The composite material was analysed for mineralogy using X-ray Diffraction (XRD), major elemental composition using X-ray Fluorescence (XRF) [35], and minor elemental composition using XRF and reverse aqua-regia acid extraction and optical emission spectroscopy. The chemical properties total carbon and nitrogen were determined by high-temperature combustion [36], inorganic carbon by acidification and measurement of pressure change due to CO2 production (method 19B2 [37]), and exchangeable cations and cation exchange capacity were analysed using ammonium acetate (method 15D2 [37]).
Groundwater for the study was pumped from ASR well 5 and kept in cold storage (<4 °C) until it was used for initial packing of the columns, conducting tracer tests, and inoculating the columns.

2.2. Source Water and Treatments

The ASR scheme intended to recycle water from the Western Treatment Plant, Werribee, Victoria. The scheme source water was a blend of 40% Class A recycled water and 60% reverse osmosis (RO)-treated Class A water, which produces a fresh water supply suitable for non-potable supply. The Class A water had been secondary treated, followed by maturation lagoons, ultraviolet (UV) disinfection and chlorination to produce a high-class recycled water suitable for non-drinking water purposes [15]. For the laboratory experiment, subsequent treatment was provided to produce four different qualities of the blended source water to be evaluated within the laboratory clogging study using a total of eight columns (four pairs):
  • Blend A: Recycled water blend (60% RO-treated Class A water and 40% raw Class A water), no filtration, treated by chlorination (intended scheme source water).
  • Blend F: Recycled water blend (60% RO-treated Class A water and 40% raw Class A water), treated by filtration using 20 μm (F) sediment cartridge filter and chlorination.
  • Blend UF: Recycled water blend (60% RO-treated Class A water and 40% raw Class A water), treated by ultra-filtration using 5 μm (UF) sediment cartridge filter and chlorination.
  • Blend G: Recycled water blend (60% RO-treated Class A water and 40% raw Class A water), treated by filtration initially using 20 μm (F) then using 5 μm (UF) sediment cartridge filter, granular activated carbon (GAC) (5 μm cartridge filter, plus a 0.005 m3 volume GAC column), and chlorination.
The experiment commenced with 3 pairs of columns which applied Blends A, F, and G. After 14 days, a fourth pair of columns was added for the Blend UF treatment, at which time the Blend F column treatment ceased. The minimum target free chlorine residual for each of the blended source waters during the experiment was >0.2 mg/L, which is a common target adopted for drinking water distribution systems [38]. The average daily free residual chlorine measured was 0.29 mg/L, this was managed by adding a minimum of 200 µL hypochlorite to each of the 20 L water reservoirs at the start of each day. Free residual chlorine was measured twice a day, and if at the end of the day levels had dropped to <0.2 µg/L, another 200 µL was added for overnight [39].

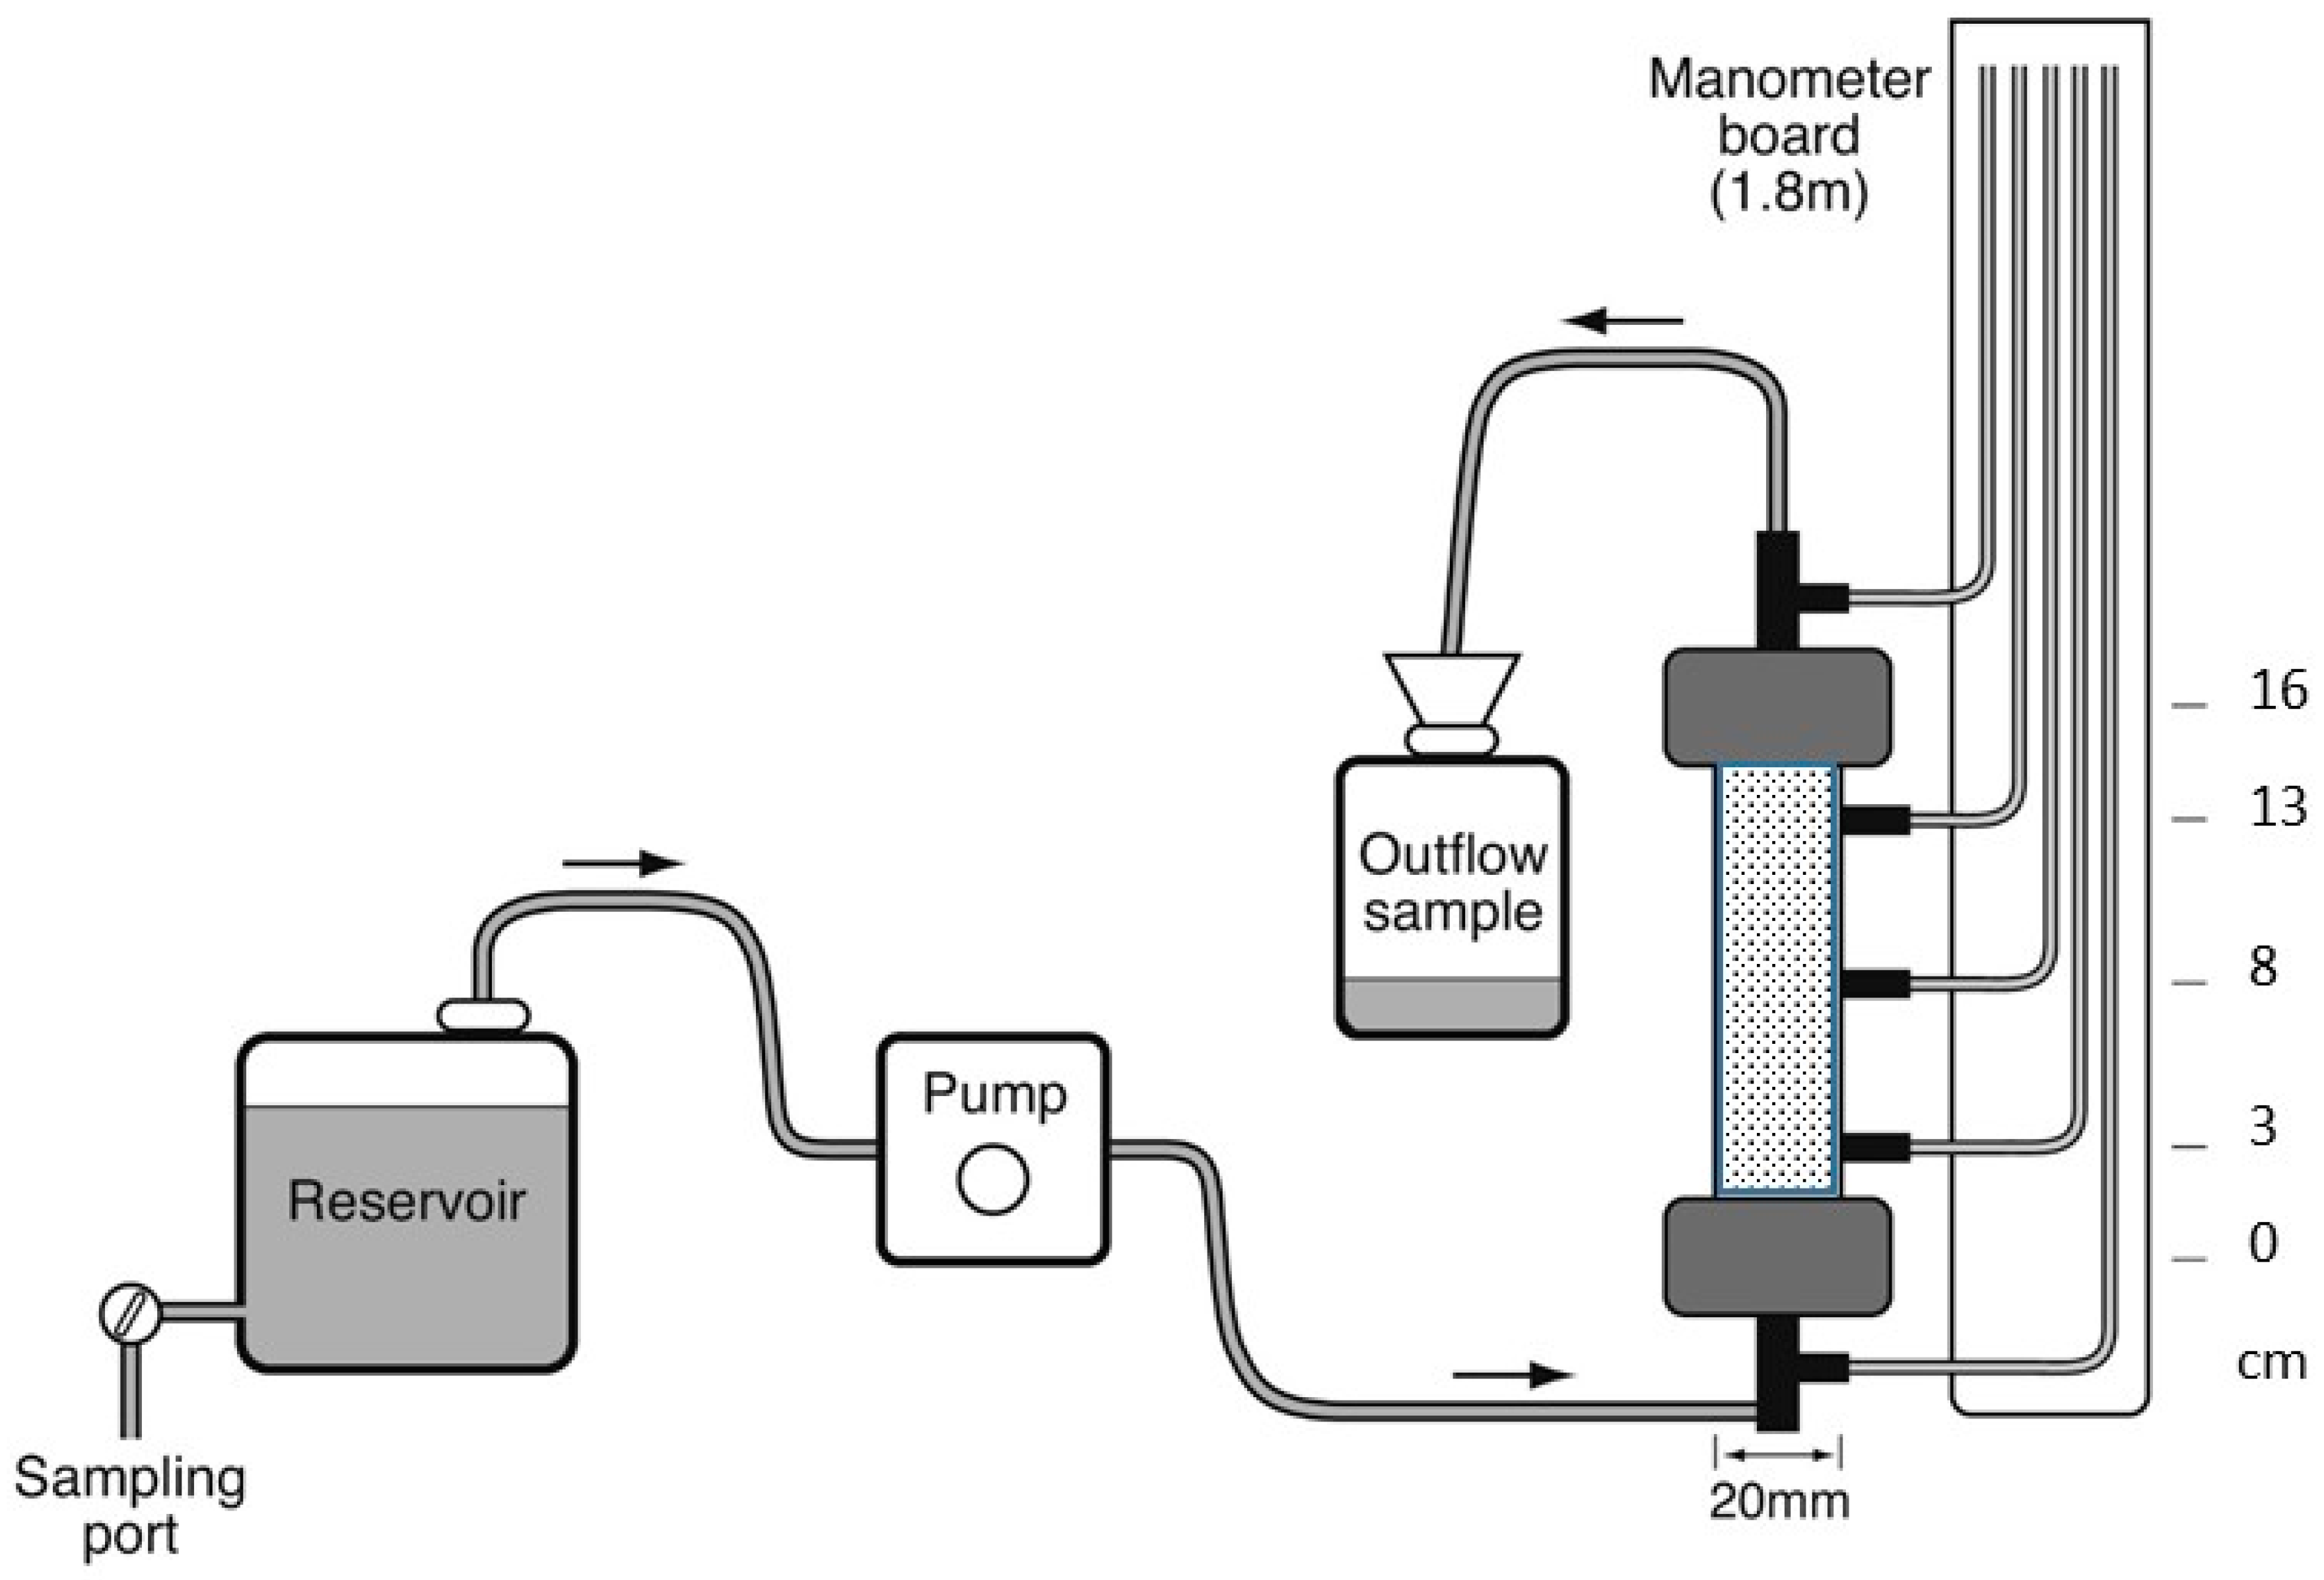
2.3. Column Construction and Packing

The columns were manufactured from polycarbonate tubes with dimensions of 160 mm length and an internal diameter of 20 mm and were fitted with polyvinyl chloride (PVC) endcaps (Figure 1). This ensures that the flow rate represents the expected radial velocity close to the perimeter of a fully penetrating ASR well, where clogging impacts occur. The porous media has a median grain size 0.0265 mm smaller than the diameter of the column, which is consistent with published values for column flow experiments and considered appropriate to minimise wall effects [40]. Each column had a 2 mm recess ground out of the internal wall at each end, to allow the installation of a 20 mm diameter disc of stainless-steel mesh (0.16 × 0.1 mm). The mesh was held in place by a 2.5 mm thick × 20 mm diameter rubber O-ring. To ensure a complete seal with the PVC endcap, a 2.5 mm thick × 30 mm diameter rubber O-ring was also embedded in the outer wall of each end of the column. Columns were run in saturated up-flow mode with pressure ports installed at the inlet at the base of the column, outlet, and at 3, 8, and 13 cm intervals from the inlet, to enable changes in hydraulic conductivity to be measured during the study.
To pack the columns, groundwater was initially added to each column, then the bottom tap was opened to drain some of the water to ensure removal of air bubbles from the base of the column, leaving a 1 cm depth of groundwater in the column. Aquifer material was mixed with groundwater until ‘moist’ (~10% water), then the columns were packed at a steady rate, tapping the side of the column to remove air bubbles, ensuring the aquifer material remained fully submerged in the groundwater as the column was filled. Once columns were packed, groundwater was pumped through for a 48 h period; however, loss of fine sediments (<20 µm fraction) which represent a minor component of the aquifer material (~1%) was observed in the column effluent and pressure ports, resulting in preferential flow paths forming in the column. To address this, the aquifer material was given a single wash to remove the mobile fine material and enable a more stable pack of the columns, representing a 3% weight/weight fraction of the total [39]. While it is recognised that removal of the finer fraction could potentially underestimate clogging of the aquifer, it was conceded that unless this material was excluded from the samples, the results of column studies would be dominated by an artefact of packing, rather than by the effects of source water quality [18]. Prior to the commencement of the study, tracer tests were performed using a saline solution (0.05 M KCl) to determine the pore volume of each column. In this study, the average pore volume was found to be 12.5 mL, with an effective porosity of 25% and a coefficient of variation of <5%.

2.4. Column Operation and Monitoring

For each column, daily hydraulic conductivities (K) were calculated for each monitored section (0–3, 3–8, 8–13, and 13–16 cm) and the entire column (0–16 cm), plus mean daily flow rates. To commence the study, groundwater was pumped through the columns for a period of 48 h to initially inoculate the columns with the groundwater native microbial community prior to introducing the source water blends. To minimise light penetration, all columns were wrapped in aluminium foil and the temperature was maintained at 21 ± 2 °C. At time zero (t0), the packed columns had an initial mean hydraulic conductivity over the 0–16 cm interval of 2.9 m/d, with a coefficient of variation of 24% and a flow rate of ~10 L/d, with a Darcy velocity of 31.8 m/d. This corresponds with the expected radial velocity at a radius of 100 cm, that is, close to the perimeter of a fully penetrating ASR well recharging at the designed injection rate of 23 L/s (2000 m3/d).
Blend A and G columns ran for the entire experiment to day 42, over this period, >33,000 pore volumes passed through each column. Blend F ran for 14 days (>11,000 pre volumes) and was ceased at day 14 due to evidence that this filtration was not an effective treatment. Blend UF ran for 21 days (commencing at day 21 of experiment), equivalent to >16,000 pore volumes.
Daily measurements were made of water quality parameters entering and exiting the columns. Electrical conductivity (EC), pH, and temperature were measured using a handheld multi-parameter unit (WTW Multiline®, F/Set-3) and turbidity was measured using a HACH® 2100P turbidimeter (HACH®, Dandenong South, Australia). Total chlorine residual was measured in the influent using a HACH® DR/890 colorimeter (method 8021; HACH®, Dandenong South, Australia). Daily sub-samples of the influent and effluent were collected and composited on a weekly basis for more detailed water quality analyses, which included particle size, total suspended solids (TSS), major ions, selected metals, and nutrients [41]. The groundwater used to inoculate the columns at the start of the experiment was also sub-sampled for the same suite of analyses.

2.5. End of Study Column Sectioning and Analysis

At the completion of the experiment, the columns were dismantled, and the aquifer material sampled into three sections at 0–3, 3–8, and 8–16 cm. Each section was analysed for total carbon, total nitrogen, plus indicators of biofilm presence, polysaccharide, and DNA content. The remaining 0–3 and 3–8 cm material was combined (0–8 cm) and along with the remaining 8–16 cm section, were analysed for particle size (sand, silt, and clay), as determined by dispersion, wet and dry sieving, and the pipette sub-sampling method [42], total iron, and manganese [43].
Two sub-samples of approximately 0.5 g from each column section and from the original column packing material were collected, (i) for polysaccharide analysis and (ii) for DNA extraction. The remainder of the material from each section was dried at 105 °C for 24 h to determine total water content. Bacterial polysaccharide production was quantified using the phenol-sulphuric acid method [44]. DNA was extracted from the 0.5 g sub-sample using the MoBio PowerSoil® DNA Isolation kit (Qiagen, Chadstone, VIC, Australia) with a mechanical disruption step of 6 m/s for 30 s using a FastPrep-24® tissue and cell homogenizer (MP Biomedicals, Seven Hills, Australia). The final elution volume was 100 µL. The DNA extracted was quantified using a NanoDrop™ ND-1000 Spectrophotometer (Thermo Fisher Scientific, Brisbane, Australia) and concentrations were calculated by the instrument software. Bacterial 16S genes were amplified in a TaqMan™ gene expression (qPCR) assay (Thermo Fisher Scientific, Brisbane, Australia) [45].

3. Results

3.1. Aquifer Material Properties

The Werribee Formation aquifer material was dominated by quartz, quantified as >99% by XRD analysis, with <1% kaolin. Elemental compositions determined by XRF reported 0.26% Al2O3, 0.14% SO3, 0.07% MgO, 0.06% Na2O, 0.05% Fe2O3, and 0.03% K2O. Particle size analysis of the composite material indicated that coarse sand was dominant at 82%, followed by fine sand (15%), silt (1.4%), and clay (0.9%). Clay minerals (kaolinite) contributed to the cation exchange capacity (CEC) of 2.7 meq/100 g. Total carbon and nitrogen levels of the composite material were very low at 0.5% and 0.02%, respectively.

3.2. Water Quality

Table 1 summarises the water quality for each of the four blend waters and the ambient groundwater in the Werribee aquifer. Table 2 presents the quality of column study effluent for each of the four source waters.
Mean turbidity for each of the blends ranged from 0.9 to 1.1 NTU, with TSS all below the analytical detection limit (<1 mg/L), indicating very low particulate levels detected in each blend. Stuyfzand and Osma [15] report that TSS above 0.1 mg/L presents a physical clogging risk in sandy aquifers. Particle size analysis showed that the unfiltered blend (Blend A) had the highest average particle size (d50) at 67 μm based on measurement of six samples, with the remaining three Blends, F, UF, and GAC, reducing in turn to near below instrument detection, with only one sample being able to be measured reliably: Blend F 6 μm, Blend UF 3 μm, Blend G 1 μm.
The TSS was slightly lower than field measured values [15] for an unfiltered blend of 33% Class A recycled water and 67% reverse osmosis (RO)-treated Class A water of 1–2.5 mg/L. While the field trial commenced without an additional pre-filtration step, most of the blended sample (67%) is expected to have had filtration prior to RO treatment. The laboratory study focused on water quality treatment to minimise clogging and does not include the potential for intermittent occurrences, such as mobilisation of particulates during transit through pipe infrastructure, that can contribute to physical clogging in an operational scheme. In the field trial [15], it was reported that physical clogging dominated due to filtration of particulates present in the source water, with TSS up to 2.5 mg/L. Physical clogging was significant enough to recommend the addition of pre-filtration [15], with further evaluation of the effectiveness of filtration provided in this study.
The GAC blend had a ten-fold lower DOC (0.5 mg/L) than the three other source waters, which averaged 3.8 mg/L DOC. It was also shown that BDOC was reduced by GAC treatment from 0.5 mg/L to 0.2 mg/L. Comparable DOC concentrations of 3.6 to 3.9 mg/L were reported from field analysis, with BDOC ranging from 0.3 to 1.4 mg/L [15]. With the GAC treatment, pH was found to increase from 7.3 in the Blend A, Blend F, and UF waters, to a mean of 8.5 in the GAC-treated water. This artefact of GAC treatment was most likely from mineral ash washed from the GAC material. The slightly higher pH was not maintained after passage through the column, with column effluent pH ranging from 7.5 to 8.1, with the highest value for Blend UF. This compared to field values near neutral pH of 7.2 to 7.6 for blended source water [15].
Iron (4–12 µg/L) and manganese (<0.3–7 µg/L) concentrations in source water were lower than those measured in the field (iron 18–99 µg/L; manganese 14–38 µg/L) due to the lower TSS content. Aluminium in the Blend G source water increased more than 10-fold from <5 to 80 µg/L, which exceeds the range reported in field trials [15] and is attributed to mineral ash washed from the GAC filter during treatment [15].
Turbidity remained relatively stable in the effluent compared with that in the source waters for all columns except those for Blend UF, where one column (UF1) lost observable material throughout the study, with turbidity averaging 1.9 NTU (with 1.4 NTU average for the pair of UF columns), double the average of 0.9 NTU for other columns. The material lost from the column was likely mobilised silt, resulting in an average 90th percentile (d90) particle size in the column effluent of 19 μm compared with a d90 of 5 μm in the column influent. The material lost did not increase the gravimetrically determined total suspended solids in the column effluent, which remained <1 mg/L, nor did it increase the concentration of iron, manganese, or aluminium. Given the low carbonate content of the column material, there were no increases in calcium or alkalinity in the column effluent to indicate calcite dissolution had occurred.

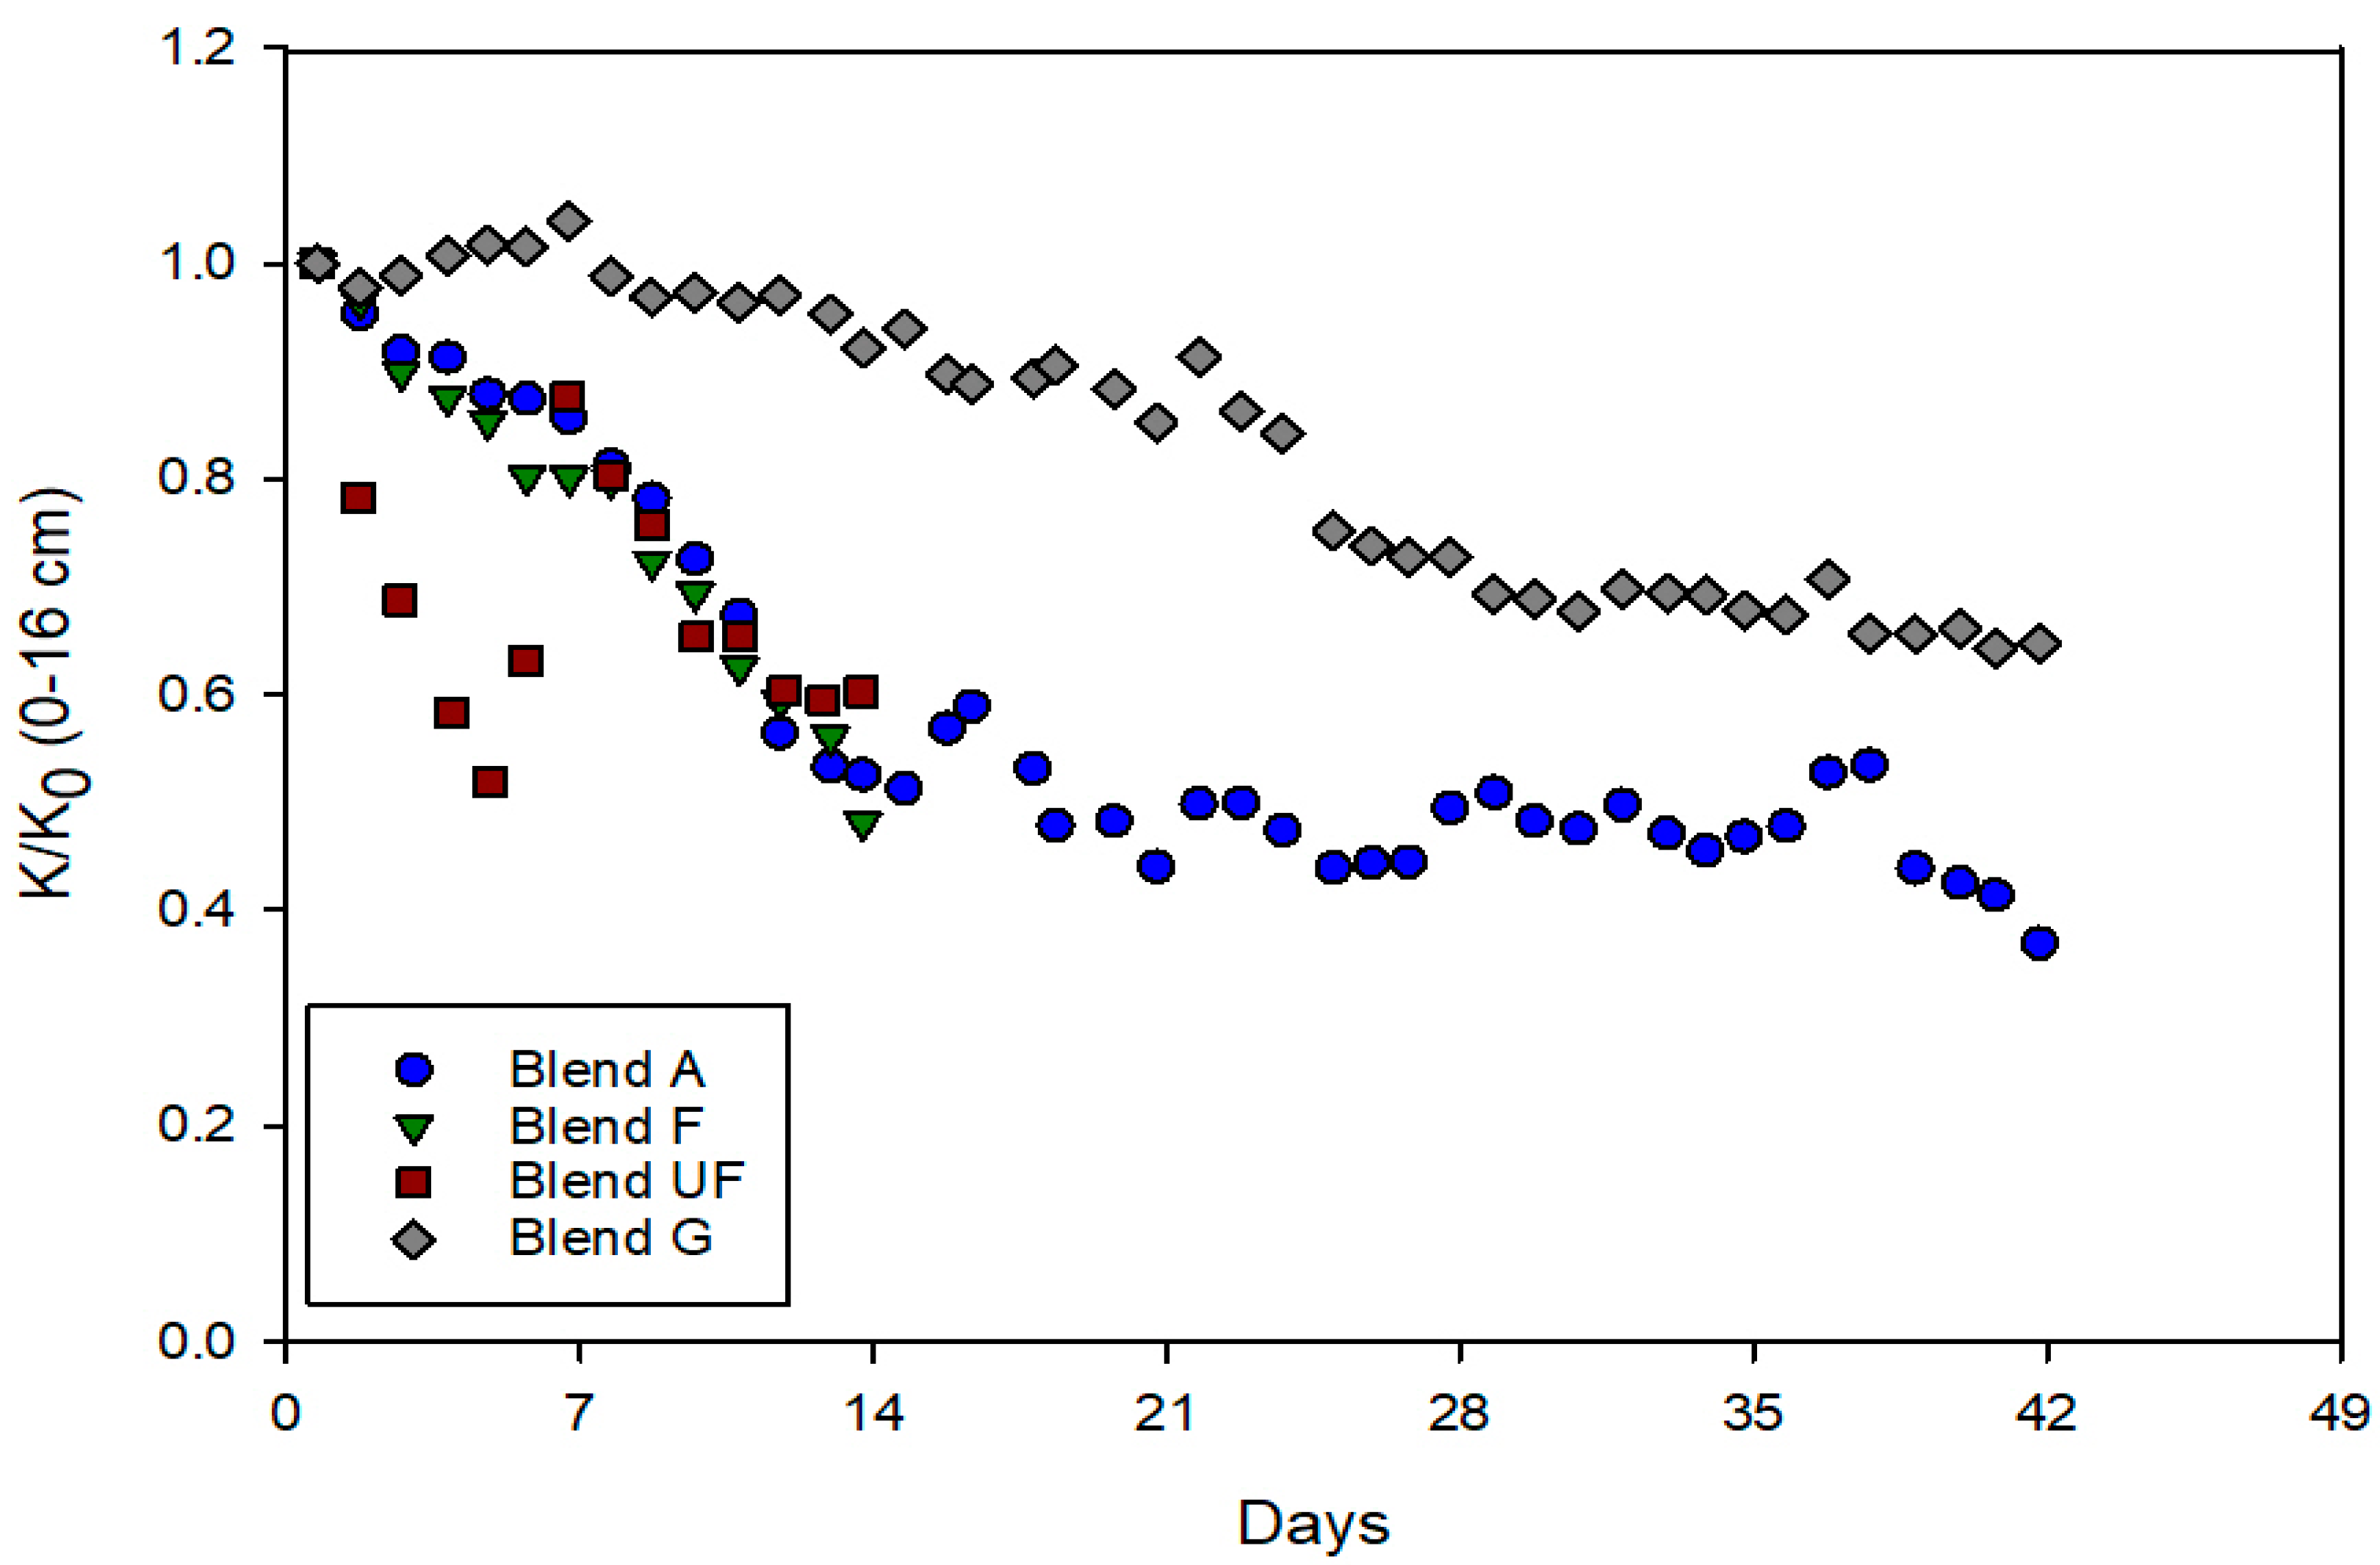
3.3. Hydraulic Conductivity

To enable comparison between individual columns, all data were normalised to the starting hydraulic conductivity (K0). Over the first 3 cm of column length (at the base of the column), the mean initial hydraulic conductivity was 2.4 m/d and coefficient of variation (CV) of 23%, which was systematically 17% lower than that over the whole column (0–16 cm), with a mean of 2.9 m/d (Table 1) with CV of 24%, which would be due to settlement and migration of fines during the packing and compaction of columns during their establishment.
After 14 days of operation, there were declines in hydraulic conductivity (K/K0) for all columns receiving Blend A, Blend F, and Blend UF waters, with declines ranging from 51% to 63% at the 0–3 cm interval (Figure 2) and 39–52% over the entire column (Figure 3), compared with no decline in the Blend G columns at 0–3 cm and only a 7% decline over the 0–16 cm Blend G columns. The K/K0 values plotted are the mean of each pair of columns; between each of these pairs, there was some variation for each water type, with average CV of 1.7% for GAC, 4.8% Blend UF, 8.9% Blend F, and 9.8% Blend waters.
On day 14, Blend F (20 µm filter) column operations ceased as they had shown a >50% decline in K/K0, indicating that this filter size was not adequate to prevent clogging. Another pair of columns was then prepared and after inoculation with groundwater for 2 days, commenced with a finer filter, Blend UF (5 µm filter) on day 21, running until the end of the experiment (21 days). K/K0 for the Blend UF is presented for 14 days prior to the loss of material which resulted in an increase in K/K0 over the final week of the experiment. Blend A and Blend G columns ran for the entire experiment to day 42 (6 weeks). At the end of the six week experiment, the Blend A columns showed a further 7% average loss of conductivity at the inlet (0–3 cm) and 16% over the whole column (0–16 cm), whereas Blend G columns showed an overall average 30% decline over the inlet and the whole column, since day 14.

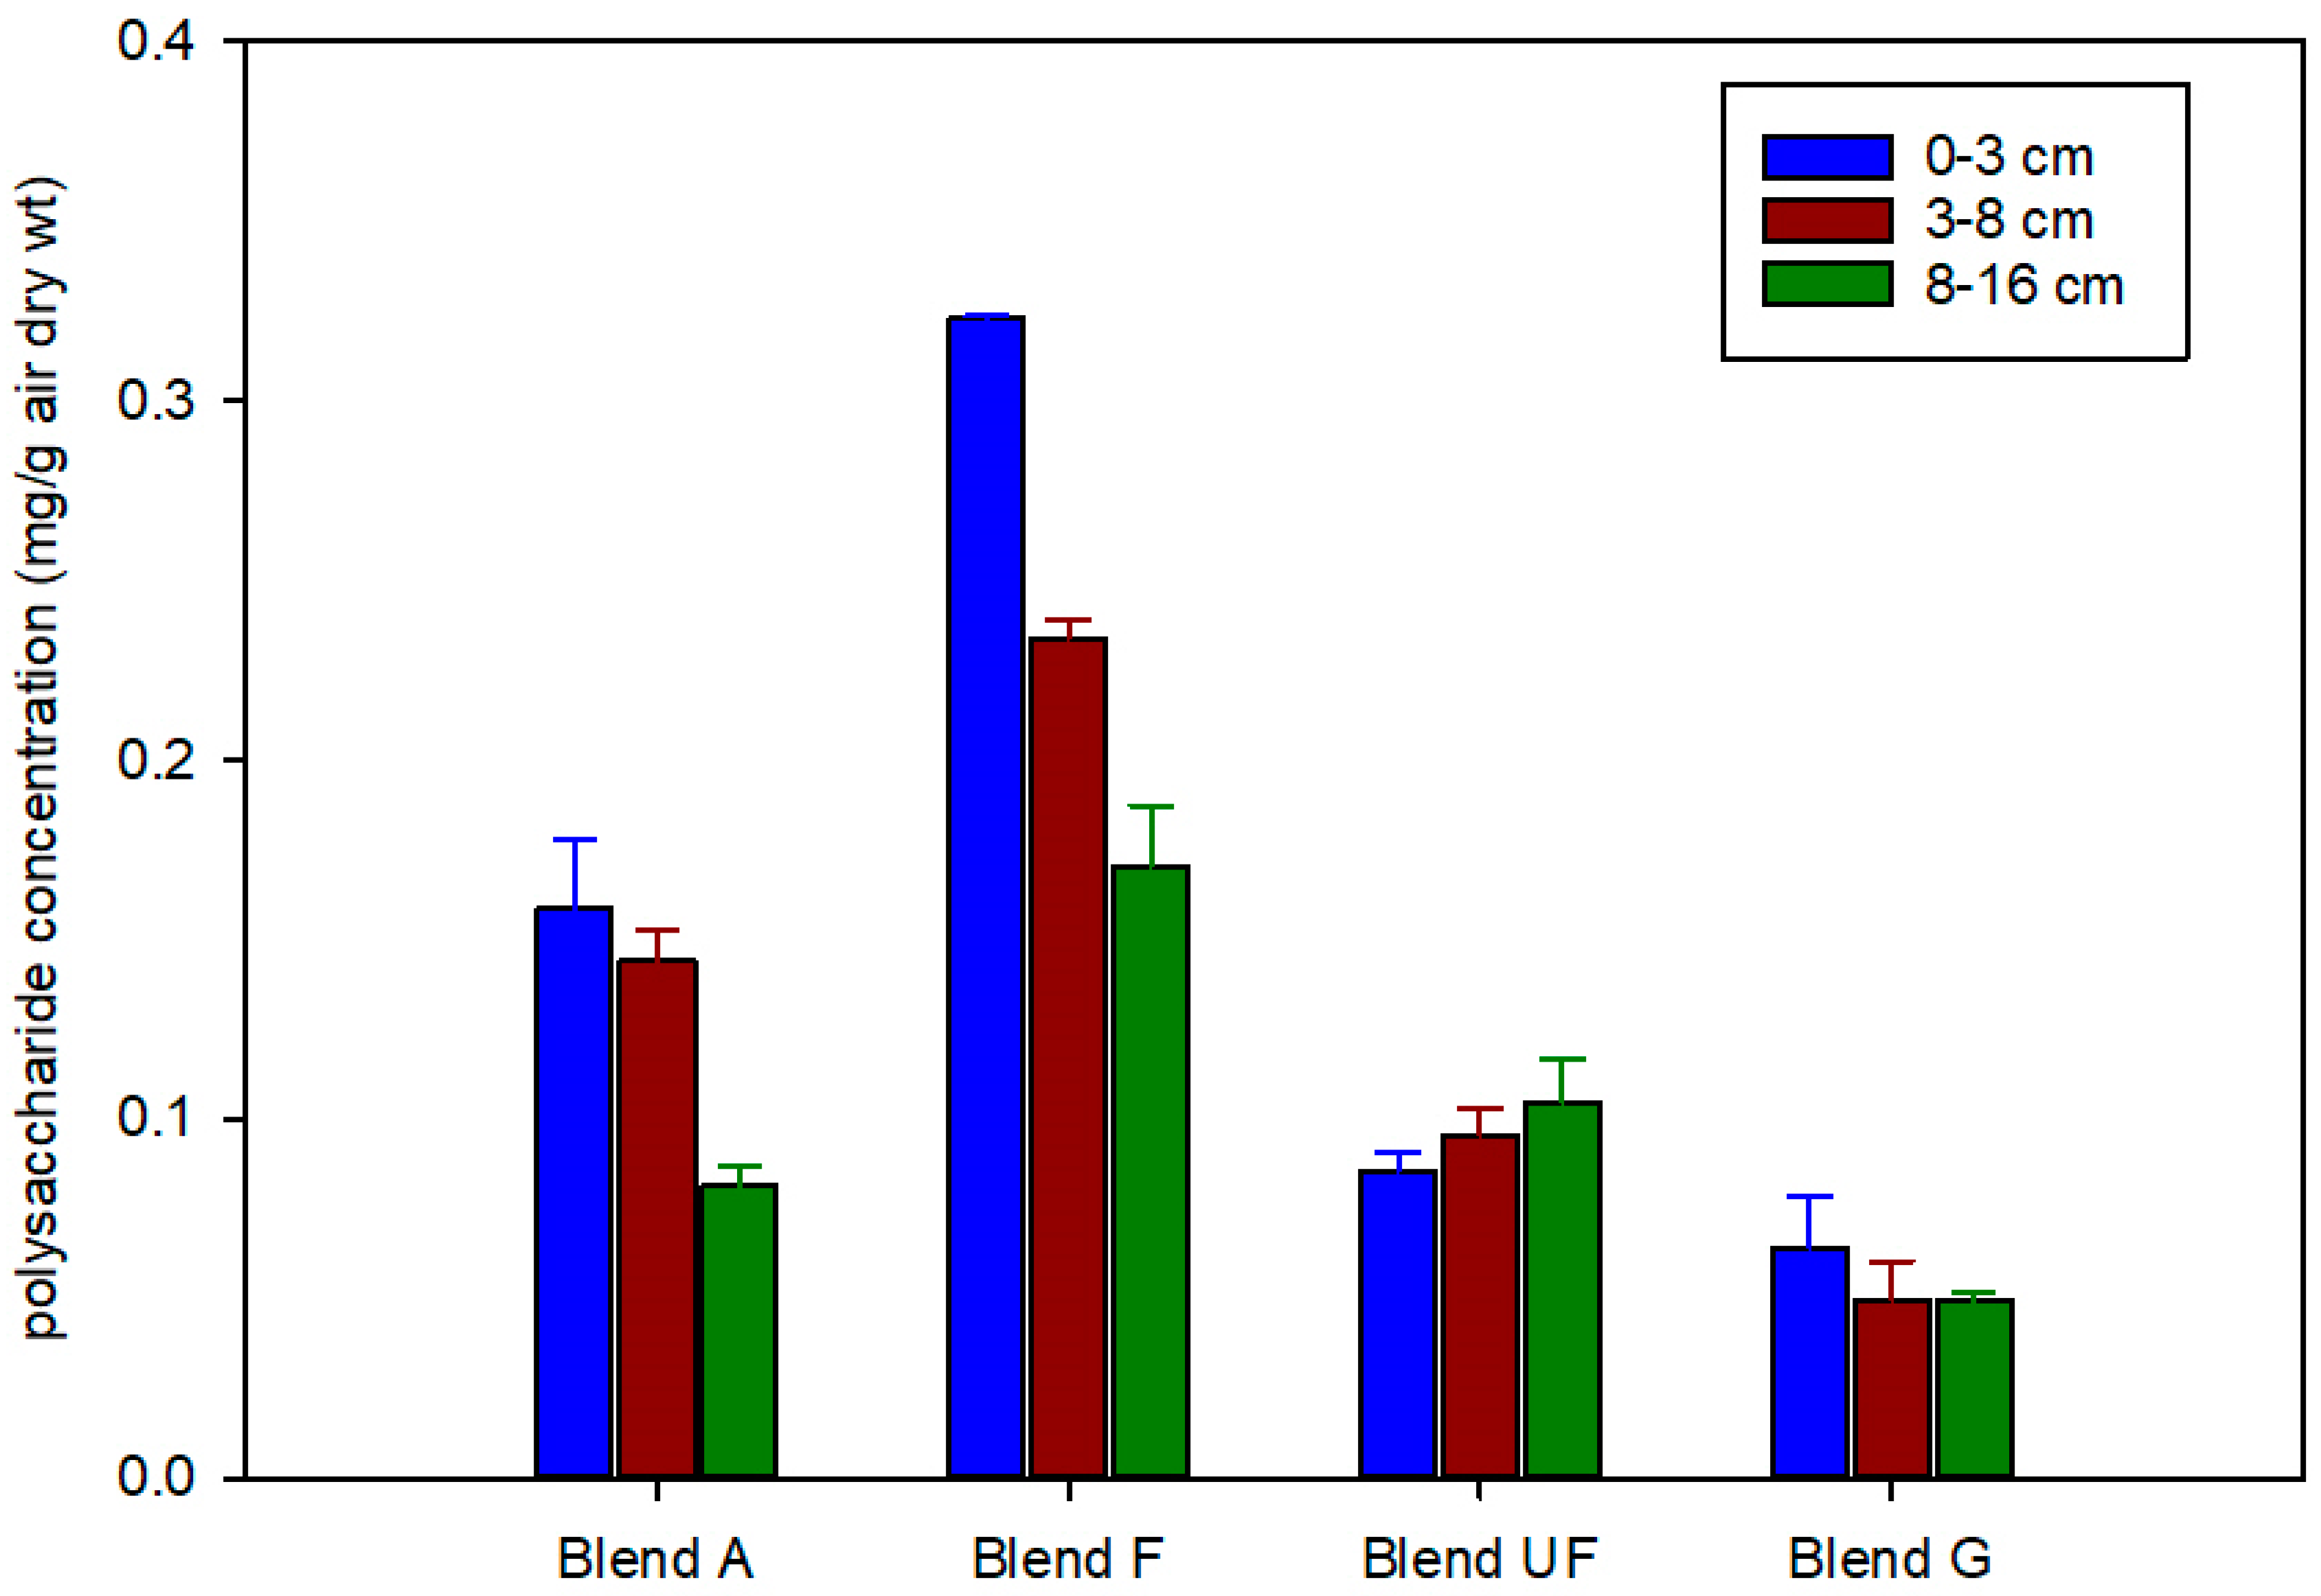
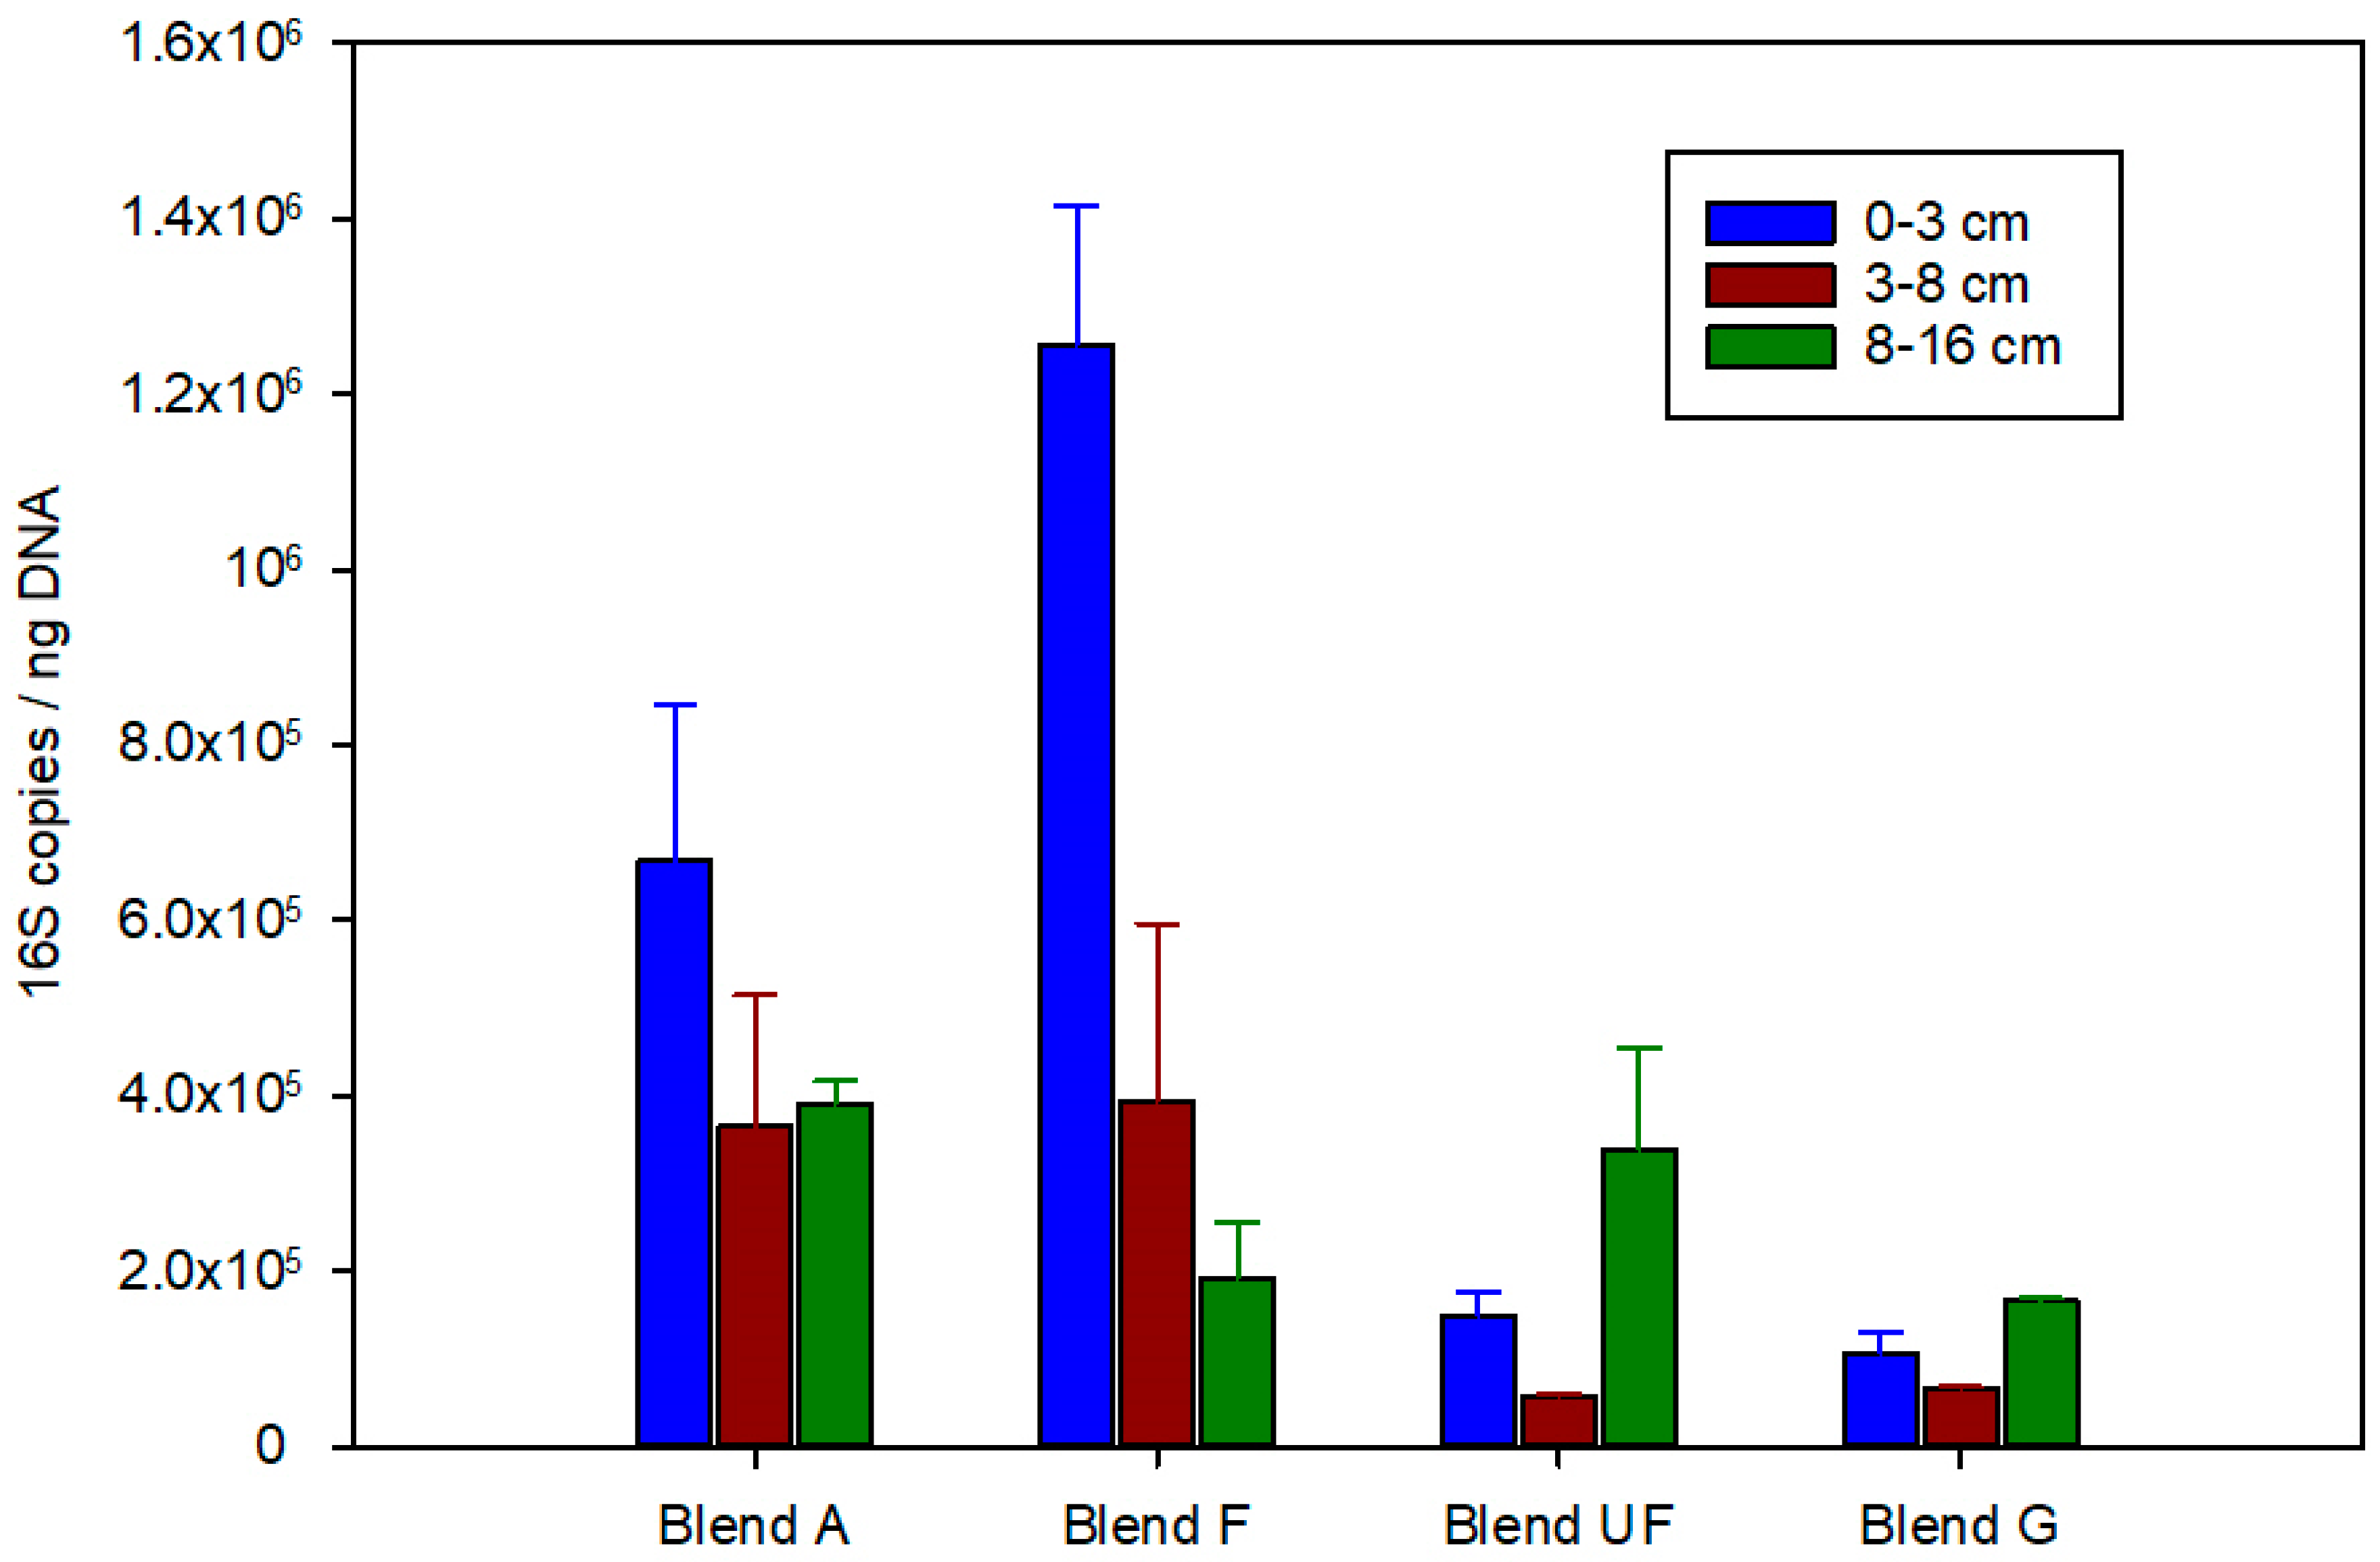
3.4. Biofilm Analysis

The polysaccharide concentrations provide a quantitative measure of the presence of biofilm. However, as polysaccharide production and consumption are dynamic processes in biofilms, measured concentrations should be assessed as a relative rather than an absolute measure (reported as mg/g aquifer material). Polysaccharides were detected throughout the length of each column, with the highest concentrations generally found near the inlet 0–3 cm (Figure 4), which corresponds to the greatest reduction in K/K0 permeability (Figure 2). However, levels were low, ranging from a minimum of 0.04 to a maximum of 0.32 mg/g, compared with the original sample (pre-packing column material mixed with groundwater) at a level of 0.003 mg/g. Blend A and Blend F had the highest polysaccharide concentrations, and an accumulation of red/brown material was observed near the inlet, which is indicative of iron precipitation within the biofilm. Based on the influent quality and K/K0 reduction, there is no reason to expect lower polysaccharide concentration in Blend UF, unless this material was mobilised and lost prior to column dissection. Other comparable column studies [13,18,33] reported much higher polysaccharide concentrations of 1 mg/g at the inlet of columns associated with receiving water with higher DOC concentrations over 15 mg/L and for river water [18] and higher BDOC (2.5 mg/L) concentrations [33].
The DNA analysis largely supports the polysaccharide results, with higher numbers near the inlets and in columns receiving Blend A and Blend F. DNA numbers ranged from 5 × 10⁴ to 1.3 × 10⁶ (Figure 5) 16S copies/ng DNA across the four treatments and were comparable to the range reported in similar studies [18] (5 × 10³–6.3 × 10⁷ 16S copies/ng DNA) with untreated turbid river water, river water treated by bank filtration, by conventional coagulation, and by coagulation and GAC. For the GAC columns, the numbers remained below 1.7 × 10⁵ 16S copies/ng DNA, compared with numbers up to 1.3 × 10⁶ 16S copies/ng DNA in columns receiving source water without GAC treatment [18].

4. Discussion

4.1. Physical Clogging Potential Assessment

The physical clogging potential for each of the Blend source and effluent waters was assessed by examining the levels of indicator parameters, such as total suspended solids, turbidity, and particle size distribution (Table 1 and Table 2). As described above, there were very low levels of particulate matter in each of the four blended waters, with total suspended solids (TSS) below the analytical detection limit (<1 mg/L) from all the weekly samples throughout the study. Turbidity was measured daily, with mean turbidity ranging from 0.9 to 1.1 NTU (nephelometric turbidity units), with standard deviations of 0.2 to 0.3 NTU, and gave a similar result.
The median particle size (d50) varied by barely one order of magnitude across the different composite samples of each of the source waters. The average d50 values were ~1 µm for Blend G water, 3 µm for Blend UF, 5 µm for Blend F, and 67 µm for the Blend A water. However, the readings for the Blend F, UF, and G waters (influent and effluent) were close to the detection limit of the instrument, thus no clear relationship between the particle size entering and exiting the columns could be discerned with confidence. The available data showed some evidence for removal of the largest particles by filtration, with a reduction in d50 from 67 to 1 μm observed for the Blend A source water. The remaining source waters which contained smaller particle sizes illustrated removal, presumably by filtration, only for the larger particle sizes (e.g., Blend UF d90 reduction from 32 to 7 μm). This is evidence of particle straining occurring, which would contribute to physical clogging. This interpretation was also supported by the field studies, where the median particle size of backflushed water increased by an order of magnitude from 14.3 µm (unfiltered source water) to 127 µm [15]. This can be explained as filtration of the larger particles in the source water (d90 269 µm) soon after injection with some recovery during backflushing.
The source water quality results shown in Table 2 reveal large differences in some parameters thought to influence clogging. From the slope of the relative permeability vs. time graphs (Figure 2 and Figure 3), it is inferred that for all columns, except GAC, the first 14 days resulted in a reduction of K/K0 from 1 to 0.4 (0–3 cm) and 1 to 0.5 (0–16 cm). Normally, physical clogging predominates over biological clogging early in an experiment. However, as Blend F and UF were filtered through 20 μm and 5 μm, respectively, and the relative permeability mimicked that of the unfiltered blend, it suggests that the physical clogging was due to fine colloidal material (<5 µm), or another clogging mechanism was also involved. The GAC columns were initially stable, then showed a decline in K/K0 after a period of 21 days from 1 to 0.8 (0–3 cm) and 0.9 to 0.7 (0–16 cm). This decline coincided with the GAC column reaching the end of its adsorption capacity before it was replaced with a new GAC material.

4.2. Biological Clogging Potential Assessment

Microbial growth can be defined as the collective increase in the number of bacterial cells and the extracellular polymeric materials (slimes) that they secrete, which occur where there are sufficient organic and inorganic substrates present in the source water. Microbial clogging develops over timescales of days to weeks but is typically slower than physical clogging [13].
Levels of dissolved organic carbon (DOC) in the unfiltered Blend A and filtered Blends F and UF were moderate, ranging from a maximum of 4.3 mg/L to a minimum of 3.3 mg/L. Following GAC treatment, DOC levels ranged from 0.4 to 0.7 mg/L, i.e., a ten-fold decrease in DOC on average. The blended water DOC was slightly above the recommended DOC of <1.7 mg/L set for ASR operations in a low-permeability fractured rock aquifer [32]. More transmissive carbonaceous aquifers have been shown to operate with much higher organic carbon in the source water for ASR (total organic carbon > 18 mg/L) as carbonate dissolution near the well-face can counteract the impact of biological clogging [25].
The role of nitrogen in biological clogging is important if it is the nutrient limiting biological growth [25]. Without the presence of biodegradable organic carbon, high nitrogen concentrations will not lead to biological clogging. During the column study, total nitrogen (TN) levels were relatively high with averages for all four waters ranging from 7.8 to 14.5 mg/L. C:N ratios < 1, much lower than the Redfield ratio for aquatic biomass (C:N:P 106:16:1 [46]), indicate that nitrogen is not the limiting nutrient. N:P ratios of 5–8 may be limiting in a carbon-rich environment.
BDOC provides an indicator of the bioavailability of the organic carbon in water samples that may be analogous to microbial clogging of injection wells [25,47]. Average BDOC concentrations were low for all source waters, with 0.5 mg/L for the Blend water, 0.4–0.5 mg/L for the Blend F and UF waters, and 0.2 mg/L for the Blend G water, with 2 readings being below detection of <0.2 mg/L. Thus, only the GAC-treated water was considered biologically stable [18]. The blended water BDOC was slightly above the recommended BDOC of <0.2 mg/L set for ASR operations in a low-permeability fractured rock aquifer [32] and in a medium to coarse sand aquifer [18]. Field observations of a subsequent ASR injection cycle using the same blends of water had higher BDOC levels, and some clogging of the injection wells was observed supporting this interpretation [15]. Suspended matter recovered from the ASR trial during backflushing water was reported as having an organic carbon concentration of 7000 mg/L (c.f. 0.23 mg/L in the source water), which further supports the observation that biological clogging will impact this operation [15]. However, with particulate matter also present in the source water during the field trial, management of physical clogging was deemed a higher priority than biological clogging in the first instance. Nevertheless, this present study confirms that neither mechanism can be discounted.
Distinct differences in polysaccharide profiles were observed between the GAC-treated columns and all others. The polysaccharide presence in the Blend G columns was relatively constant throughout the column, with an average of 0.05 mg/g across all depths. This same trend of a constant level of polysaccharides was observed for GAC-treated river waters [18,33]. For both the Blend A and Blend F columns, polysaccharides peaked in the 0–0.5 cm sections at 0.13–0.32 mg/g, decreasing near the centre and outlet of the columns to a range of 0.07–0.19 mg/g, however this was still higher than the average for the Blend G columns. The Blend F columns showed the highest concentration of polysaccharides, with 0.32 mg/g at the inlet down to an average of 0.16 mg/g at the outlet and had only been operating for 14 days before clogging to >50% K/K0. The Blend A and Blend F source water quality, particularly the concentration of BDOC, is comparable and does not explain why polysaccharides are higher in the filtered columns. Blend F columns were subject to a chlorine residual levels <0.2 mg/L target for the first week of operation, which may have provided an opportunity for biological growth. DOC (r2 = 0.98), BDOC (r2 = 0.88), and free residual chlorine (r2 = 0.88) concentrations all exhibited a correlation with the decline in average hydraulic conductivity over the first 14 days of the experiment, also suggesting biological clogging as the cause. Turbidity in the source water, an indicator of physical clogging risk, did not show a relationship (r2 = 0.33) with the decline in average hydraulic conductivity over the same time period. Blend UF columns were relatively stable across the column, averaging 0.1 mg/g over a 21-day period, but still double that was measured on average in the Blend G columns at 42 days. Less biological growth appears to be the dominant reason for higher hydraulic conductivity in the GAC-treated columns based on the biomass data (Figure 5) and supported, but less distinctly, by polysaccharide data (Figure 4). DOC was substantially lower than for all other columns, 0.5 mg/L compared with an average of 3.8 mg/L (Table 2).

4.3. Water Quality Targets for Sustainable ASR Injection

ASR injectant water quality and associated pre-treatment to manage well clogging needed to be defined. In this study, a conservative approach was adopted based on injectant water quality with target BDOC levels of 0.2 mg/L and laboratory clogging trials. This is consistent with other previous studies [18,32] for biologically stable water used for ASR. It is suggested that in the absence of specific information, this could be used as a more general conservative indicator of biological stability of ASR source water. Indeed, these targets were adopted for a subsequent field trial using the same source water [15]. However, the water quality targets alone may not be enough to manage clogging due to source water variability and the operational realities of water treatment and would need to be supported by periodic ASR well backflushing during injection cycles. This combination of suitable water quality and operational strategies has been found to be effective in managing clogging at many operational ASR sites [8,25,32,48,49]. Field trials subsequently confirmed these observations as physical and biological clogging were the dominant causes of ASR bore clogging at this site [15]. These observations were further confirmed by hydraulic data, and geochemical and microscopic analysis of particles in the backflushed water during well redevelopment [15]. The field experience also highlighted how one clogging mechanism (in this case physical clogging) may appear dominant and mask other potential operational risks (i.e., biological clogging). When evaluating uncertainties in developing an aquifer storage and recovery (ASR) system, a staged approach to project development is needed to prioritise investigations such as the clogging studies reported here. This study supports previous observations [49] that clogging studies are invaluable as an adjunct to field trials and demonstrates that the clogging mechanisms may be evaluated differently and show the evolving understanding of operational viability of ASR schemes.

5. Conclusions

This study considered the pre-treatment requirements to allow sustained recharge of Class A-treated recycled water at a sustainable rate in a medium–coarse-grained siliceous aquifer. The water source intended for use in ASR is a blend of 40% Class A water with 60% reverse osmosis (RO)-treated Class A water. Clogging was evident in both the blended and filtered waters, while the biologically stable GAC-treated blend resulted in minimal reduction in column permeability. Polysaccharide accumulation indicated the presence of biological clogging, while the rapid reduction in permeability indicated some physical clogging due to filtration of particulate matter in the source water. In this study, a conservative approach was adopted with target BDOC levels of 0.2 mg/L to ensure a biologically stable source of water for recharge. This is consistent with the previous recommendations to manage biological clogging in siliceous aquifers with various source waters (stormwater, surface water). Therefore, it is proposed that BDOC of 0.2 mg/L could be adopted internationally as a suitable water quality target for sustainable injection of ASR schemes in non-carbonaceous aquifers to manage biological clogging. As some physical clogging was evident with TSS < 1 mg/L, a more stringent target for TSS is recommended to manage physical clogging.

Author Contributions

Conceptualization, D.W.P. and J.L.V.; methodology, K.E.B.; formal analysis, D.W.P. and J.L.V.; investigation, J.L.V., K.E.B., and D.G.; data curation, K.E.B.; writing—original draft preparation, D.W.P., J.L.V., and K.E.B.; writing—review and editing, D.W.P. and J.L.V. All authors have read and agreed to the published version of the manuscript.

Funding

The experimental study reported was supported by City West Water.

Acknowledgments

The authors would like to thank numerous City West Water representatives for their contribution to this study, in particular Muthu Muthukaruppan, Matt Hudson, Aleks Svazas, Chris Arabatzoudis, Javier Osma, Attila Gaal, and Tim Smith. The authors gratefully acknowledge the staff of CSIRO Land and Water Analytical Services Unit (Waite Campus) and at Australian Water Quality Centre (SA Water) for analytical services, Toney Hirnyk (CSIRO), Harold Rankine (CSIRO), and Mike Rettke (SARDI), for assistance provided during the study. Finally, the authors thank Peter Dillon (CSIRO, Flinders University, Adelaide University), Mike Donn (CSIRO), and Jatinder Sidhu (CSIRO) for their thoughtful review comments that greatly improved this manuscript.

Conflicts of Interest

The authors declare no conflict of interest. The funders had no role in the design of the study; in the collection, analyses, or interpretation of data; in the writing of the manuscript, or in the decision to publish the results.

References

  1. Van der Bruggen, B. The global water recycling situation. Sustain. Sci. Eng. 2010, 2, 41–62. [Google Scholar]
  2. Nikolaos, V. Water reuse from a circular economy perspective and potential risks from an unregulated approach. Curr. Opin. Environ. Sci. Health 2018, 92, 32–45. [Google Scholar]
  3. Page, D.; Dillon, P. Characterisation of clogging during urban stormwater aquifer storage and recovery operations in a low permeability fractured rock aquifer. Clogging Issues Associated with Managed Aquifer Recharge Methods; Martin, R., Ed.; IAH Commission on Managing Aquifer Recharge: Adelaide, Australia, 2013; pp. 26–33. Available online: www.iah.org/recharge/clogging.htm (accessed on 10 June 2020).
  4. Dillon, P.; Pavelic, P.; Toze, S.; Rinck-Pfeiffer, S.; Martin, R.; Knapton, A.; Pidsley, D. Role of aquifer storage in water reuse. Desalination 2006, 188, 123–134. [Google Scholar] [CrossRef]
  5. Fan, W.; Yang, X.; Wang, Y.; Huo, M. Loopholes in the current reclaimed water quality standards for clogging control during aquifer storage and recovery in China. Water Cycle 2020, 1, 13–18. [Google Scholar] [CrossRef]
  6. Vanderzalm, J.; Page, D.; Regel, R.; Ingleton, G.; Nwayo, C.; Gonzalez, D. Nutrient transformation and removal from treated wastewater recycled via Aquifer Storage and Recovery (ASR) in a carbonate aquifer. Water Air Soil Pollut. 2020, 231, 65. [Google Scholar] [CrossRef] [Green Version]
  7. Fielding, K.; Dolnicar, S.; Schultz, T. Public acceptance of recycled water. Int. J. Water Resour. D 2018, 35, 1–36. [Google Scholar] [CrossRef]
  8. Pyne, R.D.G. Aquifer Storage Recovery: A Guide to Groundwater Recharge through Wells; ASR Press: Columbia, SC, USA, 2005. [Google Scholar]
  9. Dillon, P.; Stuyfzand, P.; Grischek, T.; Lluria, M.; Pyne, R.D.G.; Jain, R.C.; Bear, J.; Schwarz, J.; Wang, W.; Fernandez, E.; et al. Sixty years of global progress in managed aquifer recharge. Hydrogeol. J. 2019, 27, 1–30. [Google Scholar] [CrossRef] [Green Version]
  10. de la Loma González, B. Clogging of deep well infiltration recharge systems in the Netherlands. In Clogging Issues Associated with Managed Aquifer Recharge Methods; Martin, R., Ed.; IAH Commission on Managing Aquifer Recharge: Adelaide, Australia, 2013; pp. 163–173. [Google Scholar]
  11. Martin, R. (Ed.) Clogging Issues Associated with Managed Aquifer Recharge Methods; IAH Commission on Managing Aquifer Recharge: Adelaide, Australia, 2013; Available online: https://recharge.iah.org/files/2015/03/Clogging_Monograph.pdf (accessed on 10 June 2020).
  12. Rinck-Pfeiffer, S.; Dillon, P.; Ragusa, S.; Hutson, J.; Fallowfield, H.; de Marsily, G.; Pavelic, P. Reclaimed Water for Aquifer Storage and Recovery: A Column Study of Well Clogging. Clogging Issues Associated with Managed Aquifer Recharge Methods; Martin, R., Ed.; IAH Commission on Managing Aquifer Recharge: Adelaide, Australia, 2013; pp. 26–33. [Google Scholar]
  13. Rinck-Pfeiffer, S.; Ragusa, S.; Sztajnbok, P.; Vandevelde, T. Interrelationships between biological, chemical, and physical processes as an analog to clogging in Aquifer Storage and Recovery (ASR) wells. Water Res. 2000, 34, 2110–2118. [Google Scholar] [CrossRef]
  14. NRMMC-EPHC-NHMRC. Australian Guidelines for Water Recycling: Managing Health and Environmental Risks (Phase 2); Managed Aquifer Recharge; Natural Resource Management Ministerial Council; Environment Protection and Heritage Council; National Health and Medical Research Council: Canberra, Australia, 2009.
  15. Stuyfzand, P.J.; Osma, J. Clogging issues with aquifer storage and recovery of reclaimed water in the brackish Werribee aquifer, Melbourne, Australia. Water 2019, 11, 1807. [Google Scholar] [CrossRef] [Green Version]
  16. Jeong, H.Y.; Jun, S.-C.; Cheon, J.-Y.; Park, M. A review on clogging mechanisms and managements in aquifer storage and recovery (ASR) applications. Geosci. J. 2018, 22, 667–679. [Google Scholar] [CrossRef]
  17. Vanderzalm, J.; Smitt, C.; Barry, K.; Dillon, P.; Davidge, S.; Gornall, D.; Seear, J.; Ife, D. Potential for injection well clogging in an anoxic sandstone aquifer receiving fresh, deoxygenated but chlorinated injectant. In Clogging Issues Associated with Managed Aquifer Recharge Methods; Martin, R., Ed.; IAH Commission on Managing Aquifer Recharge: Adelaide, Australia, 2013; pp. 34–49. [Google Scholar]
  18. Page, D.; Vanderzalm, J.; Miotlinski, K.; Barry, K.; Dillon, P.; Lawrie, K.; Brodie, R.S. Determining treatment requirements for turbid water to avoid clogging of aquifer storage and recovery wells in siliceous alluvium. Water Res. 2014, 66, 99–110. [Google Scholar] [CrossRef] [PubMed]
  19. Page, D.; Bekele, E.; Vanderzalm, J.; Sidhu, J. Managed Aquifer Recharge (MAR) in sustainable urban water management. Water 2018, 10, 239. [Google Scholar] [CrossRef] [Green Version]
  20. Baveye, P.; Vandevivere, P.; Hoyle, B.L.; DeLeo, P.C.; Sanchez de Lozada, D. Environmental impact and mechanisms of the biological clogging of saturated soils and aquifer materials. Crit. Rev. Environ. Sci. Technol. 1998, 28, 123–191. [Google Scholar] [CrossRef] [Green Version]
  21. Greskowiak, J.; Prommer, H.; Vanderzalm, J.; Pavelic, P.; Dillon, P. Modelling of carbon cycling and biogeochemical changes during injection and recovery of reclaimed water at Bolivar, South Australia. Water Resour. Res. 2005, 41, 10. [Google Scholar] [CrossRef] [Green Version]
  22. Appelo, C.A.J.; Postma, D. Groundwater, Geochemistry and Pollution, 2nd ed.; A A Balkema: Leiden, The Netherlands, 2005. [Google Scholar]
  23. Konikow, L.F.; August, L.L.; Voss, C.I. Effects of clay dispersion on Aquifer Storage and Recovery in coastal aquifers. Transp. Porous Med. 2001, 43, 45–64. [Google Scholar] [CrossRef]
  24. Pérez-Paricio, A.; Carrera, J. Validity and sensitivity analysis of a new comprehensive clogging model. In Calibration and Reliability in Groundwater Modelling: Coping with Uncertainty, Proceedings of the ModelCARE-99 Conference, Zürich, Switzerland, 20–23 September 1999; Stauffer, F., Kinzelbach, W., Kovar, K., Hoehn, E., Eds.; International Association of Hydrological Science (IAHS): Wallingford, UK, 2000; pp. 47–53. ISBN 1-901502-36-8. [Google Scholar]
  25. Pavelic, P.; Dillon, P.J.; Barry, K.E.; Vanderzalm, J.L.; Correll, R.L.; Rinck-Pfeiffer, S.M. Water quality effects on clogging rates during reclaimed water ASR in a carbonate aquifer. J. Hydrol. 2007, 334, 1–16. [Google Scholar] [CrossRef]
  26. Pavelic, P.; Dillon, P.; Mucha, M.; Nakai, T.; Barry, K.; Bestland, E. Laboratory assessment of factors affecting soil clogging of soil aquifer treatment systems. Water Res. 2011, 45, 3153–3163. [Google Scholar] [CrossRef] [PubMed]
  27. Heilweil, V.M.; Solomon, D.K.; Perkins, K.S.; Ellet, K.M. Gas-partitioning tracer test to quantify trapped gas during recharge. Groundwater 2004, 42, 589–600. [Google Scholar] [CrossRef]
  28. Segalen, A.-S.; Pavelic, P.; Dillon, P. Review of Drilling, Completion and Remediation Methods for ASR Wells in Unconsolidated Aquifers; Technical Report No. 04/05; CSIRO Land and Water: Collingwood, Australia, 2005. [Google Scholar]
  29. Mirecki, J.E.; Campbell, B.G.; Conlon, K.J.; Petkewich, M.D. Solute changes during aquifer storage recovery testing in a limestone/clastic aquifer. Groundwater 1998, 36, 394–403. [Google Scholar] [CrossRef]
  30. Herczeg, A.L.; Rattray, K.J.; Dillon, P.J.; Pavelic, P.; Barry, K.E. Geochemical processes during five years of Aquifer Storage Recovery. Groundwater 2004, 42, 438–445. [Google Scholar] [CrossRef]
  31. Vanderzalm, J.L.; Page, D.W.; Barry, K.E.; Dillon, P.J. A comparison of the geochemical response to different managed aquifer recharge operations for injection of urban storm water in a carbonate aquifer. J. Appl. Geochem. 2010, 25, 1350–1360. [Google Scholar] [CrossRef]
  32. Page, D.W.; Miotliński, K.; Dillon, P.; Taylor, R.J.; Wakelin, S.; Levett, K.; Barry, K.; Pavelic, P. Stormwater pre-treatment options for sustaining aquifer storage and recovery in low permeability fractured rock aquifer. J. Environ. Manag. 2011, 92, 2410–2418. [Google Scholar] [CrossRef] [PubMed]
  33. Miotliński, K.; Barry, K.; Dillon, P.; Lawrie, K.; Brodie, R.S. Corrigendum to “Determining treatment requirements for turbid river water to avoid clogging of aquifer storage and recovery wells in siliceous alluvium”. Water Res. 2016, 101, 640–641. [Google Scholar]
  34. Sinclair, K.M. West Werribee Dual Supply Project–Phase 1 ASR Investigation–SRP Site Hydrological Investigation for City West Water; Sinclair Knight Mertz Pty Ltd.: Melbourne, Australia, 2012. [Google Scholar]
  35. Norrish, K.; Hutton, J.T. An accurate X-ray spectrographic method for the analysis of a wide range of geological samples. Geochim. Cosmochim. Acta 1969, 33, 431–453. [Google Scholar] [CrossRef]
  36. Matejovic, I. Determination of carbon and nitrogen in samples of various soils by the dry combustion. Comm. Soil Sci. Plant Anal. 1997, 28, 1499–1511. [Google Scholar] [CrossRef]
  37. Rayment, G.E.; Lyons, D.J. Soil Chemical Methods-Australasia; CSIRO Publishing: Clayton, Australia, 2011; pp. 318–321, 420–422.
  38. NHMRC-NRMMC. Australian Drinking Water Guidelines Paper 6 National Water Quality Management Strategy; National Health and Medical Research Council, National Resource Management Ministerial Council, Commonwealth of Australia: Canberra, Australia, 2011. [Google Scholar]
  39. Barry, K.E.; Vanderzalm, J.L.; Page, D.W.; Gonzalez, D.; Dillon, P.J. Evaluating Treatments for Management of ASR Well Clogging: Laboratory Column Study; CSIRO Land and Water, Client Report to City West Water; City West Water: Melbourne, Australia, 2015. [Google Scholar]
  40. Li, Z.; Wan, J.; Huang, K.; Change, W.; He, Y. Effects of particle diameter on flow characteristics in sand columns. Int. J. Heat Mass Transfer 2017, 104, 533–536. [Google Scholar] [CrossRef]
  41. APHA. Standard Methods for the Examination of Water and Wastewater; APHA-WEF-AWWA: Washington, DC, USA, 2005; p. 735. [Google Scholar]
  42. McKenzie, N.J.; Coughlan, K.J.; Cresswell, H.P. Soil Physical Measurements and Interpretation for Land Evaluation; CSIRO Publishing: Collingwood, Australia, 2002; pp. 224–239. [Google Scholar]
  43. United States Environmental Protection Agency. US EPA Method 3051A Microwave Assisted Acid Digestion of Sediments, Sludges, Soils and Oils; US Environmental Protection Agency: Washington, DC, USA, 1998.
  44. DuBois, M.; Gilles, K.A.; Hamilton, J.K.; Rebers, P.A.; Smith, F. Colorimetric method for determination of sugars and related substances. Anal. Chem. 1956, 28, 350–356. [Google Scholar] [CrossRef]
  45. Suzuki, M.T.; Taylor, L.T.; DeLong, E.F. Quantitative analysis of small-subunit rRNA genes in mixed microbial populations via 5’-nuclease assays. Appl. Environ. Microbiol. 2000, 66, 4605–4614. [Google Scholar] [CrossRef] [Green Version]
  46. Redfield, A.C. The biological control of chemical factors in the environment. Am. Sci. 1958, 16, 205–221. [Google Scholar]
  47. Hijnen, W.A.M.; van der Kooij, D. The effect of low concentrations of assimilable organic carbon (AOC) in water on biological clogging of sand beds. Water Res. 1992, 26, 963–972. [Google Scholar] [CrossRef]
  48. Bouwer, H.; Pyne, R.D.G.; Brown, J.; St Germain, D.; Morris, T.M.; Brown, C.J.; Dillon, P.; Rycus, M.J. Design, operation and maintenance for sustainable underground storage facilities. In American Water Works Association Research Foundation Report; AWWA Research Foundation and IWA: Denver, CO, USA, 2008. [Google Scholar]
  49. Dillon, P.; Vanderzalm, J.; Page, D.; Barry, K.; Gonzalez, D.; Muthukaruppan, M.; Hudson, M. Analysis of ASR Clogging investigations at three Australian ASR sites in a Bayesian context. Water 2016, 8, 442. [Google Scholar] [CrossRef] [Green Version]
Figure 1. Diagram of column set-up showing source water reservoir, peristaltic pump, column, and manometer board (not to scale) [18].
Water 12 02575 g001
Figure 2. Normalised hydraulic conductivity changes across the entire column (0–3 cm) for all four water types (the average of duplicate columns for each water source is shown).
Water 12 02575 g002
Figure 3. Normalised hydraulic conductivity changes at the 0–16 cm section for all four water types (the average of duplicate columns for each water source is shown).
Water 12 02575 g003
Figure 4. Mean polysaccharide concentrations for 3 intervals along the length of columns.
Water 12 02575 g004
Figure 5. Mean total DNA concentrations for intervals along the length of columns.
Water 12 02575 g005
Table 1. Water quality of source waters for assessment of the physical and biological clogging potential and hydraulic conductivities for the entire column (0–16 cm) and inlet section (0–3 cm): n is the number of samples; SD is the standard deviation.
GroundwaterBlend A Blend F Blend UF Blend G
(n = 1)nMeanSDnMeanSDnMeanSDnMeanSD
Electrical conductivity (μS/cm)4090438472615847921855264386038
pH (-)6.6427.30.1157.30.07217.30.1438.50.2
Alkalinity (meq/L)45060.60.220.70.130.60.0560.90.1
Calcium (mg/L)88613.10.5212.30.4313.50.3614.01.5
Sodium Adsorption Ratio (SAR)4.662.60.0422.50.0132.60.0462.50.1
Chlorine residual (mg/L)0860.290.16300.270.17420.290.18860.310.15
Turbidity (NTU)2.3431.00.3150.90.3211.10.3430.90.2
Total suspended solids (mg/L)107<1-3<1-4<1-7<1-
Particle size d50 (µm)127667816-13-11-
Dissolved organic carbon (mg/L)<1–373.80.233.70.344.00.270.50.1
Biodegradable dissolved organic carbon (mg/L)<0.1–0.350.50.230.40.220.5-50.20.1
Total nitrogen (mg/L)2611.84.127.90.6314.50.569.43.9
Total phosphorus (mg/L)1.763.90.223.60.133.90.262.50.6
Total iron (µg/L)0.79612221103104651
Total manganese (µg/L)0.1366.50.526.11.132.53.36<0.3-
Total aluminium (µg/L)<0.016<5-25-3<5-68014
K0 (0–16 cm, initial K/K0 = 1)-22.950.9723.430.7322.230.5822.890.27
K0 (0–3 cm, initial K/K0 = 1)-22.230.1722.850.122.170.9522.230.28
K/K0 (0–16 cm, day 14)-20.530.0420.480.020.610.2820.930.04
K/K0 (0–3 cm, day 14)-20.370.0920.390.0220.490.2121.040.06
K/K0 (0–16 cm, day 42)-20.370.02------20.650.07
K/K0 (0–3 cm, day 42)-20.300.09------20.690.02
Blend A: Recycled water blend (60% RO-treated Class A water and 40% raw Class A water) treated by chlorination; Blend F: Recycled water blend treated by filtration using 20 μm (F) sediment cartridge filter and chlorination; Blend UF: Recycled water blend treated by ultra-filtration using 5 μm (UF) sediment cartridge filter and chlorination; Blend G: Recycled water blend treated by filtration, granular activated carbon (GAC) and chlorination.
Table 2. Water quality of column effluent (average of the paired columns for each blend): n is number of samples; SD standard deviation.
Blend A
(n = 12)
Blend F
(n = 4)
Blend UF
(n = 6)
Blend G
(n = 12)
MeanSDMeanSDMeanSDMeanSD
Electrical conductivity (μS/cm)8482381098633985920
pH (-)7.50.067.50.078.10.147.50.06
Temperature (°C)19.00.519.10.319.00.518.90.7
Alkalinity (meq/L)0.60.10.60.040.50.030.90.1
Calcium (mg/L)13.20.412.40.213.60.113.91.6
Turbidity (NTU)0.90.31.00.81.41.40.80.2
Total suspended solids (mg/L)<1-<1-<1-<1-
Particle size d50 (µm)1 (n = 4)4 4 (n = 1)- 6 (n = 1)- 1 (n = 1)-
Dissolved organic carbon (mg/L)3.90.23.70.34.10.20.60.1
Total nitrogen (mg/L)12.13.68.581.715.50.29.13.7
Total phosphorus (mg/L)3.90.23.690.14.00.12.40.6
Total iron (µg/L)11.81.910.02.212.20.84.61.4
Total manganese (µg/L)6.51.14.851.04.81.1<0.3-
Total aluminium (µg/L)4.23.26.0-5.11.96113.6
Blend A: Recycled water blend (60% RO-treated Class A water and 40% raw Class A water) treated by chlorination; Blend F: Recycled water blend treated by filtration using 20 μm (F) sediment cartridge filter and chlorination; Blend UF: Recycled water blend treated by ultra-filtration using 5 μm (UF) sediment cartridge filter and chlorination; Blend G: Recycled water blend treated by filtration, granular activated carbon (GAC) and chlorination.

