Article

Ten-Year Estimation of Net Primary Productivity in a Mangrove Forest under a Tropical Monsoon Climate in Eastern Thailand: Significance of the Temperature Environment in the Dry Season

by
Sasitorn Poungparn
1,*,
Akira Komiyama
2,
Suthathip Umnouysin
3,
Chadtip Rodtassana
1,
Tanuwong Sangtiean
4,
Chatree Maknual
4,
Tamanai Pravinvongvuthi
4,
Vilanee Suchewaboripont
5 and
Shogo Kato
2
1
Department of Botany, Faculty of Science, Chulalongkorn University, Bangkok 10330, Thailand
2
Laboratory of Forest Ecology, Faculty of Applied Biological Sciences, Gifu University, Gifu 501–1193, Japan
3
Department of Biology, Faculty of Science, Silpakorn University, Nakhon Pathom 73000, Thailand
4
Office of Mangrove Conservation, Department of Marine and Coastal Resources, Bangkok 10210, Thailand
5
The Institute for the Promotion of Teaching and Technology, Khlong Toei, Bangkok 10110, Thailand
*
Author to whom correspondence should be addressed.
Forests 2020, 11(9), 987; https://doi.org/10.3390/f11090987
Submission received: 13 August 2020 / Revised: 8 September 2020 / Accepted: 11 September 2020 / Published: 15 September 2020
(This article belongs to the Special Issue Carbon Cycling in Mangrove Ecosystems)

Abstract

:
Mangrove forests play crucial roles in the coastal ecosystems of the tropics. Few studies have addressed long-term changes in the net primary productivity (NPP) of mangroves in relation to the tropical monsoon climate. We conducted a tree census from 2008 to 2018 in a permanent plot at a secondary mangrove forest under the tropical monsoon climate of Eastern Thailand. During this period, the mortality of fast-growing species and the increasing number of newly recruited trees revealed a temporal change in the plant composition and distribution. Total tree biomass linearly increased from 283.64 to 381.72 t·ha−1 during the study period. The NPP was calculated by using the summation method, which included fine root production. The NPP ranged from 21.19 to 29.04 t·ha−1·yr−1. The fluctuation in NPP and its components were analyzed in relation to climatic factors by the linear regression model. The NPP did not relate with the annual climatic factors, such as the mean temperature and annual rainfall. However, both increments in the basal area and living tree biomass, which is a major component of NPP, were negatively related with the maximum and mean monthly temperatures in the dry season. The annual mortality rate related positively with annual rainfall and the maximum monthly temperature in the dry season. Linear regression analyses showed that some major components of NPP were chiefly affected by the temperature environment in the dry season. These results indicated that the weather in the dry season was largely restricting the mangrove NPP due to effects on the saline water dynamics of the soils under the tropical monsoon climate, which were revealed by our recent study. It implies that the hot-dry season may lead to high mortality, long-term reduction in the increment of living-trees biomass, and thus lowered the ability to maintain high NPP of mangrove forests over the long-term.

1. Introduction

Mangrove ecosystems are ecologically significant contributions to coastal areas, i.e., acting as marine animal nurseries [1], enhancing the stability of coastal areas [2,3], and storing high carbon stocks in vegetation [4,5]. Recently, vegetated carbon stocks in coastal ecosystems were proposed as a strategy for climate change mitigation on a national scale [6]. However, mangrove degradation and deforestation are occurring simultaneously [7]. Mangrove mortality and loss of area due to climate change and enhanced extreme events have been reported [8]. Approximately 2% of the long-term stored carbon in the mangrove ecosystem was released back into the atmosphere at the global scale due to mangrove deforestation from 2000 to 2012 [4].
In relation to the carbon cycle in mangrove ecosystems, carbon budgets have been addressed in the form of net primary productivity (NPP) [9,10,11,12,13], net ecosystem production (NEP) [10,14], and soil respiration [15,16]. Among these, the carbon budgets have been mainly reported in the form of NPP; this metric has been estimated with the summation method using various components, such as the growth increment in the aboveground and belowground parts, coarse woody debris flux, and coastal phytoplankton NPP. The variation in the NPP estimation of mangrove forests depends on the components included in the NPP estimation and geographical regions with different climatic conditions [9,11].
Climatic factors, such as rainfall and temperature, are widely predicted as important drivers of forest productivity and the carbon cycle in tropical terrestrial forests [17,18,19,20,21,22] and mangrove forests [23,24,25]. For the mangrove forest, Sanders et al. [24] analyzed published data from 17 regions distributed from 22° N to 38° S and reported that annual rainfall was the best predictor among other global drivers (temperature, tidal range, and latitude) for carbon stocks of mangrove ecosystems in Indo-Pacific and Australian regions. Sannigrahi, Sen, and Paul [25] reported that surface moisture and wetness were highly correlated with the aboveground biomass and NPP from 2000 to 2013 in Sundarbans mangroves by using the light use efficiency model. However, the temporal variation in mangrove NPP due to variations in climatic factors has rarely been reported because it requires long-term data recorded on the permanent study plots.
Under the tropical monsoon climate, we estimated forest productivity by using the data obtained from 2008 to 2018 in a long-term permanent plot at a secondary mangrove forest in Eastern Thailand. Long-term forest inventory data have been recorded annually, and several independent projects have been conducted in this plot under a series of mangrove carbon cycles, including soil respiration [15], fine root production [26], coarse woody debris flux [12], and seasonal tree-trunk growth related to salinity changes [27,28]. However, temporal variation in forest productivity over the decade of study has not been investigated for this plot.
In the present study, we aimed to investigate the variation in forest productivity from 2008 to 2018. It was hypothesized that the variation in forest productivity within the decade was related to climatic factors, including rainfall and temperature, under the monsoon climate.

2. Materials and Methods
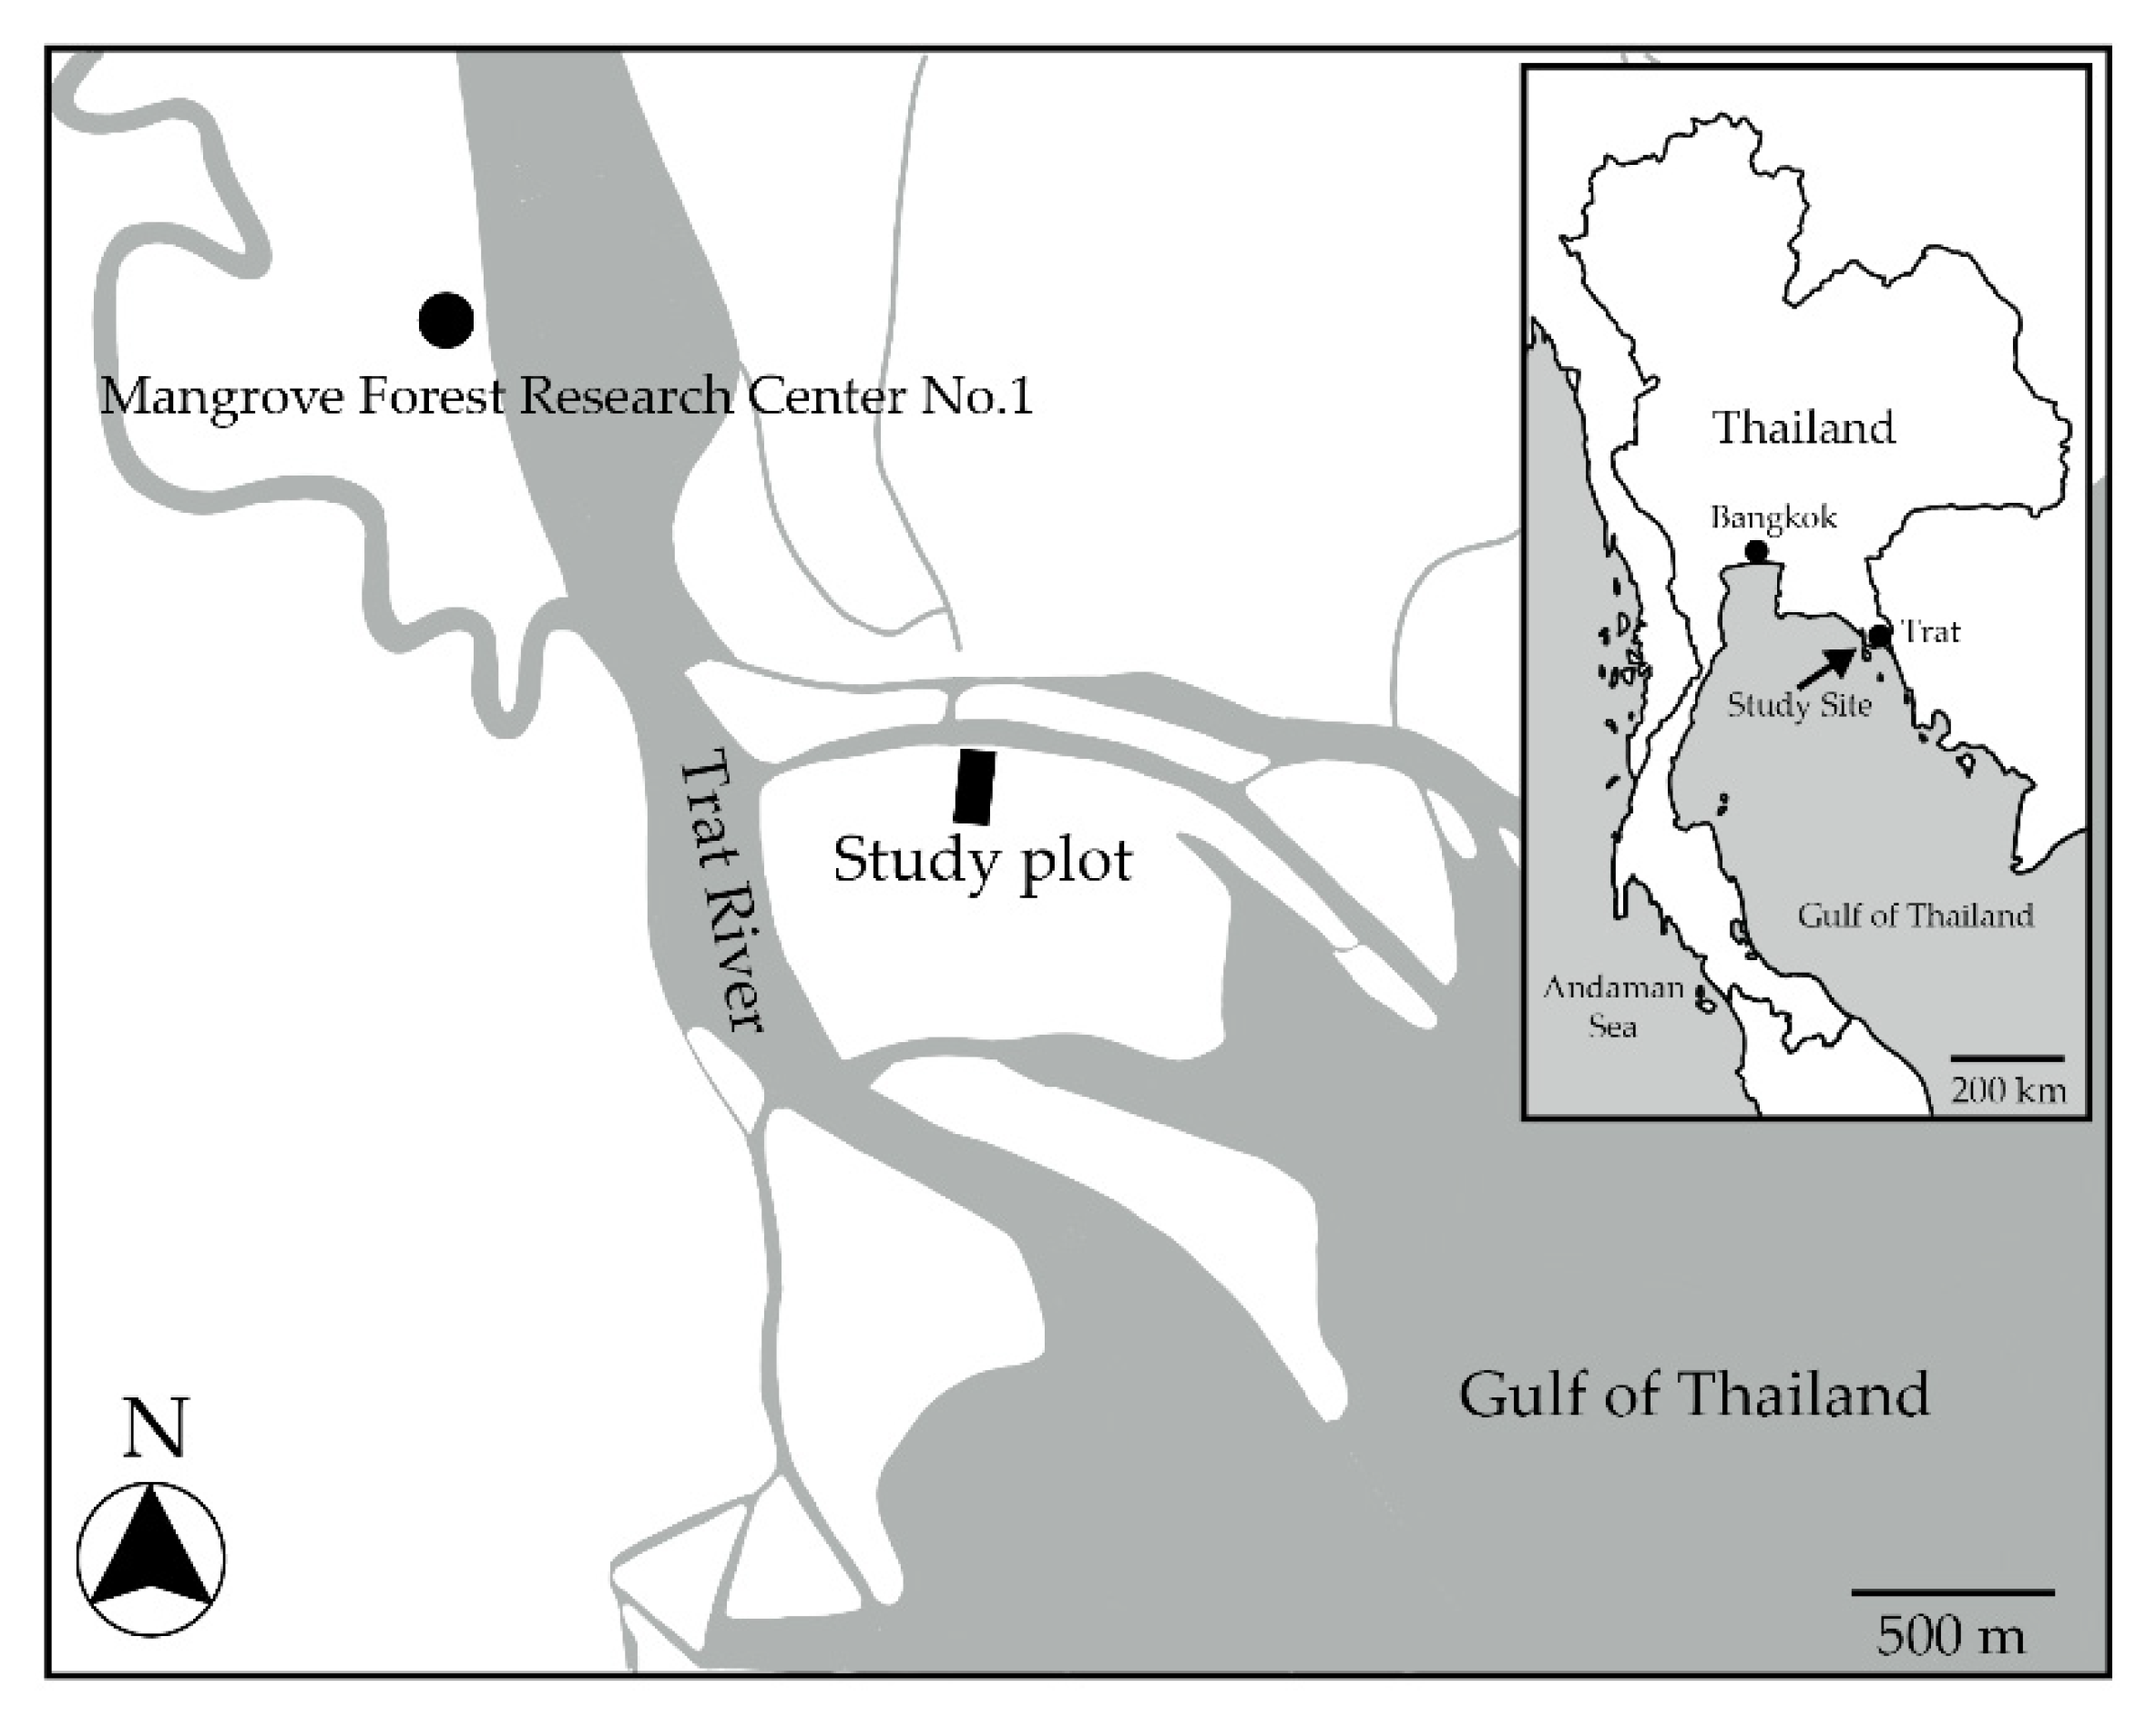
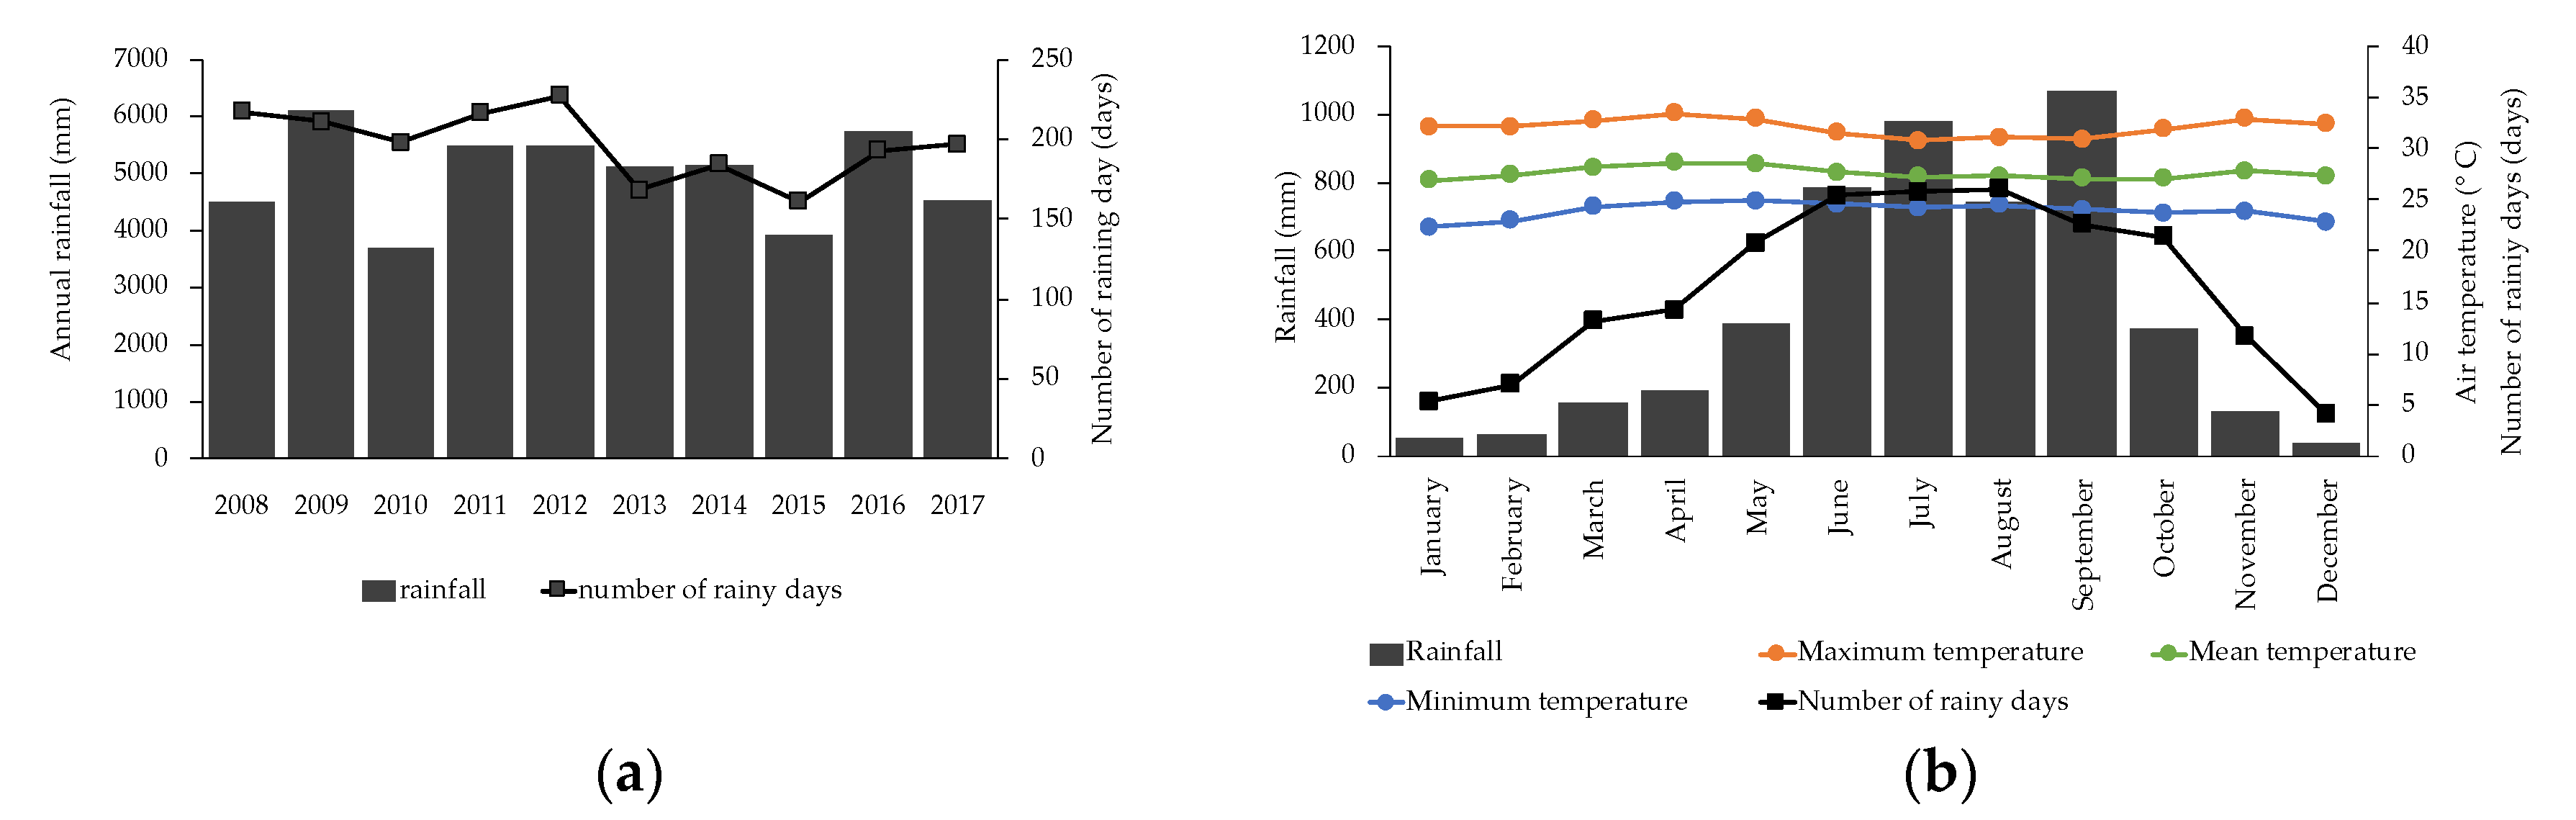
2.1. Study Site

The study site is located in a secondary mangrove forest (12°12′15.5′′ N, 102°33′55.0′′ E) in the estuary of the Trat River, Trat Province, Eastern Thailand (Figure 1). This area was previously subjected to selective logging for household consumption (e.g., house construction and fishery equipment) of the local community. Since the late 1980s, the forest has been managed by the Department of Marine and Coastal Resource of Thailand. Harvesting trees became prohibited, while the local people still utilize the forest for household fisheries, e.g., fishing and crab trapping. Therefore, the forest has been naturally rehabilitated as a secondary forest for approximately 30 years.
A permanent plot of 40 m in width was originally established on a river edge extending 110 m inland in 2002 in this forest. In 2008, the size of the permanent plot was enlarged to 50 × 120 m2 and divided into subplots of 10 × 10 m2 in size, for a total number of 60 subplots (Figure 1).
Climatic data from 2008 to 2017 were retrieved from the Klong Yai Weather Station (Meteorological Department of Thailand), which is the nearest weather station to the study site. The Klong Yai Weather Station is located 50 km southeast of the study site. The mean ± SD of the annual rainfall was 4974 ± 793 mm from 2008 to 2017. The highest annual rainfall was recorded in 2009 as 6115 mm. While the annual rainfall levels in 2010 and 2015 were apparently low (Figure 2a), they were 3686 and 3918 mm, respectively. The dry season began in November and lasted to April. The wet season usually started in May and extended to October; the rainfall was high during this period, at 87.3% on average (Figure 2b). The number of rainy days was recorded as 197.7 ± 21.5 d·yr−1 from 2008 to 2017. The number of rainy days was extremely low in 2013 and 2015, at 168 and 161 days, respectively (Figure 2a). However, there was no record of extreme events, such as severe storms, extreme droughts, or flooding, occurring at the study site from 2008 to 2017.
The maximum, minimum, and mean monthly air temperatures from 2008 to 2017 were also obtained from this weather station. They were 32.1 ± 0.24, 24.0 ± 0.19, and 27.6 ± 0.23 °C, respectively. The average mean monthly temperature was the lowest in January (27.0 °C) of the dry season and the highest in April (28.5 °C; Figure 2b). The air temperature began to drop in the middle of the wet season in July (27.1 °C). The average maximum monthly temperature was the highest in April (33.4 °C) and the lowest during the peak of the wet season (July to September, 30.8–31.1 °C). The average minimum monthly temperature was the lowest in January and the highest in April.

2.2. Tree Census

Trees with stem diameters at breast height (DBHs) larger than 4.5 cm were identified to the species level. For Rhizophora apiculata and R. mucronata, we measured DR0.3, which is the stem diameter at 30 cm above the highest prop root reaching to the ground. From 2008 to 2015, the annual tree census of the stem diameter was performed in August. The annual tree censuses from 2016 to 2018 were performed in January. The tree density of living trees was calculated in each investigation. Dead trees (DBH > 4.5 cm) and newly recruited trees were also recorded in each investigation. The newly recruited trees were defined as the trees having DBH or DR0.3 values that reached over 4.5 cm and had not been recorded in the previous year. The total tree height of all trees in the permanent plot was measured with a fiberglass pole in 2017.

2.3. Net Primary Productivity

We calculated the aboveground and root biomass of trees (DBH >4.5 cm) by using common allometric relationships for mangrove trees [29]. The necromass of the dead trees that occurred in each observation was also estimated by using the same allometric relationships. According to the different periods of the tree census, the increment in the aboveground biomass (AGB) and root biomass of all living trees, excluding the biomass of newly recruited trees in the permanent plot, was calculated for nine years. The first seven years used the data from August to July of the following year, including Y1 (2008–2009), Y2 (2009–2010), and Y7 (2014–2015). In the last two years (2016 and 2017), Y8 and Y9, the biomasses were calculated from January to December. The AGB to the root biomass ratio (AGB/R ratio) was calculated in each year. The annual mortality rate in each year was obtained from the necromass of the dead trees that occurred between the two consecutive observations.
The AGB and root biomass of the newly recruited trees during the respective year were also calculated separately by using the abovementioned allometric relationships. Then, the growth of the newly recruited trees was obtained from the difference in the biomass of the newly recruited trees and the biomass of the minimum-sized trees (4.5 cm in DBH).
Poungparn et al. [26] studied rates of fine root production (root diameter < 2 mm) in 0–30 cm of soil depth at the same study plot of the present study. For the estimation of fine root production (FRP) from Y1 to Y9 of the present study, we adopted the same rates of FRP reported by Poungparn et al. [26].
Finally, the growth increment (ΔY) of the trees in each year was estimated based on the Approach 2 of Clark et al. [30], in which ΔY included the increment biomass of living trees (ΔB), growth of newly recruited trees (N), annual mortality rate (M), and FRP in each year, as shown by Equation (1) as follows:
ΔY = ΔB + N + M + FRP = (ΣTotal biomass at t2 − ΣTotal biomass at t1) + N + M + FRP
where t1 and t2 are the two consecutive observations. Then, NPP was calculated by a summation product of ΔY and the litter production (L) of the respective year as shown by NPP = ΔY + L. The grazed amount in the mangrove forest was assumed to be negligible [9].
To estimate L, a total of 12 litter traps (surface area of 1 m2) were randomly placed throughout the permanent plot in January 2008. From January 2009 to December 2015, the litterfall in the traps was collected monthly and oven-dried (105 °C until a constant weight). Then, the litterfall was divided into plant parts, including the leaf, woody, and reproductive parts, which were separately weighed. We estimated L in Y8 and Y9 from AGB by using a linear relationship between L and AGB obtained from the previous records (Y1 to Y7) in the study plot. The relationship was as follows: L = 5.539 + 0.724AGB, R2 = 0.738, p = 0.018.

2.4. Relative Elevation and Inundation Periods

In 2017, the relative elevation of the forest floor in the permanent plot was measured at 10 m intervals by using the TRACON L5–25 level (Ushikata Mfg. Co., Ltd., Yokohama, Japan). The inundation periods at every 20 m interval of the permanent plot were calculated from the relative elevation and hourly predicted tide level at the Lame Ngop Station (the Hydrographic Department of the Royal Thai Navy), which is located 20 km west of the study plot. The predicted tide level at the Lame Ngop Station was comparable to the water level at the river in front of the study plot [28].

2.5. Data Analysis

All of the data were verified to be in normal distribution by using the Shapiro–Wilk test before further analysis. A trend analysis was conducted for density, DBH, and the basal area of the living trees, density and DBH of the dead trees, and of the newly recruited trees by using linear regression analysis. The relationships between the components of NPP and climatic factors including temperatures and rainfall were analyzed by using linear regression model. All of the statistical analyses were performed by using SPSS v.22 for Windows (IBM, Armonk, NY, USA).

3. Results

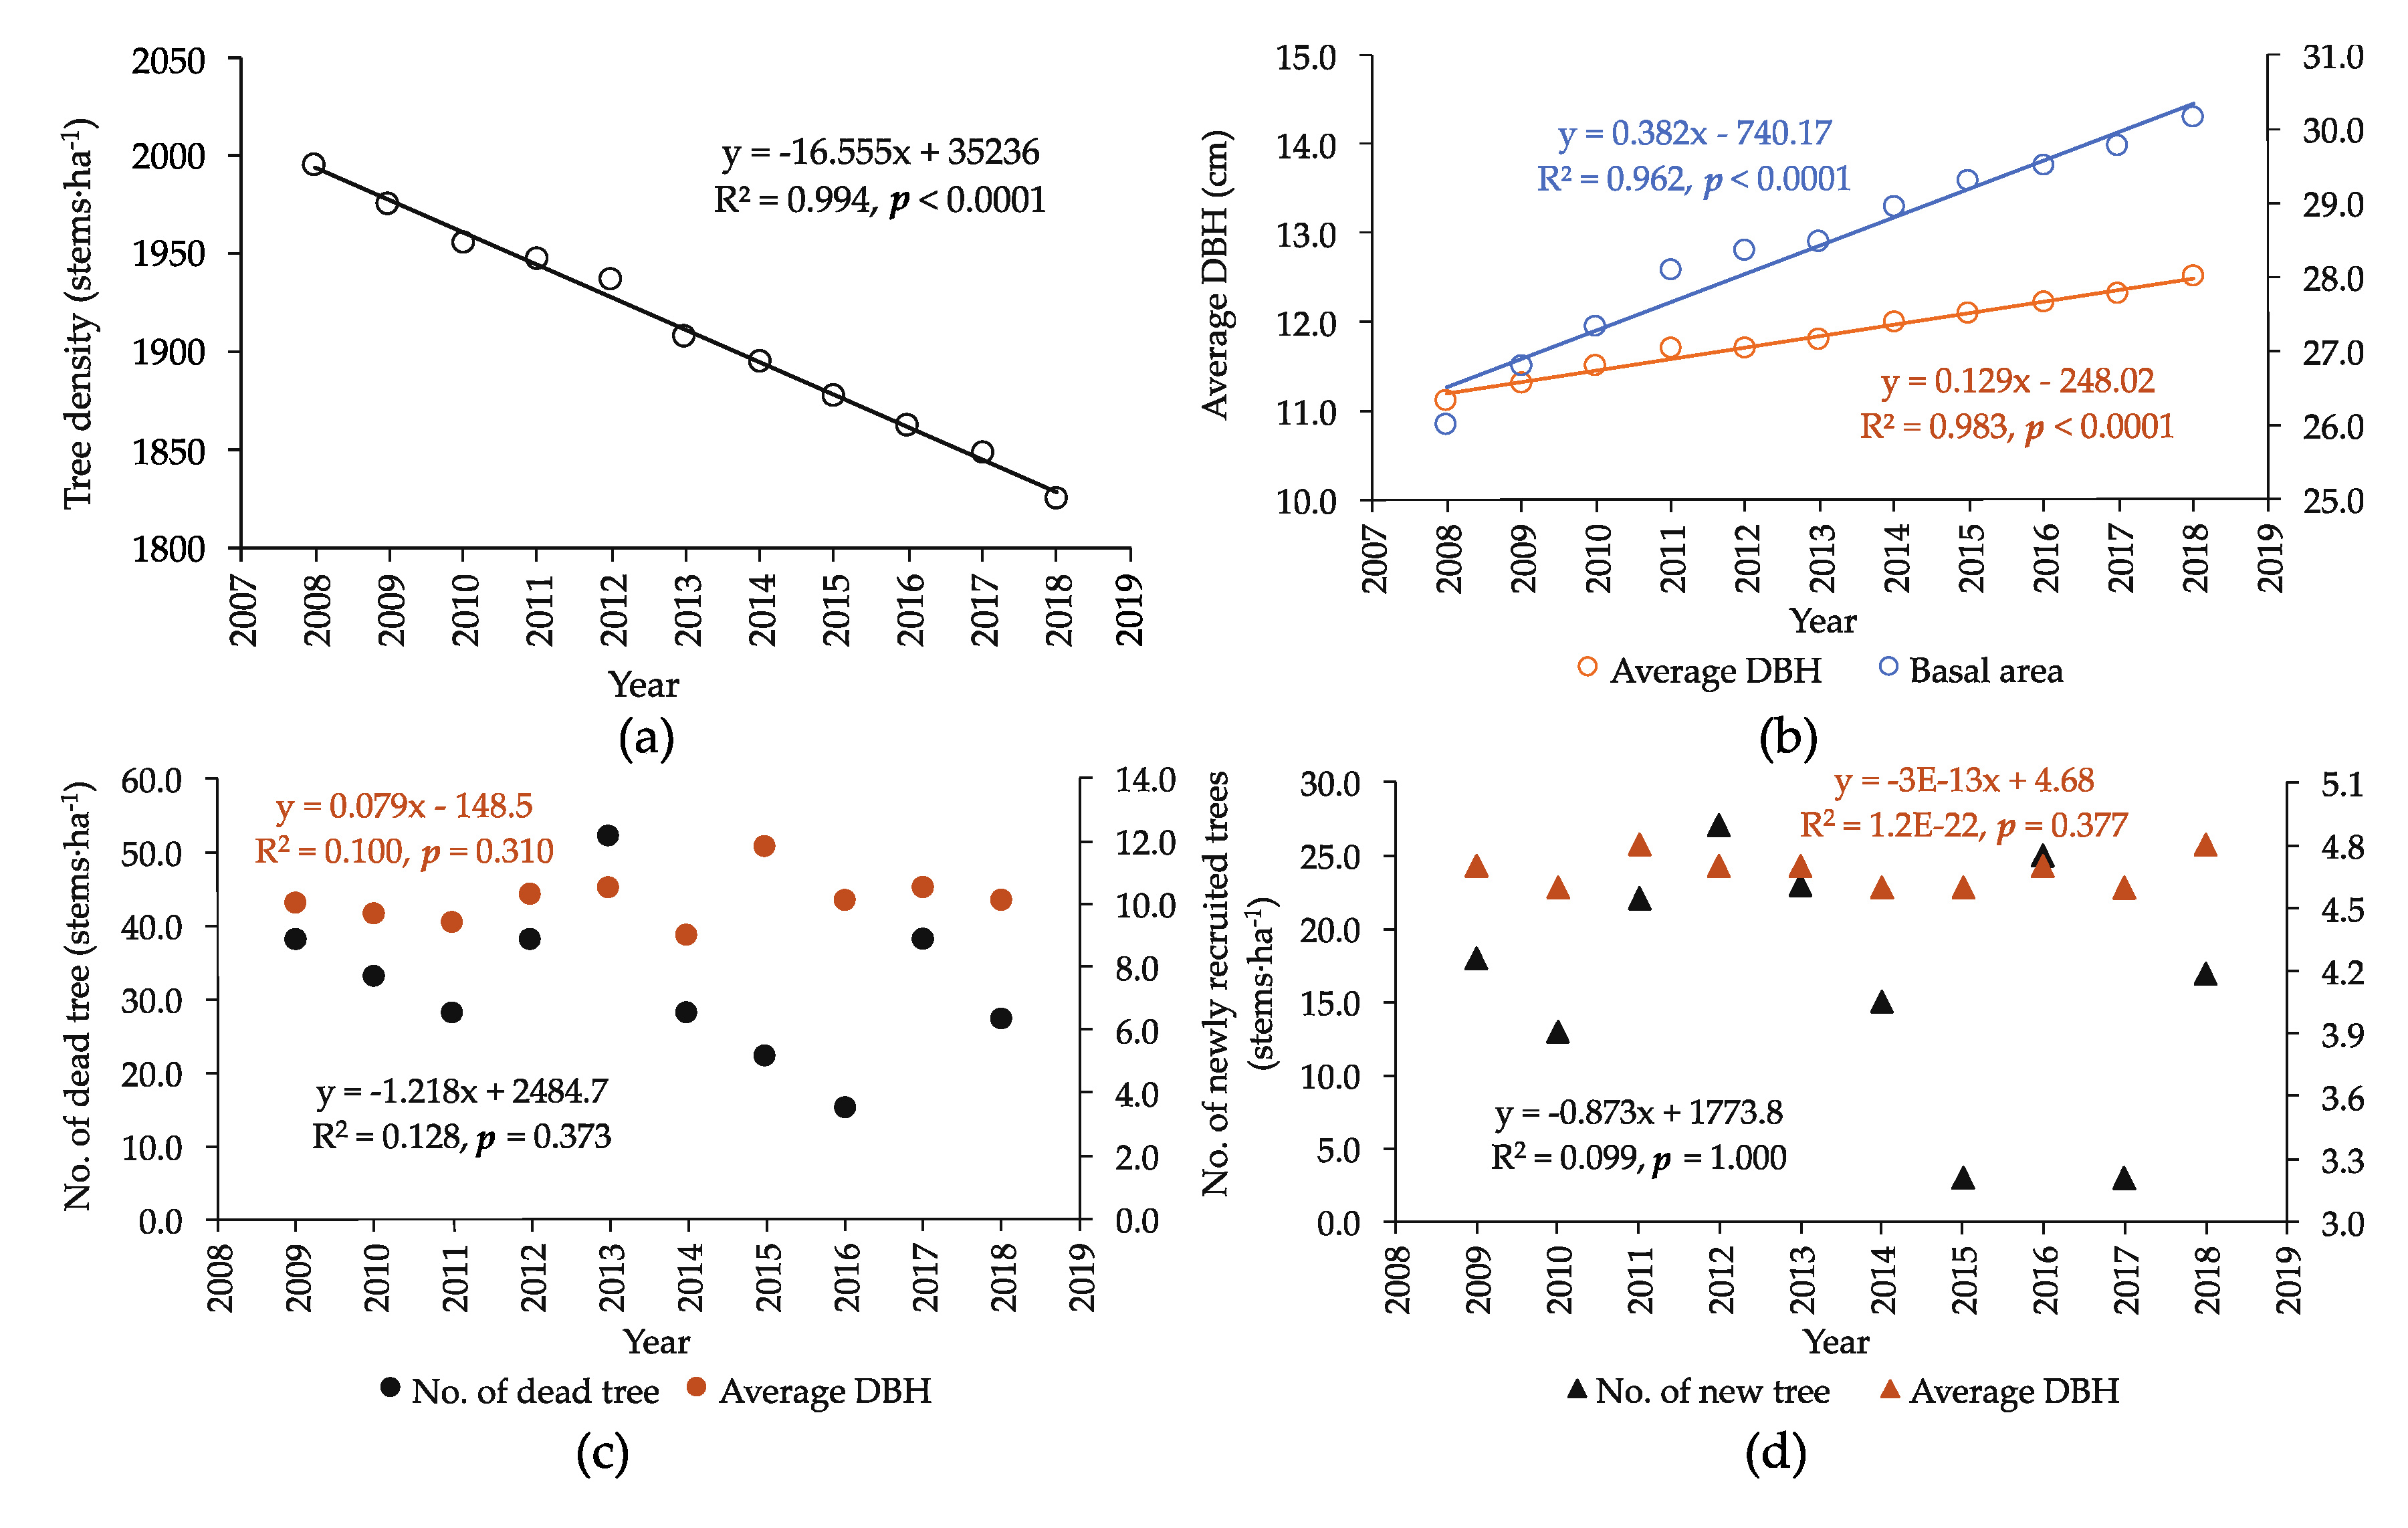
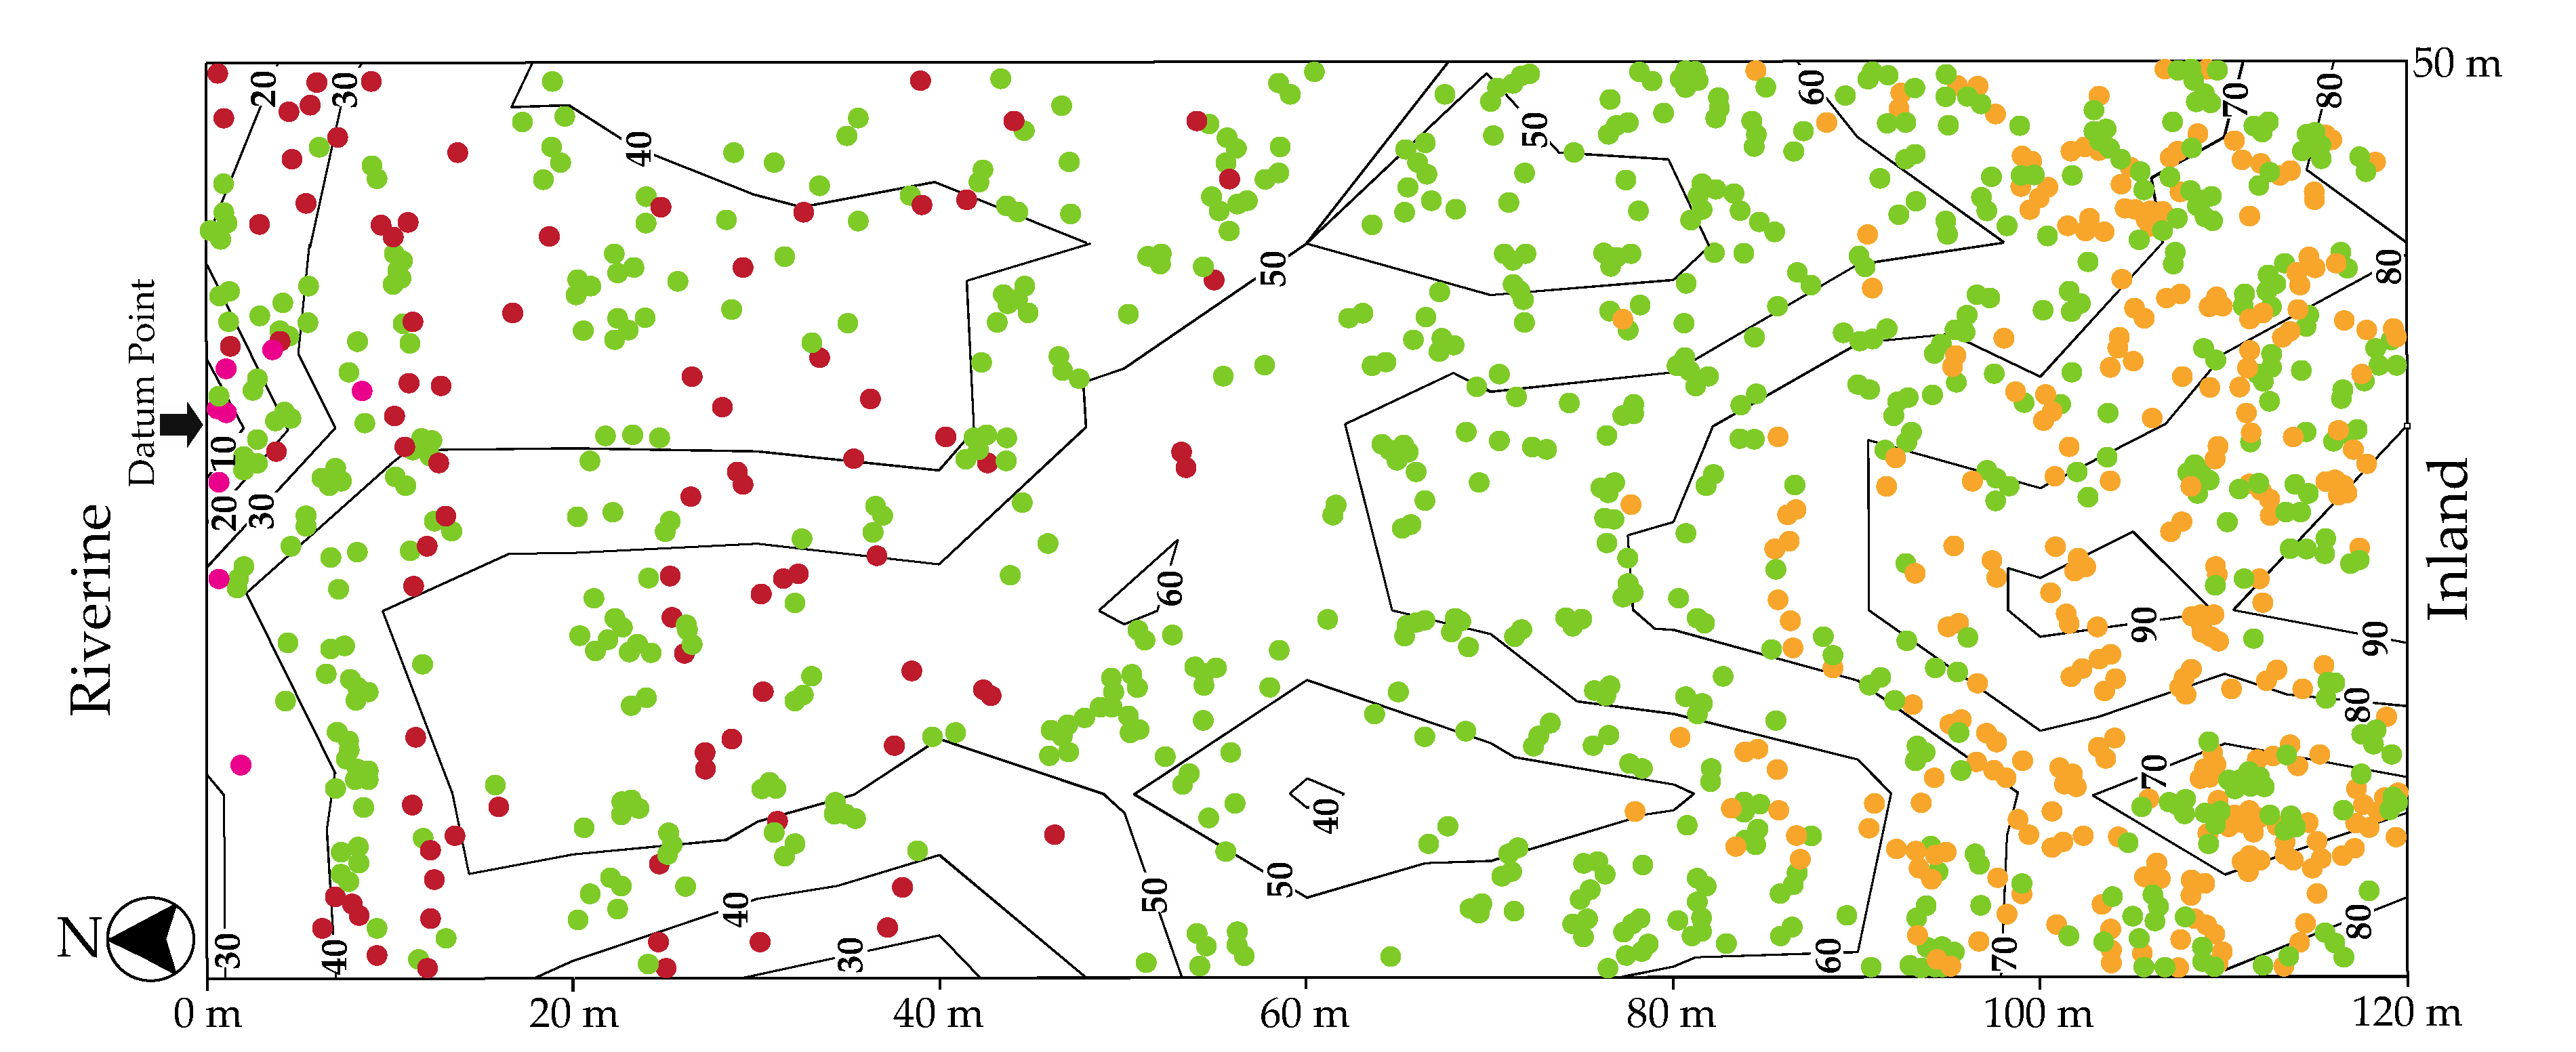
3.1. Species Distribution and Vegetation Structure

There were 10 tree species from six families found in the permanent plot in August 2008. The species composition mainly included Rhizophora apiculata, R. mucronata, Avicennia alba, Sonneratia caseolaris, Bruguiera gymnorrhiza, Xylocarpus granatum, and Ceriops tagal. A few individuals of B. sexangula (five stems), Lumnitzera littorea (one stem), and Heritiera littoralis (two stems) co-occurred. However, Heritiera littoralis disappeared from the permanent plot in 2011.
The total tree density significantly decreased from 1995 stems·ha−1 in August 2008 to 1825 stems·ha−1 in January 2018 (Figure 3a). In this period, the average DBH gradually increased from 11.1 to 12.5 cm (Figure 3b), and the total basal area of living trees also increased from 26.02 to 30.14 m2·ha−1 (Figure 3b). The number of dead trees varied widely, ranging from 15 to 52 stems·yr−1 (Figure 3c), with an average DBH of 10.0 cm. According to the investigations, the species of dead trees were mainly A. alba and S. caseolaris in August 2012 and Rhizophora trees in August 2013 and January 2016. The number of newly recruited trees was observed to range from 3 to 27 stems·yr−1 (Figure 3d). They were mostly suppressed Rhizophora trees under the dense and high canopy. The mean tree height observed in 2017 was 11.9 ± 3.8 m, and the highest tree was a Rhizophora apiculata individual recorded as having a height of 23.9 m.
In 2017, the overall vegetation structure in the permanent plot showed that A. alba and S. caseolaris were fast-growing species distributed within 0–40 m of the river (Figure 4). Rhizophora apiculata and R. mucronata coexisted at this distance. In the middle part of the permanent plot, the forest was densely occupied by R. apiculata and R. mucronata within the distance of 40–80 m, and the two species were purely dominant at the distance of 60–70 m. At the distance of 80–100 m, R. apiculata and R. mucronata were still dominant and coexisted with Bruguiera gymnorrhiza, Ceriops tagal, and Xylocarpus granatum. Few trees of B. sexangula, and Lumnitzera littorea were also present. The dominance of R. apiculata tended to decrease in the landward part of the permanent plot, where X. granatum was codominant with R. apiculata from 110 to 120 m.

3.2. Growth Increment (ΔY) and Net Primary Productivity (NPP)

The total tree biomass in the permanent plot gradually increased from 283.64 t·ha−1 in August 2008 to 381.72 t·ha−1 in January 2018. On average, the AGB and root biomass shared 71.15% and 28.85% of the total biomass, respectively. The average AGB/R ratio was calculated at 2.47. The components of NPP in Y1 to Y9 are shown in Table 1 The mean basal area and total biomass increment in living trees from Y1 to Y9 were calculated at 0.43 ± 0.23 m2·ha−1·yr−1 and 7.41 ± 2.26 t·ha−1·yr−1, respectively. The highest biomass increment was observed in Y1 (10.619 t·ha−1·yr−1), when the basal area increment was the highest, at 0.79 m2·ha−1·yr−1. The lowest biomass increment was found in Y4; the increment in the basal area was as low as 0.29 m2·ha−1·yr−1. The annual mortality rate was the highest in Y5, when the basal area increment was the lowest, at 0.10 m2·ha−1·yr−1. The mass of newly recruited trees showed a decreasing trend from Y6 to Y9. The FRP was constantly calculated during the study period as 3.64 t·ha−1·yr−1, which was greater than the estimated root biomass increment (Table 1). The growth increment (ΔY) from Y1 to Y9 varied in a range from 12.81 to 17.57 t·ha−1·yr−1, with an average value of 14.54 ± 1.71 t·ha−1·yr−1. The ΔY values of Y7 and Y9 were relatively low compared to those in other periods. In this study, 45.6% of the ΔY contributed to the root growth of mangroves (root biomass increment and FRP).
Litter production (L) ranged from 7.32 to 11.47 t·ha−1·yr−1, with an average value of 9.22 ± 1.38 t·ha−1·yr−1 from Y1 to Y9 (Table 1). The leaf litter shared the highest proportion of L (75.7%), followed by the reproductive parts (15.1%) and the woody litter (9.2%). The highest L was found in Y1, while the L value was noticeably lower than 8 t·ha−1·yr−1 in Y3 and Y4 and included a low proportion of reproductive parts.
The NPP in the permanent plot from Y1 to Y9 ranged from 21.19 to 29.04 t·ha−1·yr−1 (Table 1) with an average of 23.65 ± 2.37 t·ha−1·yr−1. The aboveground NPP shared 72.0% of the average total NPP. The total NPP contributed by ΔY was 61.47% on average.
The climatic data, including rainfall, number of rainy days, and air temperature, obtained from the Klong Yai Weather Station of Trat Province from 2008 to 2017 were also calculated annually from Y1 to Y9 (Figure 5). The percentage of deviation of the climatic data from the means obtained from Y1 to Y9 is also shown in Figure 5c as positive and negative values that indicate values that were higher and lower, respectively, than the mean value. The average annual rainfall from Y1 to Y9 was 5004 mm. It was apparent that the annual rainfall in Y3, Y7, and Y9 was lower than approximately 10% of the mean. Moreover, the maximum monthly temperature in Y7 was relatively high across the nine periods.
We performed the linear regression analysis between the parameters relating to NPP (basal area increment, biomass increment in living trees, annual mortality rate, ΔY, L, and NPP) and climatic variables, including rainfall and air temperature (Figure 6). The maximum and mean monthly temperatures were negatively related with the increment in the basal area and biomass of the living trees (p < 0.05). The highest R2 was obtained from a negative relationship of the increment in basal area and the maximum monthly temperature in the dry season (p < 0.001). The annual rainfall showed a significantly positive relationship with the annual mortality rate (p < 0.05). The annual mortality rate also had a positive relationship with the maximum and mean monthly temperature in the dry season (p < 0.05). Nevertheless, the ΔY, L, and NPP values showed non-significant relationships with the climatic factors during the study period (p > 0.05, Figure 6).

3.3. Relative Elevation and Inundation Periods

The relative elevation of the permanent plot in 2017 increased by a distance of 0–10 m from the river edge, as it increased to 30 cm (Figure 4). The inundation period at this distance was 7.3 hr·d−1 on average. The elevation increased gradually between the distances of 10 and 80 m from the river, increasing from 30 to 60 cm. The inundation period was an average of 3.5 hr·d−1 within this distance. At a distance of 90–120 m from the river edge, the inundation period was relatively short, with an average value of 51 min·d−1. The highest relative elevation of 90 cm was measured at a distance of 110–120 m from the river.

4. Discussion

4.1. Mangrove Forest Structure and Biomass

The species distribution of mangroves is partly controlled by geomorphology, such as surface elevation [31], resulting in a zonation pattern [32]. Mangrove zonation is a common characteristic of mangrove forests and manifests as a change in the dominant tree species inland from the seaward margins [33,34,35]. The surface elevation is a primary cause of zonation because of environmental gradients, such as inundation regimes [36], which might cause seasonal changes in the salinity environment [27,28].
In our study plot in Trat, Avicennia alba and Sonneratia caseolaris occupied the lowest elevation, which was from 0 to 40 cm (Figure 4) and had a relatively long period of inundation. The Rhizophora and Xylocarpus trees were distributed inland, where the inundation periods were relatively short. The variation in inundation frequency and period affects the soil salinity distribution in the mangrove forest. At the same study site as that investigated in our study, Komiyama et al. [27] reported that the horizontal distribution of soil–water salinity differed remarkably between the dry and rainy seasons. During the dry season, the salinity levels were high on the river edge occupied by Sonneratia and Avicennia trees and became low towards the inland areas dominated by the Rhizophora and Xylocarpus trees. In contrast, during the rainy season, the salinity decreased to nearly 0.0% from the river edge to the Rhizophora zone. The high salinity conditions during the rainy season were investigated only in the Xylocarpus zone.
Thus, the soil–water salinity showed both spatial and seasonal fluctuations [27] corresponding to the species distribution in our study plot. Supporting the distribution of the Avicennia and Sonneratia trees in a wide range of soil salinities, Parida and Jha [37] reviewed that the two genera had three mechanisms of salt adaptation, namely, salt secretion, salt exclusion, and salt accumulation. The Rhizophora tree had a mechanism of salt exclusion and accumulation, while the Xylocarpus tree exhibited only salt accumulation [37]. Furthermore, an extremely high growth rate of A. alba trees during the wet season was reported [27]. These results suggest that the seasonality of soil–water salinity induced by the surface elevation might determine the distribution and growth of mangroves in the estuarine areas under the monsoon climate.
When the dynamics of mangrove forests are considered spatially and temporally on a broad scale, changes in species composition may be found. Dahdouh-Guebas et al. [38] used sequential aerial photographs to study the dynamics of a mangrove area in Southern Sri Lanka from 1956 to 1994 and reported changes in the fundamental floristic and structural characteristics of the mangroves when compared to those in the past. Our study plot in Trat, the species composition rarely changed during the 10-year period of the study. Nevertheless, the tree density tended to decrease over 10 years in the study plot (Figure 3a) because the mortality rates were usually higher than the recruitment rates (Figure 3c,d). The increasing number of newly recruited Rhizophora trees under the dense and high canopy and dead individuals of the two fast-growing tree species (A. alba and S. caseolaris) revealed that temporal changes in species distribution and composition have been occurring at this study site.
Despite the decreasing tree density, increases in the basal area and tree biomass occurred from Y1 to Y9 (Figure 3b). Although the mangrove forest in the present study is a secondary forest, it was noticeable that the AGB values from Y1 to Y9 in our study plot (201.0–254.2 t·ha−1) were comparable to those of primary mangrove forests dominated by Rhizophora trees with basal areas of less than 20 m2·ha−1 at Halmahera, Indonesia (216.8 t·ha−1; [39]), and Andaman Island, India (214.0 t·ha−1; [40]). However, the AGB in our study plot was higher than those of primary mangrove forests with basal areas greater than 20 m2·ha−1 and dominated by Sonneratia trees in Halmahera, Indonesia (169.1 t·ha−1; [39]); Avicennia trees in Sri Lanka (193.0 t·ha−1; [41]); and Heritiera fomes and A. officinalis forest in the Sundarbans, Bangladesh (154.8 t·ha−1; [42]).
When we considered the potential of carbon stocks accumulated in the forest biomass of the secondary mangrove forest in Trat together with temporal changes in species distribution and composition in the study plot, it showed a trend of rapid biomass development over the study decade. Moreover, Komiyama et al. [9] reviewed the magnitude of AGB in mangrove forests and suggested that the AGB was high at low latitudes due to optimal climatic conditions in tropical regions. The AGB in the monsoon tropical forest at the Trat plot was higher than those of the subtropical mangroves on Okinawa Island [43] and Ishigaki Island in Southwestern Japan [13], which reportedly range from 125.1 to 164.6 t·ha−1. Therefore, forest dynamics, including changing tree density and basal area, would impact the range of accumulated biomass and carbon stocks of the mangrove forests.
The AGB/R ratio of the mangrove forests in the present study was calculated at 2.47 on average. Komiyama et al. [9] revealed that the AGB/R ratio of mangrove forests generally varied between 2.0 and 3.0, indicating that a large amount of biomass was allocated to the root system of mangroves, including aerial roots. Therefore, our study also confirmed the character of high biomass accumulation in the root systems of mangroves. This may suggest that the roots of mangroves act as a significant carbon stock due to the slow decomposition process under the anoxic soils of mangrove forests [44].

4.2. Growth, NPP Estimation, and Its Components

Fine root production (FRP) is considered as an essential part of NPP estimation in mangrove forests. The FRP was estimated at 3.64 t·ha−1·yr−1, according to the rate of FRP given by Poungparn et al. [26] from the same study site. It was higher than FRP reported in the subtropical mangrove on the Florida Coastal Everglades (1.0–1.5 t·ha−1·yr−1 in 0–90 cm of soil depth by the ingrowth core; see [45]) and in Dongzhai Bay, China (0.57–2.84 t·ha−1·yr−1 in 0–40 cm of soil depth by the sequential coring method; see [46]). Additionally, our estimated FRP was higher than the FRP in high-rainfall mangrove forests of Micronesia (0.46–1.17 t·ha−1·yr−1 in 0–45 cm of soil depth by the ingrowth bag method; see [47]). Our high FRP supported the significant role of mangrove roots as a source of soil carbon stocks because FRP was positively related to the soil carbon [46], of which 25% was contributed by the mangrove roots [48].
The annual mortality rate included in ΔY for the NPP calculation was an important component. It shared 14.81% on average from Y1 to Y9 and was positively related with the annual rainfall and with the maximum and mean monthly air temperature in the dry season (Figure 6a,e,f). High annual rainfall usually occurs with monsoon storms and strong winds in tropical monsoon regions. It may have led to the increasing mortality of large A. alba and S. caeseolaris trees (in Y4 and Y5), which have low wood density [29,49]. The increasing mortality rate in the years with high temperature in the dry season may be attributed to an increase in evaporation demand under hypersaline conditions [50]. The dead trees were usually small to medium in size (particularly in Y7), making them less tolerant of hypersaline conditions than large trees.
The litter production (L) in the mangrove forest in Trat was in the range reported from 91 tropical and subtropical mangrove forests by Saenger and Snedaker [51]. We found low L values in Y3 and Y4 due to the small amount of the reproductive parts. It was noticeable that the reproductive parts made up a high portion of the L value due to the abundant large propagules that dropped from the Rhizophora trees in the present study. The characteristics of the propagule are a recruitment strategy tailored to intertidal zones [52] and consequently increase the survival rate of seedlings in the mangrove forest conditions.
Komiyama et al. [9] reviewed the NPP values from 20 mangrove forests and reported a wide range of ΔY as 0.92–20.00 t·ha−1·yr−1. According to them, none of the studies took FRP into the consideration in NPP estimation. The highest ΔY in their report was found in a primary Rhizophora stand in Southern Thailand, which had crown heights over 20 m [53]. Our estimated ΔY in the permanent plot in Trat from Y1 to Y9 ranged from 12.81 to 17.57 t·ha−1·yr−1 (Table 1), skewing in the upper range of the report of Komiyama et al. [9], thus supporting the character of a high growth increment in the mangrove forest.
The average NPP in the present study was 23.65 ± 2.37 t·ha−1·yr−1 (Table 1), and the aboveground NPP was 14.66 t·ha−1·yr−1. Our estimation of the aboveground NPP was higher than the global rate of mangrove aboveground NPP, which has been estimated at 11.1 t·ha−1·yr−1 [11]. Our estimation was also higher than the NPP reported for subtropical mangrove forests on Ishigaki Island of Southwestern Japan (mean aboveground NPP 10.66 t·ha−1·yr−1; see [13]) and in Futian mangroves in Shenzhen, China (total NPP 15.34–23.60 t·ha−1·yr−1; see [54]).
However, the estimated NPP in Trat was lower than that of a subtropical mangrove forest on Okinawa Island (NPP 42.5 t·ha−1·yr−1; see [43]) because Kamruzzaman et al. [43] took the high dead root necromass (8.8 t·ha−1·yr−1) into account in the NPP estimation and showed higher litter production (11.8 t·ha−1·yr−1) than that used in our estimation. When we compared the estimated NPP in Trat with the NPP estimated in other tropical mangrove forests, we found that our estimation was comparable to the NPP of a mangrove forest in the oligosaline zone in the Sundarbans, Bangladesh (NPP 21.0 t·ha−1·yr−1; see [42]), where the tree height (9.2 m on average) was comparable to that in our study (11.9 ± 3.8 m). In tropical mangrove forests with tree heights greater than 20 m in Malaysia [55] and Mexico [56], the aboveground NPP was 23.64 and 24.58 t·ha−1·yr−1, respectively. Therefore, the magnitude of NPP in the mangrove forest was influenced by the crown height, component of NPP, and climatic region.

4.3. Temperature as an Initial Factor Regulating the NPP Magnitude

The NPP and its components in this study varied from Y1 to Y9 and showed no fixed patterns throughout the study period (Table 1). Interannual variations in rainfall and temperature were observed in this study (Figure 5c). This implied that the variation in NPP and its components in the present study might be influenced by fluctuations in climatic factors.
The annual climatic factors showed no significant relationship with the NPP and the growth increment in this study (Figure 6). We inferred that the maximum and mean monthly temperatures in the dry season may have influenced the magnitude of NPP by significantly decreasing the biomass increment in living trees and increasing the mortality rate (Figure 6e,f). The warmer dry seasons could lead to higher mortality, long-term reduction in living biomass, and thus lowered the ability to maintain high NPP of mangrove forests in this region in a long term. Clark et al. [18] reported that the NPP decreased in the warmer years in a terrestrial tropical wet forest at La Selva in Costa Rica during two decades of study.
In this study, 58.0–69.2% of the NPP was contributed from ΔY, which was composed of an average biomass increment of 50.4%. Since the tree biomass was estimated with a common allometric relationship that uses DBH and wood density as the independent variables, the biomass increment was determined by the basal area increment; the species composition rarely changed during the period of the study. Xiong et al. [57] also stated that the global pattern of stand wood production in non-plantation mangroves is primarily determined by the stand mean DBH increment rate of individual trees.
We investigated the climatic factors related to the basal area increment and found that the basal area increment and biomass of the living trees was inversely related with the mean and maximum monthly temperature in the dry season (Figure 6e,f). The higher the air temperature was in the dry season, the smaller the increment in the tree trunk diameter. The maximum temperature had a strong negative effect on stem growth over a 30-year period in a terrestrial tropical forest under the Thai monsoon climate; it increased respiration, reduced stomatal conductance, and thus lessened high transpiration demand by directly decreasing photosynthesis [21]. To minimize the rate of water loss under high temperature conditions, plant maintained low stomatal conductance resulting in a decreased photosynthetic rate and consequently reduced plant growth.
However, in the case of tropical mangrove forests situated in saline habitats, not only the high temperature, but also the low osmotic potentials of saline soil water decrease the photosynthesis of mangroves because water acquisition and transportation are more difficult in these conditions than in wet and non-saline soils [58]. Therefore, we discussed the low biomass increment in living trees in the years with a hot-dry season in our present study by taking into consideration of the effects of saline soil water [27].
The change in the saline environment in the coastal vegetation was induced by increasing air temperature, sea-level rise, and unusual climatic events [59,60,61]. The mangrove forest in the present study site was usually inundated by high-salinity water (approximately 3.00%) in the dry season from January to April [27]. Figure 2 shows that in the present study, the mean value of the maximum monthly temperature in April from 2008 to 2017 was 33.4 °C. The high air temperature during the dry season might have increased the rate of evaporation of the seawater throughout the period of the dry season. When seawater inundated the forest floor, the soil–water salinity level increased [28].
Salinity was a primary limiting factor determining the distribution of mangrove flora in the Sundarbans mangrove forest, leading to spatial variation in biomass [62]. The increase in soil–water salinity in the dry season decreased the rate of trunk growth of the major species of mangroves, i.e., Rhizophora apiculata [63], Avicennia alba [27], and Brugueira gymnorrhiza [63]. The decreased rate of trunk growth in the year that the monthly temperature in the dry season was higher than the mean value (Figure 5c) resulted in a low biomass increment in living trees (Table 1).
In contrast, Xiong et al. [57] analyzed the global pattern of tree DBH growth rate using 70 studies of mangroves across the global mangrove distributions and found that the DBH increment rate in non-plantation mangroves was influenced by precipitation during the driest season and by the precipitation seasonality. The high annual rainfall in the tropical monsoon climate of Trat in Eastern Thailand (average 4974 ± 793 mm·yr−1 from 2008 to 2017) may weaken the influence of rainfall on trunk growth in the mangrove forest in Trat during the overall study period. At our study site, which is under a tropical monsoon climate, the annual rainfall may have less influence on the magnitude of NPP than the maximum and mean monthly temperatures in the dry season. Therefore, we proposed that the temperature environment in the dry season is an initial climatic factor influencing the forest productivity in mangrove forests under the tropical monsoon climates with abundant annual rainfall.
According to long-term global climate change scenarios in a global scale (i.e., [64,65]), the global mean temperature has been projected to continuously increase by between 2 and more than 5 °C by 2100. This may imply a decrease in NPP in the tropical monsoon mangrove forest in the next several decades. Moreover, high temperatures generally promote a high rate of carbon dioxide efflux via soil respiration in mangrove forests in the tropics [15] and subtropics [16]. Therefore, a long-term increase in the mean air temperature will affect the carbon dynamics in the mangrove ecosystems by decreasing the NPP magnitude and increasing the rate of carbon dioxide efflux into the atmosphere via the respiration processes. Consequently, the potential of carbon accumulation will be reduced in the mangrove ecosystem, which currently provides significant vegetated carbon storage in coastal areas [6].

5. Conclusions

We demonstrated that a secondary mangrove forest under a tropical monsoon climate might have a rapid development of forest biomass within a decade. The temporal changes in plant composition and distribution in the study plot during the study period were due to the relative elevation affecting the variation in inundation periods and the soil-salinity distributions demonstrated at the same study site by previous studies [27,28]. The role of high root biomass production, including fine roots, was confirmed as a prominent mechanism for carbon storage in mangrove soils. Our analysis, which was based on the data from 10 consecutive years in a permanent plot, supported the hypothesis that the variation in forest productivity was related to climatic factors, including annual rainfall and temperatures. We propose that the temperature environment in the dry season was a significant climatic factor influencing the mangrove NPP through the saline–water dynamics in the soils under tropical monsoon climates. With the continuous progression of the global warming phenomenon, such an area-based study on long-term carbon dynamics will provide precious ecological information for carbon mitigation in mangrove forests under the tropical monsoon climate.

Author Contributions

All authors contributed the field investigation; data analysis: S.P., V.S., and S.U.; writing original draft, review, and editing: S.P., A.K., and C.R.; field work coordinating and facilitating equipment: T.S., C.M., T.P., and S.K. All authors have read and agreed to the published version of the manuscript.

Funding

The research was funded by the Thailand Research Fund (No. RSA5680017 and RSA6280070) and JSPS KAKENHI of Japan (No.16H05788).

Acknowledgments

We thank all staff of the Mangrove Forest Research Center No. 1, Trat Province, and the students of the Plant Ecology Laboratory of Chulalongkorn University and the Forest Ecology Laboratory of Gifu University, who helped with the field investigation from 2008 to 2018. We appreciated T. Seelanan for assisting statistical analysis.

Conflicts of Interest

The authors declare no conflict of interest.

References

  1. Nagelkerken, I.; Blaber, S.J.M.; Bouillon, S.; Green, P.; Haywood, M.; Kirton, L.G.; Meynecke, J.-O.; Pawlik, J.; Penrose, H.M.; Sasekumar, A.; et al. The habitat function of mangroves for terrestrial and marine fauna: A review. Aquat. Bot. 2008, 89, 155–185. [Google Scholar] [CrossRef] [Green Version]
  2. Kumara, M.P.; Jayatissa, L.P.; Krauss, K.W.; Phillips, D.H.; Huxham, M. High mangrove density enhances surface accretion, surface elevation change, and tree survival in coastal areas susceptible to sea-level rise. Oecologia 2010, 164, 545–553. [Google Scholar] [CrossRef] [PubMed]
  3. Chaudhuri, P.; Chaudhuri, S.; Ghosh, R. The role of mangroves in coastal and estuarine sedimentary accretion in Southeast Asia. In Sedimentary Processes; Aiello, G., Ed.; IntechOpen: London, UK, 2019; Volume 1, pp. 1–23. ISBN 978-1-78984-765-9. [Google Scholar]
  4. Hamilton, S.E.; Friess, D.A. Global carbon stocks and potential emissions due to mangrove deforestation from 2000 to 2012. Nat. Clim. Chang. 2018, 8, 240–244. [Google Scholar] [CrossRef] [Green Version]
  5. Kauffman, J.B.; Heider, C.; Norfolk, J.; Payton, F. Carbon stocks of intact mangroves and carbon emissions arising from their conversion in the Dominican Republic. Ecol. Appl. 2014, 24, 518–527. [Google Scholar] [CrossRef] [PubMed]
  6. Taillardat, P.; Friess, D.A.; Lupascu, M. Mangrove blue carbon strategies for climate change mitigation are most effective at the national scale. Biol. Lett. 2018, 14, 20180251. [Google Scholar] [CrossRef]
  7. Giri, C.; Ochieng, E.; Tieszen, L.L.; Zhu, Z.; Singh, A.; Loveland, T.; Masek, J.; Duke, N. Status and distribution of mangrove forests of the world using earth observation satellite data. Global Ecol. Biogeogr. 2011, 20, 154–159. [Google Scholar] [CrossRef]
  8. Sippo, J.Z.; Lovelock, C.E.; Santos, I.R.; Sanders, C.J.; Maher, D.T. Mangrove mortality in changing climate: An overview. Estuar. Coast. Shelf Sci. 2018, 215, 241–249. [Google Scholar] [CrossRef]
  9. Komiyama, A.; Ong, J.E.; Poungparn, S. Allometry, biomass, and productivity of mangrove forests: A review. Aquat. Bot. 2008, 89, 128–137. [Google Scholar] [CrossRef]
  10. Poungparn, S.; Komiyama, A.; Sangteian, T.; Maknual, C.; Patanaponpaiboon, P.; Suchewaboripont, V. High primary productivity under submerged soil raises the net ecosystem productivity of a secondary mangrove forest in eastern Thailand. J. Trop. Ecol. 2012, 28, 303–306. [Google Scholar] [CrossRef]
  11. Alongi, D.M.; Mukhopadhyay, S.K. Contribution of mangroves to coastal carbon cycling in low latitude seas. Agric. For. Meteorol. 2015, 213, 266–272. [Google Scholar] [CrossRef]
  12. Umnouysin, S.; Sangtiean, T.; Poungparn, S. Zonal distribution of coarse woody debris and its contribution to net primary production in a secondary mangrove forest. Ecol. Res. 2017, 32, 51–60. [Google Scholar] [CrossRef]
  13. Ohtsuka, T.; Tomotsune, M.; Suchewaboripont, V.; Iimura, Y.; Kida, M.; Yoshitake, S.; Kondo, M.; Kinjo, K. Stand dynamics and aboveground net primary productivity of a mature subtropical mangrove forest on Ishigaki Island, south-western Japan. Reg. Stud. Mar. Sci. 2019, 27, 100516. [Google Scholar] [CrossRef]
  14. Alongi, D.M. Carbon cycling and storage in mangrove forests. Annu. Rev. Mar. Sci. 2014, 6, 195–219. [Google Scholar] [CrossRef] [PubMed]
  15. Poungparn, S.; Komiyama, A.; Tanaka, A.; Sangtiean, T.; Maknual, C.; Kato, S.; Tanapermpool, P.; Patanaponpaiboon, P. Carbon dioxide emission through soil respiration in a secondary mangrove forest of eastern Thailand. J. Trop. Ecol. 2009, 25, 393–400. [Google Scholar] [CrossRef]
  16. Tomotsune, M.; Yoshitake, S.; Iimura, Y.; Kida, M.; Fujitake, N.; Koizumi, H.; Ohtsuka, T. Effects of soil temperature and tidal condition on variation in carbon dioxide flux from soil sediment in a subtropical mangrove forest. J. Trop. Ecol. 2018, 34, 268–275. [Google Scholar] [CrossRef]
  17. Schuur, E.A.G. Productivity and global climate revisited: The sensitivity of tropical forest growth of precipitation. Ecology 2003, 84, 1165–1170. [Google Scholar] [CrossRef]
  18. Clark, D.A.; Piper, S.C.; Keeling, C.D.; Clark, D.B. Tropical rain forest tree growth and atmospheric carbon dynamics linked to interannual temperature variation during 1984–2000. Proc. Natl. Acad. Sci. USA 2003, 100, 5852–5857. [Google Scholar] [CrossRef] [Green Version]
  19. Brienen, R.J.W.; Lebrija-Trejos, E.; Zuidema, P.A.; Martínez-Ramos, M.M. Climate growth analysis for a Mexican dry forest tree shows strong impact of sea surface temperatures and predicts future growth declines. Glob. Chang. Biol. 2010, 16, 2001–2012. [Google Scholar] [CrossRef]
  20. Ye, J.S.; Reynolds, J.F.; Sun, G.L.; Li, F.M. Impacts of increased variability in precipitation and air temperature on net primary productivity of the Tibetan Plateau: A modeling analysis. Clim. Chang. 2013, 119, 321–332. [Google Scholar] [CrossRef]
  21. Schippers, P.; Sterck, F.; Vlam, M.; Zuidema, P.A. Tree growth variation in the tropical forest: Understanding effects of temperature, rainfall and CO2. Glob. Chang. Biol. 2015, 21, 2749–2761. [Google Scholar] [CrossRef]
  22. Ji, Y.; Zhou, G.; Luo, T.; Dan, Y.; Zhou, L.; Lv, X. Variation of net primary productivity and its drivers in China’s forest during 2000–2018. For. Ecosyst. 2020, 7. [Google Scholar] [CrossRef] [Green Version]
  23. Hutchison, J.; Manica, A.; Swetnam, R.; Balmford, A.; Spalding, M. Predicting global patterns in mangrove forest biomass. Conserv. Lett. 2014, 7, 233–240. [Google Scholar] [CrossRef] [Green Version]
  24. Sanders, C.J.; Maher, D.T.; Tait, D.R.; Williams, D.; Holloway, C.; Sippo, J.Z.; Santos, I.R. Are global mangrove carbon stocks driven by rainfall? J. Geophys. Res. Biogeosci. 2016, 121, 2600–2609. [Google Scholar] [CrossRef]
  25. Sannigrahi, S.; Sen, S.; Paul, S. Estimation of mangrove net primary production and carbon sequestration service using light use efficiency model in the Sunderban biosphere region, India. Geophys. Res. Abs. 2016, 18, EGU2016-1884-1. [Google Scholar]
  26. Poungparn, S.; Charoenphonphakdi, T.; Sangtiean, T.; Patanaponpaiboon, P. Fine root production in three zones of secondary mangrove forest in eastern Thailand. Trees 2016, 30, 467–474. [Google Scholar] [CrossRef]
  27. Komiyama, A.; Poungparn, S.; Umnouysin, S.; Rodtassana, C.; Pravinvongvuthi, T.; Noda, T.; Kato, S. Occurrence of seasonal water replacement in mangrove soil and the trunk growth response of Avicennia alba related to salinity changes in a tropical monsoon climate. Ecol. Res. 2019, 34, 428–439. [Google Scholar] [CrossRef]
  28. Komiyama, A.; Poungparn, S.; Umnouysin, S.; Rodtassana, C.; Kato, S.; Pravinvongvuthi, T.; Sangtiean, T. Daily inundation induced seasonal variation in the vertical distribution of soil water salinity in an estuarine mangrove forest under a tropical monsoon climate. Ecol. Res. 2020. [Google Scholar] [CrossRef]
  29. Komiyama, A.; Poungparn, S.; Kato, S. Common allometric equations for estimating the tree weight of mangroves. J. Trop. Ecol. 2005, 21, 471–477. [Google Scholar] [CrossRef]
  30. Clark, D.A.; Brown, S.; Kicklighther, D.W.; Chambers, J.Q.; Thomlinson, J.R.; Ni, L. Measuring net primary production in forests: Concepts and field methods. Ecol. Appl. 2001, 11, 356–370. [Google Scholar] [CrossRef]
  31. Leong, R.C.; Friess, D.A.; Crase, B.; Lee, W.K.; Webb, E.L. High-resolution pattern of mangrove species distribution is controlled by surface elevation. Estuar. Coast. Shelf Sci. 2018, 202, 185–192. [Google Scholar] [CrossRef]
  32. Snedaker, S.C. Mangrove species zonation: Why? In Tasks for Vegetation Science, 2nd ed.; Sen, D.N., Rajpurohit, K.S., Eds.; Dr. W Junk Publishers: The Hague, The Netherlands, 1982; Volume 46, pp. 111–125. ISBN 978-94-009-8037-2. [Google Scholar]
  33. Ellison, J.C. Wetlands of the Pacific Island region. Wetl. Ecol. Manag. 2009, 17, 169–206. [Google Scholar] [CrossRef]
  34. Ellison, J.C. Biogeomorphology of Mangroves. In Coastal Wetlands, “An Integrated Ecosystem Approach”, 2nd ed.; Perillo, G.M.E., Wolanski, E., Cahoon, D.R., Hopkinson, C.S., Eds.; Elsevier: Amsterdam, The Netherlands, 2019; pp. 678–715. ISBN 978-0-444-63893-9. [Google Scholar]
  35. Tomlinson, P.B. The Botany of Mangroves; Cambridge University Press: Cambridge, UK, 1986; p. 419. ISBN 0-521-25567-8. [Google Scholar]
  36. McIvor, A.; Spencer, T.; Möller, I.; Spalding, M. The Response of Mangrove Soil Surface Elevation to Sea Level Rise; Natural Coastal Protection Series: Report 3. Cambridge Coastal Research Unit Working Paper 42; The Nature Conservancy and Wetlands International: Cambridge, UK, 2013; 59p, Available online: http://coastalresilience.org/science/mangroves/surface-elevation-and-sea-level-rise (accessed on 28 July 2020).
  37. Parida, A.K.; Jha, B. Salt tolerance mechanisms in mangroves: A review. Trees 2010, 24, 199–217. [Google Scholar] [CrossRef]
  38. Dahdouh-Guebas, F.; Verheyden, A.; De Genst, W.; Hettiarachchi, S.; Koedam, K. Four decade vegetation dynamics in Sri Lankan mangroves as detected from sequential aerial photography: A case study in Galle. Bull. Mar. Sci. 2000, 67, 741–759. [Google Scholar]
  39. Komiyama, A.; Moriya, H.; Prawiroatmodjo, S.; Toma, T.; Ogino, K. Primary productivity of mangrove forest. In Biological System of Mangroves; A Report of East Indonesian Mangrove Expedition 1986; Ogino, K., Chihara, M., Eds.; Ehime University: Ehime, Japan, 1988; pp. 97–117. [Google Scholar]
  40. Mall, L.P.; Singh, V.P.; Garge, A. Study of biomass, litter fall, litter decomposition and soil respiration in monogeneric mangrove and mixed mangrove forest of Andaman Islands. Trop. Ecol. 1991, 32, 144–152. [Google Scholar]
  41. Amarasinghe, M.D.; Balasubramaniam, S. Net primary productivity of two mangrove forest stands on the northwestern coast of Sri Lanka. Hydrobiologia 1992, 247, 37–47. [Google Scholar] [CrossRef]
  42. Kamruzzaman, M.; Ahmed, S.; Osawa, A. Biomass and net primary productivity of mangrove communities along the Oliohaline zone of Sundarbans, Bangladesh. For. Ecosyst. 2017, 4. [Google Scholar] [CrossRef] [Green Version]
  43. Kamruzzaman, M.; Osawa, A.; Deshar, R.; Sharma, S.; Mouctar, K. Species composition, biomass, and net primary productivity of mangrove forest in Okukubi River, Okinawa Island, Japan. Reg. Stud. Mar. Sci. 2017, 12, 19–27. [Google Scholar] [CrossRef]
  44. Lovelock, C.E. Soil respiration and belowground carbon allocation in mangrove forests. Ecosystems 2008, 11, 342–354. [Google Scholar] [CrossRef]
  45. Castañeda-Moya, E.; Twilley, R.R.; Rivera-Monroy, V.H.; Marx, B.D.; Coronado-Molina, C.; Ewe, S.M.L. Patterns of root dynamics in mangrove forests along environmental gradients in Florida Coastal Everglades, USA. Ecosystems 2011, 14, 1178–1195. [Google Scholar] [CrossRef]
  46. Xiong, Y.; Liu, X.; Guan, W.; Liao, B.; Chen, Y.; Li, M.; Zhong, C. Fine root functional group based estimates of fine root production and turnover rate in natural mangrove forests. Plant Soil 2017, 413, 83–95. [Google Scholar] [CrossRef]
  47. Cormier, N.; Twilley, R.R.; Ewel, K.C.; Krauss, K.W. Fine root productivity varies along nitrogen and phosphorus gradients in high-rainfall mangrove forests of Micronesia. Hydrobiologia 2015, 750, 69–87. [Google Scholar] [CrossRef]
  48. Donato, D.C.; Kauffman, J.B.; Murdiyarso, D.; Kurnianto, S.; Stidham, M.; Kanninen, M. Mangroves among the most carbon-rich forests in the tropics. Nat. Geosci. 2011, 4, 293–297. [Google Scholar] [CrossRef]
  49. Virgulino-Júnior, P.C.C.; Gardunho, D.C.L.; Silva, D.N.C.; Fernandes, M.E.B. Wood density in mangrove forests on the Brazilian Amazon coast. Trees 2020, 34, 51–60. [Google Scholar] [CrossRef]
  50. Lovelock, C.E.; Feller, I.C.; Reef, R.; Hickey, S.; Ball, M.C. Mangrove dieback during fluctuating sea levels. Sci. Rep. 2017, 7, 1680. [Google Scholar] [CrossRef]
  51. Saenger, P.; Snedaker, S.C. Pantropical trends in mangrove above-ground biomass and annual litterfall. Oecologia 1993, 96, 293–299. [Google Scholar] [CrossRef] [Green Version]
  52. Wang, W.; Li, X.; Wang, M. Propagule dispersal determines mangrove zonation at intertidal and estuarine scales. Forests 2019, 10, 245. [Google Scholar] [CrossRef] [Green Version]
  53. Christensen, B. Biomass and primary production of Rhizophora apiculata Bl. in a mangrove in southern Thailand. Aquat. Bot. 1978, 4, 43–52. [Google Scholar] [CrossRef]
  54. Peng, C.J.; Qian, J.W.; Guo, X.D.; Zhao, H.W.; Hu, N.X.; Yang, Q.; Chen, C.P.; Chen, L.Z. Vegetation carbon stocks and net primary productivity of the mangrove forests in Shenzhen, China. J. Appl. Ecol. 2016, 27, 2059–2065. [Google Scholar]
  55. Ong, J.E.; Gong, W.K.; Clough, B.F. Structure and productivity of a 20-year-old stand of Rhizophora apiculata Bl. mangrove forest. J. Biogeogr. 1995, 22, 417–424. [Google Scholar]
  56. Day, J.W., Jr.; Conner, W.H.; Ley-Lou, F.; Day, R.H.; Navarro, A.M. The productivity and composition of mangrove forests, Laguna de Terminos, Mexico. Aquat. Bot. 1987, 27, 267–284. [Google Scholar] [CrossRef]
  57. Xiong, Y.; Cakir, R.; Phan, S.M.; Ola, A.; Krauss, K.W.; Lovelock, C.E. Global patterns of tree stem growth and stand aboveground wood production in mangrove forests. For. Ecol. Manag. 2019, 444, 382–392. [Google Scholar] [CrossRef]
  58. Lovelock, C.E.; Krauss, K.W.; Osland, M.J.; Reef, R.; Ball, M.C. The physiology of mangrove trees with changing climate. Trop. Tree Physiol. 2016, 6, 149–179. [Google Scholar]
  59. Moon, T.; Joughin, I. Change in ice front position on Greenland’s outlet glaciers from 1992 to 2007. J. Geophys. Res. 2008, 113, F02022. [Google Scholar] [CrossRef] [Green Version]
  60. Cai, H.; Savenije, H.H.G.; Toffolon, M. A new analytical framework for assessing the effect of sea-level rise and dredging on tidal damping in estuaries. J. Geophys. Res. 2012, 117, C09023. [Google Scholar] [CrossRef]
  61. Widlansky, M.J.; Timmermann, A.; Cai, W. Future extreme sea level seesaws in the tropical Pacific. Clim. Chang. 2015, 1, e1500560. [Google Scholar] [CrossRef] [Green Version]
  62. Agarwal, S.K.; Mitra, A. Salinity: A primary growth driver of mangrove flora. Curr. Trends For. Res. CTFR 2018, 114. [Google Scholar] [CrossRef]
  63. Jintana, V.; Komiyama, A.; Moriya, H.; Ogino, K. Forest ecological studies of mangrove ecosystem in Ranong, Southern Thailand: (4) Diameter growth measurement by dendrometry. In Study on the Mangrove Ecosystem; Sugi, J., Ed.; Nodai Research Institute, Tokyo University of Agriculture: Tokyo, Japan, 1985; pp. 227–233. [Google Scholar]
  64. Moss, R.H.; Edmonds, J.A.; Hibbard, K.A.; Manning, M.R.; Rose, S.K.; van Vuuren, D.P.; Carter, T.R.; Emori, S.; Kainuma, M.; Kram, T.; et al. The next generation of scenarios for climate change research and assessment. Nature 2010, 463, 747–756. [Google Scholar] [CrossRef]
  65. IPCC. Climate Change 2013: The Physical Science Basis; Cambridge University Press: Cambridge, UK, 2013; 1525p. [Google Scholar]
Figure 1. Map of the study site with a mark indicating the location of the permanent study plot.
Forests 11 00987 g001
Figure 2. Climatic data from the Klong Yai Weather Station, Trat Province from 2008 to 2017 (Meteorological Department of Thailand): (a) annual rainfall and number of rainy days and (b) average monthly rainfall, average number of rainy days, maximum temperature, minimum temperature, and mean temperature.
Forests 11 00987 g002
Figure 3. Changes in the forest structure from 2008 to 2018 of the permanent plot: (a) density of the living trees; (b) average diameter at breast height (DBH) and total basal area of the living trees; (c) number and average DBH of the dead trees; and (d) number and average DBH of the newly recruited trees. The regression lines indicate a significant level at p < 0.05.
Forests 11 00987 g003
Figure 4. Relative elevation (cm) of the study plot shown by line contours reference to the datum point located on the river edge, and position of trees with DBH > 4.5 cm, including Sonneratia caseolaris and Avicennia alba (indicated with a red circle symbol), Rhizophora apiculata and R. mucronata (green circle symbol), and the other species (yellow circle symbol) in the permanent plot in 2017.
Forests 11 00987 g004
Figure 5. Climatic data at the Klong Yai Weather Station in Trat Province from Y1 to Y9; (a) annual rainfall and number of rainy days; (b) average minimum, maximum, and mean air temperature; and (c) percent deviation of the climatic data from the mean values from Y1 to Y9.
Forests 11 00987 g005
Figure 6. Linear regression models between the parameters relating to NPP (namely; basal area increment, m2·ha−1·yr−1; biomass increment of living trees, t·ha−1·yr−1; annual mortality rate, t·ha−1·yr−1; ΔY, t·ha−1·yr−1; L, t·ha−1·yr−1; and NPP, t·ha−1·yr−1) and climatic factors, including annual rainfall (a), annual minimum temperature (b), annual maximum temperature (c), annual mean temperature (d), average maximum temperature in dry season (e), average mean temperature in dry season (f), average maximum temperature in wet season (g), and average mean temperature in wet season (h) from Y1 to Y9. Data without linear regression lines indicate models are not significant. The relationships and lines of the regression were shown for p < 0.05.
Forests 11 00987 g006
Table 1. Basal area increment, growth increment (ΔY), litter production (L), and NPP in the permanent plot at a secondary mangrove forest in Trat from Y1 to Y9.
Y1Y2Y3Y4Y5Y6Y7Y8Y9
Basal area increment (m2·ha−1·yr−1)
0.790.510.760.290.10.460.360.280.36
(1) Biomass increment in living trees (t·ha−1·yr−1)
     Aboveground7.8165.6597.6513.8355.3666.2754.084.1524.659
     Root2.8031.9472.7351.3181.7472.2271.401.4211.60
     Total10.6197.60610.3865.1537.1138.5025.4795.5736.259
(2) Increment of newly recruited trees mass (t·ha−1·yr−1)
     Aboveground0.0140.0410.0290.0250.0240.0050.0000.0180.001
     Root0.0070.0230.0150.0120.0130.0030.0010.0090.000
     Total0.0210.0640.0440.0370.0370.0080.0010.0270.001
(3) Annual mortality rate (t·ha−1·yr−1)
     Aboveground2.271.941.663.193.561.392.703.032.03
     Root1.020.860.741.311.570.641.081.280.88
     Total3.292.802.404.505.132.033.784.312.91
(4) Fine root production (t·ha−1·yr−1)
      3.643.643.643.643.643.643.643.643.64
(1+2+3+4) Growth increment;△Y (t·ha−1·yr−1)
     Aboveground10.107.649.347.058.957.676.787.206.69
     Root7.476.477.136.286.976.516.126.356.12
     Total17.5714.1116.4713.3315.9214.1812.9013.5512.81
Litter production (t·ha−1·yr−1)
     Leaf8.127.506.096.416.696.846.89--
     Wood1.211.040.560.550.691.110.89--
     Reproductive organ2.141.400.670.901.541.761.56--
     Total11.479.947.327.868.929.719.348.56 *8.91 *
NPP (t·ha−1·yr−1)
     Aboveground21.5717.5816.6614.9117.8717.3816.1215.7615.60
     Root7.476.477.136.286.976.516.126.356.12
     Total29.0424.0523.7921.1924.8423.8922.2422.1121.72
Remark: (-) means no data and (*) means an estimated value.

