Article

Assessing Land Use and Land Cover Changes in the Direct Influence Zone of the Braço Norte Hydropower Complex, Brazilian Amazonia

by
João V. R. Guerrero
1,
Elton V. Escobar-Silva
2,
Michel E. D. Chaves
2,†,
Guilherme A. V. Mataveli
3,†,
Vandoir Bourscheidt
1,
Gabriel de Oliveira
4,*,
Michelle C. A. Picoli
2,
Yosio E. Shimabukuro
2 and
Luiz E. Moschini
1
1
Department of Environmental Sciences, Federal University of São Carlos (UFSCAR), São Carlos, SP 13565-905, Brazil
2
Remote Sensing Division, Brazilian National Institute for Space Research (INPE), São José dos Campos, SP 12227-010, Brazil
3
Department of Geosciences, Federal University of São João del-Rei (UFSJ), São João del-Rei, MG 36307-352, Brazil
4
Department of Geography and Planning, University of Toronto, Toronto, ON M5S 3G3, Canada
*
Author to whom correspondence should be addressed.
These authors contributed equally to the work.
Forests 2020, 11(9), 988; https://doi.org/10.3390/f11090988
Submission received: 27 August 2020 / Revised: 10 September 2020 / Accepted: 12 September 2020 / Published: 15 September 2020

Abstract

:
Over the decades, hydropower complexes have been built in several hydrographic basins of Brazil including the Amazon region. Therefore, it is important to understand the effects of these constructions on the environment and local communities. This work presents a land use and land cover change temporal analysis considering a 33-year period (1985–2018) in the direct influence zone of the Braço Norte Hydropower Complex, Brazilian Amazonia, using the Collection 4.1 level 3 of the freely available MapBiomas dataset. Additionally, we have assessed the Brazilian Amazon large-scale deforestation process acting as a land use and land cover change driver in the study area. Our findings show that the most impacted land cover was forest formation (from 414 km2 to 287 km2, a reduction of 69%), which primarily shifted into pasturelands (increase of 664%, from 40 km2 to 299 km2). The construction of the hydropower complex also triggered indirect impacts such as the presence of urban areas in 2018 and the consequent increased local demand for crops. Together with the ongoing large-scale Amazonian deforestation process, the construction of the complex has intensified changes in the study area as 56.42% of the pixels were changed between 1985 and 2018. This indicates the importance of accurate economic and environmental impact studies for assessing social and environmental consequences of future construction in this unique region. Our results reveal the need for adopting special policies to minimize the impact of these constructions, for example, the creation of Protected Areas and the definition of locally-adjusted parameters for the ecological-economic zoning considering environmental and social circumstances derived from the local actors that depend on the natural environment to subsist such as indigenous peoples, riverine population, and artisanal fishermen.

1. Introduction

Land use and land cover changes (LULCC) have been the subject of recent studies focusing on landscape changes [1,2], land degradation/deforestation [3,4], and landscape fragmentation [5,6]. Human activity is the main driver of LULCC in the world [7]; as a result, human activities have substantially affected 75% of the Earth’s land surface, mostly related to agricultural activities [8]. This is set to increase to 85% until 2050, according to the projections of the Intergovernmental Science-Policy Platform on Biodiversity and Ecosystem Services (IPBES) [9].
Land use practices are distinct throughout the world, varying according to culture, traditions, and purposes. A general concept is that the acquisition of natural resources is always acceptable when it is addressed for meeting immediate human needs [10,11]. In this context, electricity generation plays a key role. Despite being considered as a “greener” method for generating electricity, hydroelectric power plants are an environmental concern because of their impacts associated with the disruption of the natural course of rivers, food systems and agriculture, endangerment of forests and biodiversity, loss of water quality, and social impacts such as the relocation of people [12,13]. Reservoirs may also become hotspots for greenhouse gas emissions, potentially affecting how sustainable hydropower is compared to fossil-fuel burning [14]. Aside from the direct impacts of these constructions in the LULCC, their indirect impacts such as the increasing population and local demands in the surroundings areas should also be considered. These impacts are highlighted when we consider that almost 40% of the global population is currently facing water scarcity, consequently creating an urgent need to manage water resources adequately [15].
Hydropower is the largest renewable source of electricity across the world, accounting for up to 65% of all renewable sources and around 16.5% of all electric generation sources [16,17]. The increased use of hydropower is currently driving the greatest surge in global dam construction since the second half of the 20th century; consequently, most of the important rivers where this is possible are now dammed and face a block of essential nutrient flow that leads to nutrient alteration, retention via sedimentation, and gaseous elimination, factors that degrade terrestrial and coastal environments downstream [14,18]. Hydroelectric power plants generate 70% of the Brazilian electrical energy [12,19] and this is expected to increase in the near future due to the dams and hydroelectric power plants under construction [13,20]. This expansion has been mainly happening over the Brazilian Amazon [21,22], a region where Land Use and Land Cover (LULC) is already suffering increasing pressures related to deforestation, logging, and agriculture [3,23,24].
Aside from the direct and indirect impacts of these constructions over LULCC, the large-scale Amazonian deforestation process must also be addressed for fully understanding the drivers of LULCC in hydropower complexes in this unique region of the world [20]. By combining all drivers above-mentioned, it is possible to assess the impacts caused by previously constructed hydroelectric power plants over LULCC in the Amazon region and show possible environmental impacts derived from future construction.
With the advance of remote sensing, image processing, and machine learning techniques, novel approaches have been developed to complement the Brazilian official monitoring system to track annual deforestation in the Amazon. These efforts are highlighted in the MapBiomas project, which consists of a multi-disciplinary network responsible for providing annual LULC maps for the entire Brazilian territory since the 1980s using the Landsat Archive and the Google Earth Engine platform [25,26], allowing the analysis of LULCC for long time periods.
There are no previous works in the literature that have analyzed LULCC temporally in the Braço Norte Hydropower Complex, Brazilian Amazon. To face this challenge, we used LULC data with a spatial resolution of 30 meters for a 33-year period (1985–2018), comprising the beginning of the construction of the first hydroelectric power plant in the complex and the current period. LULC was derived from the MapBiomas dataset [25], which provides information on the LULCC dynamics possibly caused by the construction of the complex and allows the assessment of the interaction between the construction and the protection of its direct influence zone. The LULC maps provided by this dataset are more suitable for decision makers due to their higher spatial resolution, which addresses tactical and operational purposes.
This work also considers the large-scale Amazonian deforestation process acting as a LULCC driver. Deforestation in the Brazilian Amazon is a process that has been taking place mainly in the Mato Grosso State for many years [27]. In this way, we propose a spatially explicit and replicable method for assessing LULCC not only in the Braço Norte Hydropower Complex, but that is applicable to other areas impacted by hydropower complexes.

2. Materials and Methods
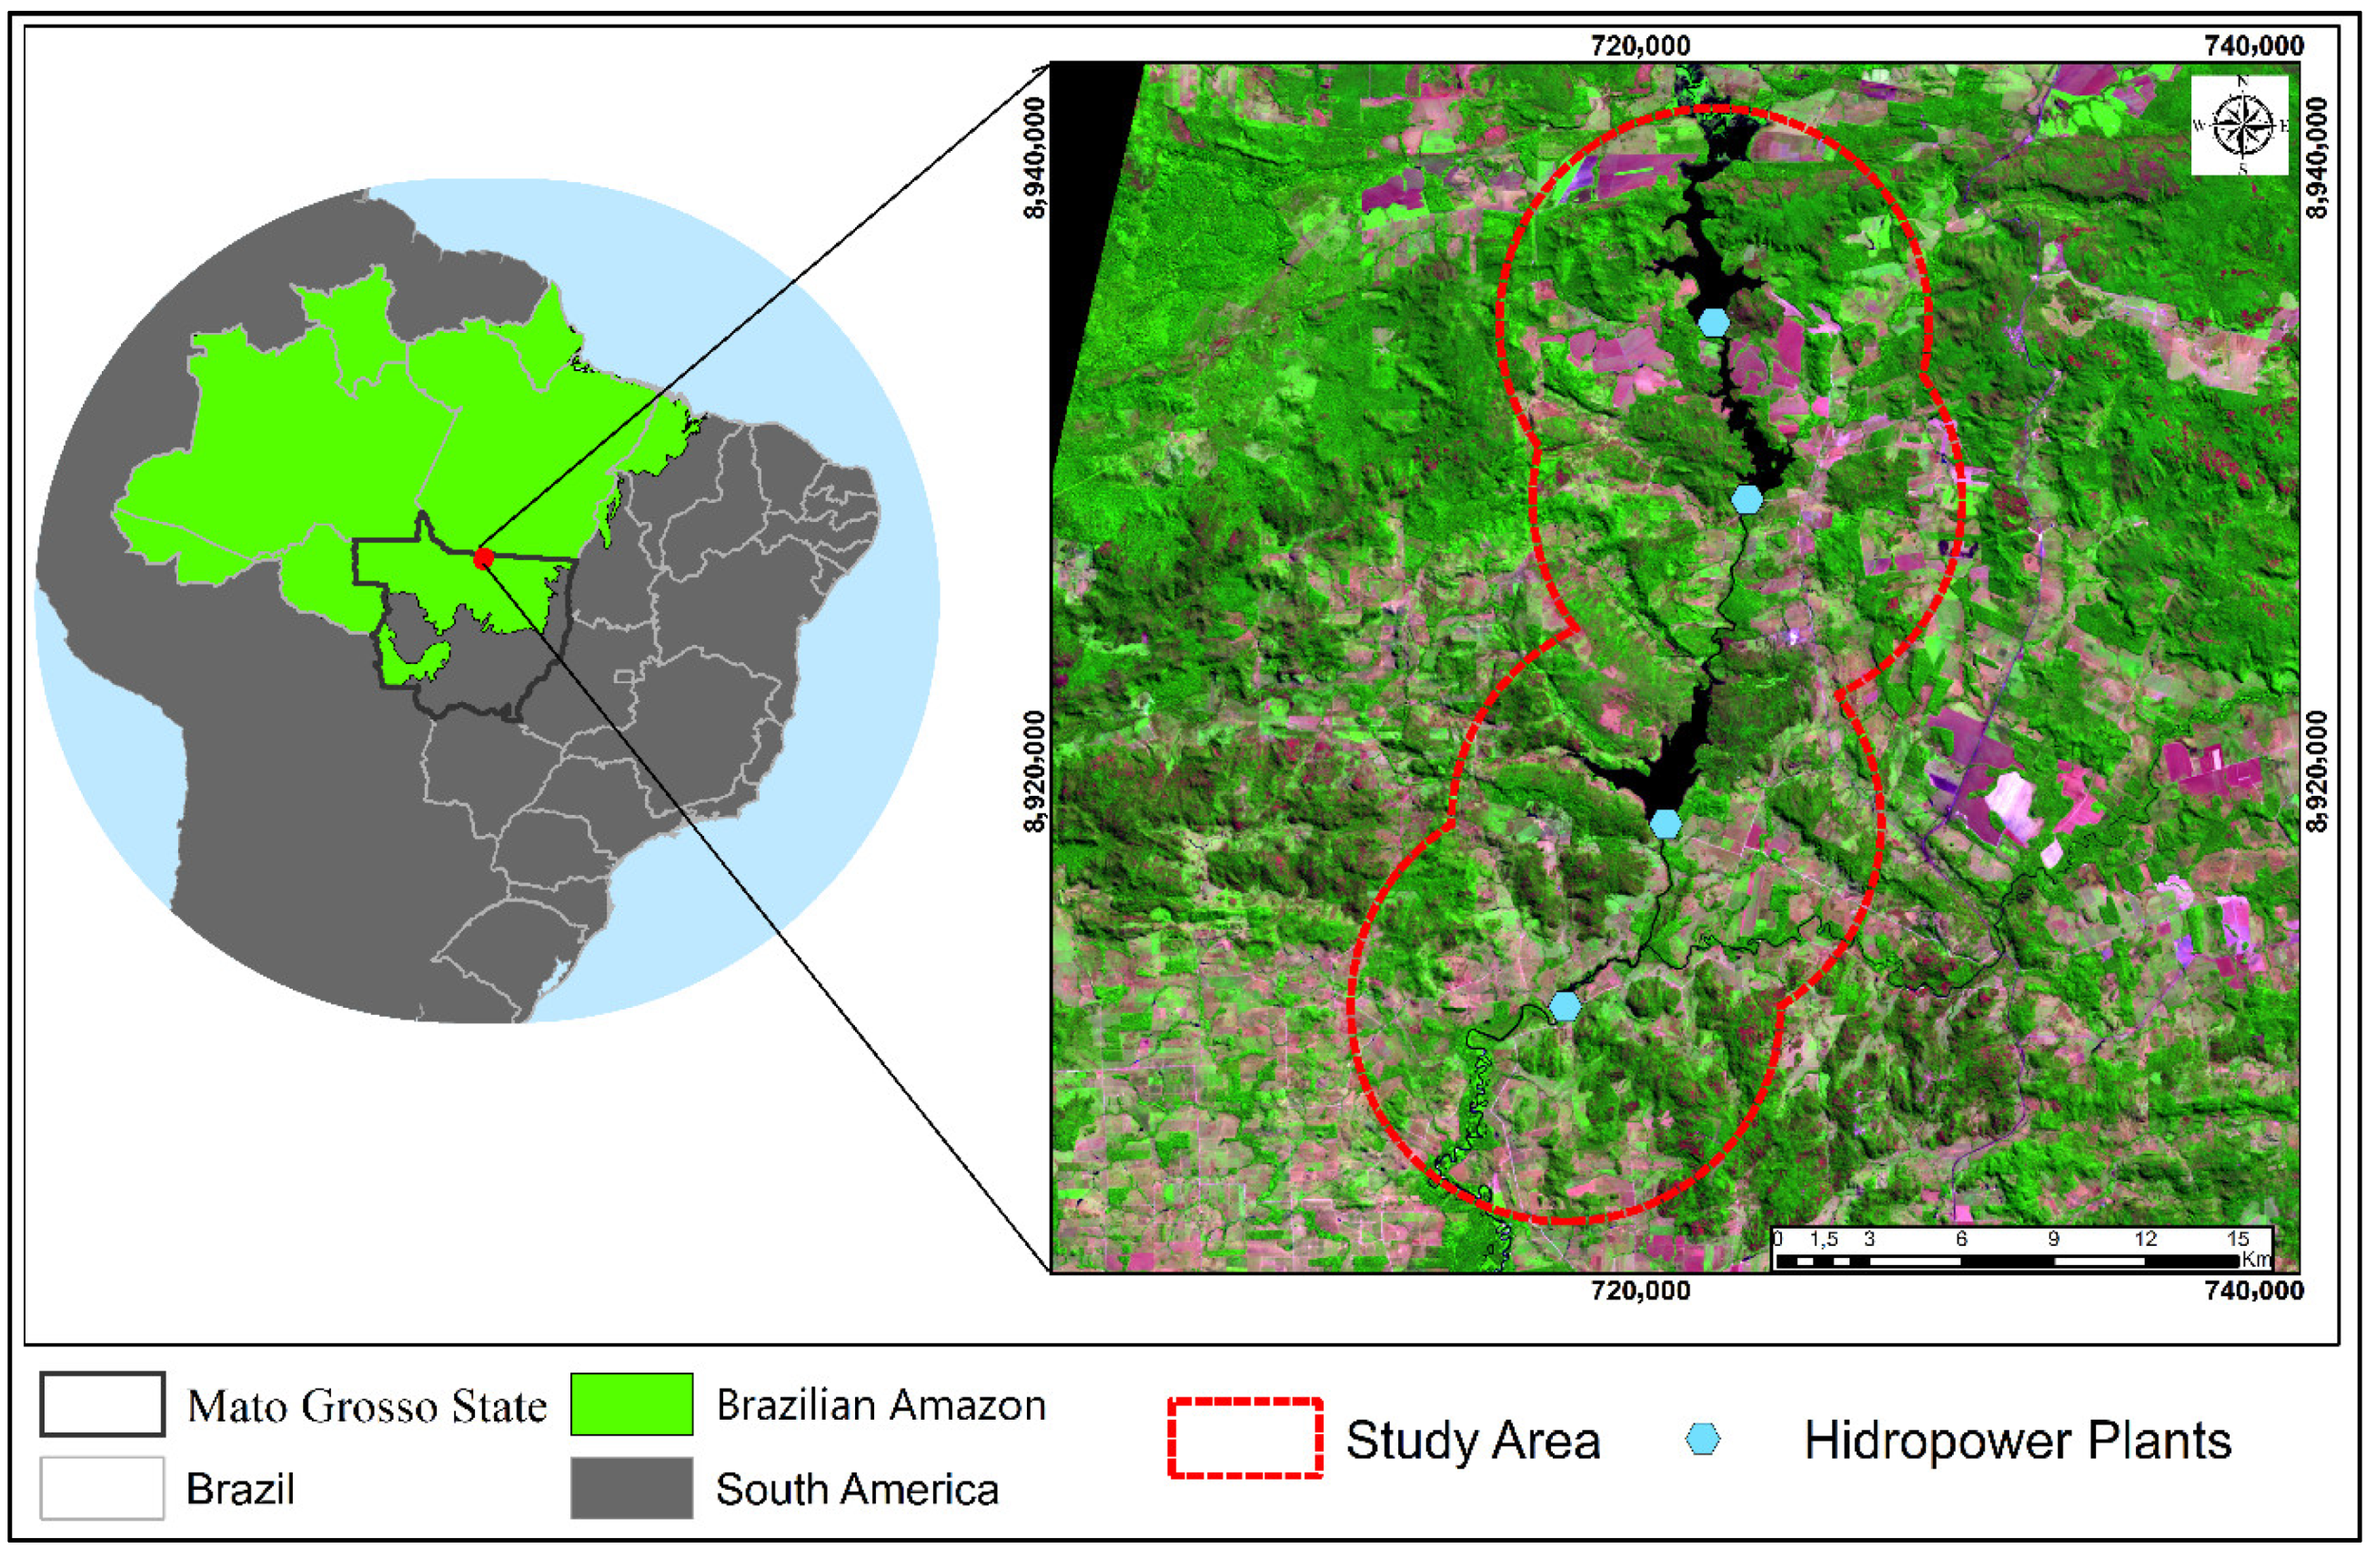
2.1. Study Area

The study area includes the direct influence zone of the Braço Norte Hydropower Complex, located in the northern region of the state of Mato Grosso, Brazilian Amazonia (Figure 1). Braço Norte is located within the Tapajós River Basin, specifically between the municipalities of Guarantã do Norte and Novo Mundo.
The Braço Norte Hydropower Complex encompasses four hydroelectric power plants (Braço Norte, Braço Norte II, Braço Norte III, and Braço Norte IV). Although the construction of Braço Norte started in 1985, its inauguration occurred in December/1997, followed by Braço Norte II in April/1998, Braço Norte III in October/2003, and Braço Norte IV in August/2007. Combined, these four hydroelectric power plants generate over 44.09 MW/h [28], consisting of an important renewable source of electric energy in this region. The delimitation of the direct influence zone of the complex followed the proposition of Carvalho et al. (2018) [29], that is, a 7 km buffer around each of the four hydroelectric power plants totaling 460 km2. Additionally, we tested three more buffers of 14 km, 21 km, and 28 km, respectively.

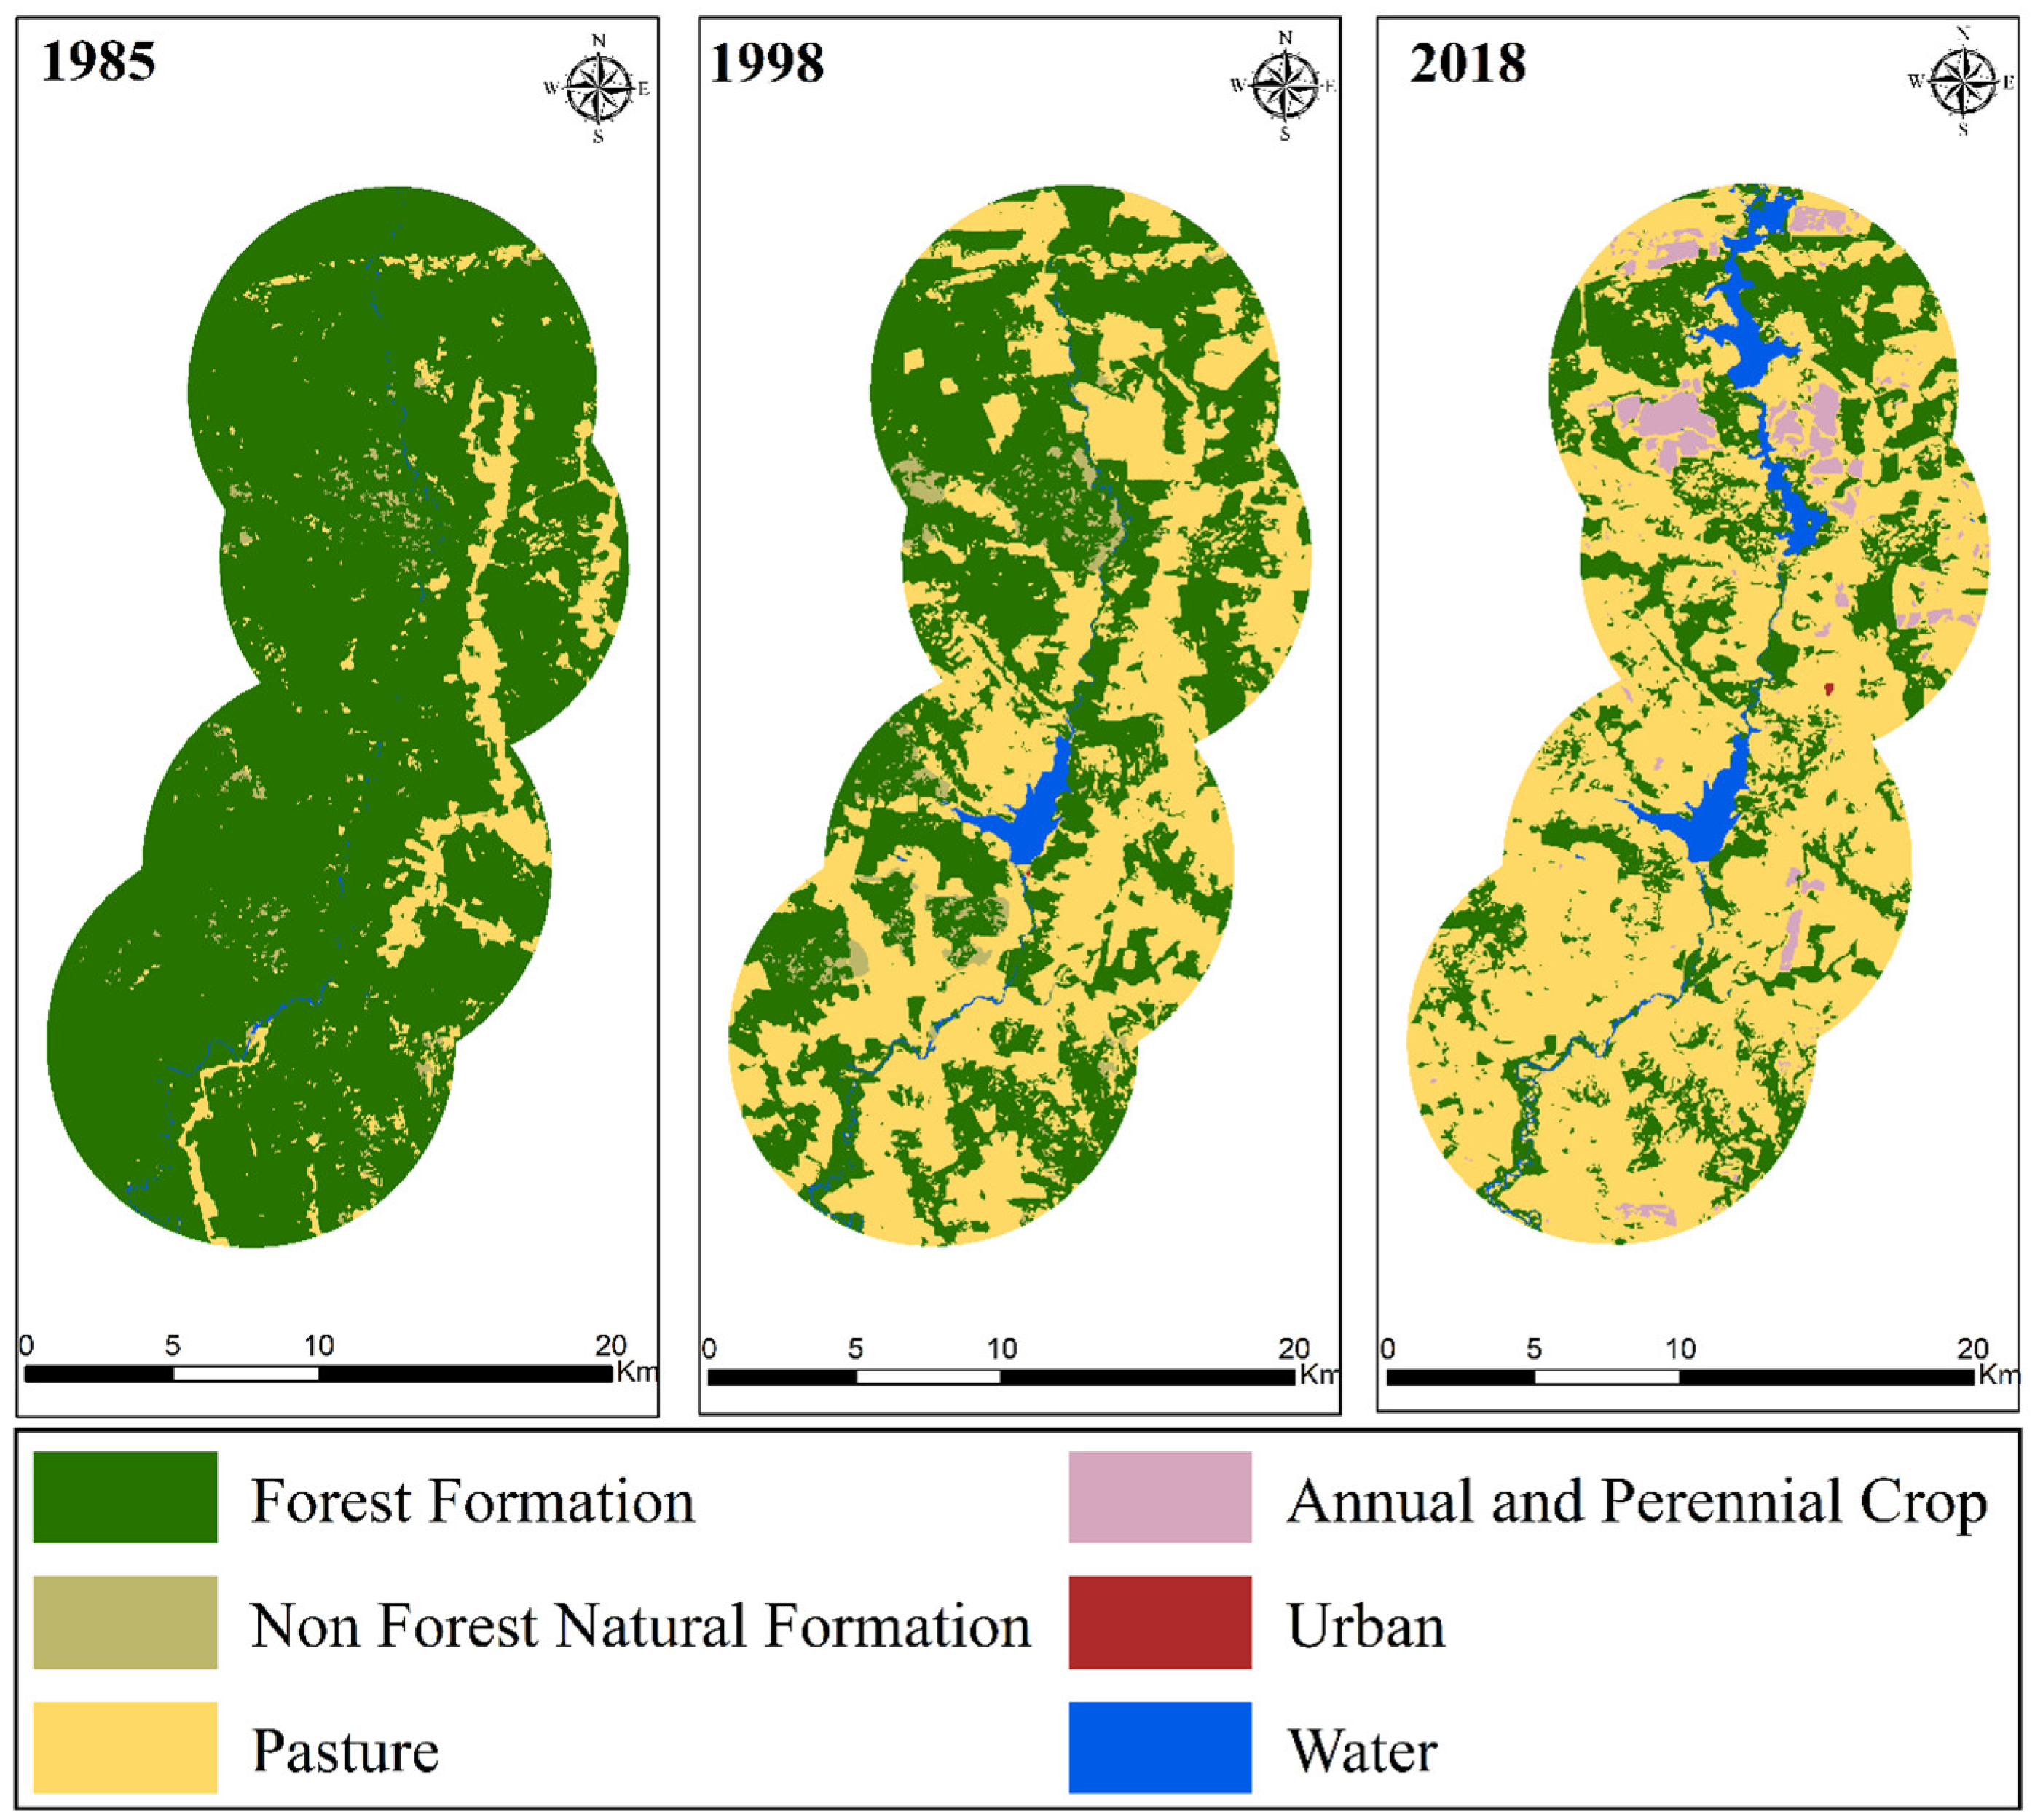
2.2. Land Use and Land Cover Data Processing

The LULCC temporal analysis in the study area was performed using the freely available LULC dataset provided by the MapBiomas Project-Collection 4.1 [25]. This dataset is based on Landsat images, generated with 30-meter spatial resolution, and has been used as a reference in several LULC-related recent studies conducted in the Brazilian Amazon [30,31,32,33,34]. According to Bonanomi et al. (2019) [35], the MapBiomas classification scheme provides annual LULC maps for Brazil since 1985 through an automatic classification routine using cloud processing on the Google Earth Engine platform. The classification scheme is based on a pixel-by-pixel classification of Landsat images using the machine learning algorithm random forest [36]. This algorithm classifies targets using the spectral response of each Brazilian biome from the database, automatically classifying areas with the same spectral pattern [37]. The applied method, fully described in MapBiomas 2020b and in Souza Junior et al. 2020 [26,36], distinguishes 22 LULC classes in the most detailed classification level (level 3).
In this work, we selected three annual MapBiomas LULC maps of the Collection 4.1 level 3. The 1985 LULC map represents the study area in the year when the construction of the first hydropower plant began; 1998 represents LULC in the year when the reservoir started being filled (it only started after the inauguration of the first hydroelectric power plant in December/1997); and 2018 represents LULC in the current period (this is the last annual LULC map currently available in MapBiomas-Collection 4.1). These three LULC maps were clipped to the delimitation of the direct influence zone of the Braço Norte Hydropower Complex and then each LULC class was quantified. Although MapBiomas distinguishes 22 LULC classes, only six of them were identified in the study area: forest formation, non-forest natural formation, pasture, annual and perennial crop, water, and urban.

2.3. MapBiomas-Collection 4.1 Accuracy Assessment
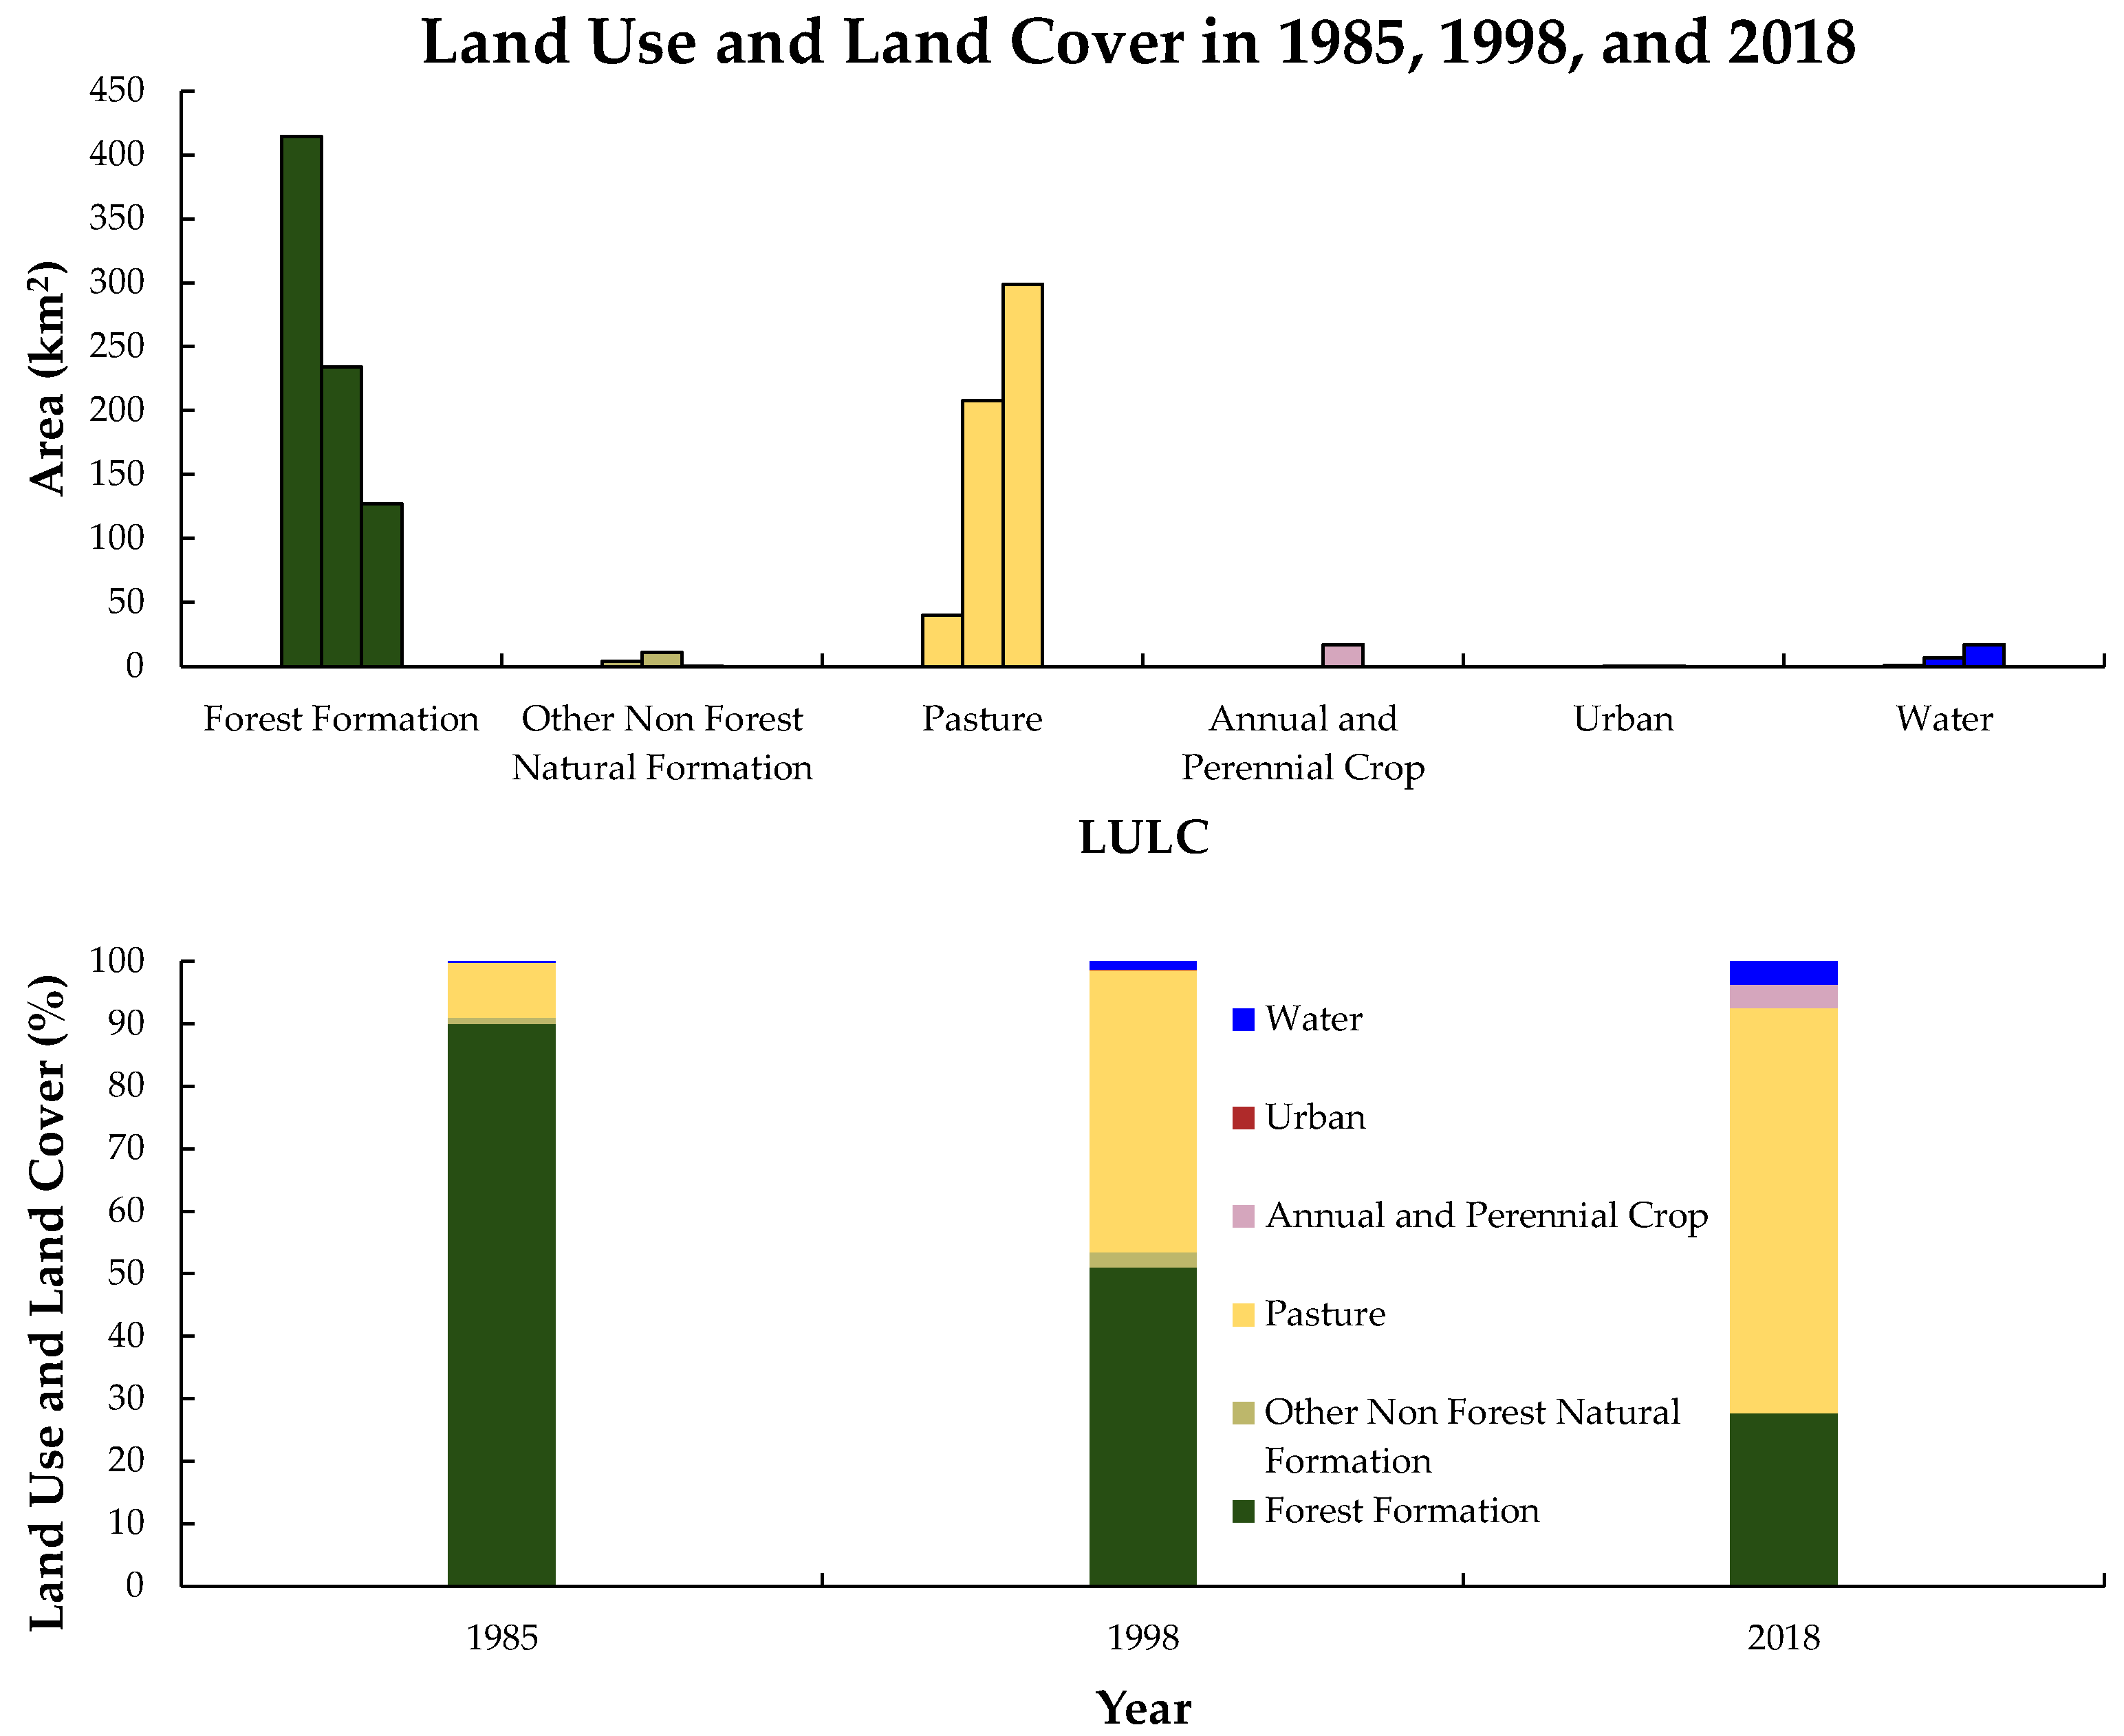
The accuracy of the mapping presented in this study is linked to the accuracy of the MapBiomas LULC dataset. MapBiomas provides specific accuracy assessment statistics for its collections considering the entirety of Brazil and, separately for the six distinct Brazilian biomes. The MapBiomas-Collection 4.1 accuracy assessments were performed based on ~75,000 samples per year distributed over the Brazilian territory using the Pontius and Millones (2011) method [38]. Considering the 1985–2018 period for the entire Brazilian territory and the LULC classes from level 3, this dataset collection has an annual average overall accuracy of 86.40%, allocation disagreement of 11.06%, and area disagreement of 2.5% [39]. On a biome scale, the annual average overall accuracy of the Amazon reaches 95.80%, which is the highest among the Brazilian biomes [39]. For the specific years analyzed in the present study, the annual overall accuracy in the Brazilian Amazon is also high, corresponding to 96.30% for 1985, 95.80% for 1998, and 95.00% for 2018 [39]. These results show the effectiveness of MapBiomas-Collection 4.1 at accurately identifying the LULCC in the study area.

3. Results

The annual LULC maps show that substantial changes have occurred in the direct influence zone of the Braço Norte Hydropower Complex from 1985 to 2018 (Figure 2). Forest formation was the major LULC class in 1985 (414 km2) and also the one most reduced during the 1985–2018 period (287 km2, a reduction of 69%).
The variations derived from the LULCC process considering the years 1985, 1998, and 2018 are properly described in Figure 3.
Deforested areas were mainly converted into pasture, which increased 644% (from 40 km2 to 299 km2) between 1985 and 2018. Annual and perennial crops were identified only in 2018, representing 3.66% of the direct influence zone of the Braço Norte Hydropower Complex. The increase in water, related to reservoir filling, was also significant (1565%, from 1 km2 in 1985 to 17 km2 in 2018). Annual and perennial crops, other non-forest natural formation, and urban did not have significant changes.
In addition to the large-scale Amazonian deforestation process, the construction of the Braço Norte Hydropower Complex has exerted more pressure and intensified land cover transitions. To make this clearer, we identified all pixels where LULCC occurred between 1985 and 2018 in the direct influence zone of the Braço Norte Hydropower Complex (7 km buffer) and three additional buffers (14 km, 21 km, and 28 km) (Figure 4). In the direct influence zone of the Braço Norte Hydropower Complex, 56.4% of the pixels showed changes, and with the increase in the buffer size, this percentage decreased: 52.31% in the 14 km buffer, 47.69% in the 21 km buffer, and 47.68% in the 28 km buffer. It is also possible to observe the additional pressure related to the construction of the complex due to the fact that the 14 km buffer is closer to the BR-163 highway, often related to more intense LULCC [40], but LULCC was less intense than in the direct influence zone of the Braço Norte Hydropower Complex.

4. Discussion

When the construction of the Braço Norte Hydropower Complex began, a total of 414 km2, representing 90% of its direct influence zone, was covered by forest formations. In 1998, this LULC class decreased to 234 km2 and reached 127 km2 in 2018, equivalent to a decrease of 69% in the 33 years analyzed. In 2018, for example, only 27.6% of the area was covered by forest formations. This is in agreement with Fearnside et al. (2016) [20], who found that hydroelectric projects can stimulate deforestation around reservoirs in the Amazon. Similar LULCC patterns have been found in other hydroelectric dams constructed in the Brazilian Amazon such as Balbina [41], Belo Monte [42], and Tucuruí [43].
The other non-forest natural formations had a distinct pattern where it increased from 4 km2 in 1985 to 11 km2 in 1998, but decreased to less than 0.1 km2 in 2018. According to the MapBiomas classification scheme, other non-forest natural formation areas in the Amazon biome are represented by savanna formations [36]. The presence of non-forest natural formation patches close to pasturelands may indicate a misclassification of MapBiomas as savanna formations are not frequent in this region and are usually confused with pasturelands when using medium-resolution images due to their seasonality and spectral similarities [44,45] and to their intra-class spectral heterogeneity [46,47].
We have also observed that most of the non-forest natural formations in 1998 (central portion of the study area, Figure 2) were converted to annual and perennial crops in 2018. This class was only identified in the latter year analyzed, reinforcing that the main consequence of the deforestation in the region was a dynamic variation between anthropogenic land-uses. The trend of expanding annual agriculture in the early 2000s in the Mato Grosso State was driven by an increase in soybean export to Europe and China [48]. Despite the apparent success of the Soy Moratorium, an agreement that inhibits soy planting on deforested areas of the Brazilian Amazon after 2008 that reported positive effects in curbing deforestation [23,49], a recent work has pointed out that part of the Brazilian exported soybeans come from illegally deforested areas of the Amazon [50].
The filling of the Braço Norte Hydropower Complex reservoir has also directly impacted the water class, which is associated with the flooding of forest formations and other LULC classes. This has increased from 1 km2 in 1985 to 7 km2 in 1998 when the reservoir started being filled. The reservoir filling ended after the inauguration of Braço Norte IV, accounting for 3.75% (17 km2) of the direct influence zone in 2018. The visual interpretation of Figure 2 shows that the water class expanded mostly over forest formation areas. This is a recurring impact on the construction of hydroelectric power plants in Northern Brazil [51] and was also found by de Resende et al. (2019) [52], who identified considerable floodplain forest loss derived from flood pulse changes as an effect of the Balbina dam construction, also located in the Brazilian Amazon.
These results help to contest the claim of the “greening” of hydropower in the Amazon. The development, submission, and acceptance of robust Environmental Impact Assessment plans for environmental and social damage is imperative prior to the construction of hydroelectric dams in Amazonia [53,54]. Cochrane et al. (2017) [55] conducted a case study comparing the water areas calculated from Landsat-derived LULC maps to the Environmental Impact Assessment estimations used to approve the construction of the Santo Antônio and Jirau mega dams in the Madeira River and found that the reservoirs were at least 341 km2 (64.5%) larger than expected, and an additional 160 km2 of natural forest areas were flooded than expected. Furthermore, dams fragment rivers, affecting freshwater connectivity [56]. Studies in the Amazon have found high rates of deforestation in riparian permanent preservation areas delimited to protect small rivers and maintain forest and water connectivity [57], showing that deforestation is happening in a much larger area across the Amazonian Arc of Deforestation because of the many dams along small streams [58].
In contrast to forest formations, pastures increased in the period analyzed. Its area was equal to 40 km2 in 1985 and increased to 207 km2 and 299 km2 in 1998 and 2018, respectively, accounting for 65% of the total area of the direct influence zone of the Braço Norte Hydropower Complex in the latter year. Along the analyzed period, the increase in pasturelands over deforested areas of the Brazilian Amazon has been considered the predominant LULCC pattern [59,60,61,62]. The increasing local demands for food crops and cattle, the structural changes in social aspects, and the creation of surplus labor force generated from the migration of workforce and subsequent growing population led by the construction of the Braço Norte Hydropower Complex, as observed from the presence of the urban LULC class in 2018, have also influenced LULCC patterns. This is a recurrent situation found in other hydroelectric projects constructed in the Brazilian Amazon [63,64]. Some pasture areas in the Amazon result from illegal deforestation, where part of the cattle raised in these areas are for consumption on the internal market and another part is exported mainly to Europe and China [50]. Official data from Brazilian Institute of Geography and Statistics—IBGE (2017) [65] showed low soybean production in the study area, but a significant presence of cattle herds, agreeing with the results of Figure 3. This crop type is the most important in Mato Grosso and has experienced a significant expansion in the last 20 years. Other studies have also observed the low presence of soybean production in this region even after the soybean boom in Mato Grosso after 2000 [66,67]. However, the pasture expansion in Mato Grosso State has also been driven by the soybean expansion over pasture, causing ranchers to expand their production over natural vegetation and secondary vegetation [62].
We also note from Figure 2 and Figure 3 that forest formation conversion was higher between 1985 and 1998 than between 1998 and 2018: this LULC class decreased 180 km2 in the first period and 107 km2 in the latter. The local historical analysis confirmed that the major period of deforestation occurred before 1998 [40,68,69] and that the main LULCC pattern is forest converted to pasturelands [70]. Furthermore, the municipalities of Guarantã do Norte and Novo Mundo are within the influence of the BR-163 highway. LULCC dynamics in the BR-163 highway region include cattle ranching, the most common practice, and the more recent but small development of agriculture with soybean expansion in 2008 [40,69,71]. This is in agreement with the traditional Brazilian Amazon deforestation process that includes: (i) the price of commodities driving the subsistence activities of small farmers who are encouraged to settle on forestlands; (ii) meat market prices driving forest conversion to pasture; and (iii) agricultural market prices and the pavement of roads, in this case, the BR-163 highway, driving forest conversion to croplands [70].
Besides the direct and indirect impacts of the Braço Norte Hydropower Complex construction in LULCC, we also highlight important large-scale initiatives that were taken as an attempt to decrease deforestation in the Brazilian Amazon such as the Action Plan to Prevent and Control Deforestation in the Amazon (PPCDAm) in 2004 [72] and the Soy Moratorium [23,68]. However, these two initiatives could not fully curb deforestation in the region.
Episodes involving local environmental actors suggest weak law enforcement by local authorities that contributes to deforestation in the region where the study area is located [68,71,73]. According to Fearnside (2007) [71], during the early 2000s the mayor of Guarantã do Norte declared himself the ‘‘green mayor’’ and announced several initiatives to reduce deforestation along the BR-163 highway, but in response, local loggers took the head of the National Fund for the Environment (FNMA) as a hostage and held her until the mayor declined the creation of two natural reserves previously proposed. Moreover, the Brazilian Institute of the Environment and Renewable Natural Resources (IBAMA) office in Guarantã do Norte suffered an arson fire in 2004 for which local loggers were considered primary suspects [71]. This suggests that it is necessary to go beyond punishments to reduce the impact of the anthropic intervention in this region, incorporating initiatives such as tenure regularization, territorial management, the implementation of the Rural Environmental Registry (CAR), monitoring and surveillance, financial incentives for sustainable production, improvement of agricultural and livestock practices, and environmental education. However, such actions, mostly depending on federal initiatives, are far from being taken as an anti-environmental agenda has been adopted by the Brazilian Federal Government inaugurated in 2019 [74,75,76].

5. Conclusions

Assessing LULCC is challenging in regions where complex actors drive these transitions. In the Brazilian Amazonia, infrastructure projects drive deforestation, providing environmental, social, and economic consequences, especially in the surroundings of these projects, and also lead to indirect impacts such as urban growth. The temporal analysis in the Braço Norte Hydropower Complex showed substantial LULCC within the direct influence zone of the complex over the past 33-years. Furthermore, large-scale drivers have also impacted on the LULCC, suggesting that both local-scale and large-scale drivers must be considered before the construction of future hydropower complexes in the Amazon region.
Results showed that the LULC dataset MapBiomas-Collection 4.1 can be used for LULCC analysis in the Brazilian Amazon, but we reinforce the need for local-scale accuracy assessment of this dataset in future studies. We also reinforce the need for public managers to use geotechnologies as an essential tool for territorial planning, since they allow a broader vision of the environment and, in this case, without the associated high implementation monetary costs.
Finally, our results reveal the need for adopting special policies to minimize the impact of these constructions, for example, the creation of Protected Areas and the definition of locally adjusted parameters for ecological–economic zoning considering the environmental and social circumstances derived from the local actors that depend on the natural environment to subsist such as indigenous peoples, riverine population, and artisanal fishermen.

Author Contributions

Conceptualization, J.V.R.G., E.V.E.-S., V.B., and L.E.M.; Methodology, J.V.R.G., M.E.D.C., and G.A.V.M.; Writing–original draft preparation, J.V.R.G., M.E.D.C., G.A.V.M., and L.E.M.; Writing–review and editing, J.V.R.G., M.E.D.C., G.A.V.M., M.C.A.P., G.d.O., and Y.E.S. All authors have read and agreed to the published version of the manuscript.

Funding

The São Paulo Research Foundation (FAPESP, grant number 2016/19020-0), National Counsel of Technological and Scientific Development (CNPq, grant number 381065/2019-7), and the Coordination for the Improvement of Higher Education Personnel (CAPES, grant number 88887.351470/2019-00) funded this research through the provision of research scholarships.

Conflicts of Interest

The authors declare no conflict of interest.

References

  1. Plieninger, T.; Draux, H.; Fagerholm, N.; Bieling, C.; Bürgi, M.; Kizos, T.; Kuemmerle, T.; Primdahl, J.; Verburg, P.H. The driving forces of landscape change in Europe: A systematic review of the evidence. Land Use Policy 2016, 57, 204–214. [Google Scholar] [CrossRef] [Green Version]
  2. Laborde, H.; Douzal, V.; Ruiz Piña, H.A.; Morand, S.; Cornu, J.-F. Landsat-8 cloud-free observations in wet tropical areas: A case study in South East Asia. Remote Sens. Lett. 2017, 8, 537–546. [Google Scholar] [CrossRef]
  3. Shimabukuro, Y.E.; Beuchle, R.; Grecchi, R.C.; Achard, F. Assessment of forest degradation in Brazilian Amazon due to selective logging and fires using time series of fraction images derived from Landsat ETM+ images. Remote Sens. Lett. 2014, 5, 773–782. [Google Scholar] [CrossRef]
  4. Cowie, A.L.; Orr, B.J.; Castillo Sanchez, V.M.; Chasek, P.; Crossman, N.D.; Erlewein, A.; Louwagie, G.; Maron, M.; Metternicht, G.I.; Minelli, S.; et al. Land in balance: The scientific conceptual framework for Land Degradation Neutrality. Environ. Sci. Policy 2018, 79, 25–35. [Google Scholar] [CrossRef]
  5. Kovacs, E.; Roelfsema, C.; Lyons, M.; Zhao, S.; Phinn, S. Seagrass habitat mapping: How do Landsat 8 OLI, Sentinel-2, ZY-3A, and Worldview-3 perform? Remote Sens. Lett. 2018, 9, 686–695. [Google Scholar] [CrossRef]
  6. Fahrig, L.; McGill, B. Habitat fragmentation: A long and tangled tale. Glob. Ecol. Biogeogr. 2019, 28, 33–41. [Google Scholar] [CrossRef]
  7. Song, X.P.; Hansen, M.C.; Stehman, S.V.; Potapov, P.V.; Tyukavina, A.; Vermote, E.F.; Townshend, J.R. Global land change from 1982 to 2016. Nature 2018, 560, 639–643. [Google Scholar] [CrossRef]
  8. Latham, J.; Cumani, R.; Rosati, I.; Bloise, M. Global land cover share (GLC-SHARE) database beta-release version 1.0. 2014. Available online: http://www.fao.org/land-water/land/land-governance/land-resources-planning-toolbox/category/details/en/c/1036355/ (accessed on 12 August 2020).
  9. Scholes, R.; Montanarella, L.; Brainich, L.; Barger, N.; Brink, B.t.; Cantele, M.; Erasmus, B.; Fisher, J.; Gardner, T.; Holland, T.G.; et al. Summary for Policymakers of the Assessment Report on Land Degradation and Restoration of the Intergovernmental Science- Policy Platform on Biodiversity and Ecosystem Services. 2018. Available online: https://www.fs.usda.gov/treesearch/pubs/58402 (accessed on 12 August 2020).
  10. Geist, H.; Lambin, E. What Drives Tropical Deforestation? 2001. Available online: http://www.pik-potsdam.de/~luedeke/lucc4.pdf (accessed on 12 August 2020).
  11. Yao, J.; Mitran, T.; Kong, X.; Lal, R.; Chu, Q.; Shaukat, M. Landuse and land cover identification and disaggregating socio-economic data with convolutional neural network. Geocarto Int. 2019. [Google Scholar] [CrossRef]
  12. Von Sperling, E. Hydropower in Brazil: Overview of Positive and Negative Environmental Aspects. Energy Procedia 2012, 18, 110–118. [Google Scholar] [CrossRef] [Green Version]
  13. Gauthier, C.; Moran, E.F. Public policy implementation and basic sanitation issues associated with hydroelectric projects in the Brazilian Amazon: Altamira and the Belo Monte dam. Geoforum 2018, 97, 10–21. [Google Scholar] [CrossRef]
  14. Maavara, T.; Chen, Q.; Van Meter, K.; Brown, L.E.; Zhang, J.; Ni, J.; Zarfl, C. River dam impacts on biogeochemical cycling. Nat. Rev. Earth Environ. 2020, 1, 103–116. [Google Scholar] [CrossRef]
  15. Larsen, M.A.D.; Drews, M. Water use in electricity generation for water-energy nexus analyses: The European case. Sci. Total Environ. 2019, 651, 2044–2058. [Google Scholar] [CrossRef] [PubMed]
  16. The International Energy Agency (IEA). Global Energy & CO2 Status Report. 2018. Available online: https://www.iea.org/reports/global-energy-co2-status-report-2019 (accessed on 12 August 2020).
  17. International Hydropower Association (IHA). Hydropower Status Report. 2018. Available online: https://www.hydropower.org/publications/2018-hydropower-status-report (accessed on 12 August 2020).
  18. Cornwall, W. A dam big problem. Science 2020, 369, 906–909. [Google Scholar] [CrossRef] [PubMed]
  19. Teixeira, A.C.R.; Sodré, J.R. Simulation of the impacts on carbon dioxide emissions from replacement of a conventional Brazilian taxi fleet by electric vehicles. Energy 2016, 115, 1617–1622. [Google Scholar] [CrossRef]
  20. Fearnside, P.M. Environmental and Social Impacts of Hydroelectric Dams in Brazilian Amazonia: Implications for the Aluminum Industry. World Dev. 2016, 77, 48–65. [Google Scholar] [CrossRef]
  21. Fearnside, P.M. Hydropower: Don’t waste climate money on more dams. Nature 2019, 568, 33. [Google Scholar] [CrossRef] [PubMed]
  22. Fraundorfer, M.; Rabitz, F. The Brazilian renewable energy policy framework: Instrument design and coherence. Clim. Policy 2020, 20, 652–660. [Google Scholar] [CrossRef]
  23. Gibbs, H.K.; Rausch, L.; Munger, J.; Schelly, I.; Morton, D.C.; Noojipady, P.; Soares-Filho, B.; Barreto, P.; Micol, L.; Walker, N.F. Environment and development. Brazil’s Soy Moratorium. Science 2015, 347, 377–378. [Google Scholar] [CrossRef]
  24. De Oliveira, G.; Chen, J.M.; Mataveli, G.A.V.; Chaves, M.E.D.; Seixas, H.T.; Cardozo, F.d.S.; Shimabukuro, Y.E.; He, L.; Stark, S.C.; dos Santos, C.A.C. Rapid Recent Deforestation Incursion in a Vulnerable Indigenous Land in the Brazilian Amazon and Fire-Driven Emissions of Fine Particulate Aerosol Pollutants. Forests 2020, 11, 829. [Google Scholar] [CrossRef]
  25. MapBiomas. Project MapBiomas—Collection 4.1 of Brazilian Land Cover & Use Map Series. 2020. Available online: https://mapbiomas.org/en (accessed on 12 August 2020).
  26. Souza, C.M.; Shimbo, J.Z.; Rosa, M.R.; Parente, L.L.; Alencar, A.A.; Rudorff, B.F.T.; Hasenack, H.; Matsumoto, M.; Ferreira, L.G.; Souza-Filho, P.W.M.; et al. Reconstructing Three Decades of Land Use and Land Cover Changes in Brazilian Biomes with Landsat Archive and Earth Engine. Remote Sens. 2020, 12, 2735. [Google Scholar] [CrossRef]
  27. National Institute for Space Research (INPE). Monitoring of the Brazilian Amazon Deforestation by Satellite. 2020. Available online: http://www.obt.inpe.br/OBT/assuntos/programas/amazonia/prodes (accessed on 12 August 2020).
  28. Sindicato da Construção Geração Transmissão e Distribuição de Energia Elétrica e Gás no Estado de Mato Grosso (SINDENERGIA). Location of the Hydroelectric Power Plants of Mato Grosso State. 2014. Available online: http://www.sindenergia.com.br/ (accessed on 4 June 2020).
  29. Carvalho, D.N.; Boniolo, M.R.; Santo, R.G.; Batista, L.V.; Malavazzi, A.A.; Reis, F.A.G.V.; Giordano, L.d.C. Critérios usados na definição de áreas de influências, impactos e programas ambientais em estudos de impacto ambiental de usinas hidrelétricas brasileiras. Rev. Geoci. 2019, 37, 639–653. [Google Scholar] [CrossRef]
  30. Li, D.; Lu, D.; Moran, E.; da Silva, R.F.B. Examining Water Area Changes Accompanying Dam Construction in the Madeira River in the Brazilian Amazon. Water 2020, 12, 1921. [Google Scholar] [CrossRef]
  31. Lopes, T.R.; Moura, L.B.; Nascimento, J.G.; Fraga Junior, L.S.; Zolin, C.A.; Duarte, S.N.; Folegatti, M.V.; Santos, O.N.A. Priority areas for forest restoration aiming at the maintenance of water resources in a basin in the Cerrado/Amazon ecotone, Brazil. J. South Am. Earth Sci. 2020, 101, 102630. [Google Scholar] [CrossRef]
  32. Nunes, S.; Oliveira, L.; Siqueira, J.; Morton, D.C.; Souza, C.M. Unmasking secondary vegetation dynamics in the Brazilian Amazon. Environ. Res. Lett. 2020, 15, 034057. [Google Scholar] [CrossRef]
  33. Silva Junior, C.H.L.; Celentano, D.; Rousseau, G.X.; de Moura, E.G.; Varga, I.v.D.; Martinez, C.; Martins, M.B. Amazon forest on the edge of collapse in the Maranhão State, Brazil. Land Use Policy 2020, 97, 104806. [Google Scholar] [CrossRef]
  34. Silva Junior, C.H.L.; Heinrich, V.H.A.; Freire, A.T.G.; Broggio, I.S.; Rosan, T.M.; Doblas, J.; Anderson, L.O.; Rousseau, G.X.; Shimabukuro, Y.E.; Silva, C.A.; et al. Benchmark maps of 33 years of secondary forest age for Brazil. Sci. Data 2020, 7, 269. [Google Scholar] [CrossRef]
  35. Bonanomi, J.; Tortato, F.R.; Gomes, R.d.S.R.; Penha, J.M.; Bueno, A.S.; Peres, C.A. Protecting forests at the expense of native grasslands: Land-use policy encourages open-habitat loss in the Brazilian cerrado biome. Perspect. Ecol. Conser. 2019, 17, 26–31. [Google Scholar] [CrossRef]
  36. MapBiomas. Project MapBiomas—Collection 4.1 Know the steps of MapBiomas methodology. 2020. Available online: https://mapbiomas.org/en/download-dos-atbds?cama_set_language=en (accessed on 12 August 2020).
  37. Breiman, L. Random forests. Mach. Learn. 2001, 45, 5–32. [Google Scholar] [CrossRef] [Green Version]
  38. Pontius, R.G.; Millones, M. Death to Kappa: Birth of quantity disagreement and allocation disagreement for accuracy assessment. Int. J. Remote Sens. 2011, 32, 4407–4429. [Google Scholar] [CrossRef]
  39. MapBiomas. Project MapBiomas—Collection 4.1 Accuracy Statistics. 2020. Available online: https://mapbiomas.org/estatistica-de-acuracia (accessed on 12 August 2020).
  40. Müller, H.; Griffiths, P.; Hostert, P. Long-term deforestation dynamics in the Brazilian Amazon—Uncovering historic frontier development along the Cuiabá–Santarém highway. Int. J. Appl. Earth Obs. 2016, 44, 61–69. [Google Scholar] [CrossRef]
  41. Rocha, M.; Assis, R.L.; Piedade, M.T.F.; Feitosa, Y.O.; Householder, J.E.; Lobo, G.d.S.; Demarchi, L.O.; Albuquerque, B.W.; Quaresma, A.C.; Ramos, J.F.; et al. Thirty years after Balbina Dam: Diversity and floristic composition of the downstream floodplain forest, Central Amazon, Brazil. Ecohydrology 2019, 12. [Google Scholar] [CrossRef]
  42. Jiang, X.; Lu, D.; Moran, E.; Calvi, M.F.; Dutra, L.V.; Li, G. Examining impacts of the Belo Monte hydroelectric dam construction on land-cover changes using multitemporal Landsat imagery. Appl. Geogr. 2018, 97, 35–47. [Google Scholar] [CrossRef]
  43. Chen, G.; Powers, R.P.; de Carvalho, L.M.T.; Mora, B. Spatiotemporal patterns of tropical deforestation and forest degradation in response to the operation of the Tucuruí hydroelectric dam in the Amazon basin. Appl. Geogr. 2015, 63, 1–8. [Google Scholar] [CrossRef]
  44. Sano, E.E.; Rosa, R.; Brito, J.L.; Ferreira, L.G. Land cover mapping of the tropical savanna region in Brazil. Environ. Monit. Assess. 2010, 166, 113–124. [Google Scholar] [CrossRef]
  45. Grecchi, R.C.; Gwyn, Q.H.J.; Bénié, G.B.; Formaggio, A.R. Assessing the spatio-temporal rates and patterns of land-use and land-cover changes in the Cerrados of southeastern Mato Grosso, Brazil. Int. J. Remote Sens. 2013, 34, 5369–5392. [Google Scholar] [CrossRef]
  46. Müller, H.; Rufin, P.; Griffiths, P.; Barros Siqueira, A.J.; Hostert, P. Mining dense Landsat time series for separating cropland and pasture in a heterogeneous Brazilian savanna landscape. Remote Sens. Environ. 2015, 156, 490–499. [Google Scholar] [CrossRef] [Green Version]
  47. Alencar, A.; Shimbo, J.Z.; Lenti, F.; Balzani Marques, C.; Zimbres, B.; Rosa, M.; Arruda, V.; Castro, I.; Fernandes Márcico Ribeiro, J.P.; Varela, V.; et al. Mapping Three Decades of Changes in the Brazilian Savanna Native Vegetation Using Landsat Data Processed in the Google Earth Engine Platform. Remote Sens. 2020, 12, 924. [Google Scholar] [CrossRef] [Green Version]
  48. Lathuillière, M.J.; Johnson, M.S.; Galford, G.L.; Couto, E.G. Environmental footprints show China and Europe’s evolving resource appropriation for soybean production in Mato Grosso, Brazil. Environ. Res. Lett. 2014, 9, 074001. [Google Scholar] [CrossRef]
  49. Rudorff, B.F.T.; Adami, M.; Aguiar, D.A.; Moreira, M.A.; Mello, M.P.; Fabiani, L.; Amaral, D.F.; Pires, B.M. The Soy Moratorium in the Amazon Biome Monitored by Remote Sensing Images. Remote Sens. 2011, 3, 185–202. [Google Scholar] [CrossRef] [Green Version]
  50. Rajao, R.; Soares-Filho, B.; Nunes, F.; Borner, J.; Machado, L.; Assis, D.; Oliveira, A.; Pinto, L.; Ribeiro, V.; Rausch, L.; et al. The rotten apples of Brazil’s agribusiness. Science 2020, 369, 246–248. [Google Scholar] [CrossRef]
  51. De Faria, F.A.M.; Jaramillo, P. The future of power generation in Brazil: An analysis of alternatives to Amazonian hydropower development. Energy Sustain. Dev. 2017, 41, 24–35. [Google Scholar] [CrossRef]
  52. Resende, A.F.; Schongart, J.; Streher, A.S.; Ferreira-Ferreira, J.; Piedade, M.T.F.; Silva, T.S.F. Massive tree mortality from flood pulse disturbances in Amazonian floodplain forests: The collateral effects of hydropower production. Sci. Total Environ. 2019, 659, 587–598. [Google Scholar] [CrossRef] [PubMed]
  53. Moran, E.F. Changing how we build hydropower infrastructure for the common good: Lessons from the Brazilian Amazon. Civitas Rev. Ciênc. Soc. 2020, 20, 5. [Google Scholar] [CrossRef]
  54. Atkins, E. Contesting the ‘greening’ of hydropower in the Brazilian Amazon. Polit. Geogr. 2020, 80, 102179. [Google Scholar] [CrossRef]
  55. Cochrane, S.M.V.; Matricardi, E.A.T.; Numata, I.; Lefebvre, P.A. Landsat-based analysis of mega dam flooding impacts in the Amazon compared to associated environmental impact assessments: Upper Madeira River example 2006–2015. RSASE 2017, 7, 1–8. [Google Scholar] [CrossRef]
  56. Anderson, E.P.; Jenkins, C.N.; Heilpern, S.; Maldonado-Ocampo, J.A.; Carvajal-Vallejos, F.M.; Encalada, A.C.; Rivadeneira, J.F.; Hidalgo, M.; Canas, C.M.; Ortega, H.; et al. Fragmentation of Andes-to-Amazon connectivity by hydropower dams. Sci. Adv. 2018, 4, 1642. [Google Scholar] [CrossRef] [Green Version]
  57. Nunes, S.S.; Barlow, J.O.S.; Gardner, T.A.; Siqueira, J.V.; Sales, M.R.; Souza, C.M. A 22 year assessment of deforestation and restoration in riparian forests in the eastern Brazilian Amazon. Environ. Conserv. 2014, 42, 193–203. [Google Scholar] [CrossRef] [Green Version]
  58. Souza, C.; Kirchhoff, F.; Oliveira, B.; Ribeiro, J.; Sales, M. Long-Term Annual Surface Water Change in the Brazilian Amazon Biome: Potential Links with Deforestation, Infrastructure Development and Climate Change. Water 2019, 11, 566. [Google Scholar] [CrossRef] [Green Version]
  59. Buschbacher, R.J. Tropical Deforestation and Pasture Development. BioScience 1986, 36, 22–28. [Google Scholar] [CrossRef]
  60. Chauvel, A.; Grimaldi, M.; Barros, E.; Blanchart, E.; Desjardins, T.; Sarrazin, M.; Lavelle, P. Pasture damage by an Amazonian earthworm. Nature 1999, 398, 32–33. [Google Scholar] [CrossRef]
  61. Barona, E.; Ramankutty, N.; Hyman, G.; Coomes, O.T. The role of pasture and soybean in deforestation of the Brazilian Amazon. Environ. Res. Lett. 2010, 5, 024002. [Google Scholar] [CrossRef]
  62. Picoli, M.C.A.; Rorato, A.; Leitão, P.; Camara, G.; Maciel, A.; Hostert, P.; Sanches, I.D.A. Impacts of Public and Private Sector Policies on Soybean and Pasture Expansion in Mato Grosso—Brazil from 2001 to 2017. Land 2020, 9, 20. [Google Scholar] [CrossRef] [Green Version]
  63. Neto, J.Q.d.M.; Herrera, J.A. Altamira-PA: Novos papéis de centralidade e reestruturação urbana a partir da instalação da UHE Belo Monte. Confins 2016. [Google Scholar] [CrossRef]
  64. Herrera, J.A.; Pragana, M. Resistência E Conflitos Sociais Na Amazônia Paraense: A luta contra o empreendimento Hidrelétrico de Belo Monte. Campo-Território: Revista De Geografia Agrária 2013, 8, 130–151. [Google Scholar]
  65. Brazilian Institute of Geography and Statistics (IBGE). Agricultural Census. 2017. Available online: https://censos.ibge.gov.br/agro/2017/ (accessed on 12 August 2020).
  66. Chaves, M.; de Carvalho Alves, M.; de Oliveira, M.; Sáfadi, T. A Geostatistical Approach for Modeling Soybean Crop Area and Yield Based on Census and Remote Sensing Data. Remote Sens. 2018, 10, 680. [Google Scholar] [CrossRef] [Green Version]
  67. Picoli, M.C.A.; Camara, G.; Sanches, I.; Simões, R.; Carvalho, A.; Maciel, A.; Coutinho, A.; Esquerdo, J.; Antunes, J.; Begotti, R.A.; et al. Big earth observation time series analysis for monitoring Brazilian agriculture. ISPRS J. Photogram. 2018, 145, 328–339. [Google Scholar] [CrossRef]
  68. Macedo, M.N.; DeFries, R.S.; Morton, D.C.; Stickler, C.M.; Galford, G.L.; Shimabukuro, Y.E. Decoupling of deforestation and soy production in the southern Amazon during the late 2000s. Proc. Natl. Acad. Sci. USA 2012, 109, 1341–1346. [Google Scholar] [CrossRef] [Green Version]
  69. Gollnow, F.; Göpel, J.; deBarros Viana Hissa, L.; Schaldach, R.; Lakes, T. Scenarios of land-use change in a deforestation corridor in the Brazilian Amazon: Combining two scales of analysis. Reg. Environ. Chang. 2017, 18, 143–159. [Google Scholar] [CrossRef]
  70. Verburg, R.; Filho, S.R.; Lindoso, D.; Debortoli, N.; Litre, G.; Bursztyn, M. The impact of commodity price and conservation policy scenarios on deforestation and agricultural land use in a frontier area within the Amazon. Land Use Policy 2014, 37, 14–26. [Google Scholar] [CrossRef]
  71. Fearnside, P.M. Brazil’s Cuiaba- Santarem (BR-163) Highway: The environmental cost of paving a soybean corridor through the Amazon. Environ. Manag. 2007, 39, 601–614. [Google Scholar] [CrossRef]
  72. Soares-Filho, B.; Rajão, R. Traditional conservation strategies still the best option. Nat. Sustain. 2018, 1, 608–610. [Google Scholar] [CrossRef]
  73. Azevedo-Ramos, C.; Moutinho, P. No man’s land in the Brazilian Amazon: Could undesignated public forests slow Amazon deforestation? Land Use Policy 2018, 73, 125–127. [Google Scholar] [CrossRef]
  74. Artaxo, P. Working together for Amazonia. Science 2019, 363, 323. [Google Scholar] [CrossRef] [PubMed] [Green Version]
  75. Escobar, H. Brazil’s deforestation is exploding—and 2020 will be worse. Science 2019. [Google Scholar] [CrossRef]
  76. De Area Leão Pereira, E.J.; de Santana Ribeiro, L.C.; da Silva Freitas, L.F.; de Barros Pereira, H.B. Brazilian policy and agribusiness damage the Amazon rainforest. Land Use Policy 2020, 92, 104491. [Google Scholar] [CrossRef]
Figure 1. Location of the study area in South America, the Brazilian territory, the Brazilian Amazon, and the Mato Grosso State. Red polygon represents the direct influence zone of the Braço Norte Hydropower Complex.
Forests 11 00988 g001
Figure 2. Land use and land cover in the direct influence zone of the Braço Norte Hydropower Complex representing the year when the construction began (1985), the filling of the reservoir (1998), and the current period (2018). Source: MapBiomas-Collection 4.1 level 3 dataset [25].
Forests 11 00988 g002
Figure 3. Annual total area (km2) and percentage of the LULC classes identified in the direct influence zone of the Braço Norte Hydropower Complex in 1985, 1998, and 2018.
Forests 11 00988 g003
Figure 4. Map showing whether changes have occurred in land use and land cover in the direct influence zone of the Braço Norte Hydropower Complex (7 km buffer), and in the influence expansion zone (14 km, 21 km, and 28 km buffers) between 1985 and 2018. Source: MapBiomas-Collection 4.1 level 3 dataset [25].
Forests 11 00988 g004

