Assessing the Diversity of the Form of Age-Specific Changes in Adult Mortality from Captive Mammalian Populations


1
Unité Eco-anthropologie (EA), Muséum National d’Histoire Naturelle, CNRS, Université Paris Diderot, F-75016 Paris, France
2
Univ Lyon, Université Lyon 1, CNRS, Laboratoire de Biométrie et Biologie Évolutive UMR 5558, F-69622 Villeurbanne, France
3
Species360 Conservation Science Alliance, Bloomington, MN 55425, USA
4
Interdisciplinary Centre on Population Dynamics, Department of Biology, University of Southern Denmark, 5230 Odense, Denmark
*
Author to whom correspondence should be addressed.
Diversity 2020, 12(9), 354; https://doi.org/10.3390/d12090354
Submission received: 31 July 2020
/
Revised: 11 September 2020
/
Accepted: 13 September 2020
/
Published: 15 September 2020
(This article belongs to the Special Issue Bayesian Survival Trajectory Analysis in Wildlife)
Abstract
:Actuarial senescence (i.e., the age-specific increase in mortality rate) is pervasive across mammalian species, but our current understanding of the diversity of forms that actuarial senescence displays across species remains limited. Although several mathematical models have been proposed to model actuarial senescence, there is still no consensus on which model to use, especially when comparing mortality patterns among species. To fill this knowledge gap, we fitted and compared different forms of increase using models commonly used in senescence studies (i.e., Gompertz, Weibull, and logistic) across 61 species of mammalian captive populations using the Bayesian Survival Trajectory Analysis (BaSTA) approach. For as much as 79% of the species, a Gompertz increase of mortality with age was the most parsimonious model that satisfactorily described the shape of age-specific mortality changes in adults. This highlights that the form of the increase in mortality is mostly consistent across mammalian species and follows the Gompertz rule with some rare exceptions. The implications of that result are twofold. First, the Gompertz rate of mortality increase should be used in cross-species comparative analyses of mammals, as already done in some studies. Second, although the Gompertz model accurately describes actuarial senescence in most mammals, there are notable exceptions, and the factors causing this deviation from an exponential mortality increase during the adult stage warrant further investigation.
1. Introduction
Pioneer analyses of human life tables several centuries ago have revealed that mortality risk undoubtedly increases with age in our own species [1]. However, it took years before the widespread occurrence of actuarial senescence (i.e., age-specific increase in mortality rate) among mammals in the wild becomes admitted [2]. One reason for this long latency may be found in the methodological difficulty of detecting actuarial senescence in nature. Obtaining reliable estimates of age-specific mortality changes in the wild is indeed far from an easy task for two main reasons. First, the exact age of individuals is required to build an accurate life table [3], and second, not accounting for imperfect detection leads to biased estimates of mortality [4]. The longitudinal monitoring of known-aged individuals is the golden standard to estimate reliably age-specific mortality in mammalian species [5]. The rise in these long-term research programs in mammalian populations [6] and the development of powerful statistical methods and softwares (E-SURGE [7]; Bayesian Survival Trajectory Analysis (BaSTA) [8]) allowed increasing evidence of actuarial senescence in the wild (see [2] for a review). Nowadays, the prevailing view is that the presence of actuarial senescence constitutes the rule rather than the exception in mammals [9]. In addition, while environmental conditions modulate age-specific mortality patterns (e.g., [10] in elk, Cervus elaphus canadensis), actuarial senescence has been reported under a wide range of environmental conditions (e.g., zoological gardens [11]; semi-captive populations [12]). Therefore, the current challenge in evolutionary biology of aging is not to assess the universality of senescence across species but to assess and understand the diversity of age-specific mortality patterns that have been identified across species [13]. In particular, the extent of variation in the shape of actuarial senescence has not been yet investigated, and current theories on the evolution of senescence (see [14,15] for reviews) do not allow launching any prediction about the shape of age-specific mortality changes.
Most mammalian case studies of actuarial senescence to date have assumed that the Gompertz model [1,16], involving an exponential increase of mortality with age at a constant rate, provides a satisfactory description of age-specific changes in mortality from a given threshold age [17]. While standard evolutionary theories assume that mortality should start to increase from the age at first reproduction onwards, empirical studies performed so far indicated that the threshold age is often delayed by several years [14]. For instance, while most females of large herbivores give birth for the first time at two or three years of age, the onset of actuarial senescence is consistently estimated at eight to 10 years of age [17]. This demonstrates that a Gompertz model is unlikely to capture the shape of age-specific mortality changes during the full adulthood period even in cases where it describes age-related mortality changes during late life well. Thus, the Siler model [18] has been proposed to model mortality changes over the entire lifespan with a bathtub-shaped mortality curve over ages, which includes a Gompertz increase in mortality from a given age. Overall, even if the Gompertz rate of actuarial senescence has been widely used in comparative analyses of aging (either estimated from a Gompertz model (e.g., [19]) or from a Siler model (e.g., [20])), other models could explain the rise of mortality with age. For instance, one of the best-known alternatives is the Weibull model [21], which is not often used in comparative analyses of aging across mammals (but see [22]).
Until now, the only comparisons between the fits of different sets of models were mainly performed on populations with large sample sizes (e.g., [23] in humans and [24] in fruit flies), with the Gompertz model being most of the time the best one to explain the senescent stage. However, very few studies have assessed the shape of actuarial senescence across different species of mammals by comparing a set of plausible models of age-dependence in mortality during the adult stage (but see [11] for a comparison between Gompertz and Gompertz–Makeham models, [25] for a comparison among particular cases of the Siler model). We aim here to fill this knowledge gap by providing a first comprehensive analysis of the shape of actuarial senescence across mammals by using the highly flexible and powerful Bayesian Survival Trajectory Analysis (BaSTA) R package to analyze a large set of mammalian life tables collected in captive populations.
2. Materials and Methods
2.1. Dataset
Demographic data on captive mammals were retrieved from previous studies [11] using data from the Species360 non-governmental organization (https://www.species360.org/). This organization collates and standardizes information from approximately 6.5 million individuals belonging to >21,000 species (mostly vertebrates) across >1000 zoological and aquaria institutions in over 90 countries. For each species, we got access to the age at death of individuals. Following previous works using the same dataset [11,25], we restricted our analyses to extinct cohorts where the age at death was known for each zoo-housed individual. In this study, we only performed the analysis on females that survived to the age at first reproduction. We included species with at least 50 individuals still alive at the age at first reproduction to have a large enough sample size to ensure reliable estimates of mortality at old ages. A total of 61 mammalian species, encompassing a wide range of Orders, were included in our analysis.
2.2. Age-Dependent Models of Mortality Changes during the Adult Stage
Three types of models have been widely used in the literature to analyze the increase of mortality with age associated to actuarial senescence.
- (1)
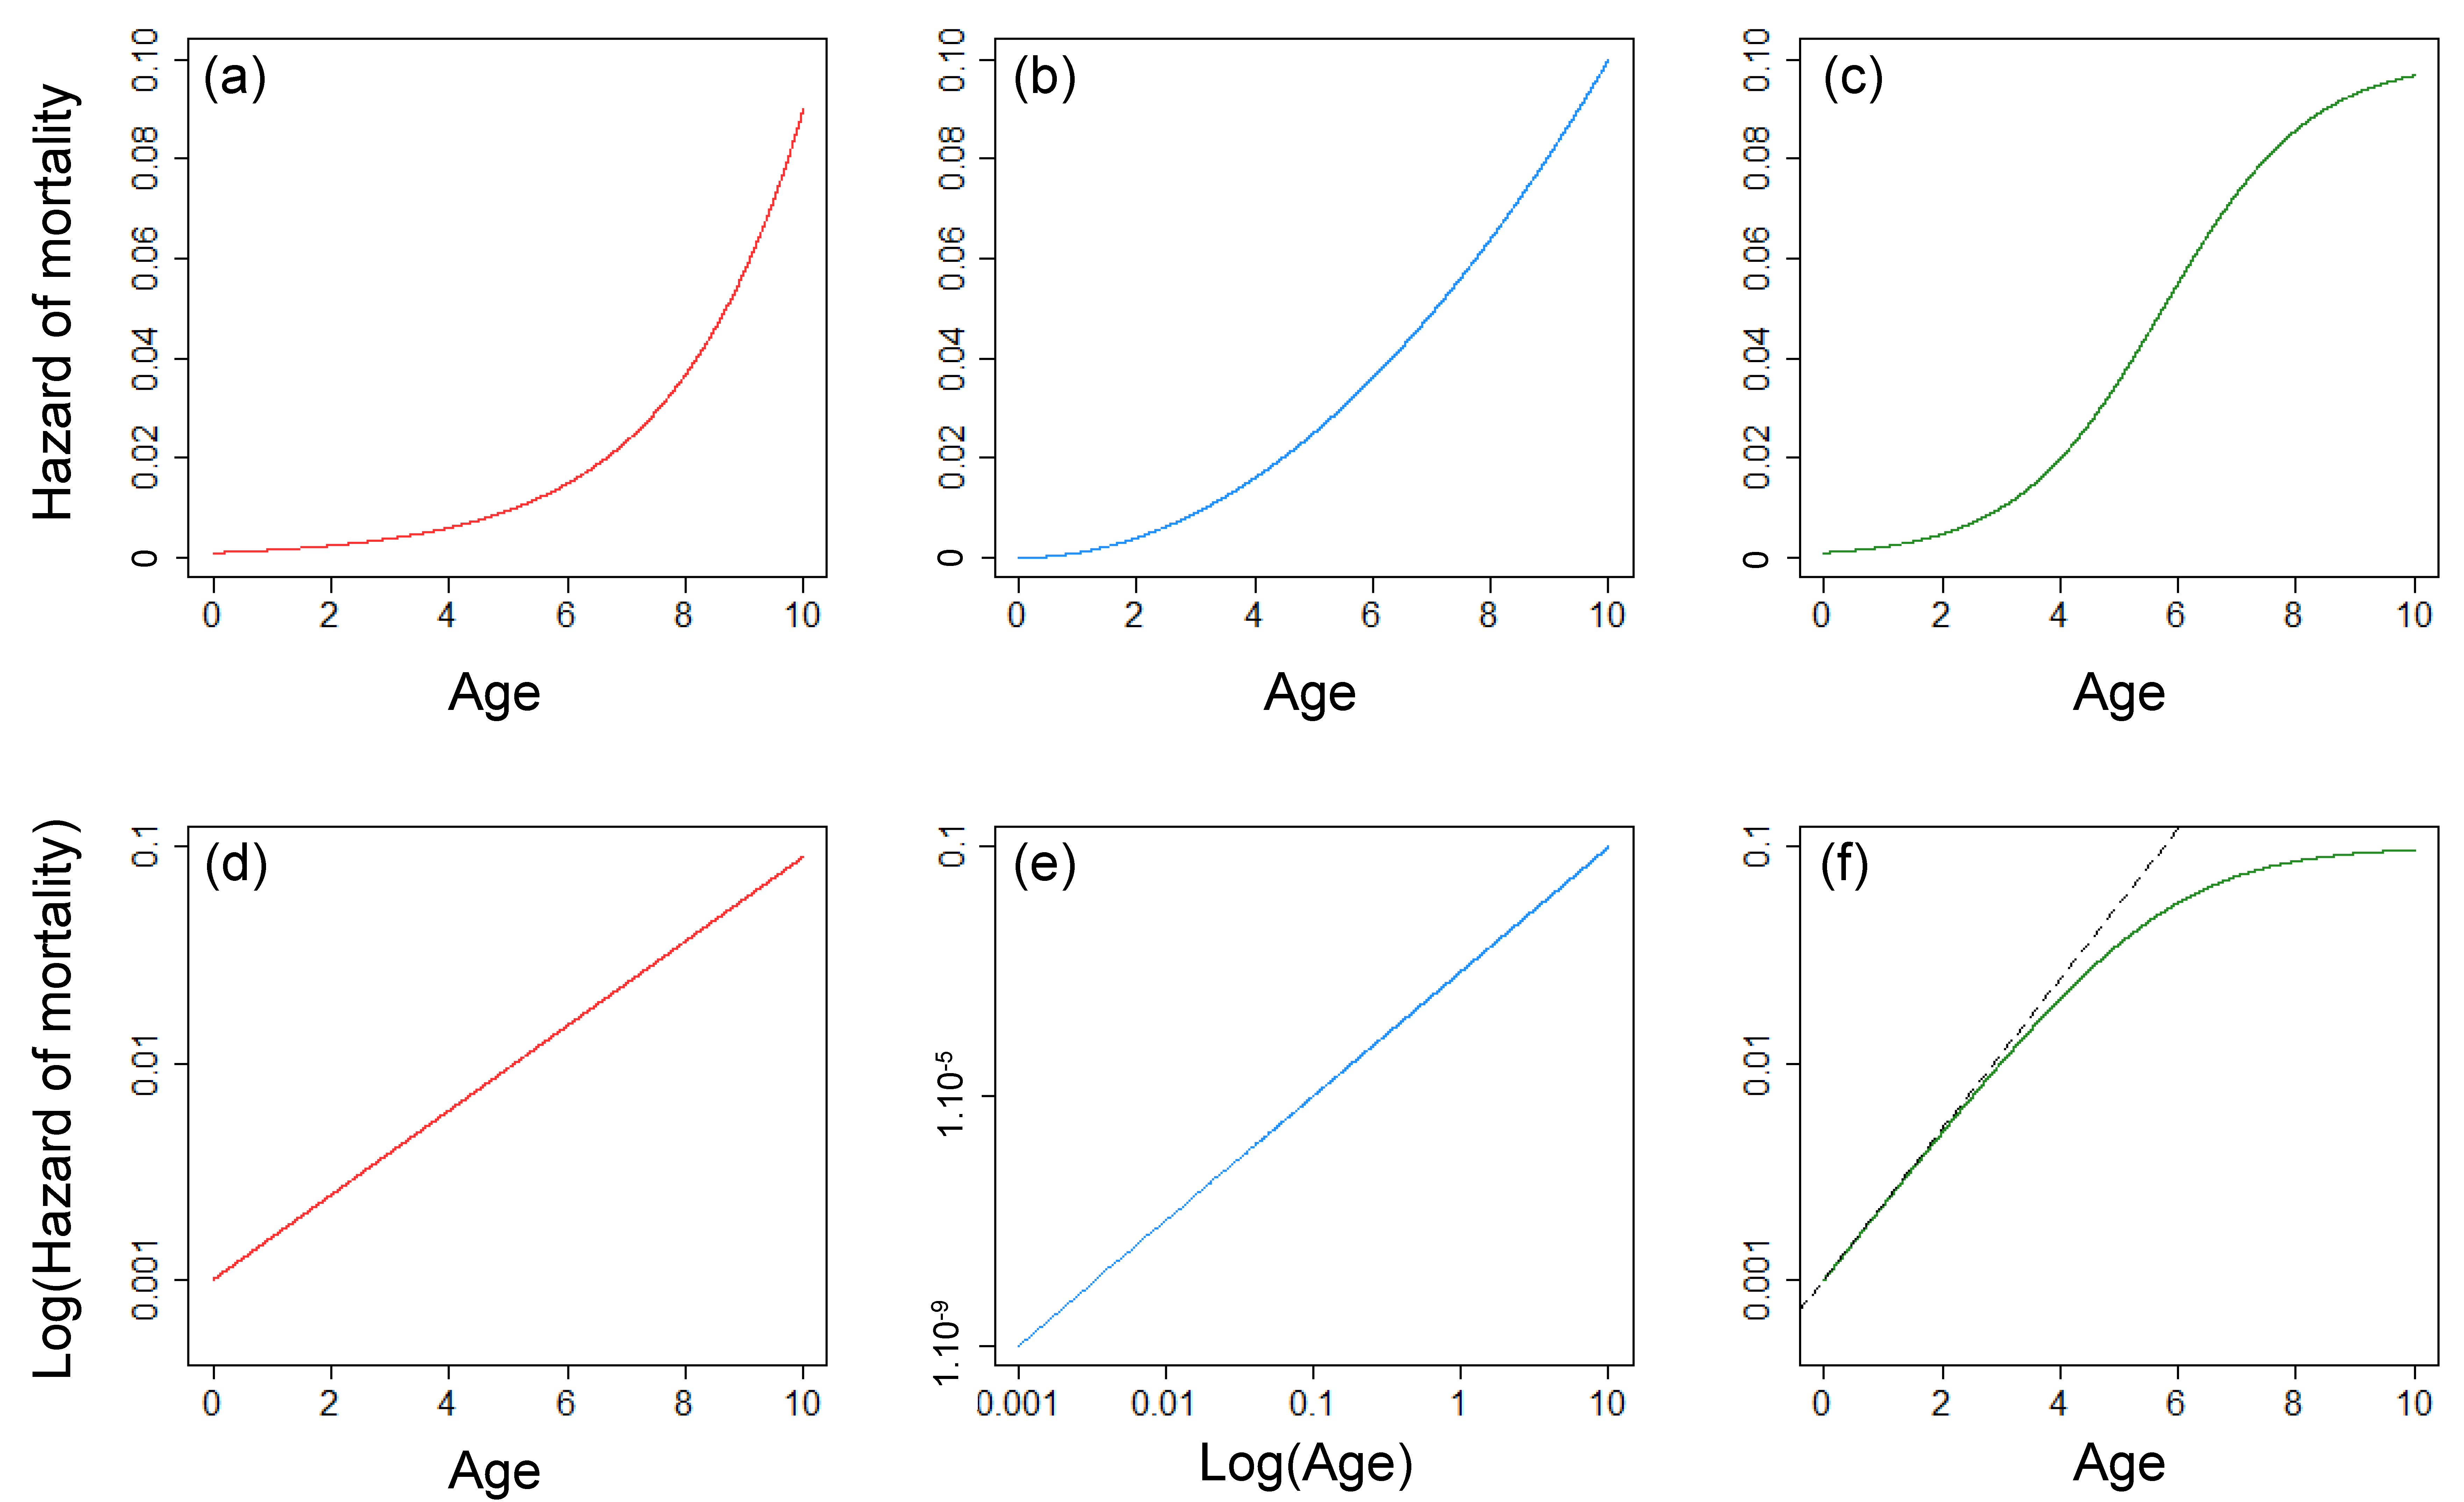
- The Gompertz model [1] is a two-parameter model in which the hazard of mortality follows an exponential increase with age (see Equation (1) and Figure 1a,d).where µ(x) is the hazard of mortality for the Gompertz model with representing the basal mortality rate and representing the exponential rate of increase.
- (2)
- The Weibull model [21] is also a two-parameter model, but it is characterized by an exponential increase with the logarithm of age (see Equation (2) and Figure 1b,e).where µ(x) is the hazard of mortality for the Weibull model with b1 representing the scale parameter and b0 representing the shape parameter.µ(x) = b0b1b0xb0−1
- (3)
- The logistic model [26] is a three-parameter model that is equivalent to the Gompertz model at young age but with a rate of increase that decreases with age (see Equation (3) and Figure 1c,f). This model is often used to model a Gompertz increase associated with a strong selective disappearance occurring in a population (i.e., populations with heterogeneous mortality rates among individuals resulting in an increase of the proportion of high-quality individuals with increasing age [27]).where µ(x) is the hazard of mortality for the logistic model with b0 and b1 corresponding to the parameters a and b of the Gompertz model, respectively, and b2 describing the rate of deceleration of the speed of mortality increase.
However, it is known that the increase of mortality associated with senescence does not always begin right after the age at first reproduction [14,25] and thus could lead to inadequate fitting of the different models. The package BaSTA [8] in R version 4.0.1 [28] proposes 3 different structures of Bayesian models to account for this issue: the ‘simple’ models corresponding to the 3 basal models (i.e., Gompertz, Weibull, logistic) described above, the ‘Makeham’ model in which a positive constant c is added to each of the three basal models, and the ‘bathtub’ model in which both a constant c (to represent potential age-independence during the prime-age stage) and a declining mortality following a Gompertz model (to represent potential decreasing mortality early in life) is added to the 3 models described above (see Equation (4)).
where µ(x) is the hazard of mortality of bathtub models with a0e−a1x representing the declining early life mortality following a Gompertz model, c representing the Makeham constant, and µS(x) representing the senescent part (either Gompertz, Weibull, or logistic).
µ(x) = a0e−a1x + c + µS(x)
For each species, 9 different models were fitted (simple, Makeham, or bathtub associated with either Gompertz, Weibull, or logistic mortality functions, see Appendix A for the full equations of each model). From now on, the fact that the model is either simple, Makeham, or bathtub is referred to as the structure of the model and the fact the last part is either Gompertz, Weibull, or logistic is referred as the form of actuarial senescence. Each model fitted was run for 100,000 iterations with a burn-in of 1000 and a thinning of 50. The convergence of each model was assessed visually (for two species (Mandrillus Sphinx and Odocoileus hemionus), we were unable to reach convergence for the Gompertz–Makeham model, but we chose to keep those species in our analysis because convergence was reached for all the other models). For each model, the Deviance Information Criterion (DIC) was calculated [29], which provides a measure of the predictive power of a given model analog to the Aikake Information Criterion (AIC) value. The retained model was selected based on the lowest DIC. For each species, we reported the retained model using two trinary traits corresponding to the structure of the model (simple, Makeham, or bathtub) and to the form of the mortality curve during the senescent phase (Gompertz, Weibull, or logistic). (See Table S1 for all the DIC associated with each model and the final model selected for each species.)
2.3. Statistical Analysis
We first sought to identify the model structure and form that provided the best fit to the age-specific mortality data of each species. The structure and the form of age-dependent mortality were analyzed independently for each species. Then, we assessed whether the phylogenetic relatedness among species accounted for the distribution of the levels of model complexity among species. We used the method presented in [30], which was developed especially for discrete traits with more than 2 states to compute delta, which is a measure of the phylogenetic signal (i.e., the tendency for more closely related species to have more similar trait values). The higher the delta was, the higher the phylogenetic signal. To assess the statistical significance of the phylogenetic signal, we simulated 1000 trait distributions with no phylogenetic signal (i.e., random sampling). For each distribution, delta was computed, which allowed us to compare the delta obtained in our analysis to the distribution of deltas expected under the assumption of no phylogenetic signal. We concluded to a statistically significant phylogenetic signal when the delta computed was outside the 95% quantiles of the distribution of deltas expected without a phylogenetic signal. Following [30], delta was transformed using log(delta + 1). The phylogenetic tree used for the analyses was extracted from [31].
Then, we looked for detecting the life history or methodological traits that could potentially explain the observed variation in structure and form across mammalian species. Among these, the total sample size (i.e., the number of individuals monitored for a given species) is likely to affect the form of the model. Thus, the decrease of mortality associated with the logistic model has been mainly found in populations with a very high sample size, allowing them to get a very accurate mortality value at very old ages (e.g., in humans [32] and in fruit flies [24]). From a biological viewpoint, the species ranking along the slow–fast continuum of life histories [33] is likely to affect the structure or form of age-dependent adult mortality because a low mortality early in the adulthood should be associated with a weak actuarial senescence [34]. We computed the life expectancy from the age at first reproduction for each species (which corresponds to the mean age at death from the age at first reproduction) to assess the species-specific rank along the slow–fast continuum because we did not have access to measures of generation times (a more appropriate metric [33]) for those populations. All combinations of multinomial logistic regression models including sample size, life expectancy, and the possible interaction between sample size and life expectancy were fitted (N = 5 models) and compared using the function multinom in R. For each model, the AIC value was computed, and the most appropriate model was selected based on the lowest AIC value and on the number of parameters when similar fit quality was observed [35].
3. Results
3.1. Form of the Senescent Phase
Out of the 61 mammalian species included in this study, the Gompertz model was selected for 48 species, the Weibull model was selected for six species, and the logistic model was selected for seven species (see Figure 2). Thus, the vast majority of the mammalian species we analyzed displayed a senescent stage during which mortality increased exponentially with age as predicted by the Gompertz model (79%, 10%, and 11% of the species for Gompertz, Weibull, and logistic, respectively). There was no evidence that the phylogenetic relatedness affected the likelihood to observe a specific form of the senescent phase for a given set of species (see Appendix B). Moreover, there was no detectable effect of the number of adults monitored nor of the life expectancy from age at first reproduction on the probability to find different forms of actuarial senescent, as the null model was consistently selected (See Table 1a).
3.2. Structure of the Model
The distribution of the model structures across mammalian species was much more balanced than the one observed with the different forms, with 13, 17, and 31 species showing respectively a simple, Makeham, and bathtub structure. However, the high frequency of a bathtub structure indicates that the onset of actuarial senescence started later than the age at first reproduction in about half the species. There was no phylogenetic signal associated with the probability to find different structures across species (see Appendix B). As reported for the form of actuarial senescence, neither sample size nor the life expectancy from the age at first reproduction affected the probability to find a specific structure (null model selected, See Table 1b).
4. Discussion
We demonstrate in this study that for a large majority of mammalian species in captive conditions, late mortality generally follows the Gompertz model rather than a Weibull or logistic model. This finding fits our current knowledge on actuarial senescence in mammals and has two major implications.
First, the use of the Gompertz model to assess the intensity of actuarial senescence and compare it across mammal species (e.g., [19,20]) can be advocated. One of the major appeals of the Gompertz model is the ease with which the b1 parameter can be interpreted biologically (i.e., as the exponential rate of mortality increase), which can have promising implications for the comparative biology of aging (see [20] for a recent example). Thus, it is not surprising that the b1 parameter has been repeatedly used as a measurement of the rate of actuarial senescence in comparative analyses. Here, we validate the use of that metric when comparing senescence patterns across mammalian species. However, while our analyses clearly indicate that the Gompertz model generally describes age-related changes during the senescence stage, the presence of an onset of actuarial senescence has to be specifically accounted for when modeling age-specific mortality throughout adulthood. Indeed, the common assumption issued from evolutionary theories of senescence that actuarial senescence should begin at the age at first reproduction [34,36] was not fulfilled in about half the species we analyzed.
Second, age-related changes in mortality during the senescent stage were best described by a logistic function in a few species, without any association with phylogeny, number of adults monitored, or pace of life (measured by life expectancy from the age at first reproduction in our analyses). This indicates that in these species, a mortality plateau or at least a decrease in senescence rate is occurring at very late ages. A mortality plateau has been reported in humans, for which only the early part of the senescent stage follows a Gompertz increase, while mortality changes at very old ages (>80 years of age) display a plateau or even a decrease (when including the eldest humans) of the rate of senescence. Thus, in centenarians, the mortality rate is almost constant with age at about 0.50 [32]. The occurrence of a mortality plateau is often interpreted as the result of selective disappearance that leads a population to include only the most robust individuals at old ages [27]. Whether this is the case for the mammalian species shown to follow a logistic shape of mortality changes with age during the senescent stage will require further investigation. However, this pattern seems to be far from the rule in mammals. As a caution note, we have to consider that the number of adults monitored to assess the form of the age-dependence from zoo-housed species were by far smaller than the number of individuals generally analyzed in human demography. For instance, the largest sample size we got was 1018 adult females in Panthera leo, whereas the number of humans included in mortality analyses generally exceeds one million easily. This limitation prevents us from making a suitable comparison of age-specific mortality at old ages between humans and other mammals. We can only state that based on the current available information, the age-related changes in mortality during the senescent stage follow a Gompertz increase in most mammals, which is in line with what is observed during the early senescent stage in humans. Moreover, in some species, a Weibull model provided the best fit of age-related changes in mortality during the senescent stage. As the amount of increase in mortality with age is weaker when following a Weibull rather than a Gompertz model (mortality hazard scaling to the logarithm of age for Weibull vs. to age for Gompertz), one might have expected a Weibull model to best fit mortality patterns in slow-living species. It was not the case, and as observed for the logistic function, neither phylogeny, the number of adults monitored, nor the pace of life allowed predicting the occurrence of a Weibull form of age-related mortality changes.
Although the Gompertz model generally provided the best fit of age-specific adult mortality in mammals, we warn researchers to consider alternative models in addition to the Gompertz function when studying actuarial senescence. For instance, to consider the deceleration of mortality at old ages, we only included the logistic model in this study, which is similar to a Gompertz mortality-associated gamma frailty model [27] and is the most commonly used models including selective disappearance. However, other models (e.g., frailty models with log-normal distribution, [37] compound Poisson distribution [38]) can account for this deceleration, which could better describe the form of the mortality curve at old ages. Moreover, other alternatives than standard models of actuarial senescence have been proposed to describe the shape of the entire survival curve, such as the beta distribution [39]. While these models that have not yet been applied to assess age-specific mortality during the adult stage only could allow getting a reliable description, the lack of a parameter indexing the rate of senescence strongly limits its usefulness to study senescence patterns. As the demographic knowledge of mammalian species is steadily increasing [40] thanks to detailed long-term population studies covering an increasingly wider diversity of species, it is likely that we could find more diverse and complex forms, especially when the number of very old individuals increases or when looking at the mortality of very fast species such as small rodents, which are absent from our dataset (the fastest species from our dataset is Tupaia glis with a life expectancy at adulthood of 3.25 years). Likewise, the diversity of the model structures to describe best the age-specific mortality changes in adult mammals supports that the age at which senescence starts is highly variable [17]. Thus, we encourage researchers to fit consistently bathtub models (as we did here), threshold models [25], or non-parametric models [41], even when the analysis is restricted to adult individuals older than the age at first reproduction. Thus, only 21% of the species included in the analyses supported a simple structure when considering only adult females. Thus, considering only simple models can lead to biased estimates of the senescence rate.
Supplementary Materials
The following are available online at https://www.mdpi.com/1424-2818/12/9/354/s1, Table S1. DIC table associated with each model fitted to the mammalian species
Author Contributions
V.R., J.-F.L. and J.-M.G. designed the study; M.T. provided data; V.R. carried out the statistical analyses; V.R., J.-F.L. and J.-M.G. drafted the manuscript with help from M.T.; All authors have read and agreed to the published version of the manuscript.
Funding
V.R. was supported by grants from the Agence Nationale de la Recherche (ANR-18-CE02-011).
Acknowledgments
We thank D. Conde and F. Colchero for facilitated access to the data. We are also thankful to two anonymous reviewers for useful comments on a previous draft of that work.
Conflicts of Interest
The authors declare no conflict of interest.
Appendix A. Equations of the Mortality Hazard for the Nine Different Mortality Models Fitted Sequentially for Mammal Species (see the Main Text for More Details on the Meaning of Each Parameter)
| Gompertz models |
| Weibull models |
| Logistic models |
Appendix B. Phylogenetic Signal Associated with the Form of Age Dependence during the Senescent Stage and the Model Structure
Figure A1.
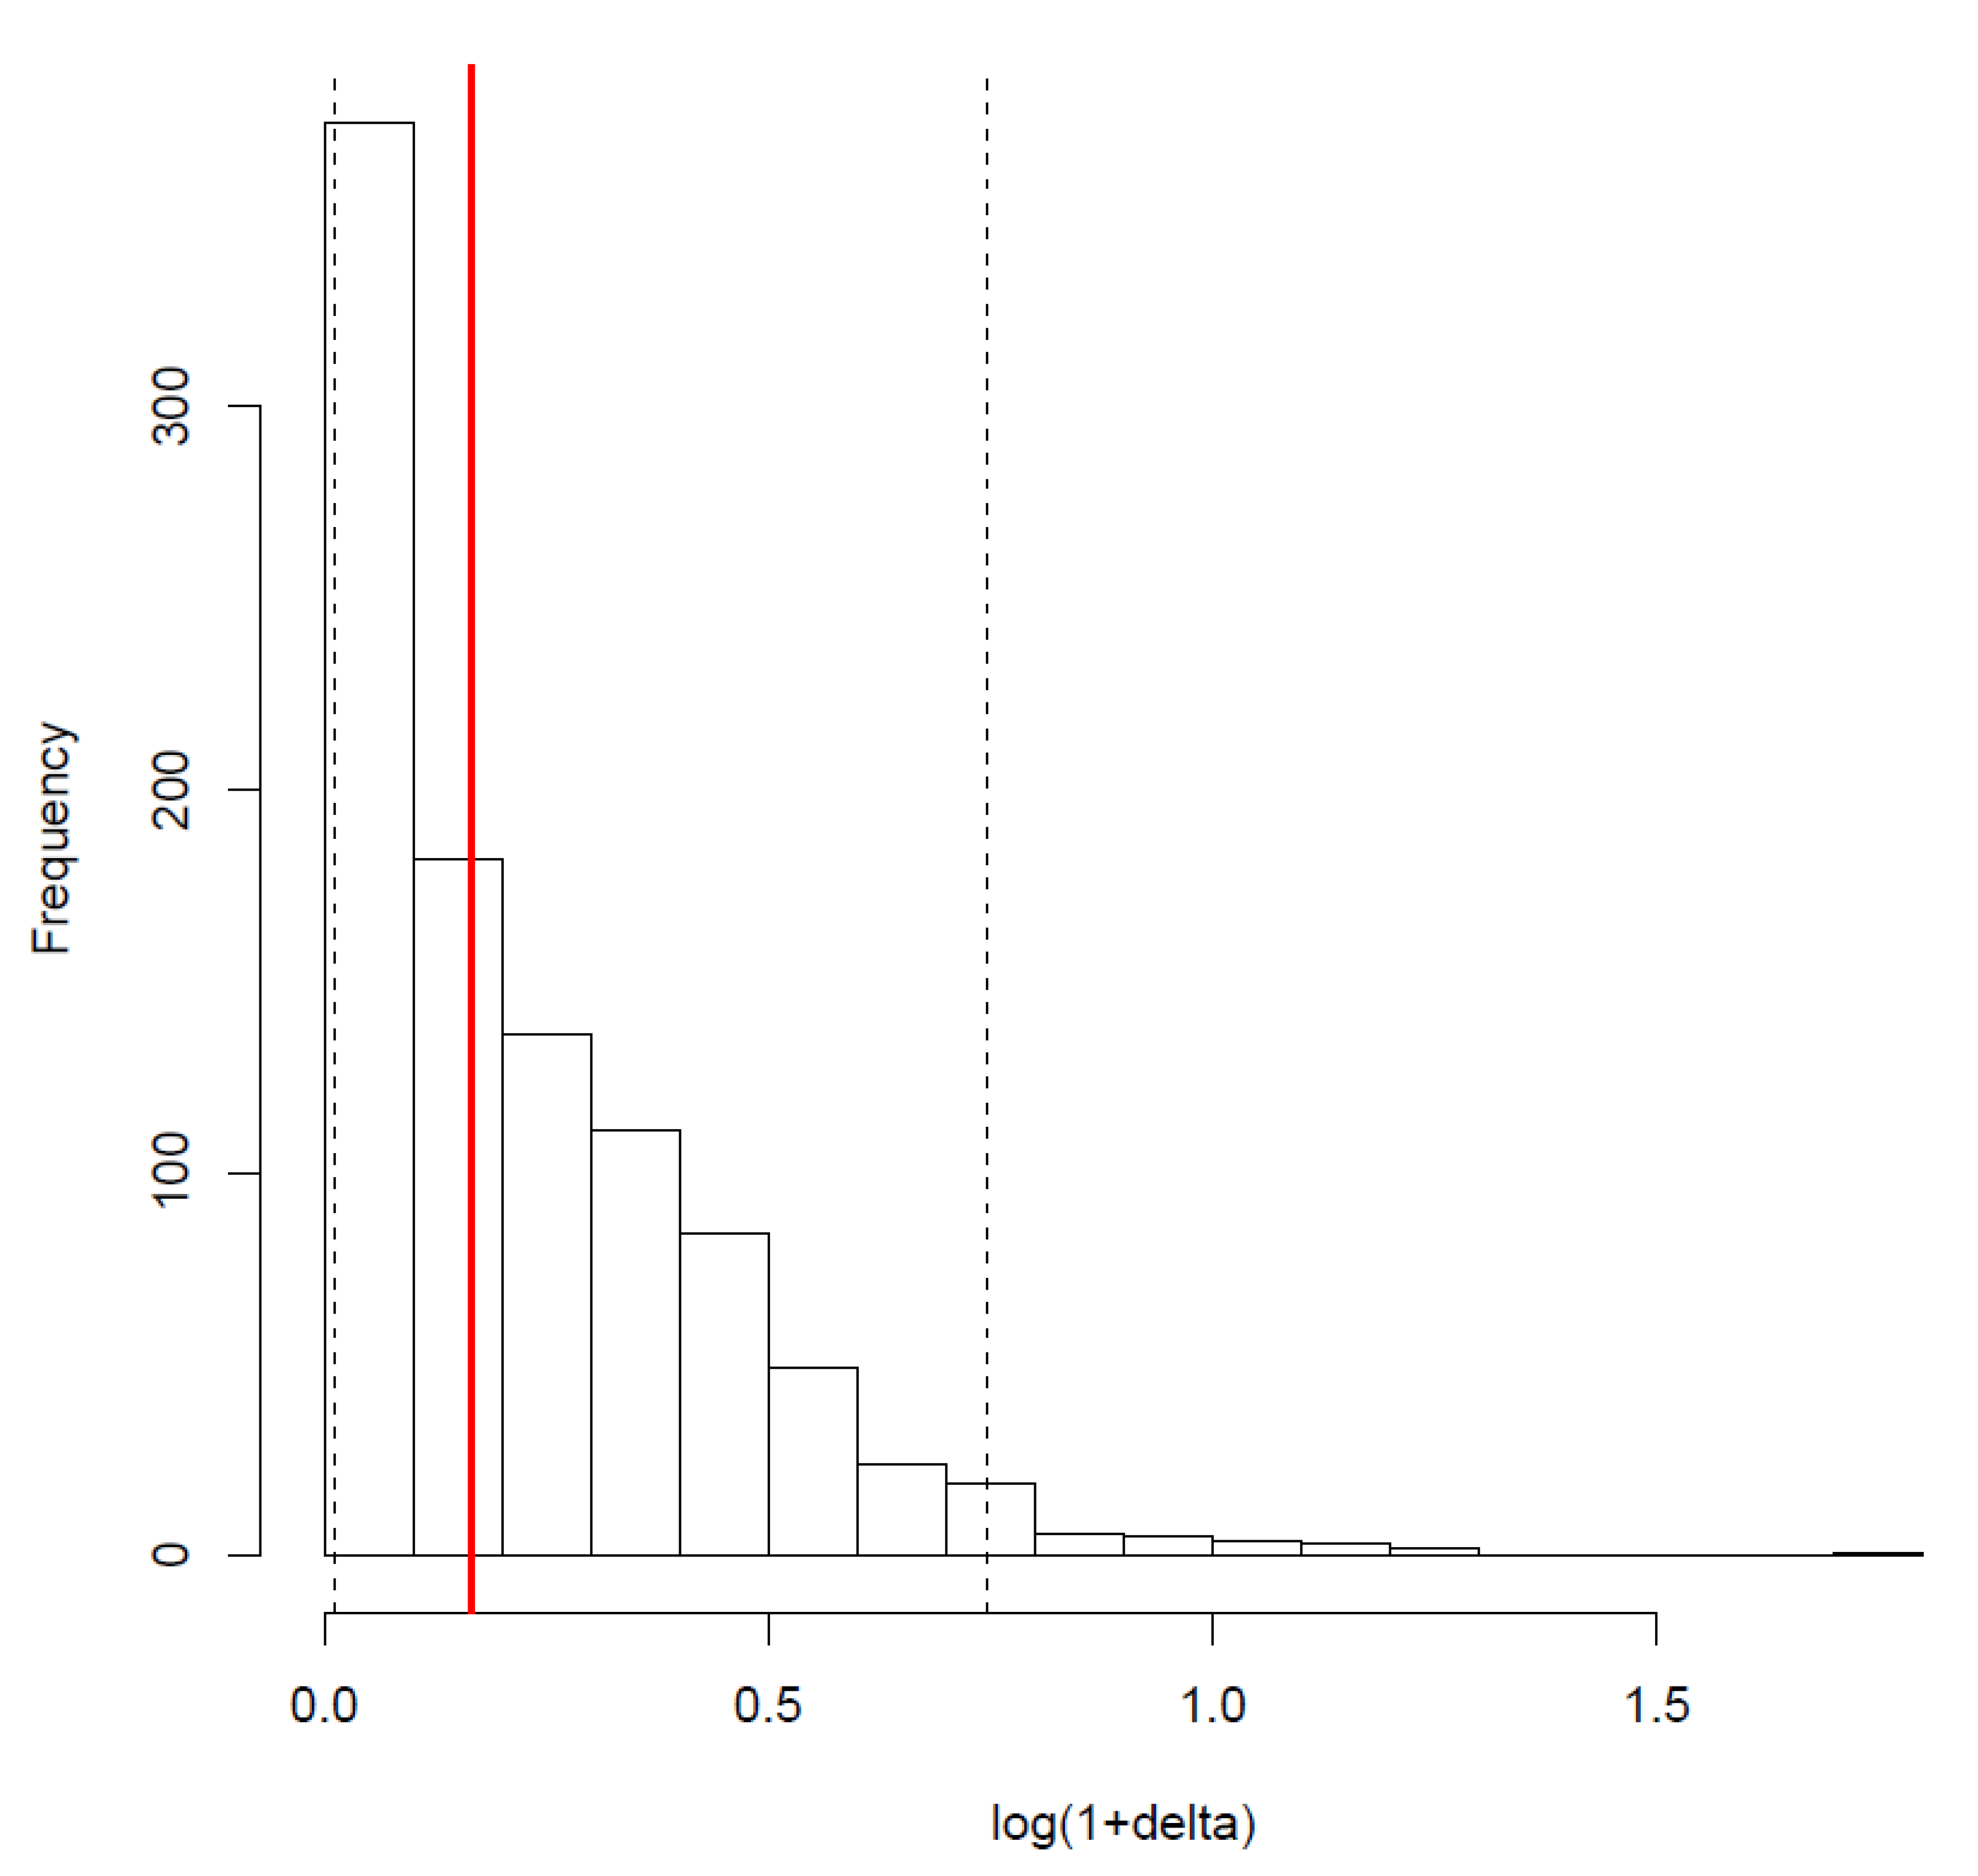
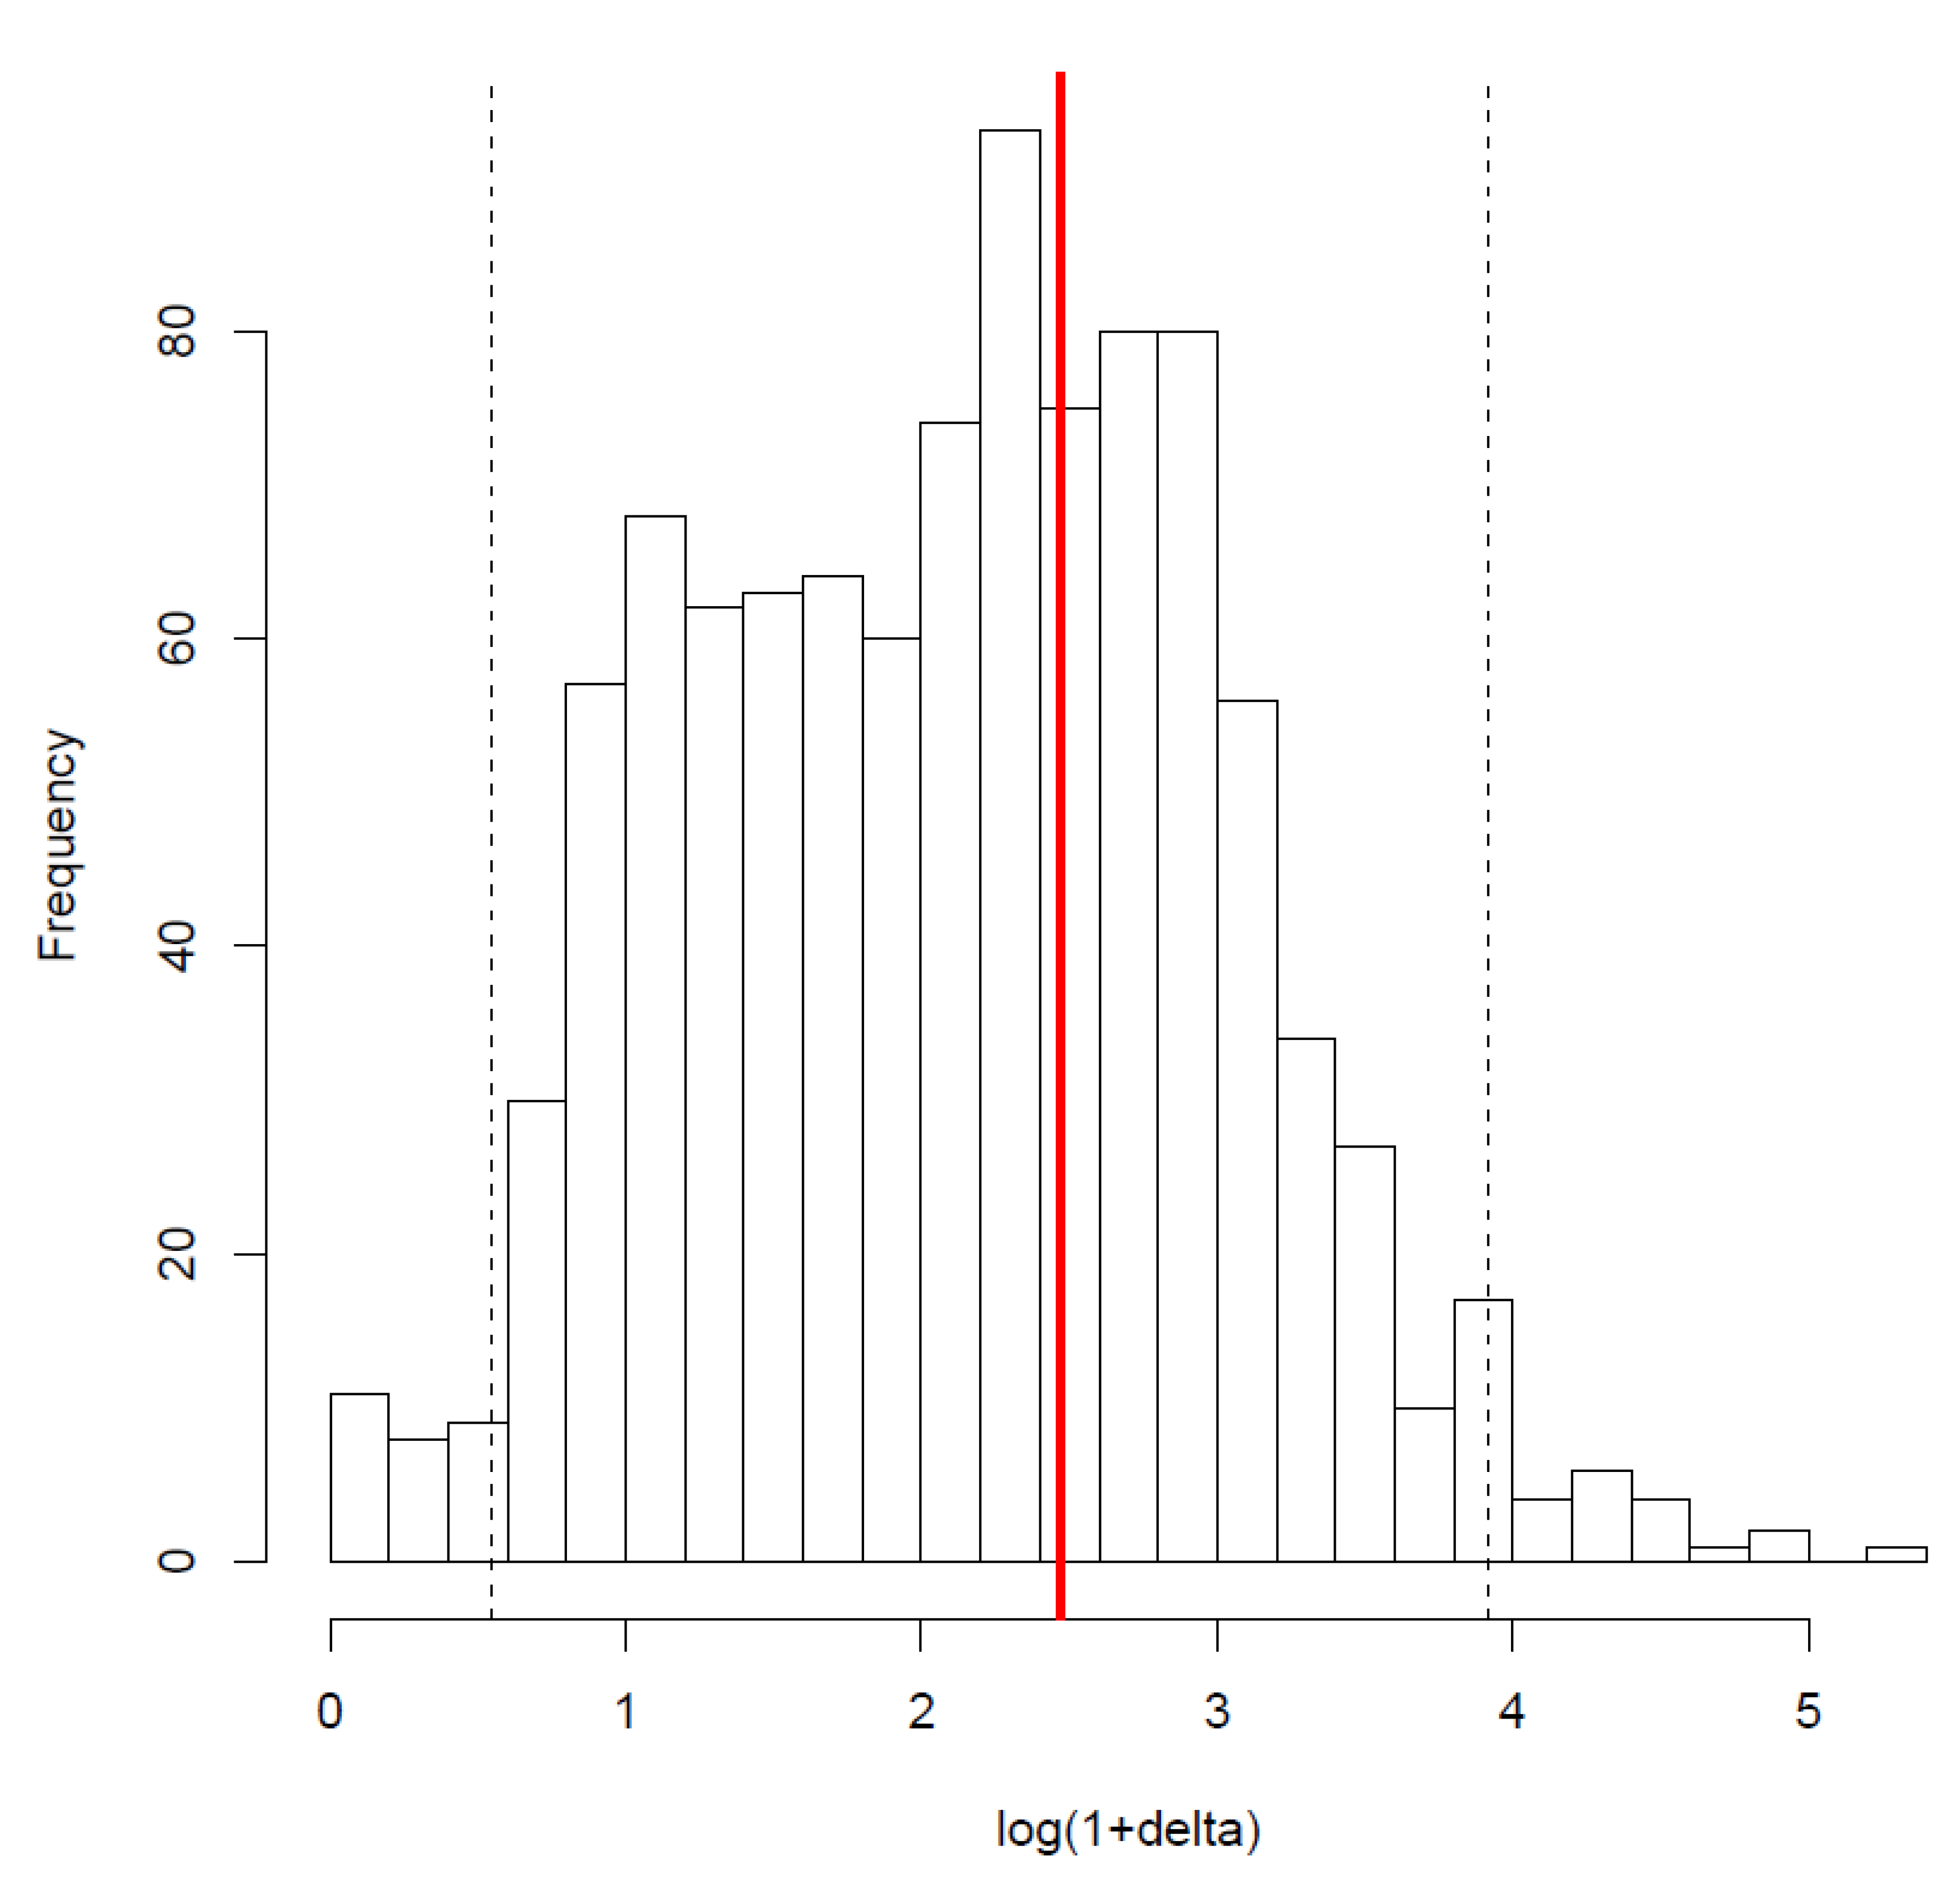
Distribution of the deltas with a random distribution of the model structure. Dotted black lines correspond to the 95% quantiles of the distribution. As the value of the phylogenetic signal found for the structure (red bar) is included in the 95% quantiles, there is no statistically significant phylogenetic signal.
Figure A1.
Distribution of the deltas with a random distribution of the model structure. Dotted black lines correspond to the 95% quantiles of the distribution. As the value of the phylogenetic signal found for the structure (red bar) is included in the 95% quantiles, there is no statistically significant phylogenetic signal.

Figure A2.
Distribution of the deltas with a random distribution of the form of age-dependence during the senescent stage. Dotted black lines correspond to the 95% quantiles of the distribution. As the value of the phylogenetic signal found for the structure (red bar) is included in the 95% quantiles, there is no statistically significant phylogenetic signal.

References
- Gompertz, B., XXIV. On the nature of the function expressive of the law of human mortality, and on a new mode of determining the value of life contingencies. In a letter to Francis Baily, Esq. FRS &c. Philos. Trans. R. Soc. Lond. 1825, 115, 513–583. [Google Scholar] [CrossRef]
- Nussey, D.H.; Froy, H.; Lemaitre, J.-F.; Gaillard, J.-M.; Austad, S.N. Senescence in natural populations of animals: Widespread evidence and its implications for bio-gerontology. Ageing Res. Rev. 2013, 12, 214–225. [Google Scholar] [CrossRef] [PubMed] [Green Version]
- Caughley, G. Mortality Patterns in Mammals. Ecology 1966, 47, 906–918. [Google Scholar] [CrossRef]
- Gimenez, O.; Viallefont, A.; Charmantier, A.; Pradel, R.; Cam, E.; Brown, C.R.; Anderson, M.D.; Brown, M.B.; Covas, R.; Gaillard, J. The Risk of Flawed Inference in Evolutionary Studies When Detectability Is Less than One. Am. Nat. 2008, 172, 441–448. [Google Scholar] [CrossRef] [PubMed] [Green Version]
- Lebreton, J.-D.; Burnham, K.P.; Clobert, J.; Anderson, D.R. Modeling Survival and Testing Biological Hypotheses Using Marked Animals: A Unified Approach with Case Studies. Ecol. Monogr. 1992, 62, 67–118. [Google Scholar] [CrossRef] [Green Version]
- Clutton-Brock, T.; Sheldon, B.C. Individuals and populations: The role of long-term, individual-based studies of animals in ecology and evolutionary biology. Trends Ecol. Evol. 2010, 25, 562–573. [Google Scholar] [CrossRef]
- Choquet, R.; Reboulet, A.-M.; Pradel, R.; Giménez, O.; Lebreton, J.-D. M–SURGE: New software specifically designed for multistate capture–recapture models. Anim. Biodivers. Conserv. 2004, 27, 207–215. [Google Scholar]
- Colchero, F.; Jones, O.R.; Rebke, M. BaSTA: An R package for Bayesian estimation of age-specific survival from incomplete mark–recapture/recovery data with covariates. Methods Ecol. Evol. 2012, 3, 466–470. [Google Scholar] [CrossRef]
- Gaillard, J.-M.; Lemaître, J.-F. An integrative view of senescence in nature. Funct. Ecol. 2020, 34, 4–16. [Google Scholar] [CrossRef] [Green Version]
- Garrott, R.A.; Eberhardt, L.L.; Otton, J.K.; White, P.J.; Chaffee, M.A. A Geochemical Trophic Cascade in Yellowstone’s Geothermal Environments. Ecosystems 2002, 5, 0659–0666. [Google Scholar] [CrossRef]
- Tidière, M.; Gaillard, J.-M.; Berger, V.; Müller, D.W.H.; Bingaman Lackey, L.; Gimenez, O.; Clauss, M.; Lemaître, J.-F. Comparative analyses of longevity and senescence reveal variable survival benefits of living in zoos across mammals. Sci. Rep. 2016, 6, 36361. [Google Scholar] [CrossRef] [PubMed] [Green Version]
- Lahdenperä, M.; Mar, K.U.; Courtiol, A.; Lummaa, V. Differences in age-specific mortality between wild-caught and captive-born Asian elephants. Nat. Commun. 2018, 9, 1–10. [Google Scholar]
- Jones, O.R.; Scheuerlein, A.; Salguero-Gómez, R.; Camarda, C.G.; Schaible, R.; Casper, B.B.; Dahlgren, J.P.; Ehrlén, J.; García, M.B.; Menges, E.S.; et al. Diversity of ageing across the tree of life. Nature 2014, 505, 169–173. [Google Scholar] [CrossRef] [PubMed]
- Gaillard, J.-M.; Lemaître, J.-F. The Williams’ legacy: A critical reappraisal of his nine predictions about the evolution of senescence. Evolution 2017, 71, 2768–2785. [Google Scholar] [CrossRef] [PubMed]
- Arbuthnott, D.; Promislow, D.E.; Moorad, J. Evolutionary theory and aging. In Handbook of Theories of Aging, 3rd ed.; Springer Publishing Company: New York, NY, USA, 2016. [Google Scholar]
- Kirkwood, T.B. Deciphering death: A commentary on Gompertz (1825) ‘On the nature of the function expressive of the law of human mortality, and on a new mode of determining the value of life contingencies’. Philos. Trans. R. Soc. B Biol. Sci. 2015, 370, 20140379. [Google Scholar] [CrossRef] [PubMed] [Green Version]
- Gaillard, J.-M.; Garratt, M.; Lemaître, J.-F. Senescence in mammalian life history traits. Evol. Senescence Tree Life 2017, 126–155. [Google Scholar]
- Siler, W. A Competing-Risk Model for Animal Mortality. Ecology 1979, 60, 750–757. [Google Scholar] [CrossRef]
- Tidière, M.; Gaillard, J.-M.; Müller, D.W.H.; Lackey, L.B.; Gimenez, O.; Clauss, M.; Lemaître, J.-F. Does sexual selection shape sex differences in longevity and senescence patterns across vertebrates? A review and new insights from captive ruminants. Evolution 2015, 69, 3123–3140. [Google Scholar] [CrossRef]
- Lemaître, J.-F.; Ronget, V.; Tidière, M.; Allainé, D.; Berger, V.; Cohas, A.; Colchero, F.; Conde, D.A.; Garratt, M.; Liker, A. Sex differences in adult lifespan and aging rates of mortality across wild mammals. Proc. Natl. Acad. Sci. USA 2020, 117, 8546–8553. [Google Scholar] [CrossRef]
- Pinder, J.E., III; Wiener, J.G.; Smith, M.H. The Weibull distribution: A new method of summarizing survivorship data. Ecology 1978, 59, 175–179. [Google Scholar] [CrossRef]
- Ricklefs, R.E.; Scheuerlein, A. Comparison of aging-related mortality among birds and mammals. Exp. Gerontol. 2001, 36, 845–857. [Google Scholar] [CrossRef]
- Juckett, D.A.; Rosenberg, B. Comparison of the Gompertz and Weibull functions as descriptors for human mortality distributions and their intersections. Mech. Ageing Dev. 1993, 69, 1–31. [Google Scholar] [CrossRef]
- Wilson, D.L. The analysis of survival (mortality) data: Fitting Gompertz, Weibull, and logistic functions. Mech. Ageing Dev. 1994, 74, 15–33. [Google Scholar] [CrossRef]
- Péron, G.; Lemaître, J.-F.; Ronget, V.; Tidière, M.; Gaillard, J.-M. Variation in actuarial senescence does not reflect life span variation across mammals. PLoS Biol. 2019, 17, e3000432. [Google Scholar] [CrossRef] [PubMed] [Green Version]
- Pletcher, S.D. Model fitting and hypothesis testing for age-specific mortality data. J. Evol. Biol. 1999, 12, 430–439. [Google Scholar] [CrossRef]
- Vaupel, J.W.; Yashin, A.I. Heterogeneity’s ruses: Some surprising effects of selection on population dynamics. Am. Stat. 1985, 39, 176–185. [Google Scholar]
- R Core Team. R: A language and environment for statistical computing. In R Foundation for Statistical Computing; R Core Team: Vienna, Austria, 2020; Available online: http://www.R-project.org/ (accessed on 1 July 2020).
- Spiegelhalter, D.J.; Best, N.G.; Carlin, B.P.; Linde, A.V.D. Bayesian measures of model complexity and fit. J. R. Stat. Soc. Ser. B (Stat. Methodol.) 2002, 64, 583–639. [Google Scholar] [CrossRef] [Green Version]
- Borges, R.; Machado, J.P.; Gomes, C.; Rocha, A.P.; Antunes, A. Measuring phylogenetic signal between categorical traits and phylogenies. Bioinformatics 2019, 35, 1862–1869. [Google Scholar] [CrossRef]
- Upham, N.S.; Esselstyn, J.A.; Jetz, W. Inferring the mammal tree: Species-level sets of phylogenies for questions in ecology, evolution, and conservation. PLoS Biol. 2019, 17, e3000494. [Google Scholar] [CrossRef]
- Barbi, E.; Lagona, F.; Marsili, M.; Vaupel, J.W.; Wachter, K.W. The plateau of human mortality: Demography of longevity pioneers. Science 2018, 360, 1459–1461. [Google Scholar] [CrossRef] [Green Version]
- Gaillard, J.-M.; Yoccoz, N.G.; Lebreton, J.-D.; Bonenfant, C.; Devillard, S.; Loison, A.; Pontier, D.; Allaine, D. Generation Time: A Reliable Metric to Measure Life-History Variation among Mammalian Populations. Am. Nat. 2005, 166, 119–123. [Google Scholar] [CrossRef] [PubMed] [Green Version]
- Williams, G.C. Pleiotropy, Natural Selection, and the Evolution of Senescence. Evolution 1957, 11, 398–411. [Google Scholar] [CrossRef]
- Burnham, K.P.; Anderson, D.R. Model Selection and Multimodel Inference: A Practical Information-Theoretic Approach, 2nd ed.; Springer: New York, NY, USA, 2002; ISBN 978-0-387-95364-9. [Google Scholar]
- Hamilton, W.D. The moulding of senescence by natural selection. J. Theor. Biol. 1966, 12, 12–45. [Google Scholar] [CrossRef]
- McGilchrist, C.A.; Aisbett, C.W. Regression with Frailty in Survival Analysis. Biometrics 1991, 47, 461–466. [Google Scholar] [CrossRef] [PubMed]
- Aalen, O.O. Heterogeneity in survival analysis. Stat. Med. 1988, 7, 1121–1137. [Google Scholar] [CrossRef]
- Lynch, H.J.; Fagan, W.F. Survivorship curves and their impact on the estimation of maximum population growth rates. Ecology 2009, 90, 1116–1124. [Google Scholar] [CrossRef] [PubMed]
- Conde, D.A.; Staerk, J.; Colchero, F.; da Silva, R.; Schöley, J.; Baden, H.M.; Jouvet, L.; Fa, J.E.; Syed, H.; Jongejans, E. Data gaps and opportunities for comparative and conservation biology. Proc. Natl. Acad. Sci. USA 2019, 116, 9658–9664. [Google Scholar] [CrossRef] [Green Version]
- Jones, O.R.; Gaillard, J.-M.; Tuljapurkar, S.; Alho, J.S.; Armitage, K.B.; Becker, P.H.; Bize, P.; Brommer, J.; Charmantier, A.; Charpentier, M.; et al. Senescence rates are determined by ranking on the fast–slow life-history continuum. Ecol. Lett. 2008, 11, 664–673. [Google Scholar] [CrossRef]
Figure 1.
Plot of the three standard models used to describe age-dependent changes of mortality throughout the adult stage. (a) Hazard of mortality as a function of age from a Gompertz model, in (d), the log of the hazard of mortality increases linearly with age. (b) Hazard of mortality as a function of age from a Weibull model, in (e), the log of the hazard of mortality increases linearly with the log of age. (c) Hazard of mortality as a function of age from a logistic model, in (f), the logistic model is close to a Gompertz model at early adult ages (dashed line), but the rate of increase gradually decelerates with increasing adult age.

Figure 2.
Phylogenetic tree representing the diversity of structure and form of actuarial senescence across 61 species of mammals.
Figure 2.
Phylogenetic tree representing the diversity of structure and form of actuarial senescence across 61 species of mammals.


Table 1.
AIC (Akaike Information criterion) rankings for the multinomial logistic models associated with (a) the form of the mortality curve during the senescent phase and (b) the structure of the mortality model. The model selected is presented in bold. ‘*’ means interactive effect between the two factors involved.
| (a) Form of the Senescent Phase | |||
|---|---|---|---|
| Model | k | AIC | ΔAIC |
| Log(E) + Log(N) | 3 | 84.9497 | 0 |
| NULL | 1 | 85.1474 | 0.1977 |
| Log(E) | 2 | 85.2748 | 0.3251 |
| Log(N) | 2 | 86.0621 | 1.1124 |
| Log(E) * Log(N) | 4 | 87.2107 | 2.2610 |
| (b) Structure of the Model | |||
| Model | k | AIC | ΔAIC |
| NULL | 1 | 129.6015 | 0 |
| Log(E) | 2 | 130.9753 | 1.3738 |
| Log(N) | 2 | 131.0201 | 1.4186 |
| Log(E) + Log(N) | 3 | 132.1048 | 2.5033 |
| Log(E) * Log(N) | 4 | 135.4106 | 5.8091 |
© 2020 by the authors. Licensee MDPI, Basel, Switzerland. This article is an open access article distributed under the terms and conditions of the Creative Commons Attribution (CC BY) license (http://creativecommons.org/licenses/by/4.0/).
Share and Cite
MDPI and ACS Style
Ronget, V.; Lemaître, J.-F.; Tidière, M.; Gaillard, J.-M. Assessing the Diversity of the Form of Age-Specific Changes in Adult Mortality from Captive Mammalian Populations. Diversity 2020, 12, 354. https://doi.org/10.3390/d12090354
AMA Style
Ronget V, Lemaître J-F, Tidière M, Gaillard J-M. Assessing the Diversity of the Form of Age-Specific Changes in Adult Mortality from Captive Mammalian Populations. Diversity. 2020; 12(9):354. https://doi.org/10.3390/d12090354
Chicago/Turabian StyleRonget, Victor, Jean-François Lemaître, Morgane Tidière, and Jean-Michel Gaillard. 2020. "Assessing the Diversity of the Form of Age-Specific Changes in Adult Mortality from Captive Mammalian Populations" Diversity 12, no. 9: 354. https://doi.org/10.3390/d12090354
Note that from the first issue of 2016, this journal uses article numbers instead of page numbers. See further details here.