the Creative Commons Attribution 4.0 License.
the Creative Commons Attribution 4.0 License.
 | 15 Sep 2020
Century-scale wood nitrogen isotope trajectories from an oak savanna with variable fire frequencies
Daniel Griffin
Sarah E. Hobbie
Ian M. Howard
David M. Nelson
Peter B. Reich
Kendra K. McLauchlan
Fire frequency exerts a fundamental control on productivity and nutrient cycling in savanna ecosystems. Individual fires often increase short-term nitrogen (N) availability to plants, but repeated burning causes ecosystem N losses and can ultimately decrease soil organic matter and N availability. However, these effects remain poorly understood due to limited long-term biogeochemical data. Here, we evaluate how fire frequency and changing vegetation composition influenced wood stable N isotopes (δ15N) across space and time at one of the longest running prescribed burn experiments in the world (established in 1964). We developed multiple δ15N records across a burn frequency gradient from precisely dated Quercus macrocarpa tree rings in an oak savanna at Cedar Creek Ecosystem Science Reserve, Minnesota, USA. Sixteen trees were sampled across four treatment stands that varied with respect to the temporal onset of burning and burn frequency but were consistent in overstory species representation, soil characteristics, and topography. Burn frequency ranged from an unburned control stand to a high-fire-frequency stand that had burned in 4 of every 5 years during the past 55 years. Because N stocks and net N mineralization rates are currently lowest in frequently burned stands, we hypothesized that wood δ15N trajectories would decline through time in all burned stands, but at a rate proportional to the fire frequency. We found that wood δ15N records within each stand were remarkably coherent in their mean state and trend through time. A gradual decline in wood δ15N occurred in the mid-20th century in the no-, low-, and medium-fire stands, whereas there was no trend in the high-fire stand. The decline in the three stands did not systematically coincide with the onset of prescribed burning. Thus, we found limited evidence for variation in wood δ15N that could be attributed directly to long-term fire frequency in this prescribed burn experiment in temperate oak savanna. Our wood δ15N results may instead reflect decadal-scale changes in vegetation composition and abundance due to early- to mid-20th-century fire suppression.


Fire is a fundamental control of species composition, diversity, and nutrient cycling in savanna ecosystems. Fire affects N pools and cycling in a myriad of ways that vary spatially and temporally (Pellegrini et al., 2015). On timescales of days to years, fire often enhances N availability to plants – possibly due to direct ash deposition or increases in microbial mineralization (Wilson et al., 2002; Boring et al., 2004). Furthermore, the loss of plant biomass during fire reduces plant N uptake, thereby increasing inorganic N pools (Ficken and Wright, 2017). In the long term (decades to centuries), fire may reduce ecosystem N stocks due to elevated N volatilization and leaching losses, as well as diminished plant biomass (Raison, 1979; Ojima et al., 1994; Reich et al., 2001). Changes in vegetation composition may also influence the trajectory of soil N biogeochemistry, as the production of plant litter with a low N concentration can slow decomposition and net N mineralization, reducing the N supply and inorganic N pools (Ojima et al., 1994; Dijkstra et al., 2006). However, uncertainty remains regarding the multiyear to multi-decadal effects of fire on N cycling in savanna ecosystems, because there is a paucity of long-term records of N cycling from areas with different fire-return intervals (Reich et al., 2001; Coetsee et al., 2008).
In the absence of long-term baseline biogeochemical data, the ratio of 15N to 14N (i.e., δ15N) in wood from trees can provide a proxy of N pools and cycling that extends decades or centuries into the past (Gerhart and McLauchlan, 2014). Plant δ15N can be a useful metric of plant N availability, defined as the soil N supply relative to the plant demand for N (Craine et al., 2015). When N availability is high, N is cycled and lost primarily as inorganic N, and relatively high rates of processes such as nitrification, nitrate leaching, ammonia volatilization, and denitrification lead to increased δ15N values of remaining N pools (Craine et al., 2015; van der Sleen et al., 2017). When N availability is low, reduced N losses result in lower δ15N values of remaining N pools. In addition, plants are more likely to receive N from mycorrhizal fungi than from direct uptake from inorganic N pools; mycorrhizal fungi are known to provide N with relatively low δ15N values to plants (Hobbie and Högberg, 2012). Prior studies have used natural-abundance measurements of wood δ15N to better understand the consequences of natural and human-induced disturbance to the N cycle, such as changes in N cycling due to fire (Beghin et al., 2011; Kranabetter and Meeds, 2017), tree clearing (Bukata and Kyser, 2005; Hietz et al., 2010), and changing management practices (Howard and McLauchlan, 2015). These studies demonstrate the ability of tree ring δ15N values to capture the role of disturbance and land use change in altering N cycling at local scales.
The demonstrated effects of fire on N cycling (Pellegrini et al., 2015) and the ability of wood δ15N to capture variation in N cycling suggest that long-term wood δ15N records can provide insight into the past effects of fire on N cycling. However, few studies have focused on the wood δ15N response to fire; thus, the relative importance of fire-related processes that affect wood δ15N remain poorly understood. On the one hand, increased N volatilization and the combustion of surface soils that typically have relatively low δ15N values are expected to increase plant δ15N values after fire events (Högberg, 1997). On the other hand, by reducing N stocks and rates of cycling, frequent fire might reduce non-fire N losses (e.g., via leaching, denitrification, and/or ammonia volatilization) and, therefore, decrease plant δ15N values. The net effect of these opposing impacts of fire on δ15N values likely depends on the degree to which fire leads to isotopic fractionation associated with combustion processes versus N loss pathways (Fig. 1). For example, the incomplete combustion of plant biomass can cause volatilization of NH3, thereby increasing δ15N in the remaining pool (Pellegrini et al., 2014). Strong isotopic fractionations associated with gaseous loss pathways can lead to N pools with relatively high δ15N values (Houlton et al., 2006), and nitrification followed by leaching of nitrate can also cause higher δ15N values of the remaining N (Gerhart and McLauchlan, 2014). Therefore, fire-induced “tightening” of the N cycle through reductions in non-fire N losses might only alter plant δ15N values if gaseous losses are high in the unburned ecosystem. Beghin et al. 2011 observed increases in wood δ15N in the 5 years after a large fire, which is consistent with isotopic fractionation effects during combustion, but 6–10 years after fire δ15N values returned to pre-disturbance levels. Field studies show both increases and decreases in soil δ15N in days to decades after fire, underlining the importance of post-disturbance processes that shape ecosystem δ15N (Grogan et al., 2000; Aranibar et al., 2003; Perakis et al., 2015).
In this study, we use one of the longest running savanna burn experiments worldwide to evaluate how frequent fire influenced wood δ15N as an indicator of effects on N availability across space and time. The experiment is located at Cedar Creek Ecosystem Science Reserve (CCESR), a Long Term Ecological Research (LTER) site in eastern Minnesota, USA, where 55 years of prescribed fire have been linked to substantial declines in N stocks, net N mineralization rates, and litter N cycling in frequently burned stands (Reich et al., 2001). We examined wood δ15N patterns across four oak woodland/forest and savanna plots that were similar in overstory species representation, soil characteristics, and topography in an ongoing long-term controlled burn experiment at CCESR. We hypothesized that the mean and trajectory of wood δ15N values would be coherent (i.e., vary simultaneously) across treatment stands before the onset of prescribed fire, whereupon wood δ15N values would decrease thereafter in burned plots at rates proportional to the frequency of prescribed fire.
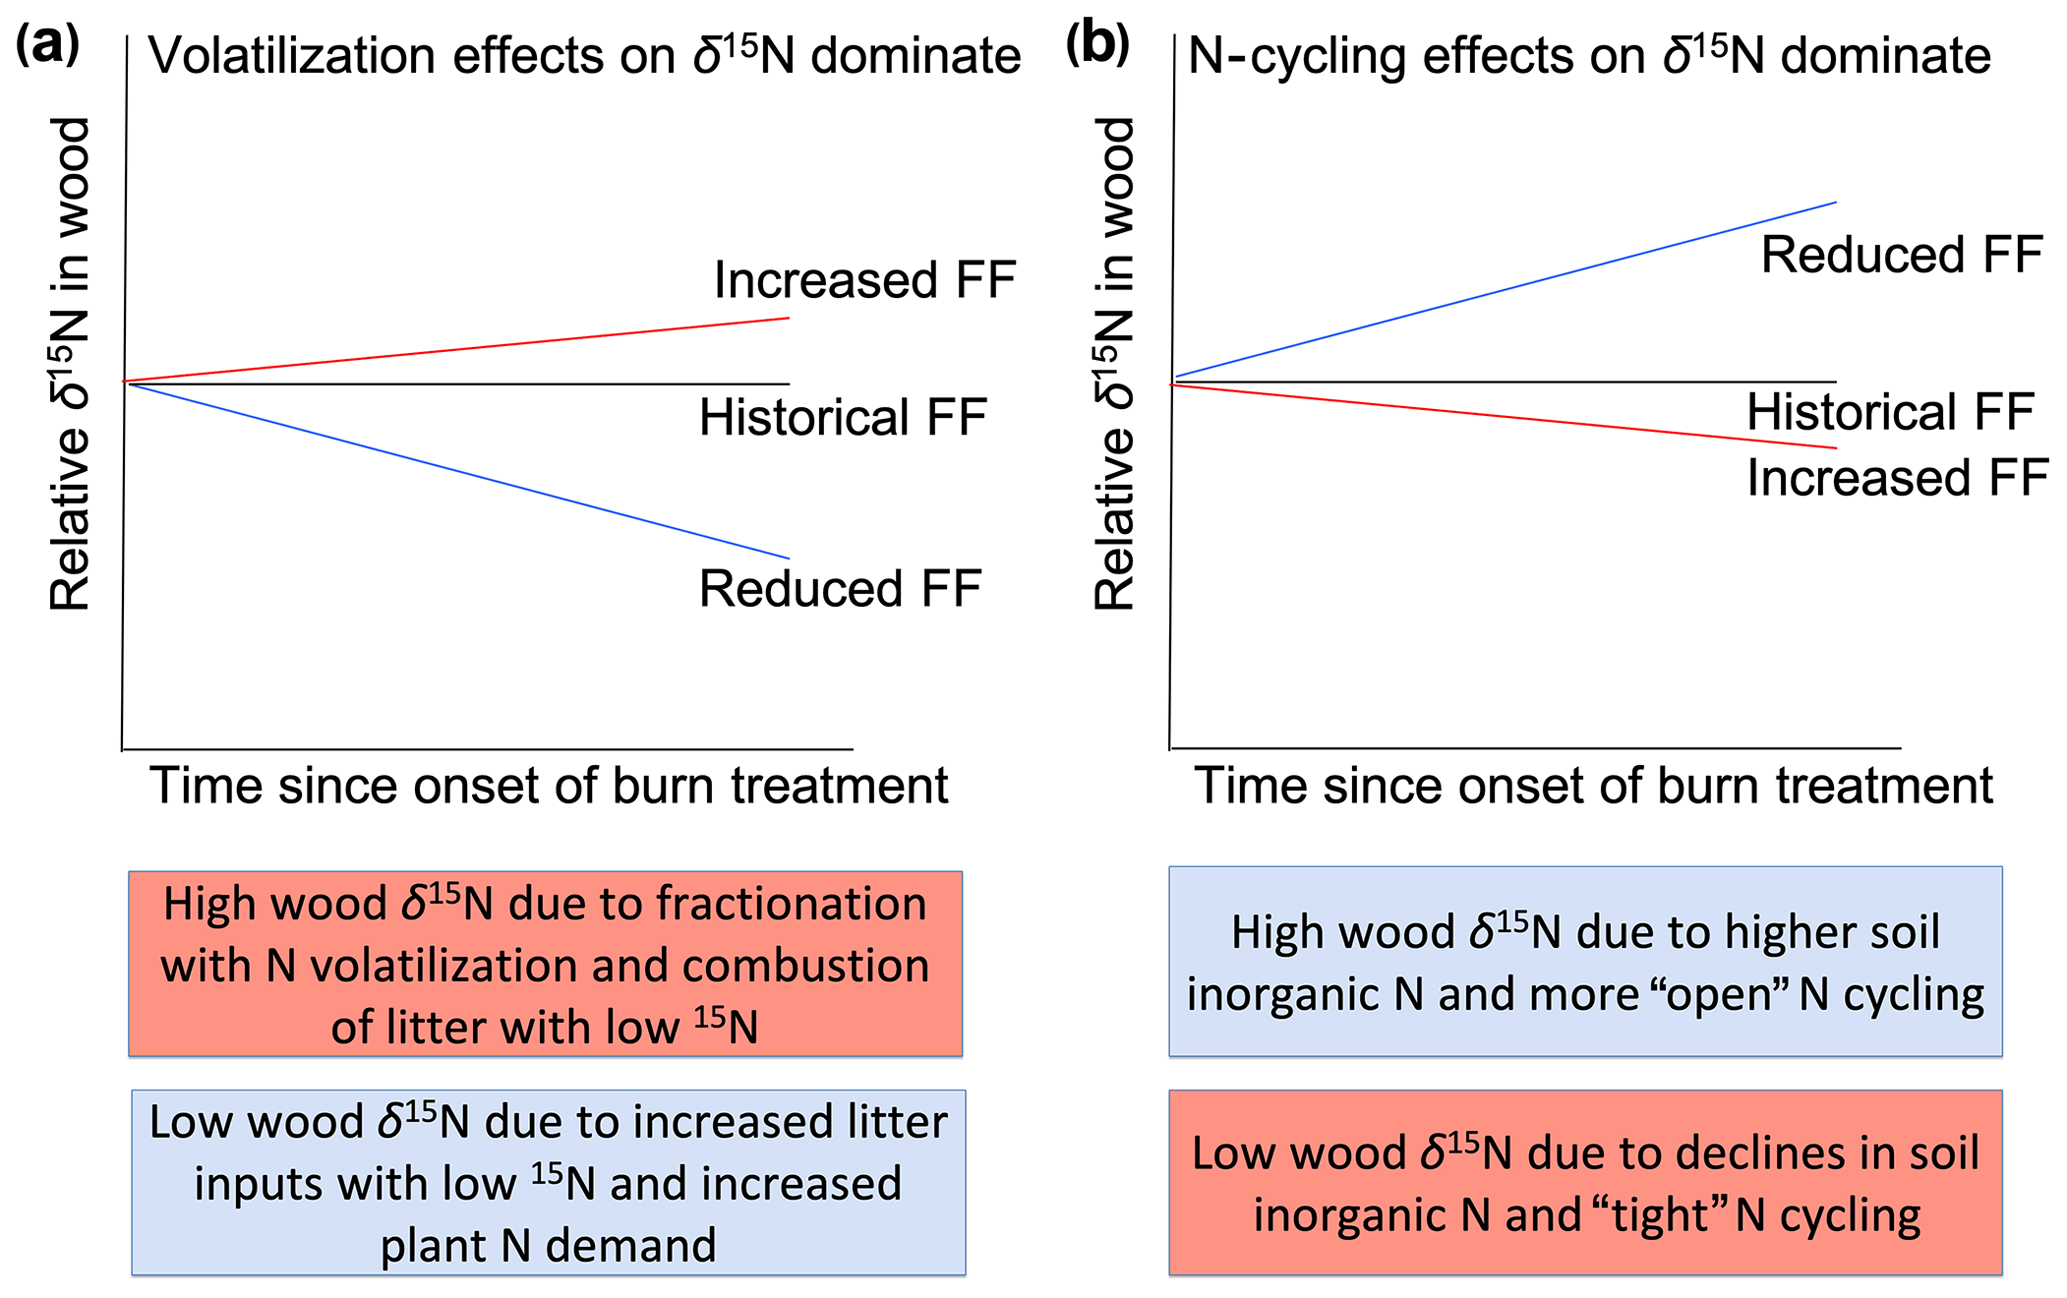
Figure 1Hypothesized effects of fire experimentation on wood δ15N values relative to the historical fire frequency (FF). Increased FF would lead to higher relative wood δ15N values if combustion and isotopic fractionation with N volatilization dominate (a). In contrast, increased FF would lead to lower relative wood δ15N values if N-cycling effects such as reduced N stocks and non-fire N losses dominate the trajectory of wood δ15N values (b). Colored boxes indicate potential contrasting effects of fire frequency on wood δ15N values. Pink and blue boxes indicate processes resulting from higher and lower FF, respectively.
2.1 Study site
CCESR in eastern Minnesota is located within the continental-scale ecotone between the northern Great Plains prairie, the eastern deciduous woodlands, and the southwestern extent of the northern mixed conifer forests. Many upland and lowland plant communities exist at CCESR. Of particular interest is the oak savanna, which was once an important ecosystem at the prairie–forest border (Nuzzo, 1986) but now survives as a relatively rare component of the post-European-settlement landscape. The oak savanna terrain has low relief with sandy, excessively drained, N-poor soils (Udipsamments, Grigal et al., 1974; Tilman, 1984). Throughout our wood nitrogen isotope record spanning from 1902 to 2017, the mean annual temperature was 4.8 ∘C and the mean annual precipitation was 72 cm. Wet plus dry atmospheric N deposition inputs at CCESR are ∼4–10 kg N ha−1 yr−1 NADP, 2018. Annual inputs have marginally increased and inputs have marginally decreased between 1997 and 2017. Combined, total N deposition inputs at CCESR have largely remained stable since data collection began in 1984. Fire suppression was the management practice within the reserve from at least 1938 to 1964; however, this area burned periodically before and after Euro-American settlement in the late 19th century (Leys et al., 2019).
The burn experiment at the oak savannas of CCESR was established in 1964 to preserve vegetation communities and to investigate ecosystem response to fire treatment (Peterson and Reich, 2001; Reich et al., 2001). A total of 19 units of 2.4 to 30 ha were each assigned a burn frequency treatment, ranging from fire exclusion to a 4 out of 5 year burn frequency (Fig. 2). Prescribed burns typically occurred in April or May, and fires were of low intensity. Although systematic vegetation inventories were not conducted prior to the onset of prescribed burning, a series of historical aerial photographs are available for our study area between the years 1938 and 2016 (McAuliffe et al., 2017; MHAPO, 2019). Our qualitative interpretation of these photographs indicates that the savanna vegetation prior to fire treatment at CCESR consisted of mixed woodland and grass communities (Fig. 2). Over time, oak tree vegetation – predominantly bur oak, Quercus macrocarpa, and northern pin oak, Quercus ellipsoidalis – increasingly dominated fire-excluded stands, while C4 grasses and sedges increased in abundance in frequently burned stands (Peterson and Reich, 2001; Dijkstra et al., 2006). The cumulative effects of direct fire-induced N losses and indirect fire-induced shifts in vegetation composition since 1964 have caused the vegetation and soil characteristics of these burn stands to diverge dramatically (Fig. 3). Unburned stands are characterized by high oak dominance, increased woody plant biomass (including mesic taxa such as Acer), and high rates of soil N cycling and productivity, whereas frequently burned stands show high grass dominance, scattered bur and northern pin oak, and low rates of N cycling and productivity (Reich et al., 2001). We selected four stands for this study to span the gradient of fire frequency (from unburned to burned every 4 in 5 years) and the temporal onset of the fire experiment.

Figure 2Historical aerial imagery for 1938 (a) and 2016 (b) for the savanna burn experiment, and the locations of the 16 trees analyzed for wood δ15N at 1:50 000. Polygons illustrate roads at CCESR. Panels (c)–(f) illustrate stand-level differences in canopy openness from 1938 to 2016 across the four fire treatments at a scale of 1:5000. Imagery from Minnesota historical aerial photographs online (MHAPO, 2019).
2.2 Sample collection
Increment cores were collected within ∼1 m of the root collar from 16 Q. macrocarpa trees at CCESR in March 2018 with a 5.15 mm diameter Haglöf borer. Q. macrocarpa was the only tree sampled for wood N isotope analysis, because it is the dominant overstory species (in age and frequency) of the savanna where the burn experiment is located. Sampling a single species also allowed us to control for potential species effects on wood δ15N. Trees spanned four stands in the fire frequency experiment: a no-fire stand (control), a low fire-intensity stand burned every 1 in 10 years (BU113), a medium fire-intensity stand burned every 1 in 3 years (BU115), and a high fire-intensity stand burned every 4 in 5 years (BU104). The onset of burning in the fire treatment stands was 1968, 1992, and 1965, respectively. Prior to that, fire episodes in a nearby stand had a median return interval of 15 years between 1822 and 1924, followed by a period of localized suppression (Leys et al., 2019). Broad soil characteristics were similar across sampled stands. Trees in the low-fire stand grew on Sartell fine sand mapped in soil surveys with 0 %–6 % slopes, and trees in no-, medium-, and high-fire stands grew on Sartell fine sand mapped in soil surveys with 6 %–15 % slopes. In the localized vicinity of the trees sampled across these sites, slopes rarely exceeded 8 %. The Sartell series consists of excessively drained soils that are rapidly permeable and have low available N, low organic matter content, and low available water capacity (Grigal et al., 1974). The upper 15 cm of Sartell fine sand has a pH of 5.3, 0.025 % total nitrogen (18 µmol g−1 dry soil), and ∼0.3 % organic matter (Grigal et al., 1974; Tilman, 1984).
Following sampling, the cores were stored in paper straws and dried at 65 ∘C. After drying, each core was surfaced using a core microtome, visually cross-dated (Stokes and Smiley, 1996), and measured with micrometry. The pith was within 25 rings in 13 out of 16 samples. The mean series length was 157 years, with the oldest tree containing 252 rings and the youngest containing 109 rings (Table 1). Mean ring width from 1902 to 2017 across all N cores was 1.11 mm. Cores for δ15N analysis were cut into 10 mg samples using a razor blade along annual ring boundaries. Samples on average contained 1.35 years of wood; 70 % of samples contained only 1 year, and 95 % of samples contained 1 or 2 years. Although wood samples were partitioned at an annual resolution, we did not analyze all wood samples for δ15N due to cost and time constraints. Rather, we selected two wood samples per decade for δ15N measurement. The decision to forego annual resolution and analyze our data at supra-annual timescales also aimed to mitigate the known phenomenon of inter-ring mobility of N-containing compounds that could smooth out inter-annual variation in δ15N (Hart and Classen, 2003; McLauchlan et al., 2017). N translocation has long been recognized as an issue in interpreting wood δ15N. We did not perform chemical pretreatment on wood samples, as no pretreatment protocols have been widely shown to remove labile N in wood (Sheppard and Thompson, 2000; Bunn et al., 2017).
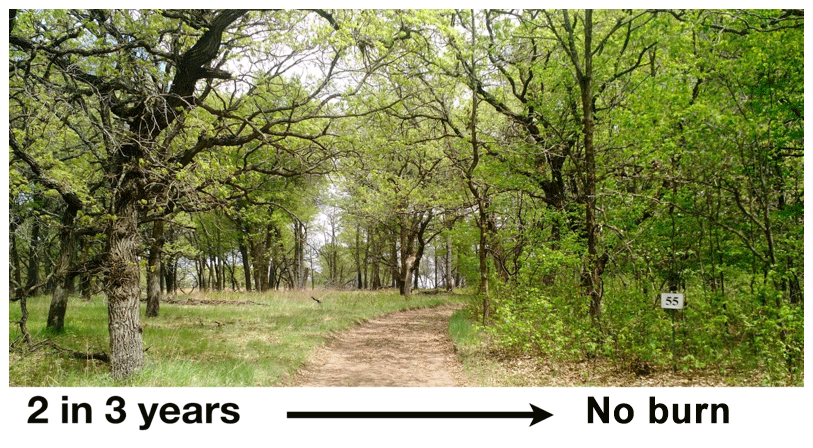
Figure 3The Cedar Creek Ecosystem Science Reserve burn experiment. The difference in vegetation between unburned and frequently burned treatment stands is clearly shown. On the left, a frequently burned stand is characterized by increased canopy openness and higher grass dominance. On the right, an unburned control stand is characterized by dense undergrowth and high oak dominance. Photo credit: Peter Reich.
Wood samples were analyzed for δ15N and wood % N at the Central Appalachians Stable Isotope Facility (CASIF) of the University of Maryland Center for Environmental Science. Samples were combusted in a Carlo Erba NC2500 elemental analyzer (CE Instruments). Carbosorb and MgClO4 were used to absorb CO2 and H2O, respectively, prior to the introduction of N2 to a Thermo Fisher Delta V Plus isotope ratio mass spectrometer for δ15N analysis. The δ15N data were normalized to the AIR scale using a two-point normalization curve with internal standards calibrated against USGS40 and USGS41. Analytical precision for δ15N of an internal wood standard analyzed along with samples was 0.3 %. A mass series of an atropine standard was used to calculate % N. In total, 367 wood samples were analyzed for δ15N and % N across 16 trees. Samples correspond to the second and seventh calendar year in each decade and temporal coverage spans from 1902 to 2017.
Table 1List of the trees sampled, ring counts, first sample year for δ15N, number of δ15N samples, fire median return, and the first year of prescribed burning. Ring count is the total number of years for each core and does not represent specific tree age, as pith was not present for all cores. Trees in age class 1 contain <129 rings, trees in age class 2 contain 130–159 rings, trees in age class 3 contain 160–189 rings, and trees in age class 4 contain >190 rings.
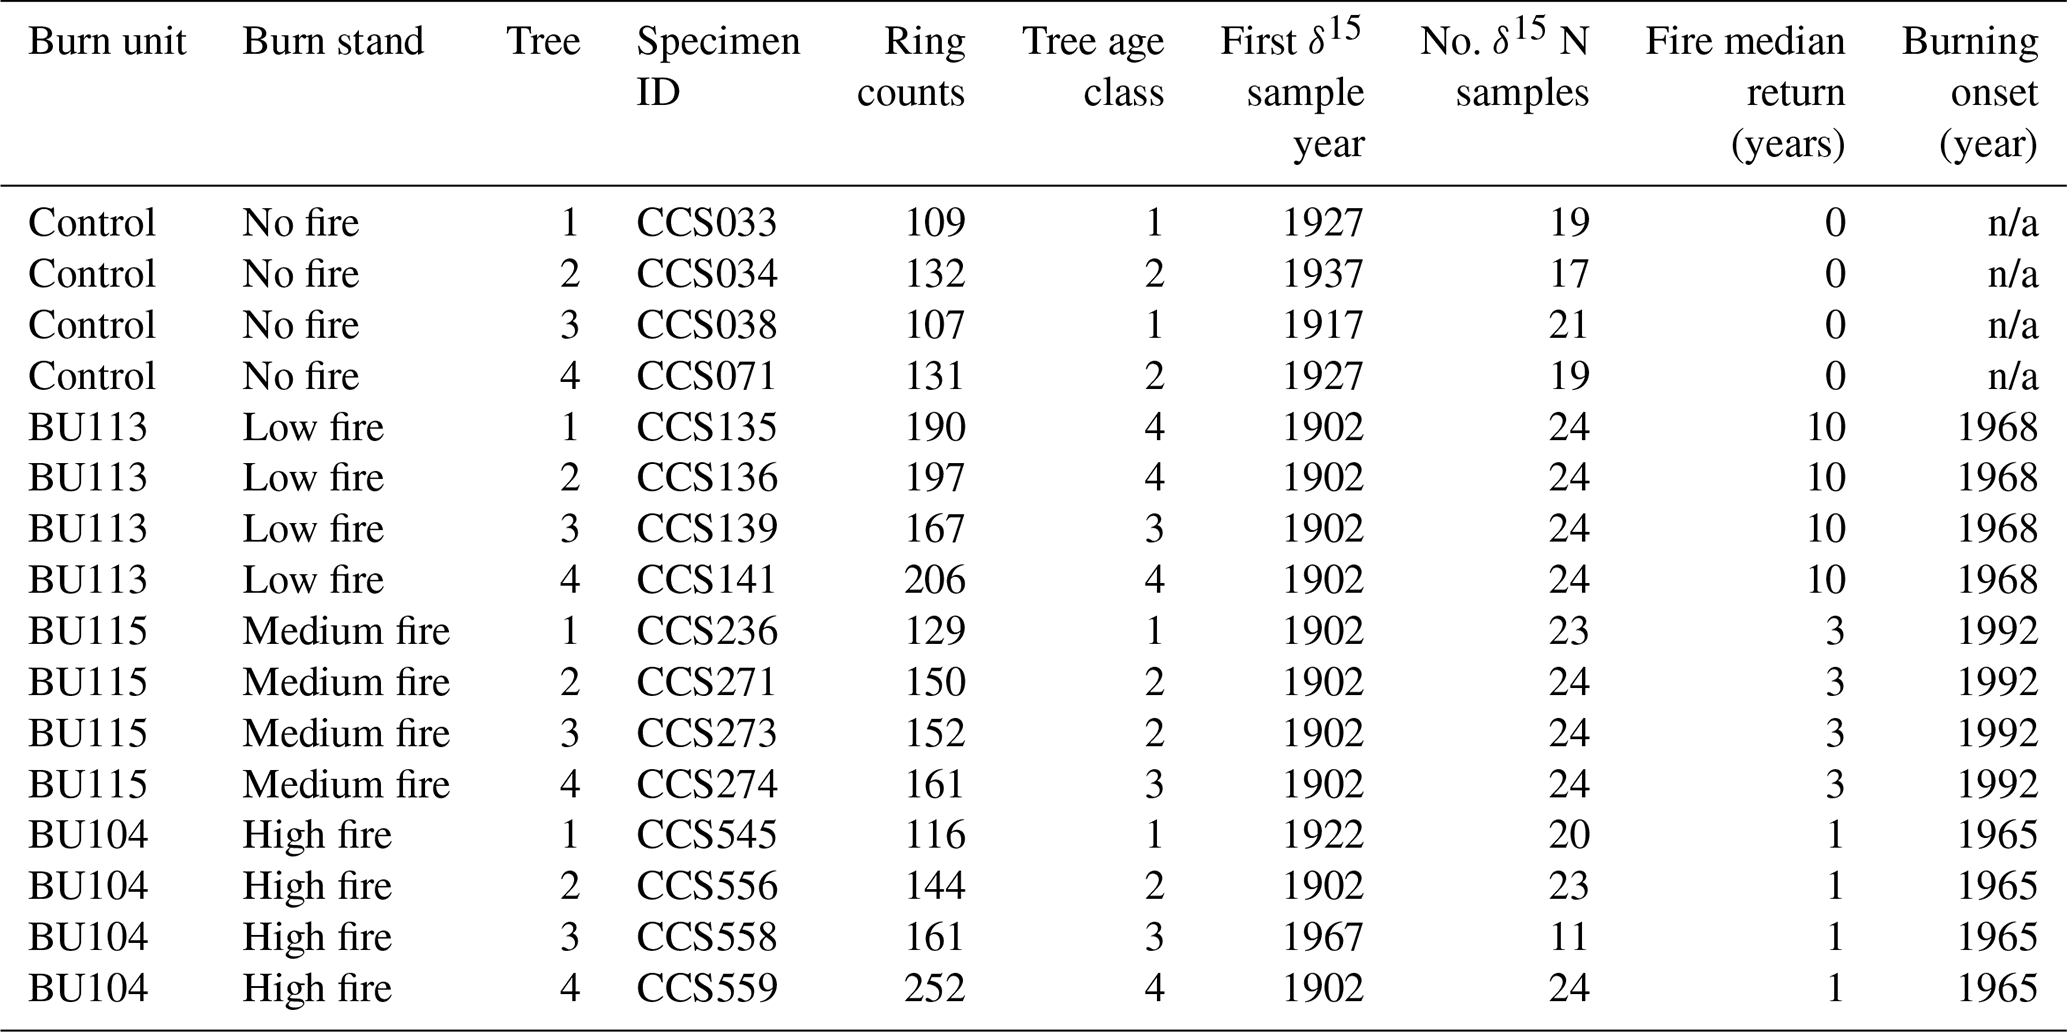
n/a: not applicable.
2.3 Statistical analysis
Beyond understanding essential differences in mean δ15N values across burn stands, a primary goal was to understand whether varying fire treatment frequency and temporal onset of fire affected the mean and long-term trajectory of δ15N values. We used several statistical methods to assess time series patterns of wood δ15N and N cycling across the CCESR burn experiment. Although many studies standardize wood δ15N values for each core with respect to that core mean (McLauchlan et al., 2007, 2017), we chose not to do so in order to maintain patterns that might otherwise be obscured with detrending or standardization techniques. Differences in wood δ15N across burn treatment stands and individual trees were tested using a Kruskal–Wallis test, a nonparametric test to identify significant differences on a continuous dependent variable by a categorical independent variable. To test for evidence of long-term trends in δ15N, we used simple linear regression and a nonparametric Mann–Kendall trend test (MK test). The MK test looks for evidence of a monotonic trend in a time series and is robust to non-normally distributed data. For linear regression and the MK test, trends were deemed significant for p<0.05. In addition, we conducted regime-shift detection analysis on δ15N values by burn stand to statistically identify changes in the mean state of δ15N following the method of Rodionov 2004. This method applies sequential t tests to time series data to statistically identify shifts in the mean state (Rodionov, 2004). Significant shifts in mean δ15N were identified using a two-tailed Student t test, and the α=0.01 threshold was used. A 6-year (one-quarter series) cutoff length was used to allow flexibility in detecting mean shifts. The Huber's weight parameter was set to one, and red noise was not estimated.
Table 2Estimated slope coefficient based on linear regression (m), p value based on linear regression, and Kendall’s Tau based on the Mann–Kendall test (MK test). The MK test looks for evidence of a monotonic trend in a time series and is robust to non-normally distributed data. In the Kendall's Tau column, the * symbols indicate the following: * p<0.05, p<0.01, and p<0.0001. NS stands for not significant. Trees in age class 1 contain <129 rings, trees in age class 2 contain 130–159 rings, trees in age class 3 contain 160–189 rings, and trees in age class 4 contain >190 rings.

Table 3Mean wood δ15N (%) by year in each burn unit. Mean values * indicate years with only one δ15N sample in that year and burn unit.
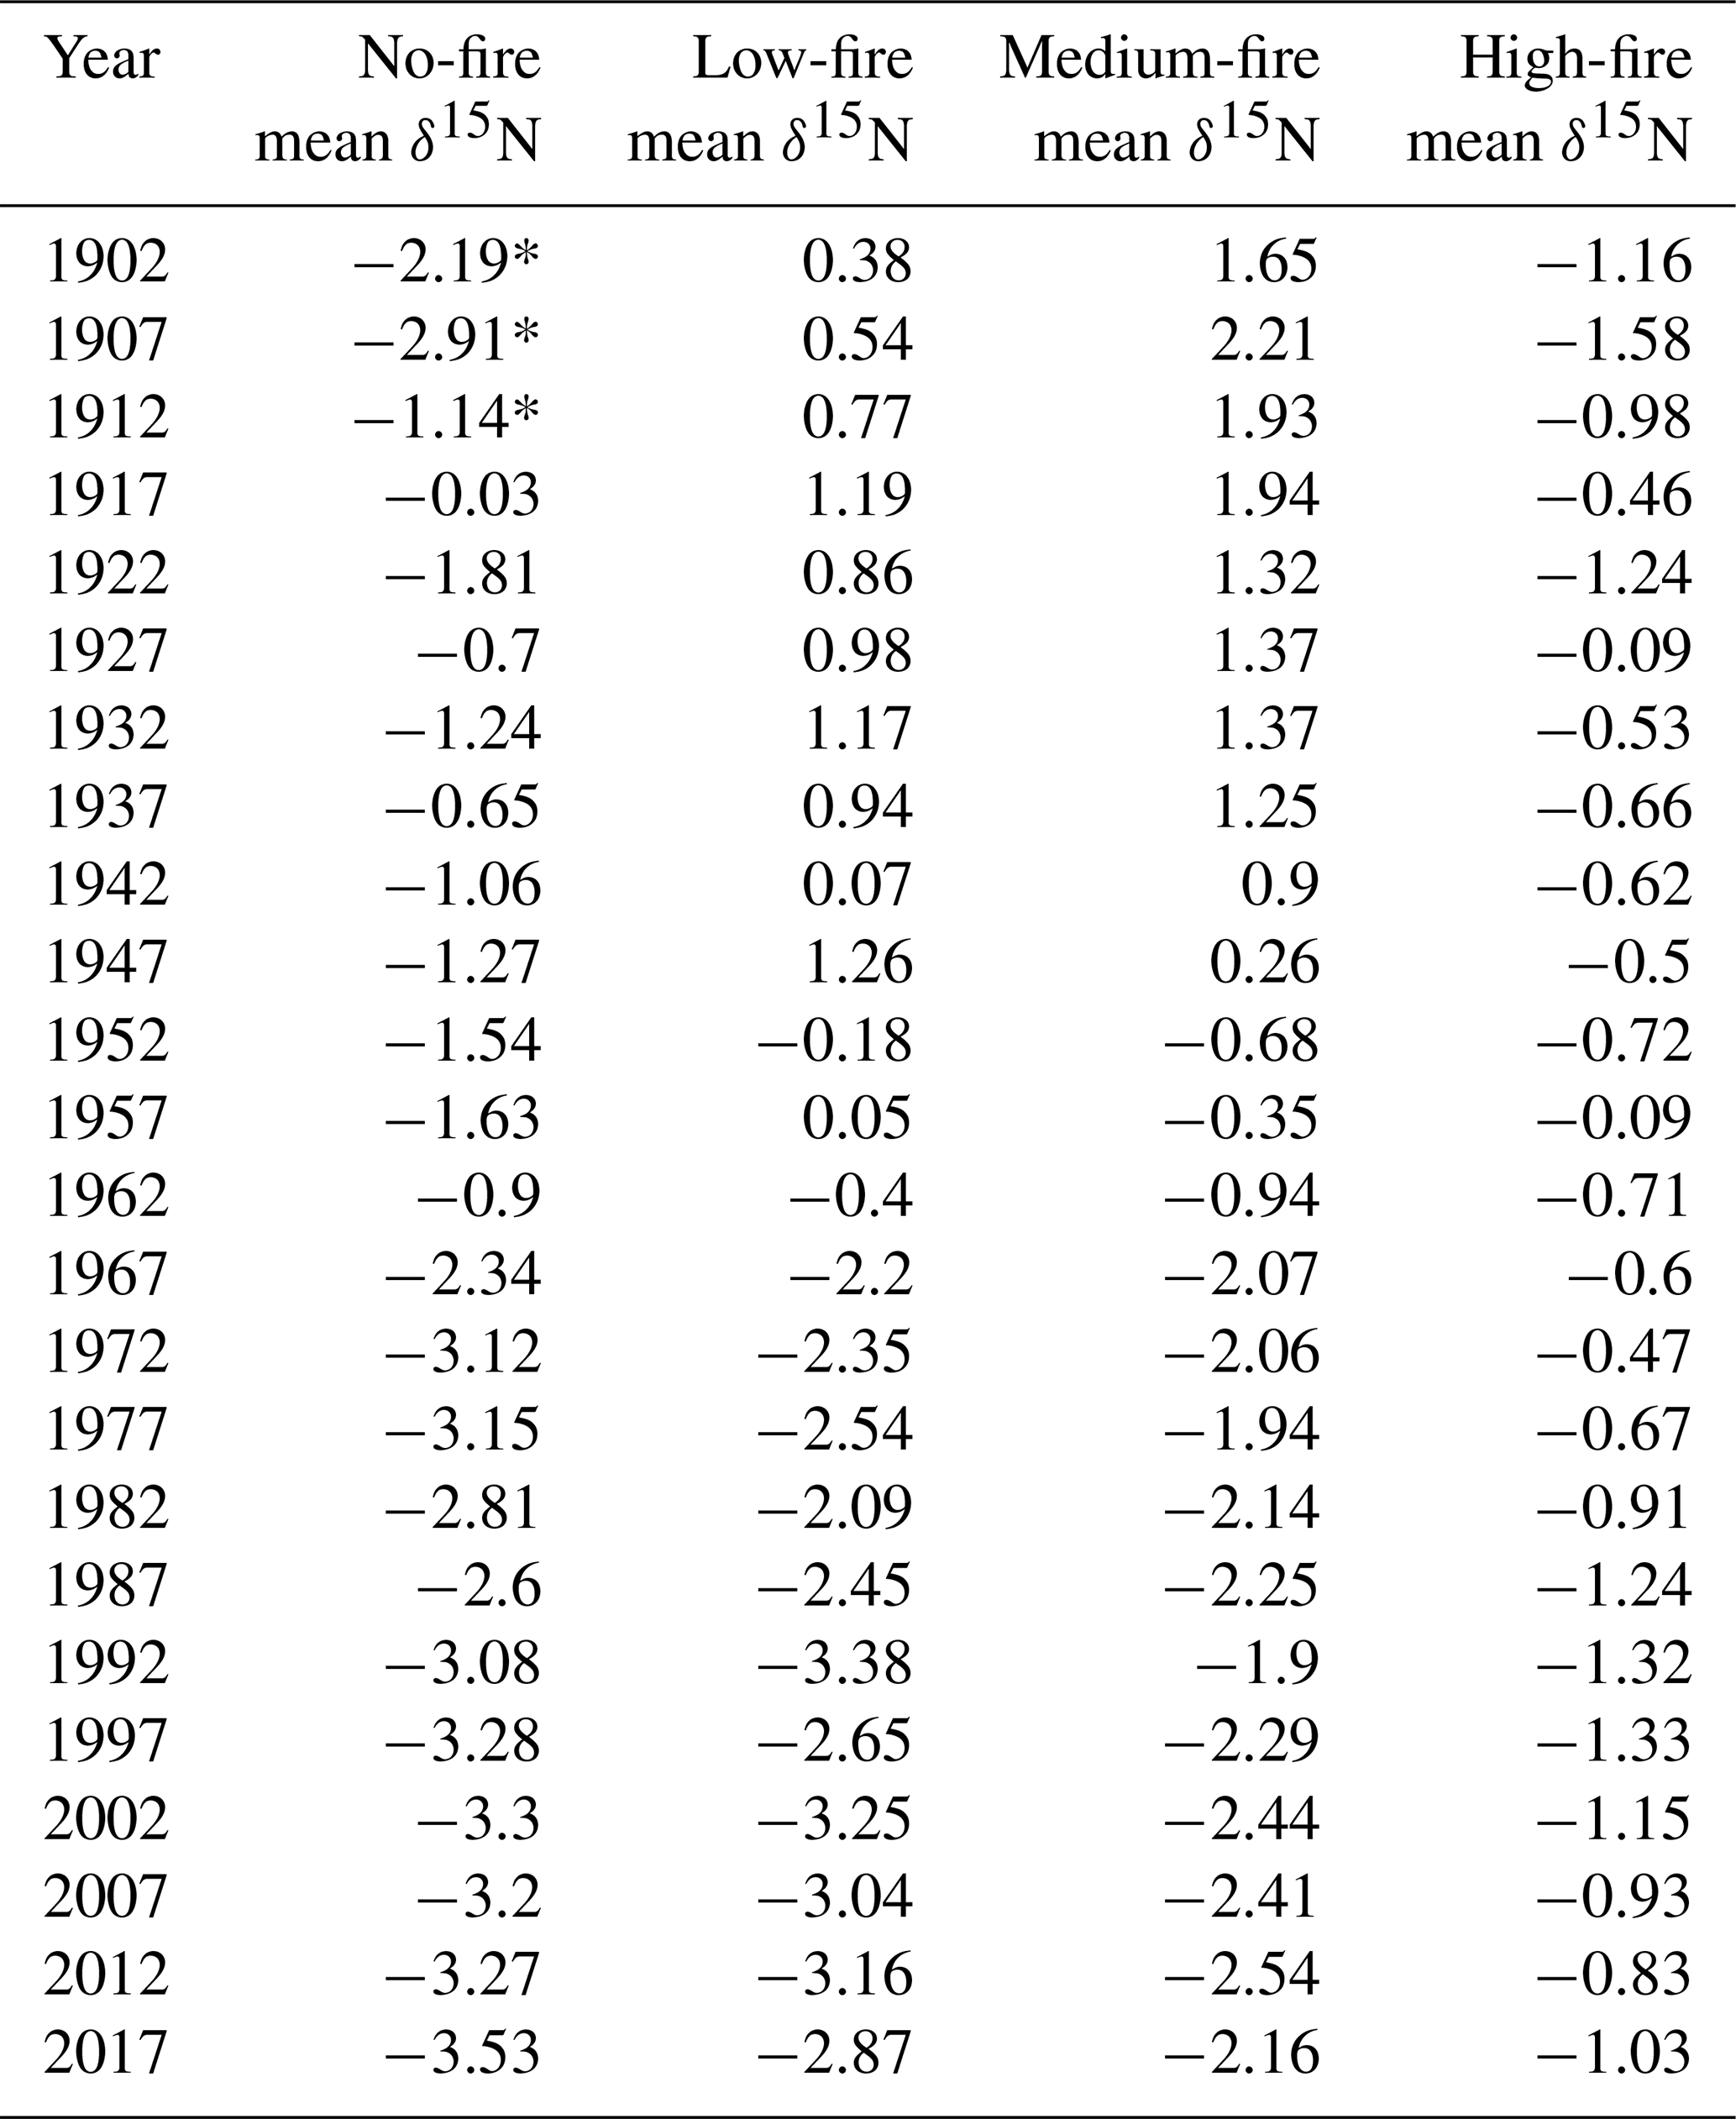
To test whether wood δ15N values were broadly similar before fire and diverged after fire, we first examined spatial differences in δ15N. In the first decade of the 20th century, wood δ15N values varied among stands (p=0.023). Average wood δ15N values in 1902 ranged from −2.2 % to 1.7 % among stands (Table 3). A Kruskal–Wallis test of wood δ15N across the time series for the four stands revealed that δ15N was significantly different among stands (p<0.001). We used the nonparametric Games–Howell test for post hoc analysis due to unequal variances and group sizes between burn treatment stands. The Games–Howell test revealed that δ15N in the no-fire stand was lower than all other stands (p<0.001). In contrast, the Games–Howell test revealed nonsignificant differences in δ15N between the low- and medium-fire stands (p=0.385), low- and high-stands (p=0.944), and medium- and high-fire stands (p=0.441). Wood δ15N was also significantly different between stands prior to the onset of the prescribed burn experiment in 1964 (p<0.001). Wood δ15N differences among individual trees were small within each stand; only tree CCS545 in the high-fire stand was significantly different from the other three trees in that stand (p<0.001). Two approaches revealed that tree age likely did not have an effect on the mean or trend of δ15N. First, we compared wood δ15N with tree biological age rather than Gregorian calendar year using inner ring dates to estimate tree age. Tree age and δ15N were negatively correlated (; p<0.001); however, this negative relationship may be expected given the negative temporal trends in δ15N in the majority of trees. Additionally, we tested for an age effect on wood δ15N by dividing trees into four age classes based on ring counts (Tables 1, 2). A Kruskal–Wallis test of wood δ15N across age classes revealed that tree age did not have a significant effect on the mean ranks of δ15N (p=0.242).
Over time and in aggregate, wood δ15N values have declined at CCESR since approximately 1967, although specific trajectories varied by fire frequency (Fig. 4, Table 2). Negative trends in wood δ15N were evident in 12 out of 16 trees sampled, 11 of which were in the no-fire, low-fire, and medium-fire stands. Declines in wood δ15N occurred in the mid-20th century in these stands, beginning primarily between 1940 and 1965. In contrast, there was little evidence of declining wood δ15N in the high-fire stand, where δ15N values were relatively stable over time. Results from the regime-shift analysis were consistent with the trend tests; shifts in the mean state of δ15N were detected in the no-fire, low-fire, and medium-fire frequency stands (p<0.01), whereas there was not a δ15N shift in the high-fire stand at the α=0.01 significance level (Fig. 5).
In the no-fire stand, three out of four sampled trees had significantly declining trends in wood δ15N to present based on simple linear regression (p<0.0001) and the MK test (p<0.01; Fig. 4a). Although the wood δ15N trend for tree CCS034 was not significant, this tree had a negative δ15N slope that matched the overall negative trend in this stand. Regime-shift analysis detected one mean shift in the 1960s, reflecting a stable mean of higher wood δ15N between 1902 and 1962 followed by a stable mean of lower wood δ15N from 1967 to 2017. Wood δ15N in this stand had a maximum of 1.8 %, a minimum of −4.7 %, and a standard deviation of 1.3 %.
In the low-fire stand, all four trees demonstrated significant declines in wood δ15N towards present based on the two trend tests (p<0.0001; Fig. 4b). Regime-shift analysis identified one mean wood δ15N shift in the 1960s, separating a stable mean of higher wood δ15N between 1902 and 1962 and lower mean δ15N from 1967 to 2017. Fire treatment in this stand began in 1968 and with a 1 in 10-year fire median return, and this stand has burned five times throughout the experiment. The wood δ15N values ranged from 2.8 % to −4.1 % with a standard deviation of 1.9 %. There was tight coherence between individual cores during the period from 1942 to 1962, including a steep decline in all four cores between samples 1962 and 1967. While this steep single increment decline bracketed the beginning of the burn experiment in 1964, prescribed fire had not yet occurred in this stand.
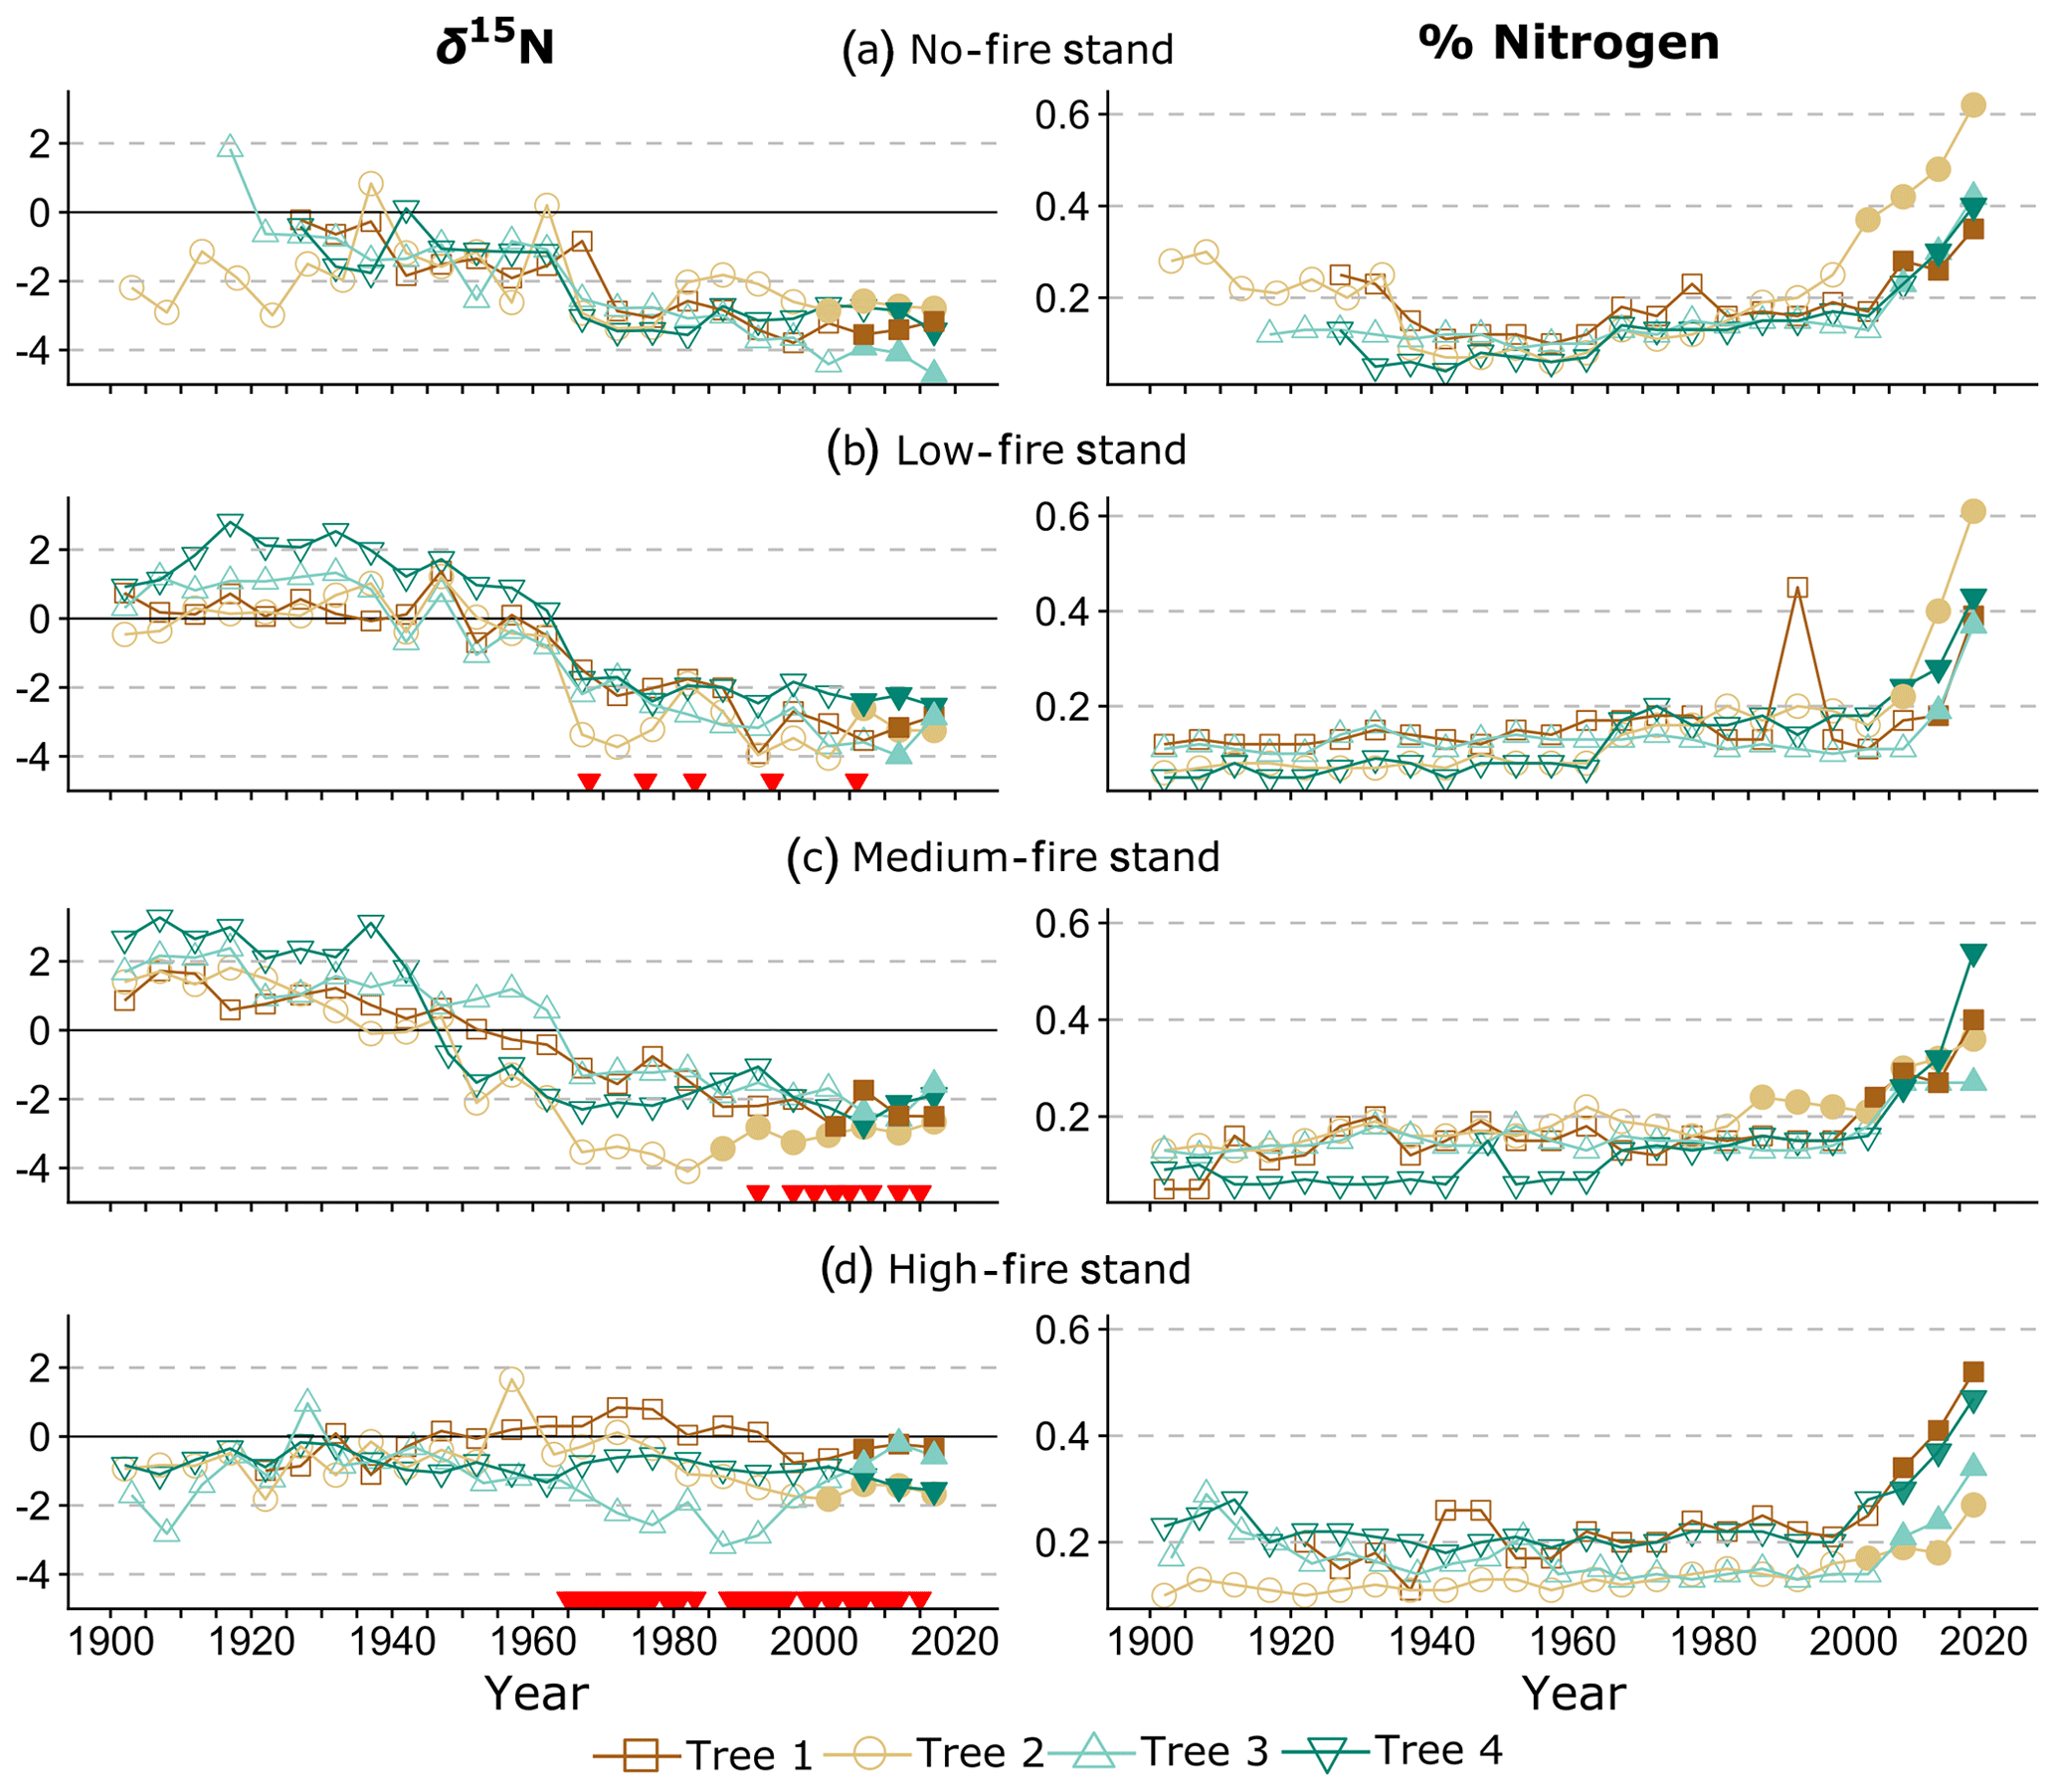
Figure 4Wood δ15N (left) and % N (right) data over time. Lines connect data for individual trees within each stand. Shapes and colors correspond to trees 1–4 in each stand (Table 1). On the left, red triangles indicate individual years of prescribed fire in each treatment stand. Filled shapes indicate wood sampled after the heartwood–sapwood transition. Wood % N increased in all trees over the last 115 years, with the sharpest increases after the heartwood–sapwood transition (average transition year 2004).
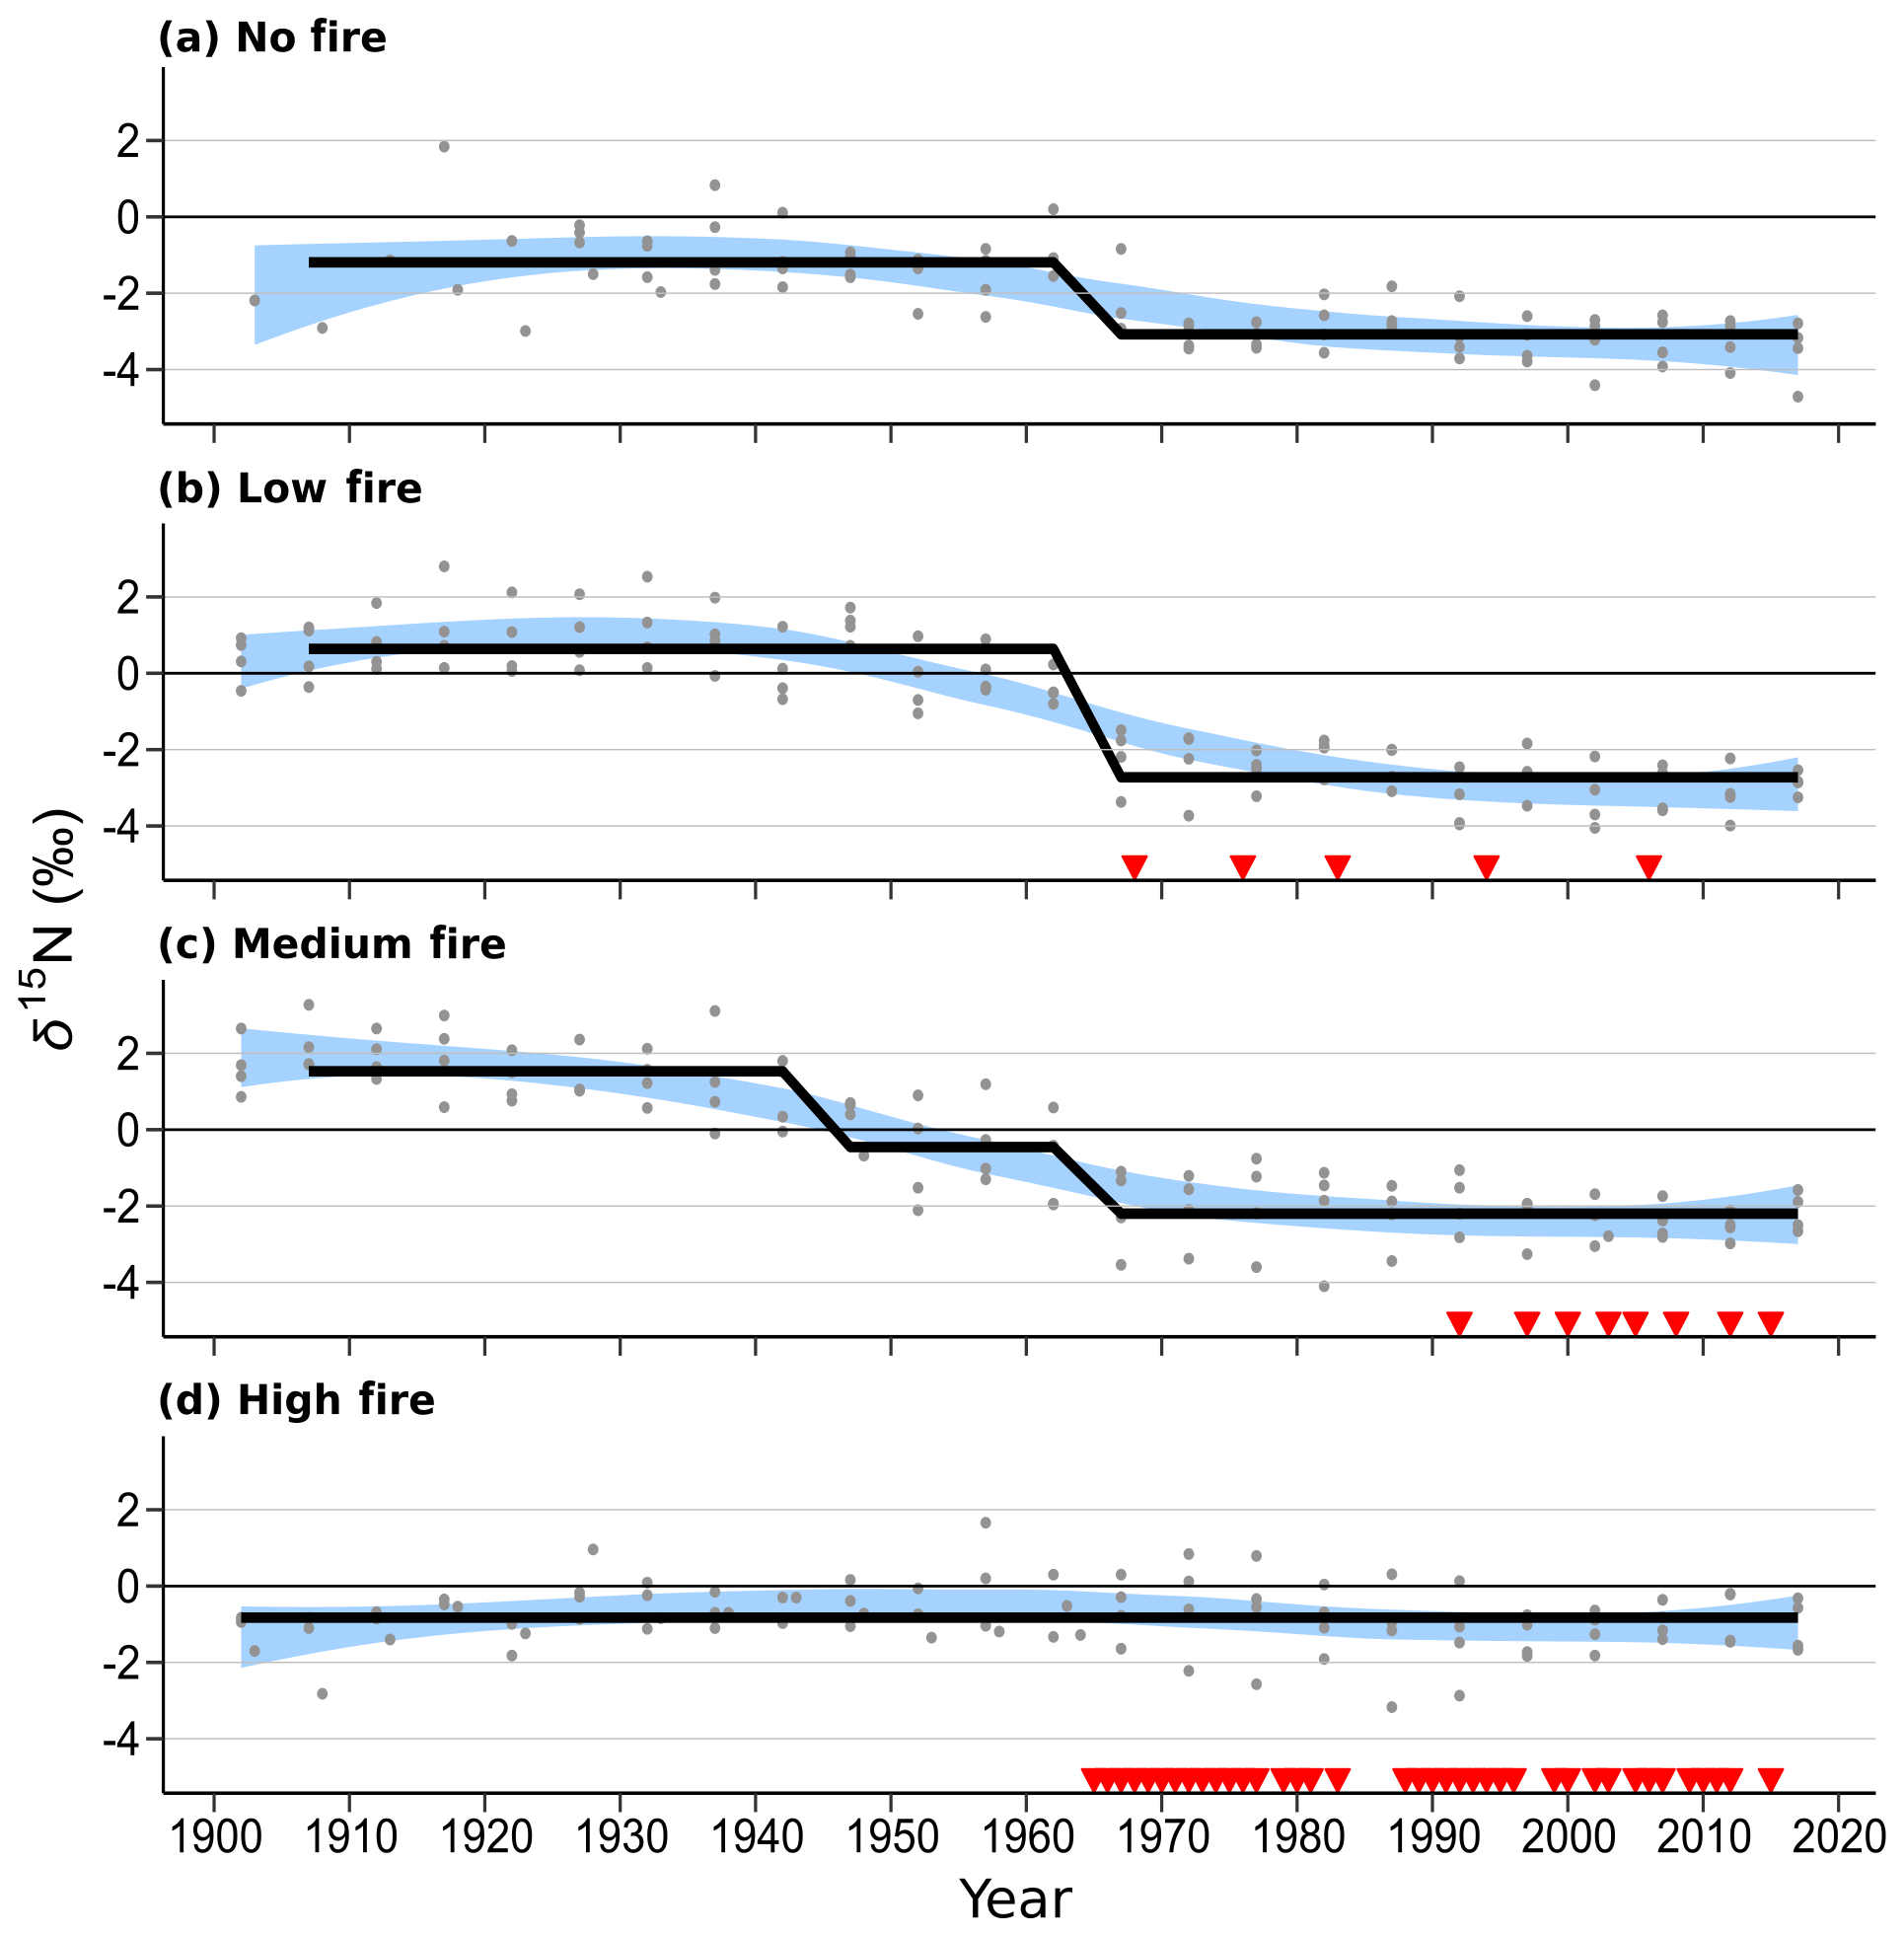
Figure 5Wood δ15N patterns of mature Quercus trees in each of the four burn stands. Four trees were sampled in each stand. Blue shaded areas represent the 99 % confidence intervals of a LOWESS curve fit, and the thick black line shows mean δ15N states determined using regime-shift analysis. Red triangles indicate individual years of prescribed fire in each treatment stand. Mid-20th-century declines in wood δ15N are readily seen in the no-fire, low-fire, and medium-fire stands.
In the medium-fire frequency stand, all four trees showed significantly declining trends toward present based on the two trend tests (p<0.0001; Fig. 4c). Two mean shifts were detected in the medium-fire stand in the 1940s and 1960s using regime-shift analysis. Fire treatment in this stand began in 1992 with a 1- in 3-year fire median return, totaling eight prescribed burns to the date of sampling. Trees in this stand exhibited the steepest declines in wood δ15N over time, ranging from a maximum of 3.3 % in 1907 to a minimum of −4.1 % in 1982. The standard deviation of wood δ15N values (1.9 %) was highest in this burn stand relative to all others.
In contrast to the other stands we sampled, the high-fire-frequency stand displayed little evidence of declining wood δ15N. Out of the four sampled trees, only CCS559 demonstrated a significantly declining trend in wood δ15N toward present based on the linear trend test (Fig. 4d). Similarly, no shifts in mean wood δ15N were detected using regime-shift analysis. Fire treatment began in this stand in 1965 and has continued at a 4- in 5-year annual fire return. In total, 38 fires occurred in this stand between 1965 and 2017, likely surpassing the presettlement fire frequency in this region (Leys et al., 2019). Wood δ15N values ranged from 1.7 % to −3.2 %, and the standard deviation of δ15N (0.8 %) was lowest in this burn stand.
Wood % N has increased in all trees over the last 115 years, with significant increases in 11 out of 16 trees based on the MK test (p<0.01). A sharp increase in % N occurred after the heartwood–sapwood transition in most trees (Fig. 4). For these trees, the sapwood included the outer 10–20 years of growth, and the heartwood–sapwood transition consistently occurred in one ring and never in more than three. For each tree, % N increased consistently through the last sample, and the last two to three samples exhibited markedly higher % N than in previous years. This result is consistent with the well-documented pattern of increasing wood % N after the heartwood–sapwood transition with the highest values in the most recent rings (Poulson et al., 1995; McLauchlan and Craine, 2012). Wood % N was negatively correlated with wood δ15N across all trees (; p<0.001). Excluding all samples from the sapwood, the relationship between wood % N and wood δ15N remained negatively correlated and was statistically significant, although the relationship weakened (; p<0.001). Small differences in wood % N trajectories among treatment stands were evident in our data, and these differences were not statistically significant.
Q. macrocarpa wood δ15N values were significantly different among sampled stands at the beginning of our 115-year record and before the onset of prescribed burning in 1964. Spatial differences indicate lack of support for the first part of our hypothesis, specifically that mean δ15N values would be similar across stands before the onset of the burn experiment. These differences in wood δ15N among stands suggest spatial heterogeneity in N availability before the onset of fire treatment. Over the full record, among-stand wood δ15N variability was higher than within-stand variability, potentially reflecting larger differences in vegetation composition and measured N-cycling metrics between stands.
In contrast to wood δ15N, wood % N trajectories were positive and consistent among stands. Wood % N is not as commonly reported in wood N isotope studies because this metric likely incorporates tree physiology and, thus, may not reflect ecosystem N cycling (Gerhart and McLauchlan, 2014). Positive wood % N trajectories shown here match documented patterns of increasing wood % N after the heartwood–sapwood transition in the wood δ15N literature (Gerhart and McLauchlan, 2014), although this pattern has seen more mixed results in the wood chemistry literature (Meerts, 2002; Martin et al., 2014). While wood % N may not reflect N availability, coherence in wood % N patterns among individual trees and stands suggests that these data contain a strong signal that is independent from wood δ15N at this site. If this result reflects radial nitrogen translocation across ring boundaries, then the greatest mobility would have occurred within the last 5 years of growth, with a decay in mobility that extends over 15 years. Annual-scale analyses might further elucidate these patterns. Wood % N and δ15N were negatively correlated across all samples, and this negative relationship diminished when excluding samples from the sapwood. Although we do not have further evidence to suggest that this is a meaningful relationship, future studies should examine relationships between wood % N and δ15N because their covariance could be problematic if trends in δ15N are strongly related to % N in addition to external factors.
Our results do not support the second part of our original hypothesis; wood δ15N values did not vary among stands proportional to fire frequency and known dates of fire, and differences in fire frequency did not correspond to temporally consistent shifts in mean wood δ15N. The negative trend in wood δ15N for the majority of trees that we analyzed matched our a priori expectation of declining wood δ15N based on evidence of long-term declines in rates of net N mineralization and tree productivity in frequently burned stands at CCESR (Reich et al., 2001; Dijkstra et al., 2006). However, wood δ15N was not inversely related to fire frequency. Trees in the low-fire frequency stands displayed significant negative trends in wood δ15N as expected. But trees in the no-fire stand showed similar declines in δ15N to that of trees in the low- and medium-fire stands, despite fire exclusion and higher measured N stocks and net N mineralization rates in this unburned stand toward present (Reich et al., 2001). Further, wood δ15N declines in the low- and medium-fire stand predated the onset of experimental prescribed burning, and trees in the high-fire stand demonstrated no significant positive or negative trend in δ15N in response to frequent fire beginning in 1965. Although regime-shift analysis identified mean shifts that nearly aligned in time in the no-, low-, and medium-fire stands, all shifts preceded the onset of prescribed fire, and overall δ15N declines were gradual. In combination with wood δ15N values in the high-fire stand showing no discernible response to fire, this evidence indicates that the onset of prescribed fire in the mid-20th century did not cause declines in wood δ15N at CCESR.
Table 4Comparison of previously collected soil N data and our wood δ15N data from CCESR. Values represent the mean of all samples within each burn unit. Net N mineralization data is sourced from Reich et al. (2001), and soil % N and δ15N data are sourced from Pellegrini et al. (2020).
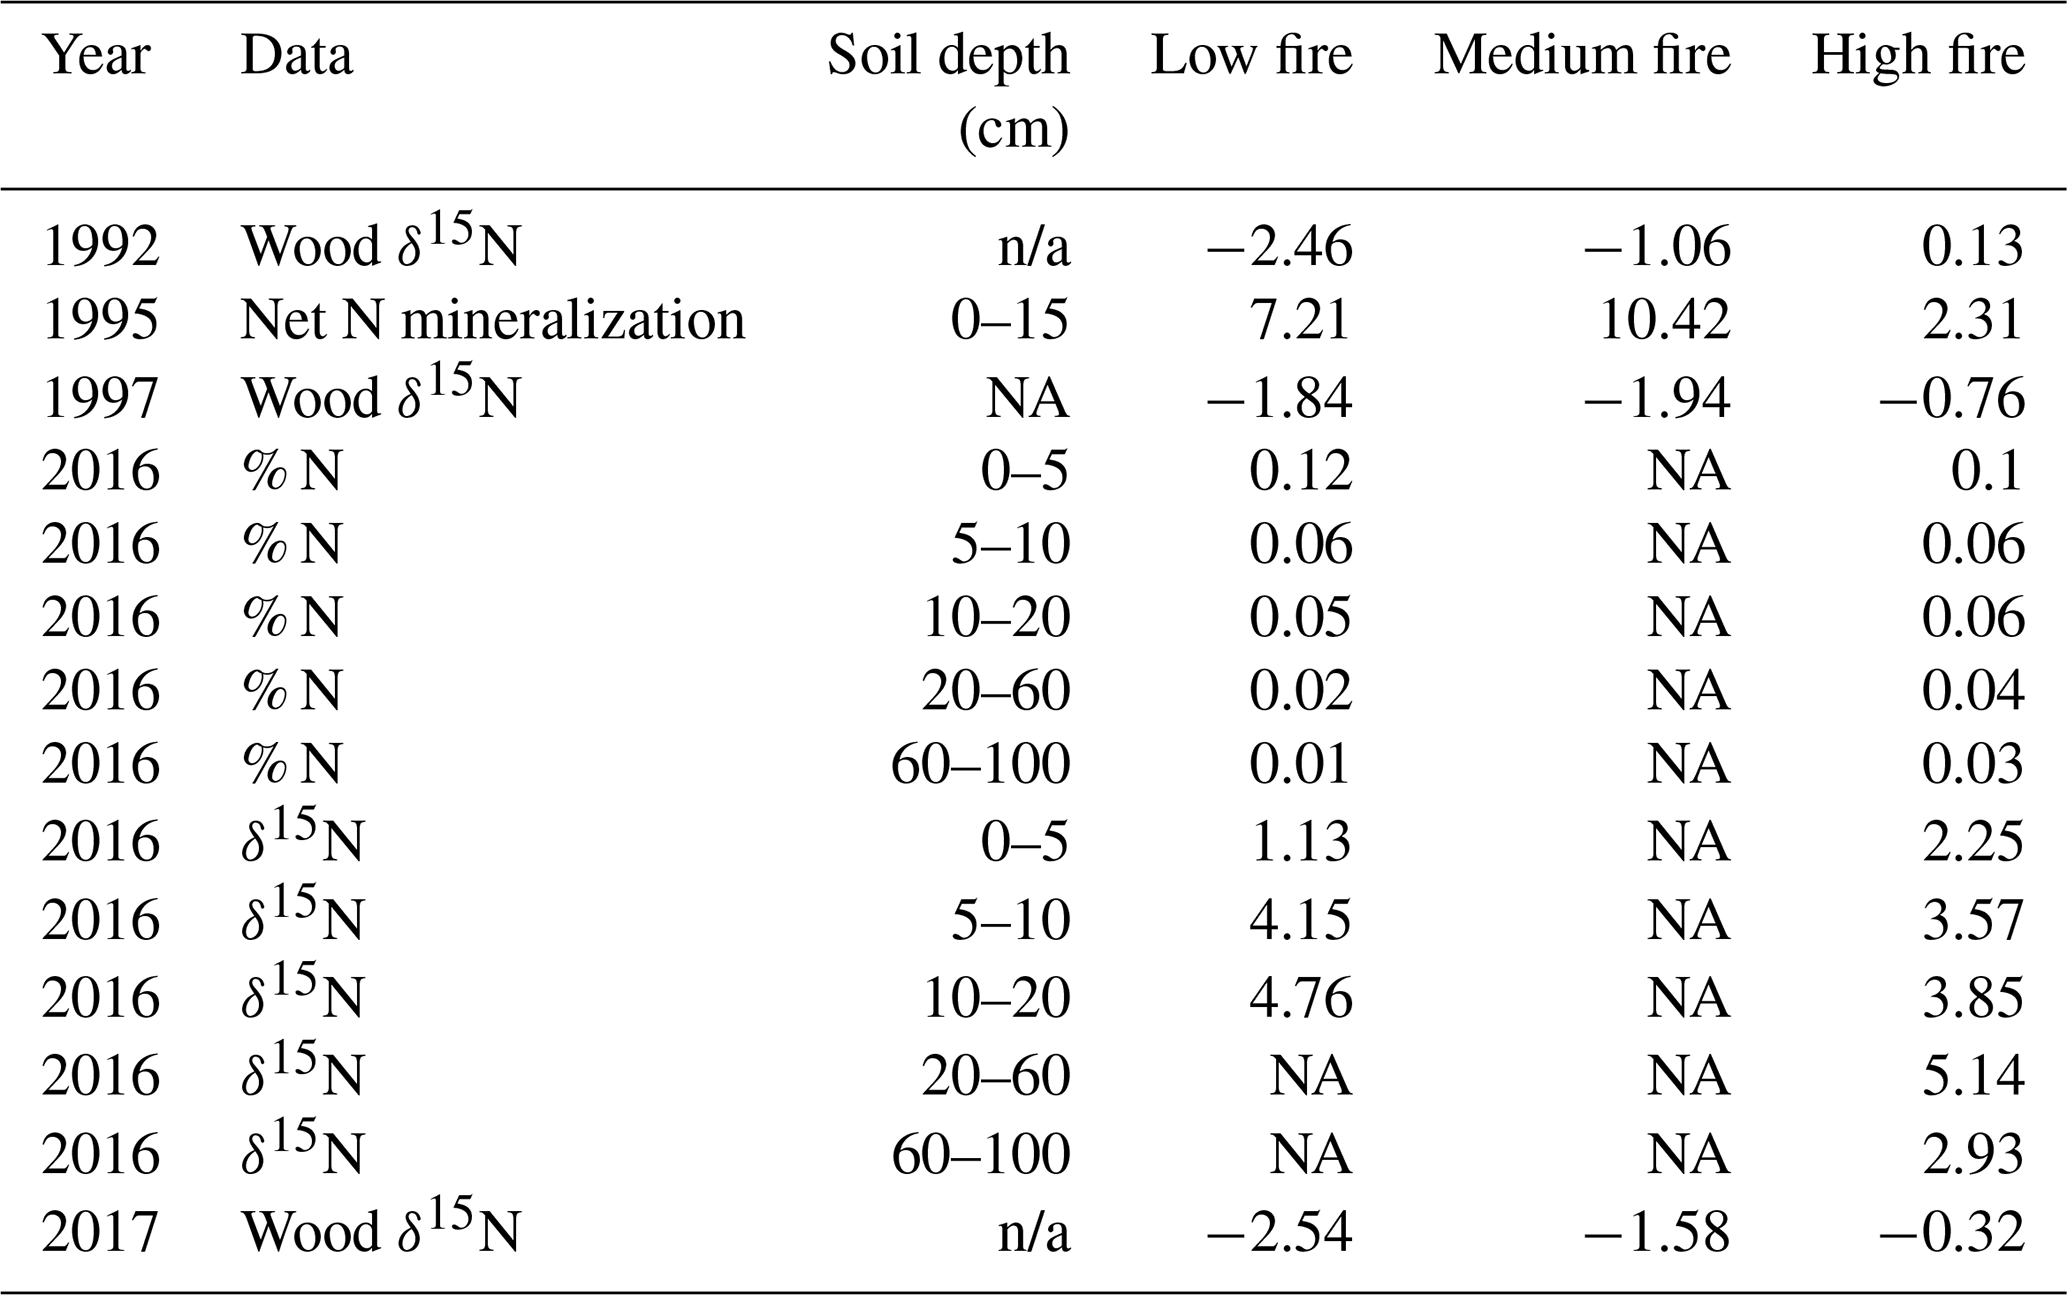
n/a: not applicable; NA: not available.
Prior studies at CCESR have examined N cycling in the same stands that we sampled for wood δ15N across the burn experiment. Reich et al. (2001) measured net N mineralization in 1995 in three of the four stands that we sampled (low-, medium-, and high-fire stands). Net N mineralization decreased nonlinearly with increasing fire frequency among these stands. However, our wood δ15N samples in 1992 and 1997 increased with increasing fire frequency among these stands. Wood δ15N values from 1992 and 1997 were lower in the low- and medium-fire stands compared with the high-fire stand, despite relatively higher net N mineralization in the former stands in 1995 (Table 4; Reich et al., 2001). This could point to large inter-annual variation in wood δ15N or to the fact that soil net N mineralization may not be strongly related to wood δ15N at our study site. More recently, Pellegrini et al. (2020a) measured soil δ15N and cumulative N stocks at multiple depths in two of the four stands we sampled (low- and high-fire stands) in 2016. They found that δ15N decreased with more frequent burning and that δ15N increased with depth across the entire fire frequency gradient, whereas fire did not have a clear effect on total soil N between the low- and high-fire frequency stands that we sampled (Pellegrini et al., 2020b). In contrast, our wood δ15N in 2017 was significantly lower in the low-fire stand compared with the high-fire stand, and we found limited evidence for variation in wood δ15N related to long-term fire frequency. Altogether, these nuanced results from previous studies add context but do not clarify the interpretation of our observed wood δ15N patterns.
Based on the lack of evidence for direct fire effects on short- and long-term wood δ15N patterns at CCESR, we believe the primary driver of δ15N patterns at this site has been changes in vegetation composition and abundance over time, perhaps driven in part by early- to mid-20th-century fire suppression. Our qualitative assessment of aerial photographs between 1938 and 2016 indicates that canopy density increased through time in the no-, low-, and medium-fire stands but remained relatively constant in the high-fire stand (Fig. 2). Our interpretation is in general agreement with results from other studies at CCESR (Peterson and Reich, 2001) as well as with studies undertaken at a directly adjacent experimental site (Faber-Langendoen and Davis, 1995) with the same soil, topography, and plant community characteristics. If fire suppression during several decades of this period indeed allowed understory shrubs and young trees to increase in abundance in these plots, total plant N demand likely increased, thereby reducing N availability to mature oaks. In addition, increased litter inputs with low 15N would tend to decrease soil δ15N in these stands (Nadelhoffer and Fry, 1988). These processes would explain mid-century wood δ15N declines in these plots, particularly in the low- and medium-fire stands where δ15N declined most sharply. In contrast, the high-fire plot was more grass-dominated and open relative to surrounding stands in 1938 and has remained so over time. Less ingrowth of understory shrubs and young trees in the high-fire stand could result in low total N demand that was stable over time, perhaps accounting for the lack of a negative δ15N trend in this stand. Fire suppression was also suggested as a driver of declining N availability based on wood δ15N records in an old-growth pine forest in Minnesota (Howard and McLauchlan, 2015). Thus, although we did not find evidence for variation in wood δ15N directly related to prescribed fire, the indirect effects of fire suppression on vegetation composition and abundance may have been sufficient to affect nitrogen resource partitioning between mature oaks and competing understory species, ultimately causing declining N availability to mature oaks in three out of four stands.
There are several alternative hypotheses to explain the lack of a direct relationship between prescribed fire and wood δ15N trajectories at CCESR. One hypothesis is that the declines in wood δ15N values in trees at CCESR may reflect a common continental-scale driver such as increased atmospheric CO2 or N deposition (McLauchlan et al., 2017). However, such drivers have changed the most in the past 50 years, not in the 20 years prior when the largest changes in wood δ15N values occurred. Moreover, the large differences in the wood δ15N mean and trend between burn stands throughout our 115-year record also suggest a minor role for continental-scale drivers at the scale of our study. The relative close proximity of sampled trees within treatment stands may also contribute to the ambiguous relationship between fire and wood δ15N at this site. The four trees sampled per burn stand were spatially quite close to each other (on average 34 m between trees within each burn unit), and we were unable to replicate sampling in other units with the same fire treatment. Given the spatial variability in wood δ15N that existed before the fire treatment began, additional replicates of fire treatment would help to clarify the relationship between fire and wood δ15N.
Our results are more likely the result of local-scale influences – apart from the obvious presence of fire – on N cycling and tree N uptake at CCESR. Despite our limited evidence for variation in δ15N of tree rings due to prescribed fire, it is important to recognize that fire can influence δ15N and N availability through a variety of mechanisms. For example, Högberg (1997) proposed that the combustion of the upper δ15N-depleted surface layer would lead to increased δ15N values in plants shortly after fire. N losses from volatilization of N during fire events could exceed leaching losses here, given that bursts of plant N uptake and growth after fire have been shown to limit leaching losses (Boerner, 1982; Dijkstra et al., 2006). However, evidence for this N volatilization mechanism may be limited at CCESR because fires in the burn experiment were low severity and rarely resulted in complete combustion of the litter layer (Hernández and Hobbie, 2008). Post-fire nitrification is another mechanism that could affect soil and wood δ15N, causing increased δ15N values of and decreased δ15N values of (Högberg, 1997). This mechanism could affect wood δ15N at this site, as there is evidence that Quercus seedlings show a greater relative preference for over (Templer and Dawson, 2004), and preferences for inorganic N were reflected in Q. alba wood δ15N in an Indiana hardwood forest (McLauchlan and Craine, 2012). Soil net nitrification was negatively related to fire frequency across the CCESR burn experiment (Reich et al., 2001), but our wood δ15N data cannot address the extent to which nitrification is altering the supply of available N. Beghin et al. 2011 invoked both litter combustion and post-fire nitrification in their study of long-term N cycling in a pine forest. They found increased wood δ15N in the 5 years after fire disturbance, but a return to pre-disturbance δ15N levels 6–10 years after fire. Here, we did not find similar short-term increases in δ15N after known prescribed fire events. It is uncertain whether higher-resolution sampling using annual growth rings would provide greater insights into short-term effects of fire on wood δ15N, as N translocation may smooth out inter-annual disturbances to the N cycle.
It is very likely that fire-exclusion since 1964 has increased tree dominance, net N mineralization, and, thus, overall N availability in the no-fire stand (Reich et al., 2001), yet three out of four trees in this stand demonstrated significant declines in wood δ15N. In contrast, wood δ15N has remained stable throughout the 20th century in trees from the high-fire stand, despite prescribed fire that likely reduced the N supply by decreasing the rates of soil net nitrification and promoting further establishment of C4 grasses in this stand (Reich et al., 2001). Stable wood δ15N in the high-fire stand could reflect a decline in N demand that was approximately proportional to declines in N supply, or it may reflect the fact that decreases in N supply due to fire were too small relative to stable N demand to cause a decline in δ15N values. Future studies should consider that wood δ15N patterns may result from changes in the N supply driven directly by fire, in conjunction with changes in the N demand driven indirectly by fire vis-à-vis altered vegetation composition and abundance. Our results at this temperate oak savanna suggest an important influence of decadal-scale vegetation changes caused by fire on N cycling.
Recent studies have shown mixed results regarding the reliability of wood δ15N as a proxy for terrestrial N availability. In some settings, wood δ15N appears to reliably integrate spatiotemporal variation in the soil N supply relative to plant demand (Elmore et al., 2016; Kranabetter and Meeds, 2017; Sabo et al., 2020), whereas other results suggest an inconsistent relationship between wood δ15N and N cycling (Tomlinson et al., 2016; Burnham et al., 2019). Our study sought to clarify the relationships between N availability, wood δ15N, and long-term disturbance by sampling across four treatment stands to control for the presence and frequency of prescribed burning. Contrasting trends in heartwood δ15N across our treatment stands suggest minor roles for the heartwood–sapwood transition and exogenous drivers of wood δ15N at this study site. Nonetheless, the apparent lack of a wood δ15N response to repeated burning at our study site, particularly in the high-fire-frequency treatment, raises uncertainty about the ability of individual tree-level δ15N to record the effects of low-intensity fires on N cycling. We recommend that future studies of N cycling using wood δ15N utilize diligent site selection criteria to control for as many confounding factors as possible to help clarify the processes controlling variation in wood δ15N values.
In summary, over 50 years of long-term ecological research has provided a uniquely detailed understanding of the N cycle at CCESR to compare with our results. In contrast to our hypothesis, wood δ15N values were significantly different among stands before the onset of prescribed burning, and differences in fire frequency did not correspond to long-term δ15N trends or temporally consistent shifts in mean δ15N across four treatment stands. Combined with findings from previous ecosystem biogeochemistry studies at CCESR, we interpret declining wood δ15N in the no-, low-, and medium-fire stands over the past 115 years as reflecting declining N availability to mature oaks at this savanna. No direct effects of fire were consistently supported by our results; instead wood δ15N values were perhaps determined by changes in vegetation composition and abundance over time, due in part to early- to mid-20th-century fire suppression. Specifically, the encroachment of shrubs and juvenile trees in three stands likely increased N demand and competition for N, decreasing N availability for mature oaks, and influencing wood δ15N; although we note that such an interpretation is more plausible than conclusive.
The 2016 soil nitrogen dataset is available at https://doi.org/10.5061/dryad.02v6wwq07 (Pellegrini et al., 2020b). The 1995 soil net N mineralization dataset is available at https://doi.org/10.6073/pasta/02f57c86b556b47f8127a98990a4bae7 (Reich, 2018). The wood nitrogen isotope dataset is available at https://doi.org/10.13020/428b-8h51 (Trumper et al., 2020).
KKM, DG, SEH, and PBR secured funding. MLT, DG, SEH, PBR, and KKM developed the study design. Field sampling and tree ring dating were conducted by MLT and DG, and isotopic analyses were done by DMN. MLT performed the statistical analyses. MLT, DG, and SEH prepared the figures. All authors contributed to the interpretation of the data. MLT wrote the paper with editorial contributions from all authors.
The authors declare that they have no conflict of interest.
We thank the editor, Edzo Veldkamp, and the reviewers, Peter Hietz and Rodica Pena, whose critiques and suggestions improved the paper. This work was supported by grants from the US National Science Foundation Long-Term Ecological Research Program (LTER), including grant nos. DEB-0620652 and DEB-1234162. This research was also supported by grant no. NSF-DEB-1655148 to Kendra K. McLauchlan, grant no. NSF-DEB-1655144 to Daniel Griffin, and the NSF REU program and the University of Minnesota Undergraduate Research Opportunities Program to Matthew L. Trumper. Fire frequency treatments have been maintained with support from the Cedar Creek LTER program. Further support was provided by the Cedar Creek Ecosystem Science Reserve and the University of Minnesota. Daniel Ackerman, Kate Carlson, Daniel Crawford, Mara McPartland, and Madison Sherwood assisted with collecting tree core samples. Ryan Mattke and the UMN Borchert Map Library provided access to historical aerial imagery. Jack Dougherty assisted with tree core specimen preparation, and Robin Paulman conducted the isotopic analysis at CASIF. We thank Kurt Kipfmueller for helpful discussions.
This research has been supported by the National Science Foundation, Division of Environmental Biology (grant nos. 0620652, 1234162, 1655148, and 1655144).
This paper was edited by Edzo Veldkamp and reviewed by Peter Hietz, Rodica Pena, and one anonymous referee.
Aranibar, J. N., Macko, S. A., Anderson, I. C., Potgieter, A. L. F., Sowry, R., and Shugart, H. H.: Nutrient cycling responses to fire frequency in the Kruger National Park (South Africa) as indicated by Stable Isotope analysis, Isot. Environ. Health S., 39, 141–158, https://doi.org/10.1080/1025601031000096736, 2003. a
Beghin, R., Cherubini, P., Battipaglia, G., Siegwolf, R., Saurer, M., and Bovio, G.: Tree-ring growth and stable isotopes (δ13C and δ15N) detect effects of wildfires on tree physiological processes in Pinus sylvestris L, Trees – Structure and Function, 25, 627–636, https://doi.org/10.1007/s00468-011-0539-9, 2011. a, b, c
Boerner, R. E. J.: Fire and Nutrient Cycling in Temperate Ecosystems, BioScience, 32, 187–192, https://doi.org/10.2307/1308941, 1982. a
Boring, L. R., Hendricks, J. J., Wilson, C. A., and Mitchell, R. J.: Season of burn and nutrient losses in a longleaf pine ecosystem, Int. J. Wildland Fire, 13, 443–453, https://doi.org/10.1071/WF03060, 2004. a
Bukata, A. R. and Kyser, T. K.: Response of the Nitrogen Isotopic Composition of Tree-Rings Following Tree-Clearing and Land-Use Change, Environ. Sci. Technol., 39, 7777–7783, https://doi.org/10.1021/es050733p, 2005. a
Bunn, A. G., Helfield, J. M., Gerdts, J. R., Gleaves, D. A., Drake, D. C., and Sheppard, P. R.: A solvent-based extraction fails to remove mobile nitrogen from western redcedar (Thuja plicata), Dendrochronologia, 44, 19–21, https://doi.org/10.1016/J.DENDRO.2017.03.001, 2017. a
Burnham, M. B., Adams, M. B., and Peterjohn, W. T.: Assessing tree ring δ15N of four temperate deciduous species as an indicator of N availability using independent long-term records at the Fernow Experimental Forest, WV, Oecologia, 191, 971–981, https://doi.org/10.1007/s00442-019-04528-4, 2019. a
Coetsee, C., February, E. C., and Bond, W. J.: Nitrogen availability is not affected by frequent fire in a South African savanna, J. Trop. Ecol., 24, 647–654, https://doi.org/10.1017/S026646740800549X, 2008. a
Craine, J. M., Brookshire, E. N. J., Cramer, M. D., Hasselquist, N. J., Koba, K., Marin-Spiotta, E., and Wang, L.: Ecological interpretations of nitrogen isotope ratios of terrestrial plants and soils, Plant Soil, 396, 1–26, https://doi.org/10.1007/s11104-015-2542-1, 2015. a, b
Dijkstra, F. A., Wrage, K., Hobbie, S. E., and Reich, P. B.: Tree Patches Show Greater N Losses but Maintain Higher Soil N Availability than Grassland Patches in a Frequently Burned Oak Savanna, Ecosystems, 9, 441–452, https://doi.org/10.1007/s10021-006-0004-6, 2006. a, b, c, d
Elmore, A. J., Nelson, D. M., and Craine, J. M.: Earlier springs are causing reduced nitrogen availability in North American eastern deciduous forests, Nat. Plants, 2, 1–5, https://doi.org/10.1038/nplants.2016.133, 2016. a
Faber-Langendoen, D. and Davis, M. A.: Effects of Fire Frequency on Tree Canopy Cover at Allison-Savanna, Eastcentral Minnesota, USA, Nat. Area. J., 15, 319–328, 1995. a
Ficken, C. D. and Wright, J. P.: Contributions of microbial activity and ash deposition to post-fire nitrogen availability in a pine savanna, Biogeosciences, 14, 241–255, https://doi.org/10.5194/bg-14-241-2017, 2017. a
Gerhart, L. M. and McLauchlan, K. K.: Reconstructing terrestrial nutrient cycling using stable nitrogen isotopes in wood, Biogeochemistry, 120, 1–21, https://doi.org/10.1007/s10533-014-9988-8, 2014. a, b, c, d
Grigal, D. F., Chamberlain, L. M., Finney, H. R., Wroblewski, D. V., and Gross, E. V.: Soils of the Cedar Creek Natural History Area, University of Minnesota Agricultural Experiment Station, 123, 1–47, 1974. a, b, c
Grogan, P., Burns, T. D., and Chapin III, F.: Fire effects on ecosystem nitrogen cycling in a Californian bishop pine forest, Oecologia, 122, 537–544, https://doi.org/10.1007/s004420050977, 2000. a
Hart, S. C. and Classen, A. T.: Potential for assessing long-term dynamics in soil nitrogen availability from variations in δ15N of tree rings, Isot. Environ. Health S., 39, 15–28, https://doi.org/10.1080/1025601031000102206, 2003. a
Hernández, D. L. and Hobbie, S. E.: Effects of fire frequency on oak litter decomposition and nitrogen dynamics, Oecologia, 158, 535–543, https://doi.org/10.1007/s00442-008-1162-3, 2008. a
Hietz, P., Dünisch, O., and Wanek, W.: Long-Term Trends in Nitrogen Isotope Composition and Nitrogen Concentration in Brazilian Rainforest Trees Suggest Changes in Nitrogen Cycle, Environ. Sci. Technol., 44, 1191–1196, https://doi.org/10.1021/es901383g, 2010. a
Hobbie, E. A. and Högberg, P.: Nitrogen isotopes link mycorrhizal fungi and plants to nitrogen dynamics, New Phytol., 196, 367–382, https://doi.org/10.1111/j.1469-8137.2012.04300.x, 2012. a
Högberg, P.: Tansley review no. 95 natural abundance in soil-plant systems, New Phytologist, 137, 179–203, https://doi.org/10.1046/j.1469-8137.1997.00808.x, 1997. a, b, c
Houlton, B. Z., Sigman, D. M., and Hedin, L. O.: Isotopic evidence for large gaseous nitrogen losses from tropical rainforests, P. Natl. Acad. Sci. USA, 103, 8745–50, https://doi.org/10.1073/pnas.0510185103, 2006. a
Howard, I. and McLauchlan, K. K.: Spatiotemporal analysis of nitrogen cycling in a mixed coniferous forest of the northern United States, Biogeosciences, 12, 3941–3952, https://doi.org/10.5194/bg-12-3941-2015, 2015. a, b
Kranabetter, J. M. and Meeds, J. A.: Tree ring δ15N as validation of space-for-time substitution in disturbance studies of forest nitrogen status, Biogeochemistry, 134, 201–215, https://doi.org/10.1007/s10533-017-0355-4, 2017. a, b
Leys, B. A., Griffin, R., Larson, E. R., and McLauchlan, K. K.: Century-Scale Fire Dynamics in a Savanna Ecosystem, Fire, 2, 51 pp., https://doi.org/10.3390/fire2030051, 2019. a, b, c
Martin, A. R., Erickson, D. L., Kress, W. J., and Thomas, S. C.: Wood nitrogen concentrations in tropical trees: phylogenetic patterns and ecological correlates, New Phytol., 204, 484–495, https://doi.org/10.1111/nph.12943, 2014. a
McAuliffe, C. P., Lage, K., and Mattke, R.: Access to Online Historical Aerial Photography Collections: Past Practice, Present State, and Future Opportunities, Journal of Map and Geography Libraries, 13, 198–221, https://doi.org/10.1080/15420353.2017.1334252, 2017. a
McLauchlan, K. K. and Craine, J. M.: Species-specific trajectories of nitrogen isotopes in Indiana hardwood forests, USA, Biogeosciences, 9, 867–874, https://doi.org/10.5194/bg-9-867-2012, 2012. a, b
McLauchlan, K. K., Craine, J. M., Oswald, W. W., Leavitt, P. R., and Likens, G. E.: Changes in nitrogen cycling during the past century in a northern hardwood forest, P. Natl. Acad. Sci. USA, 104, 7466–70, https://doi.org/10.1073/pnas.0701779104, 2007. a
McLauchlan, K. K., Gerhart, L. M., Battles, J. J., Craine, J. M., Elmore, A. J., Higuera, P. E., Mack, M. C., McNeil, B. E., Nelson, D. M., Pederson, N., and Perakis, S. S.: Centennial-scale reductions in nitrogen availability in temperate forests of the United States, Sci. Rep., 7, 7856, https://doi.org/10.1038/s41598-017-08170-z, 2017. a, b, c
Meerts, P.: Mineral nutrient concentrations in sapwood and heartwood: a literature review, Ann. Forest Sci., 59, 713–722, https://doi.org/10.1051/forest:2002059, 2002. a
MHAPO: Minnesota historical aerial photographs online, available at: https://www.lib.umn.edu/apps/mhapo/ (last access: 15 October 2020), 2019. a
Nadelhoffer, K. J. and Fry, B.: Controls on Natural Nitrogen-15 and Carbon-13 Abundances in Forest Soil Organic Matter, Soil Sci. Am. J., 52, 1633–1640, https://doi.org/10.2136/sssaj1988.03615995005200060024x, 1988. a
National Atmospheric Deposition Program: 2017 Annual Summary, available at: http://nadp.slh.wisc.edu/lib/data/2017as.pdf (last access: 12 December 2019), 2018. a
Nuzzo, V. A.: Extent and Status of Midwest Oak Savanna: Presettlement and 1985, Nat. Areas J., 6, 6–36, 1986. a
Ojima, D. S., Schimel, D. S., Parton, W. J., and Owensby, C. E.: Long- and short-term effects of fire on nitrogen cycling in tallgrass prairie, Biogeochemistry, 24, 67–84, https://doi.org/10.1007/BF02390180, 1994. a, b
Pellegrini, A. F., Hoffmann, W. A., and Franco, A. C.: Carbon accumulation and nitrogen pool recovery during transitions from savanna to forest in central Brazil, Ecology, 95, 342–352, https://doi.org/10.1890/13-0290.1, 2014. a
Pellegrini, A. F. A., Hedin, L. O., Staver, A. C., and Govender, N.: Fire alters ecosystem carbon and nutrients but not plant nutrient stoichiometry or composition in tropical savanna, Ecology, 96, 1275–1285, https://doi.org/10.1890/14-1158.1, 2015. a, b
Pellegrini, A. F. A., McLauchlan, K. K., Hobbie, S. E., Mack, M. C., Marcotte, A. L., Nelson, D. M., Perakis, S. S., Reich, P. B., and Whittinghill, K.: Frequent burning causes large losses of carbon from deep soil layers in a temperate savanna, J. Ecol., 108, 1426–1441, https://doi.org/10.1111/1365-2745.13351, 2020a. a
Pellegrini, A. F. A., McLauchlan, K. K., Hobbie, S. E., Mack, M. C., Marcotte, A. L., Nelson, D. M., Perakis, S. S., Reich, P. B., and Whittinghill, K.: Data from: Frequent burning causes large losses of carbon from deep soil layers in a temperate savanna, Dryad Digital Repository, https://doi.org/10.5061/dryad.02v6wwq07 (last access: 20 June 2020), 2020b. a, b
Perakis, S. S., Tepley, A. J., and Compton, J. E.: Disturbance and Topography Shape Nitrogen Availability and δ15N over Long-Term Forest Succession, Ecosystems, 18, 573–588, https://doi.org/10.1007/s10021-015-9847-z, 2015. a
Peterson, D. W. and Reich, P. B.: Prescribed fire in oak savanna: Fire frequency effects on stand structure and dynamics, Ecol. Appl., 11, 914–927, https://doi.org/10.1890/1051-0761(2001)011[0914:PFIOSF]2.0.CO;2, 2001. a, b, c
Poulson, S. R., Chamberlain, C., and Friedland, A. J.: Nitrogen isotope variation of tree rings as a potential indicator of environmental change, Chem. Geol., 125, 307–315, https://doi.org/10.1016/0009-2541(95)00097-6, 1995. a
Raison, R. J.: Modification of the soil environment by vegetation fires, with particular reference to nitrogen transformations: A review, Plant Soil, 51, 73–108, https://doi.org/10.1007/BF02205929, 1979. a
Reich, P.: Soil net N mineralization over five incubation periods: Effect of Burning Patterns on Vegetation in the Fish Lake Burn Compartments ver 9, Environmental Data Initiative, https://doi.org/10.6073/pasta/02f57c86b556b47f8127a98990a4bae7 (last access: 16 March 2020), 2018. a
Reich, P. B., Peterson, D. W., Wedin, D. A., and Wrage, K.: Fire and vegetation effects on productivity and nitrogen cycling across a forest–grassland continuum, Ecology, 82, 1703–1719, https://doi.org/10.1890/0012-9658(2001)082[1703:FAVEOP]2.0.CO;2, 2001. a, b, c, d, e, f, g, h, i, j, k, l
Rodionov, S. N.: A sequential algorithm for testing climate regime shifts, Geophys. Res. Lett., 31, L09204, https://doi.org/10.1029/2004GL019448, 2004. a, b
Sabo, R. D., Elmore, A. J., Nelson, D. M., Clark, C. M., Fisher, T., and Eshleman, K. N.: Positive correlation between wood δ15N and stream nitrate concentrations in two temperate deciduous forests, Environ. Res. Commun., 2, 025003, https://doi.org/10.1088/2515-7620/AB77F8, 2020. a
Sheppard, P. R. and Thompson, T. L.: Effect of Extraction Pretreatment on Radial Variation of Nitrogen Concentration in Tree Rings, J. Environ. Qual., 29, 2037, https://doi.org/10.2134/jeq2000.00472425002900060042x, 2000. a
Stokes, M. A. and Smiley, T. L.: An introduction to tree-ring dating, Univ. Chicago Press, Chicago, 73 pp., 1996. a
Templer, P. and Dawson, T.: Nitrogen uptake by four tree species of the Catskill Mountains, New York: Implications for forest N dynamics, Plant Soil, 262, 251–261, https://doi.org/10.1023/B:PLSO.0000037047.16616.98, 2004. a
Tilman, G. D.: Plant Dominance Along an Experimental Nutrient Gradient, Ecology, 65, 1445–1453, https://doi.org/10.2307/1939125, 1984. a, b
Tomlinson, G., Buchmann, N., Siegwolf, R., Weber, P., Thimonier, A., Pannatier, E. G., Schmitt, M., Schaub, M., and Waldner, P.: Can tree-ring δ15N be used as a proxy for foliar δ15N in European beech and Norway spruce?, Trees – Structure and Function, 30, 627–638, https://doi.org/10.1007/s00468-015-1305-1, 2016. a
Trumper, M. L., Griffin, D., Hobbie, S. E., Howard, I. M., Nelson, D. M., Reich, P. B., and McLauchlan, K. K.: Data supporting: Century-scale wood nitrogen isotope trajectories from an oak savanna with variable fire frequencies, Data Repository for the University of Minnesota, https://doi.org/10.13020/428b-8h51, 2020. a
van der Sleen, P., Zuidema, P. A., and Pons, T. L.: Stable isotopes in tropical tree rings: theory, methods and applications, Funct. Ecol., 31, 1674–1689, https://doi.org/10.1111/1365-2435.12889, 2017. a
Wilson, C. A., Mitchell, R. J., Boring, L. R., and Hendricks, J. J.: Soil nitrogen dynamics in a fire-maintained forest ecosystem: Results over a 3-year burn interval, Soil Biol. Biochem., 34, 679–689, https://doi.org/10.1016/S0038-0717(01)00233-4, 2002. a