1. Introduction
Water use efficiency of horticultural soilless substrates represents one of the biggest variables in container plant production. With nearly 21,500 acres of land devoted to greenhouse operations in the U.S., representing a 148% increase since 1998, growers specializing in container plant production need to be able to understand how irrigation specifics impact water use efficiency of soilless substrates [
1]. Greenhouse production uses less water and fewer nutrients than many agricultural resources [
2], and decrease crop water requirements by up to 40% compared to open field cultivation [
3,
4,
5]. As water quality, conservation, scarcity and operational costs increase, plant producers must adopt new strategies to improve the sustainable use of water to confront water-climate policies [
6,
7,
8]. In order for growers to meet these increasing regulations in water use, we need to increase the overall understanding of irrigation techniques.
Two parameters affecting water efficiency in substrates are container capacity (CC) [
9,
10,
11,
12] and wettability [
13,
14,
15,
16,
17]. Both wettability and CC are vital to the wetting of a substrate, however neither completely describes the effectiveness of water capture during irrigation [
18]. Container capacity is the maximum amount of water a substrate can hold after wetting and drainage. Wettability includes a liquid’s ability to spread laterally at and below the surface of a material [
19]. In substrates, proper wettability helps to provide a uniform distribution of water throughout the rooting environment [
20]. Moisture content in substrates affects both wettability and CC of a substrate. Fields et al., [
21] showed the variability in CC based on substrate and initial moisture content (IMC), with coir and pine bark being less variable than peat. Initial moisture content in this context references the moisture content prior to an irrigation event. At low moisture conditions, peat can have a ~30% lower CC than at high moisture conditions [
11]. In mineral soils, hydrophobicity is caused by organic residues coating the mineral materials from the breakdown of organic matter. In substrates, most components are composed almost entirely of organic materials which complicates the nature of hydrophobicity. As organic materials naturally break down, the intensity of hydrophobicity can change, which then alters the substrate’s behavior during rewetting [
22,
23]. Hydrophobicity issues also arise as organic materials dry, and materials such as peat and pine bark begin to see reductions in water capture based on repellency [
13,
24]. Adequate substrate particle structure, stability, density, and CC are needed to allow water movement through the containers [
25,
26].
Most irrigation is applied to the top of the soil column. However, in containers, the irrigation delivery direction can be reversed and delivered from the bottom (subirrigation). Irrigating from below can require a finer textured, micro-pore abundant substrate to take up water mainly through capillary action [
27]. Conversely, greater air space (AS) and pore size diversity favor surface irrigation methods. Capillary action, the movement of water from a saturated zone upward into an unsaturated zone through surface tension and soil matric potential, provides water and nutrients to the plant root [
28]. Subirrigation is a combination of flooding from a perched water table and capillary rise. Ebb and flow subirrigation, was found to reduce water use by ~40% compared to hand watering [
29,
30]. The confluence of these factors combine to play a pivotal role in the effectiveness of water uptake in specific combinations of irrigation method and substrate components. Water transport research in mineral soils [
31] provides the basis to understand soilless substrate systems, but the substantial differences in physical properties and their accompanying calculated values between soil and soilless substrates requires substrate-specific research.
Research has identified the impacts hydrophobicity can have on the wettability of some horticultural substrates [
13,
19,
20]. However, few have studied the influence of irrigation delivery method on the ability of substrates to capture water or rehydrate. In soilless substrates, water distribution in the container can largely change due to a substrate’s hydrophobicity, physical characteristics (texture/particle size), as well as the irrigation method used. The objective of this study was to characterize the water capture and retention of three substrate components based on irrigation technique and IMC.
2. Materials and Methods
2.1. Preparation of Substrates
On 11 April, 2019, sphagnum peat (Premier Pro-Moss, Quakertown, PA) was hydrated and fluffed to an initial IMC of 70% (by weight; ~2.5 w). To do that, peat was removed from the compressed bale and placed into a large tub, water was then added in 3 L increments after which peat was mixed/agitated by hand to allow water absorption. Moisture levels were then tested using an Ohaus MB27 soil moisture determination balance (Ohaus Corp., Parsippany, NJ) to determine further water additions needed to bring peat to an initial moisture of 70%. On 15 April, 2019, three compressed bricks of coconut coir (Densu Coir, Ontario, Canada) were hydrated individually by adding 14 L of water (in 1 L increments), by hand, until the coir was completely broken apart. Moisture levels were then tested using the soil moisture balance to determine further water additions needed to bring coir to an initial moisture of 70%. On 16 April, 2019, loblolly (Pinus taeda L.) pine bark (Pacific Organics, Henderson, NC) which had been aged in outdoor windrows for four months and specifically engineered (hammer milled and screened) to have a CC of 55% volumetric water content (VWC). The volume of pine bark was measured out, initial moisture level was tested and recorded before the bark was further hydrated to a moisture level of 70%.
Each substrate component was tested under three IMC treatments. The most common and recommended IMC for potting soils has a mass wetness of 1.0 g g−1. To test effects of IMC, each component was also brought to half (0.5 g g−1) and double (2.0 g g−1) this normal level, which resulted in percent IMCs of 33%, 50%, and 67% by weight. To do this the wet weights and dry weights were determined by taking 500 g subsamples of each substrate, weighing, drying, and then reweighing. Substrate samples were wet to an initial IMC of 70% IM, before being air-dried down to initial IMC’s of 67%, 50%, and 33% IMC. Initial IMC and total weight of each sample were used to calculate how much water needed to be lost to reach initial IMC’s of 67% IM, 50% IM, and 33% IM. Using a 160 cm × 49 cm × 69 cm four-tier PVC-enclosed dehumidifying chamber, substrates were allowed to air dry to desired wetness. Once the target initial IMC was reached, samples were transferred to plastic bags and sealed to prevent further water loss, while allowing the substrate to reach moisture equilibrium.
2.2. Particle Size
Particle size distribution (
Table 1) was performed on three 50 g oven dried samples of each substrate with 7 sieves. The sieve sizes used were 6.3 mm, 2.0 mm, 0.71 mm, 0.5 mm, 0.25 mm, 0.11 mm, and the bottom pan to collect fine particulates. The 7 sieves (6 sieves and the pan) were stacked together and substrate samples were poured into the top sieve, and placed into the RX-29 Ro-Tap sieve shaker (278 oscillations/min, 150 taps/min; W.S, Tyler, Mentor, OH). The sieves and pan were shaken for five min and the particle fractions retained on each sieve and the amount collected in the bottom pan (representing the smallest particle fractions) were weighed.
2.3. Surface Irrigation
In order to determine the effects of IMC with surface applied irrigation, this experiment followed the procedures described by Fonteno et al. [
18] and Fields et al. [
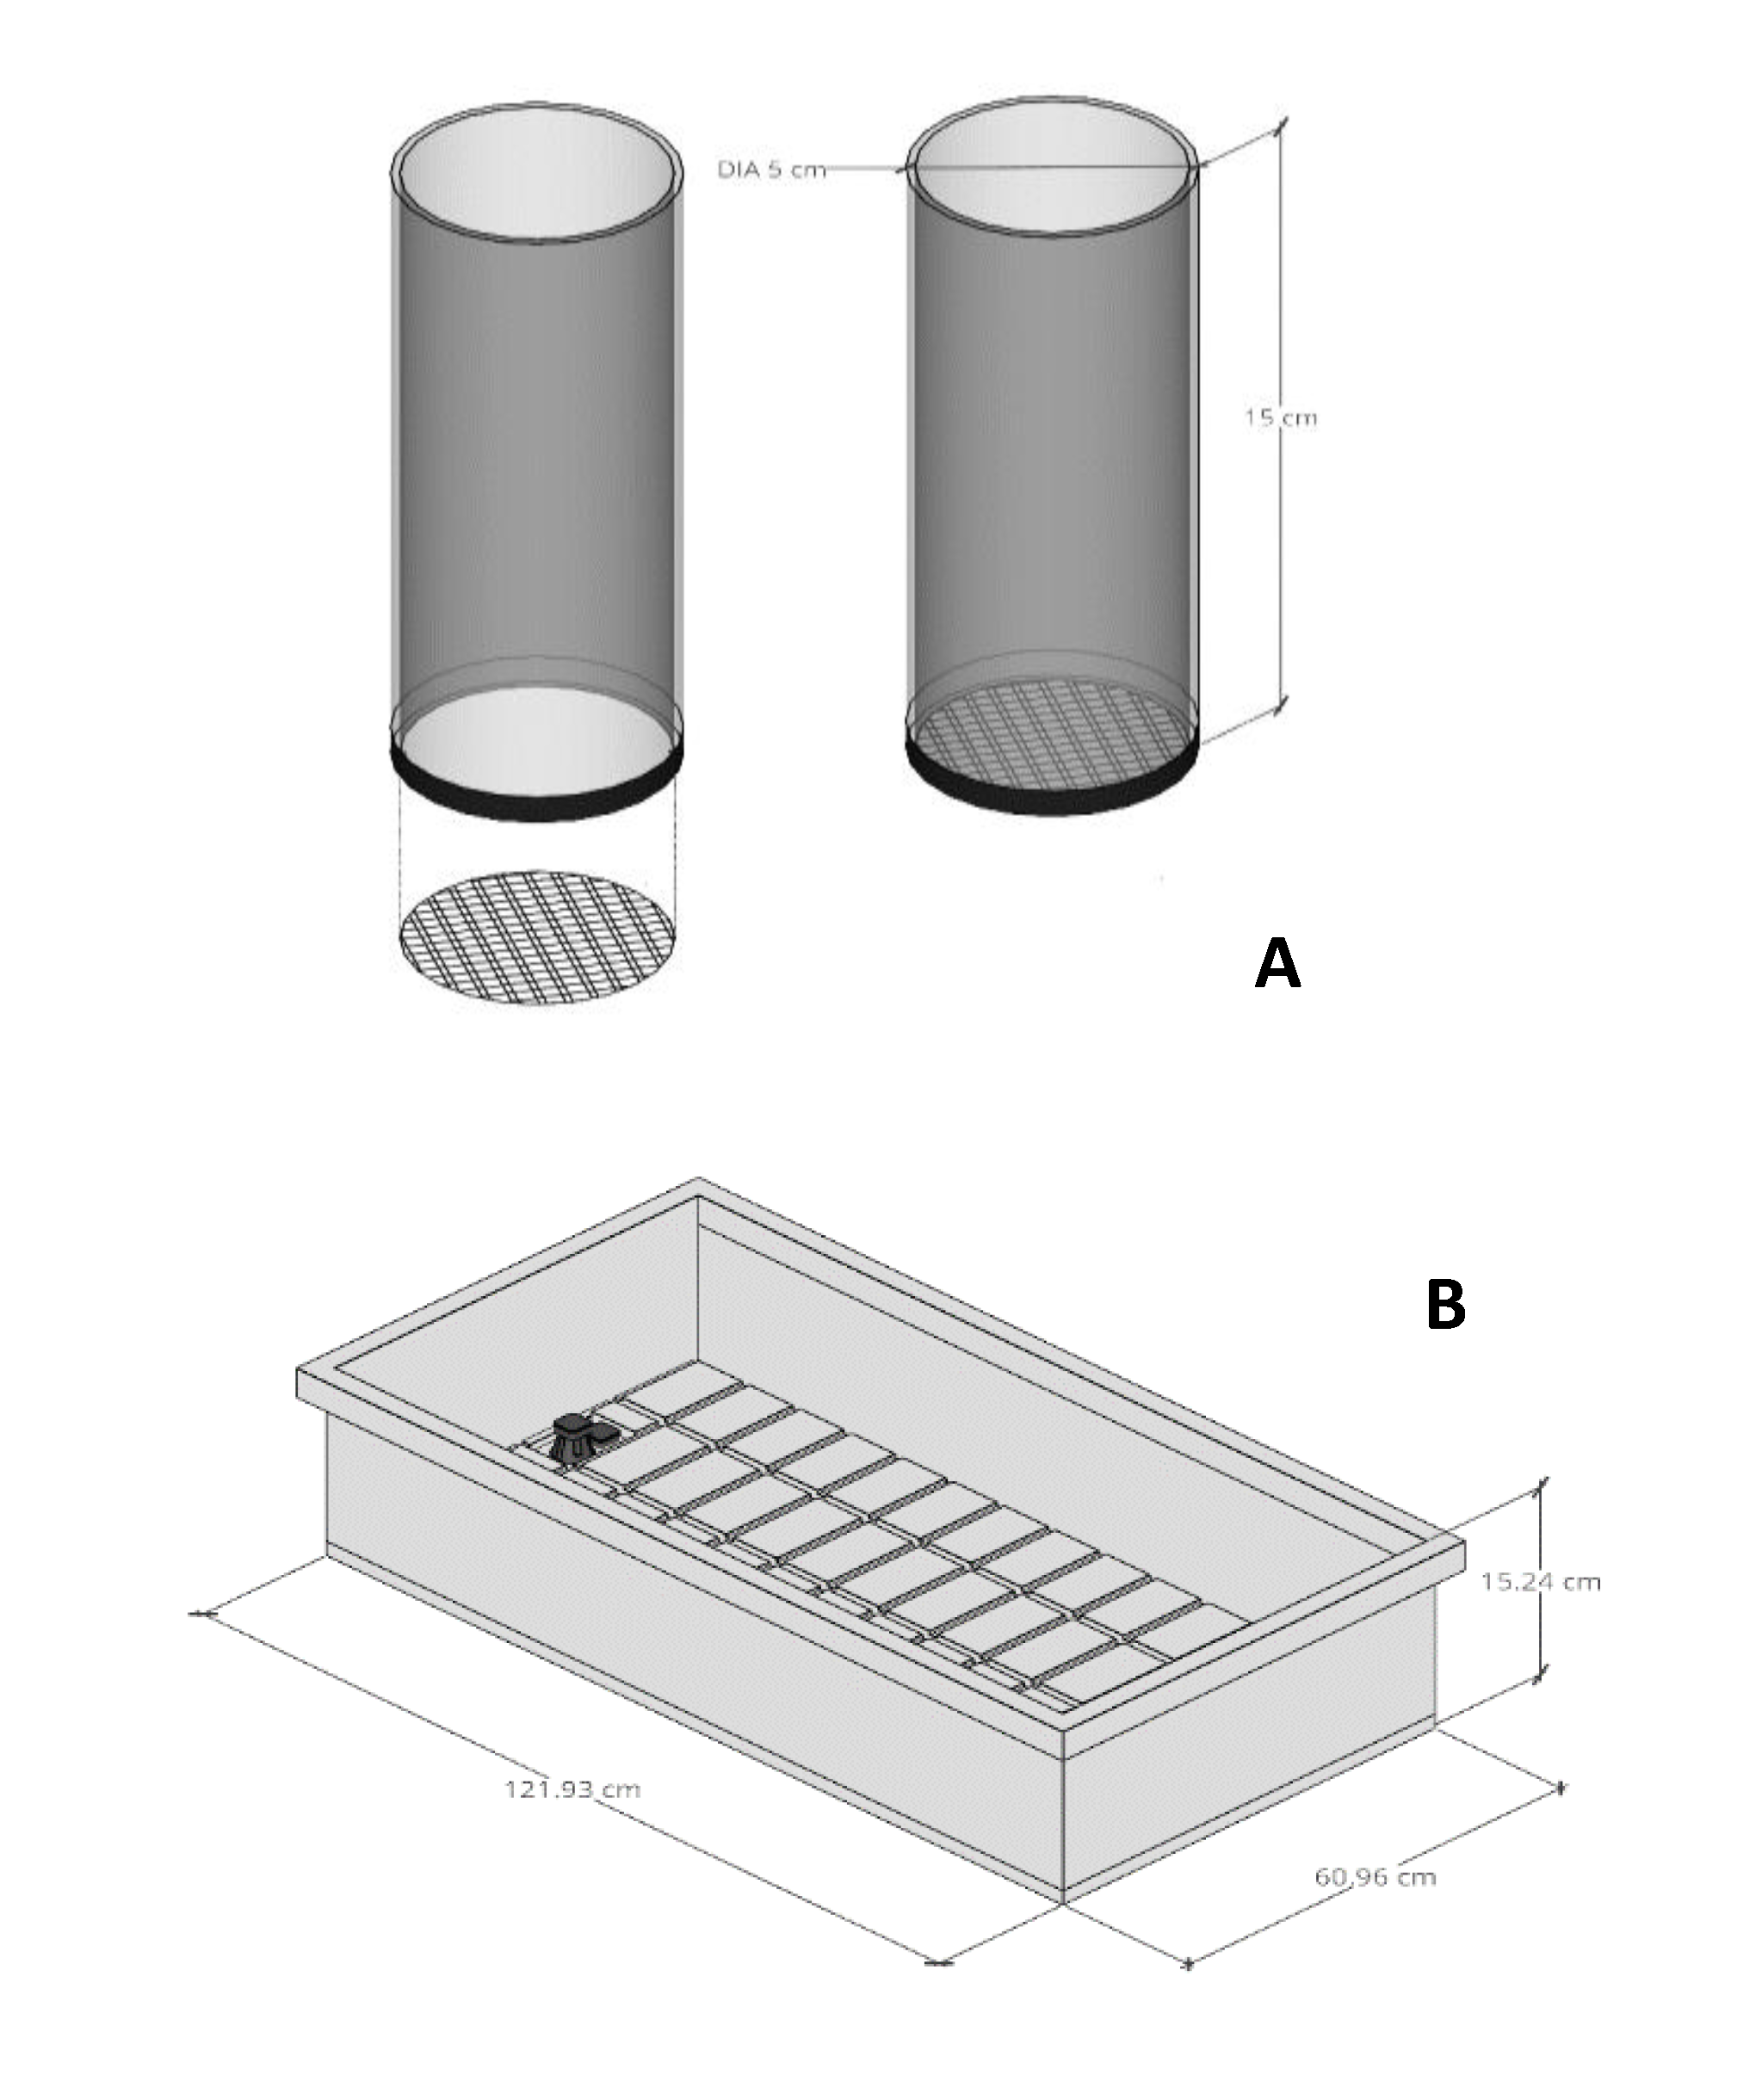
20]. The equipment consisted of a transparent cylinder, 5 cm i.d. × 15 cm h
–1, with a mesh screen (mesh size 18 × 16; New York Wire, York, PA, USA) (
Figure 1A), attached to one end, using rubber pressure plate rings (Soil moisture Equipment Corp., Santa Barbara, CA, USA); a 250-mL beaker; a 250-mL funnel; as well as a 10 mL plastic vial (4-cm diameter) with five evenly spaced 2.33 mm diameter holes in the base to act as a diffuser displayed in
Figure 1. This allowed the water dripping through the funnel to be evenly dispersed through the five holes onto the surface of the substrate in the cylinder.
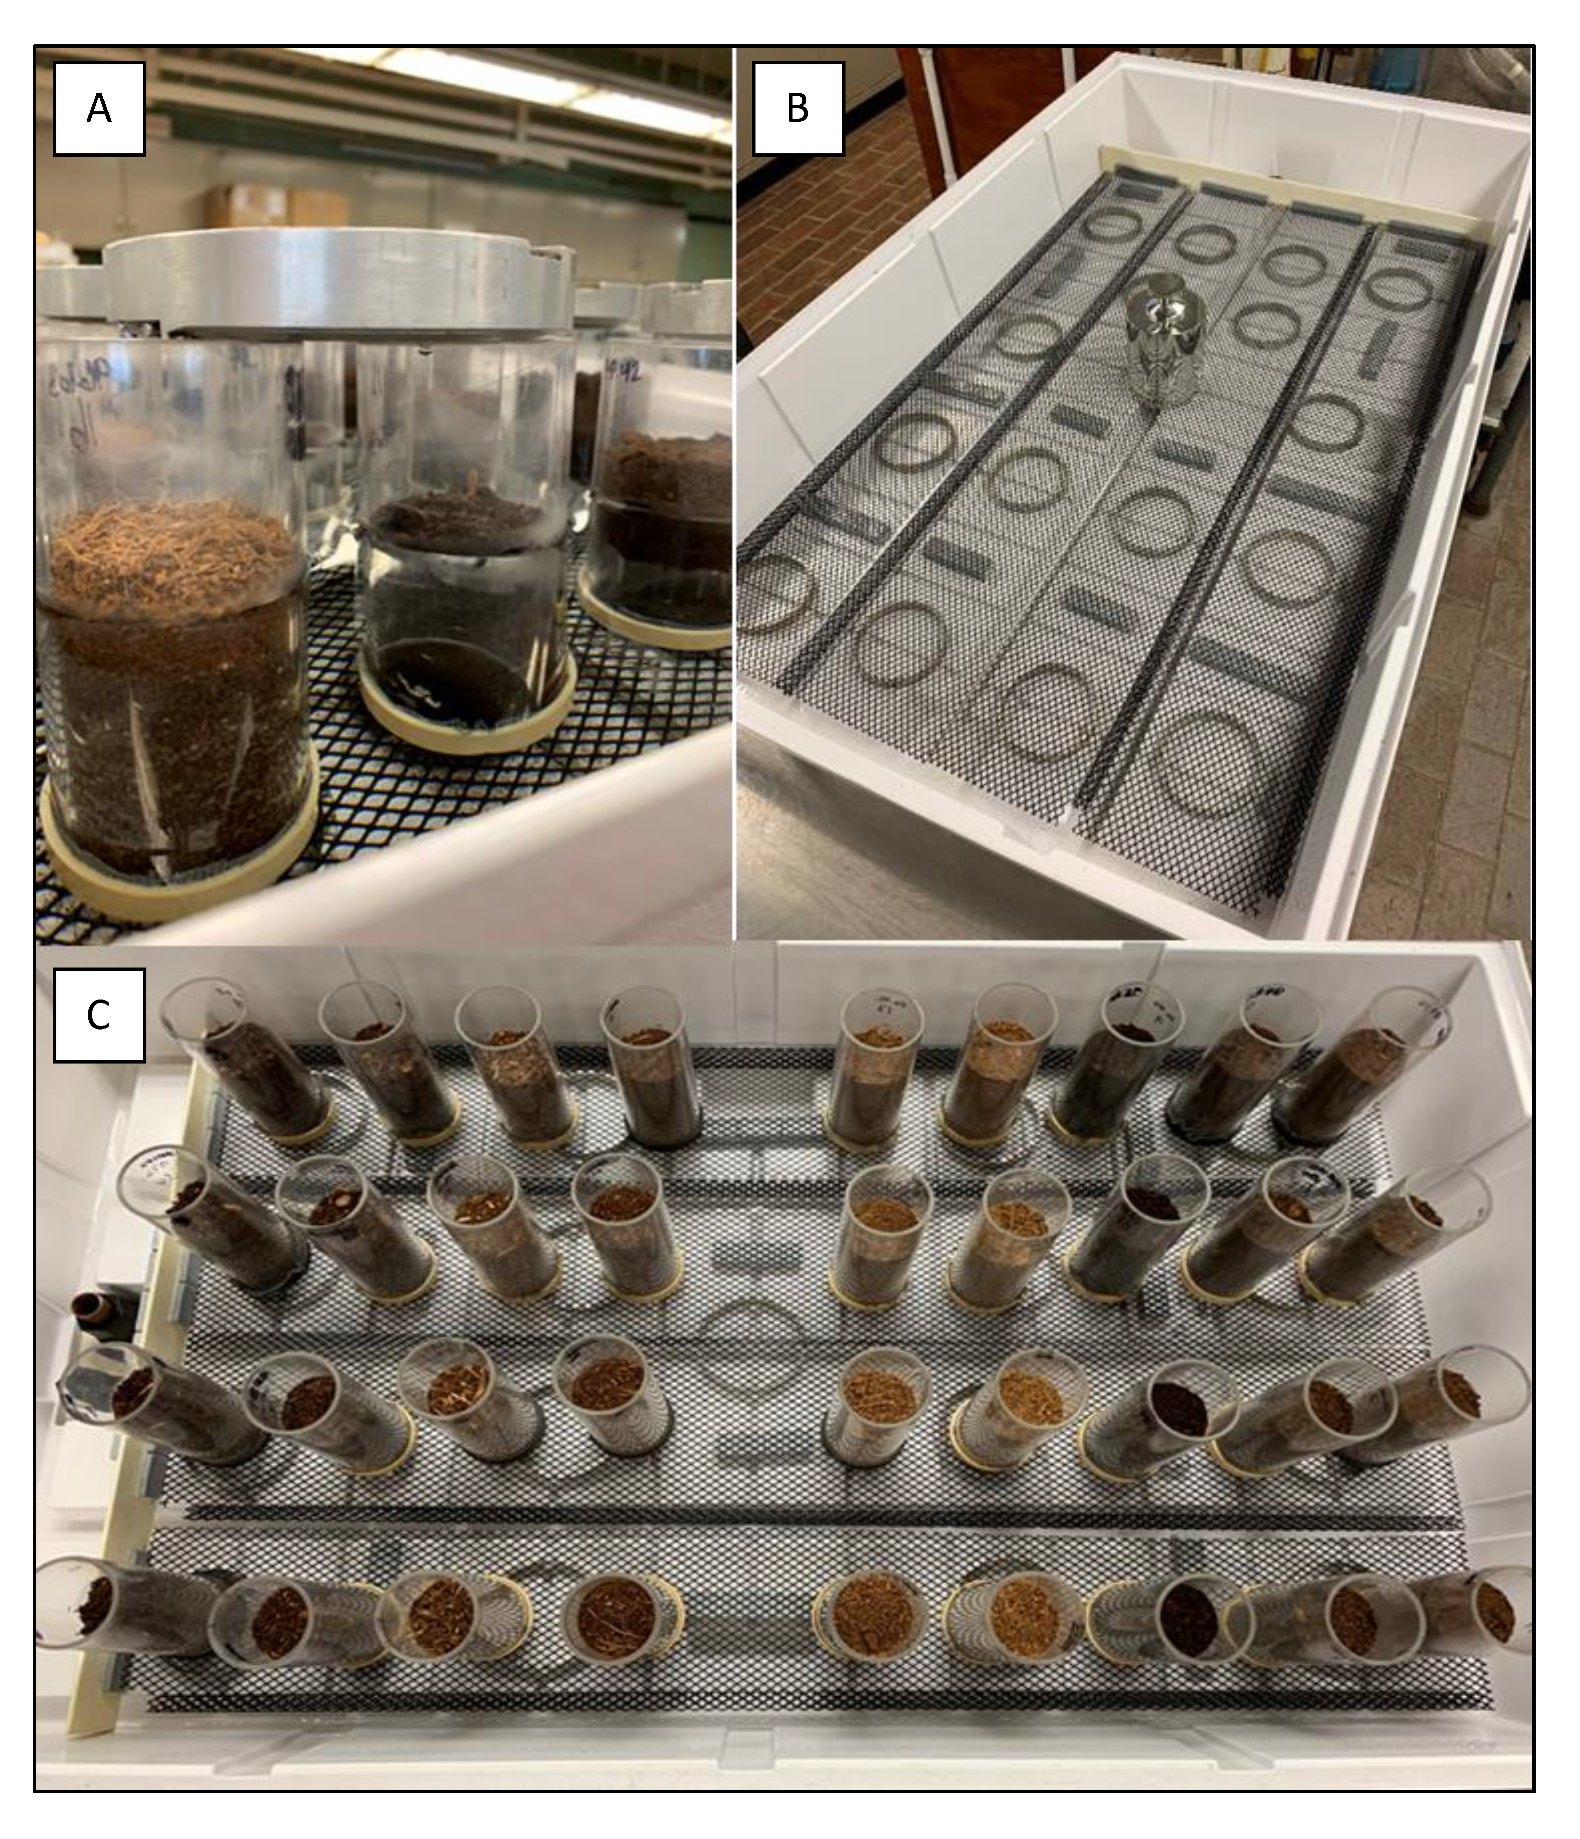
The transparent cylinders were packed with each substrate component to have a weight within 5% of other samples of the same component. To achieve this, cylinders were filled (by weight) with substrate then raised 12 cm off a flat surface, then tapped four times to bring the top of all 4 replications to 10 cm from the base of the cylinder, representing 200 mL of substrate and providing similar Db across all replications. With three substrates, at three IMCs, and four replications there were a total of 36 experimental samples. After the cylinders were packed, each was fitted with a diffuser and placed in the clamps held up by a ring stand, just under the separatory funnel (
Figure 1). Two hundred mls of water was poured into the separatory funnels and allowed to drip onto the surface of the substrate at an average rate of 40 mL min
−1, using the stopcock valve to control the flow. Water was applied in 10 individual hydration events. Substrates with an IMC of 33% required the rate of flow to be less to prevent ponding of water on the substrate surface which would have created a hydraulic head greater than 0.5 cm and alter the influence of any native hydrophobicity in the sample. Water was passed from the separatory funnel, through the diffuser, and onto the surface of the substrate. With the help of gravity, water was able to penetrate the surface of the substrate and percolate through the 10 cm depth. Some of the water volume was absorbed as it moved through the substrate, the rest was collected out of the bottom by a 250 mL beaker. After ~5 min, water flow ceased; the substrate was then held at equilibrium for two min. The effluent volume was measured and recorded while water retained was calculated by subtracting the amount of water applied (200 mL) from the amount of effluent captured. With the total event lasting ~7 min, 5 min time intervals were measured out in between events to keep treatments even. This procedure was repeated for each of the 10 hydration events.
2.4. Subirrigation
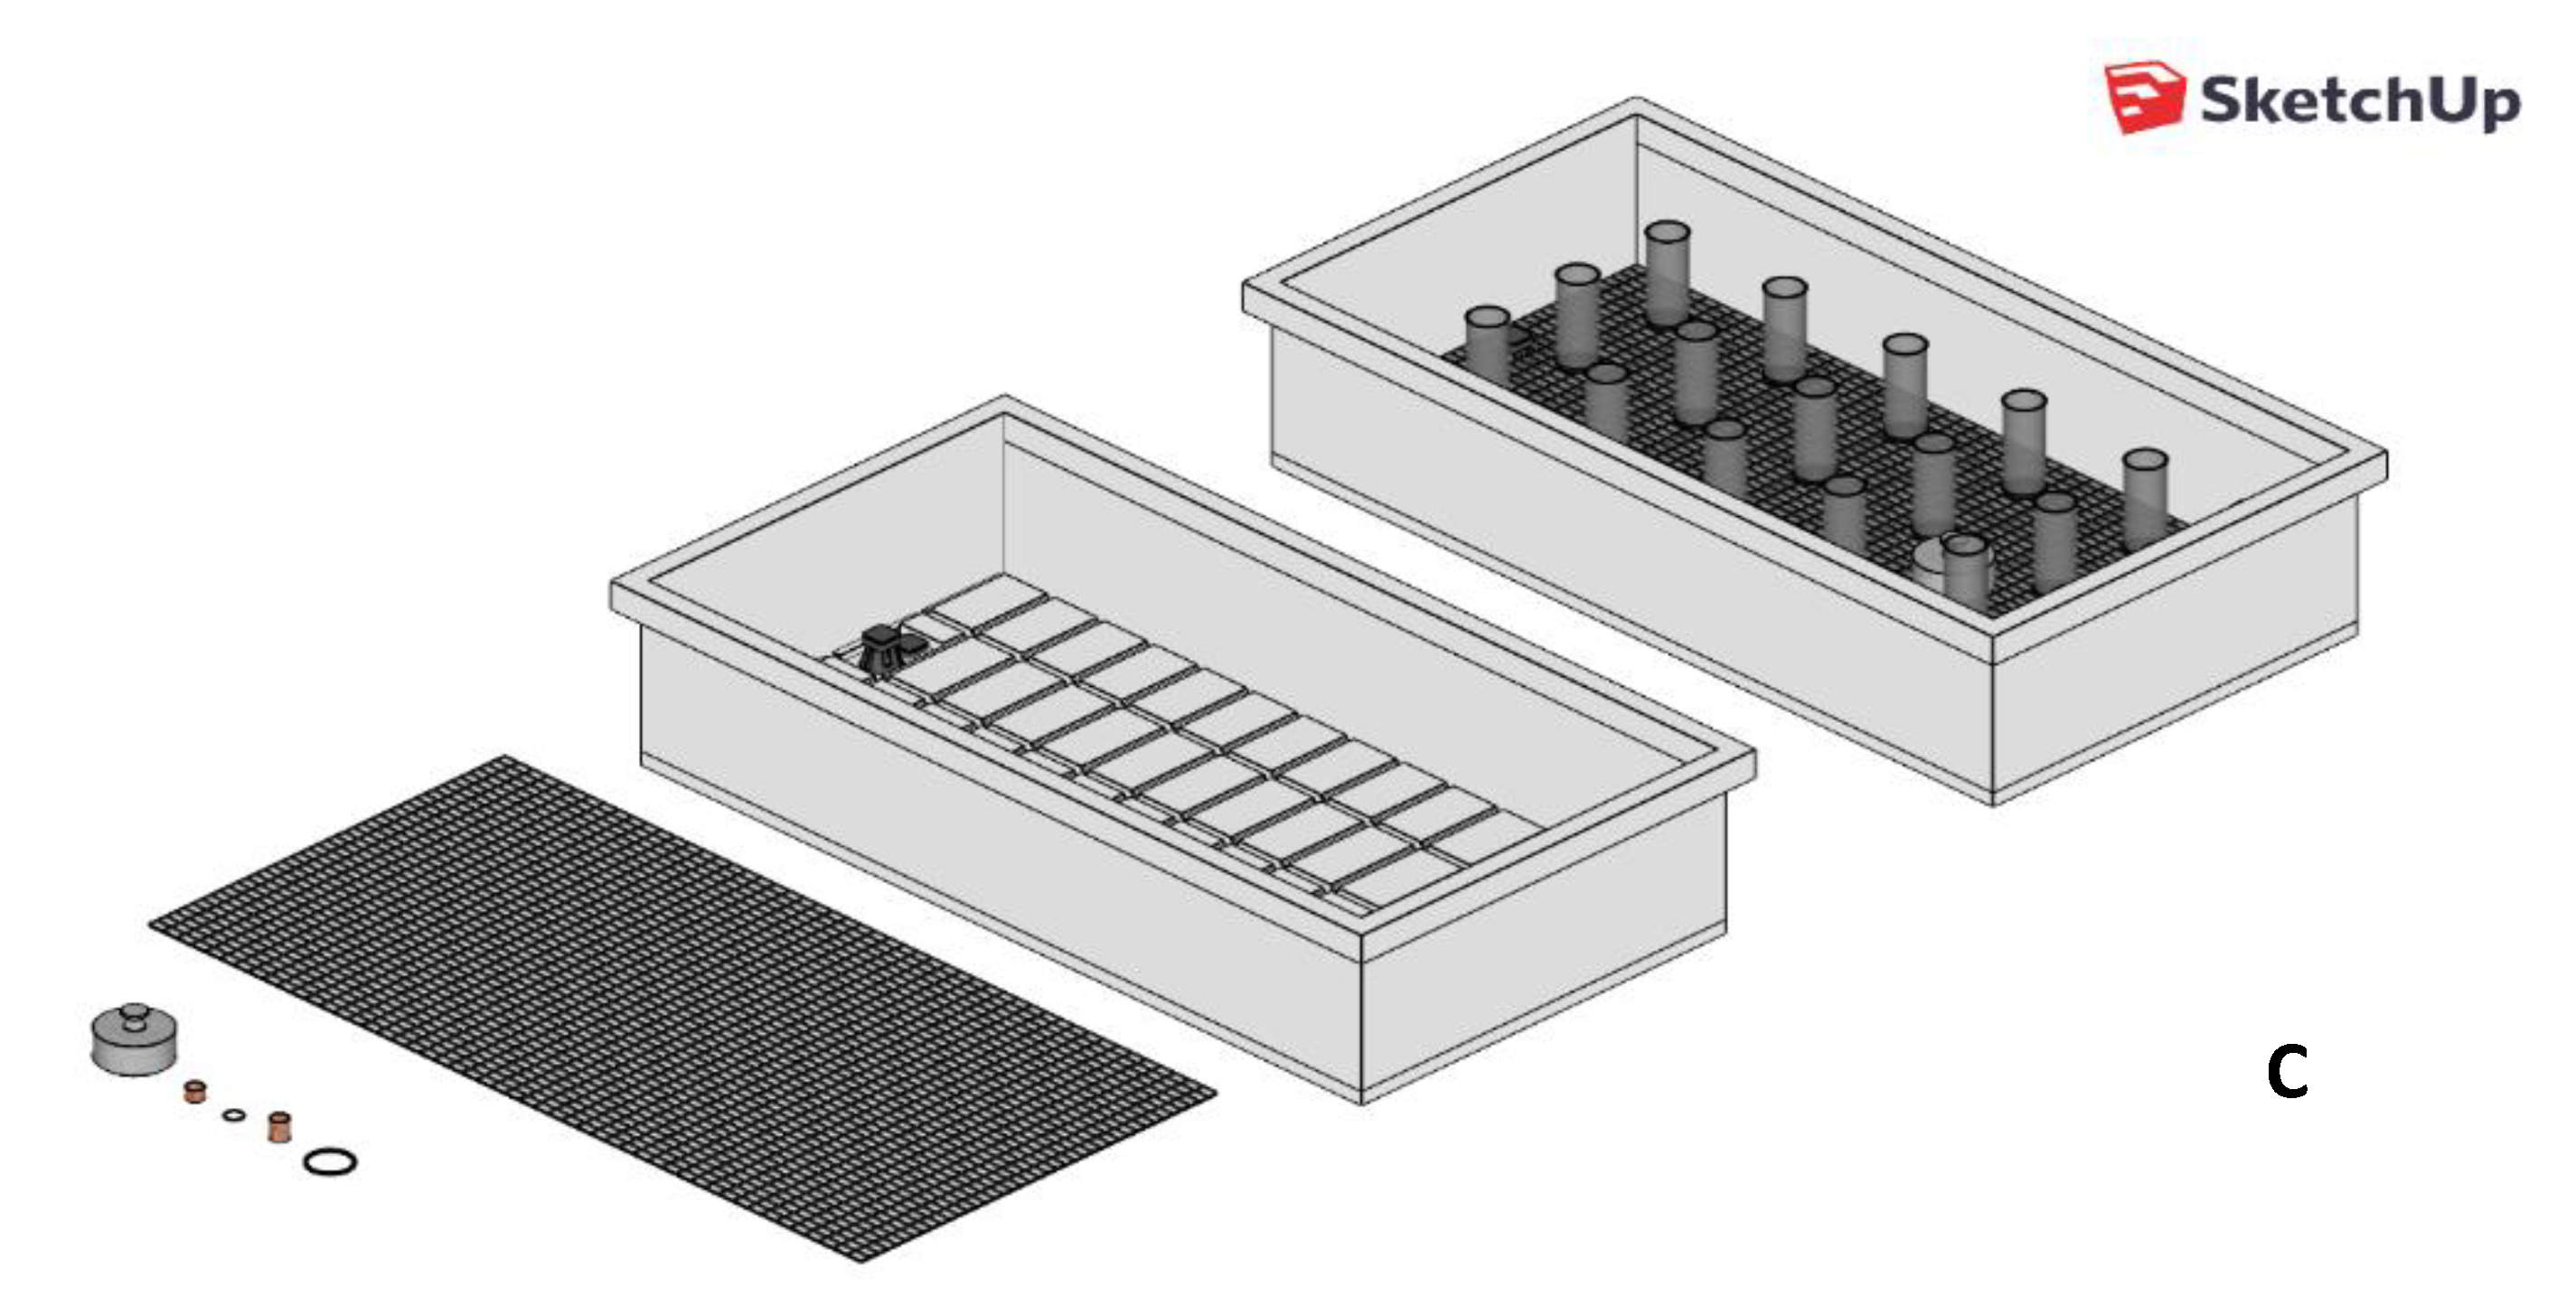
In order to understand how IMC influences substrate water capture through subirrigation, this experiment was conducted using materials and modified procedures described by Fonteno et al., [
12]. The same transparent cylinders as described in surface irrigation above were prepared in the same way (
Figure 2), The subirrigation method used an ebb and flood irrigation system (Hawthorn Hydroponics, Vancouver WA) 60.96 cm wide by 121.92 cm in length (
Figure 2). Water was introduced into this system via a faucet and controlled through a series of gate valves connected to the system (
Figure 3B). Water was maintained at a continuous height with a flow rate of ~21 L min
−1. To be able to control the height of the water while also having a steady flow into the bench, a standing copper pipe was cut to allow water to be held at 2.5 cm at a steady state (
Figure 2C).
The transparent cylinders were packed in identical manner as the samples used in the surface irrigation system. Cylinders were then placed on an elevated mesh screen to optimize the lower surface area exposure to water. The unit was then filled with water. It took approximately one minute for the water to reach the bottom of the cylinders and another minute for the water to reach 2.5 cm above the base. At that time, water flow input equaled output, allowing constant flow of water without a change in water level. The substrate samples were kept in the unit for five minutes for each of the hydration events. Once an event was finished, water drained from the unit for one minute before each cylinder was weighed. The weights were used to calculate the amount of water captured by the substrate by subtracting it from the initial weight of the packed cylinders. This procedure was repeated 10 times (10 hydration events), with a total time of hydration equaling 50 min.
2.5. Container Capacity
After the final hydration event was complete and final weights were taken, CC was then determined for each cylinder. The cylinders were returned to the ebb and flood unit (
Figure 2), and CC was determined using a modified version of the NC State University Porometer Method [
32]. After placed in the subirrigation unit, an aluminum weight of approximately 2 kg was placed on the top of each cylinder to prevent tipping and buoyancy (
Figure 3A). The samples were then saturated from below by allowing water to flow into the unit until it reached 1/3 of the height of the sample (three cm from the base of the sample). After two minutes, additional water was allowed to enter the unit until reaching 2/3 of the height of the cylinder, or six cm from the base of the cylinder. After an additional two minutes, the water was applied until reaching the top of the sample within the cylinder (
Figure 3A), 10 cm from the base of the cylinder. After saturating in the system for an additional 30 min, the water was drained and samples were reweighed to record changes in weight (water captured and retained). Samples were then placed into a forced-air drying oven at 105 °C for 48 h to dry, after which each sample was weighed and the dry weights were used to determine total water retained and IMC.
2.6. Water Capture Rate
Water CR was calculated for subirrigated substrates using a modified version of the flow rate formula to account for variables in this experiment, the equation was written as:
where CR is the mL/min of water captured by the substrate after one irrigation event, C
i [water capture (g) in the initial irrigation event] is the weight of the substrate after the present irrigation event (minus the weight of the cylinder), C
p (previous water capture in grams) is the weight of the substrate (minus the cylinder) taken after the previous irrigation (for the first irrigation event, C
p is equal to the pack weight of the cylinder (minus the weight of the cylinder), t is the amount of time per irrigation (in minutes). For surface irrigated samples that have a defined volume of water passing through the substrate, the equation was written as
where CR is the amount of water captured by the substrate after one irrigation per unit time (in mL min
−1), A
w is the amount of water applied to the substrate per irrigation event (in this case, 200 mL), E is the effluent captured after the individual irrigation event (in mL), t is the amount of time per irrigation event (minutes).
2.7. Water Capture Curves
The IMCs of 33%, 50%, and 67% were all determined by weight. Wettability curves were determined by VWC to describe the amount of water contained within the substrate. These curves show a VWC reading at event zero, and represent the percent VWC at the IMC. Therefore, an IMC of 50% (by weight) was actually 12% to 15% v v−1 (moisture) for peat. For coir, an IMC of 50% ranged from 9% to 11% v v−1, and for pine bark (at 50% IMC) they were 16% to 18% v v−1.
2.8. Capture Efficiency Values
In order to provide both statistical and numeric comparisons, water capture efficiency of the substrates was described in three ways: (1) first hydration, (2) final hydration and (3) CC. First hydration was the amount of water absorbed by the substrate after one irrigation event, and compared across all substrates and moisture levels. Final hydration was the amount of water absorbed by the substrate after the tenth irrigation event. Container capacity was the maximum water content the sample could hold after saturation and drainage. Physical properties of the substrates, including CC, AS, total porosity (TP), and bulk density (Db) were derived using the NC State University Porometer method [
20] with three representative samples of each substrate, and CC is reported in
Table 2.
Statistics were determined using SAS v. 9.4 (SAS Institute; Cary, NC, USA). A Tukey’s HSD test with alpha = 0.05 was used to identify differences and similarities between substrates at individual IMCs and irrigation events. This test also determined the similarities and differences of CC, first hydration, and final hydration across substrates, IMCs, and irrigation techniques. Both linear and quadratic regression was performed and significance was determined using p values with significance ranging from > 0.001 to 0.05. An analysis of variance test was conducted to test the effects of initial IMC and irrigation technique on CC, first hydration and final hydration within individual substrate components.
4. Discussion
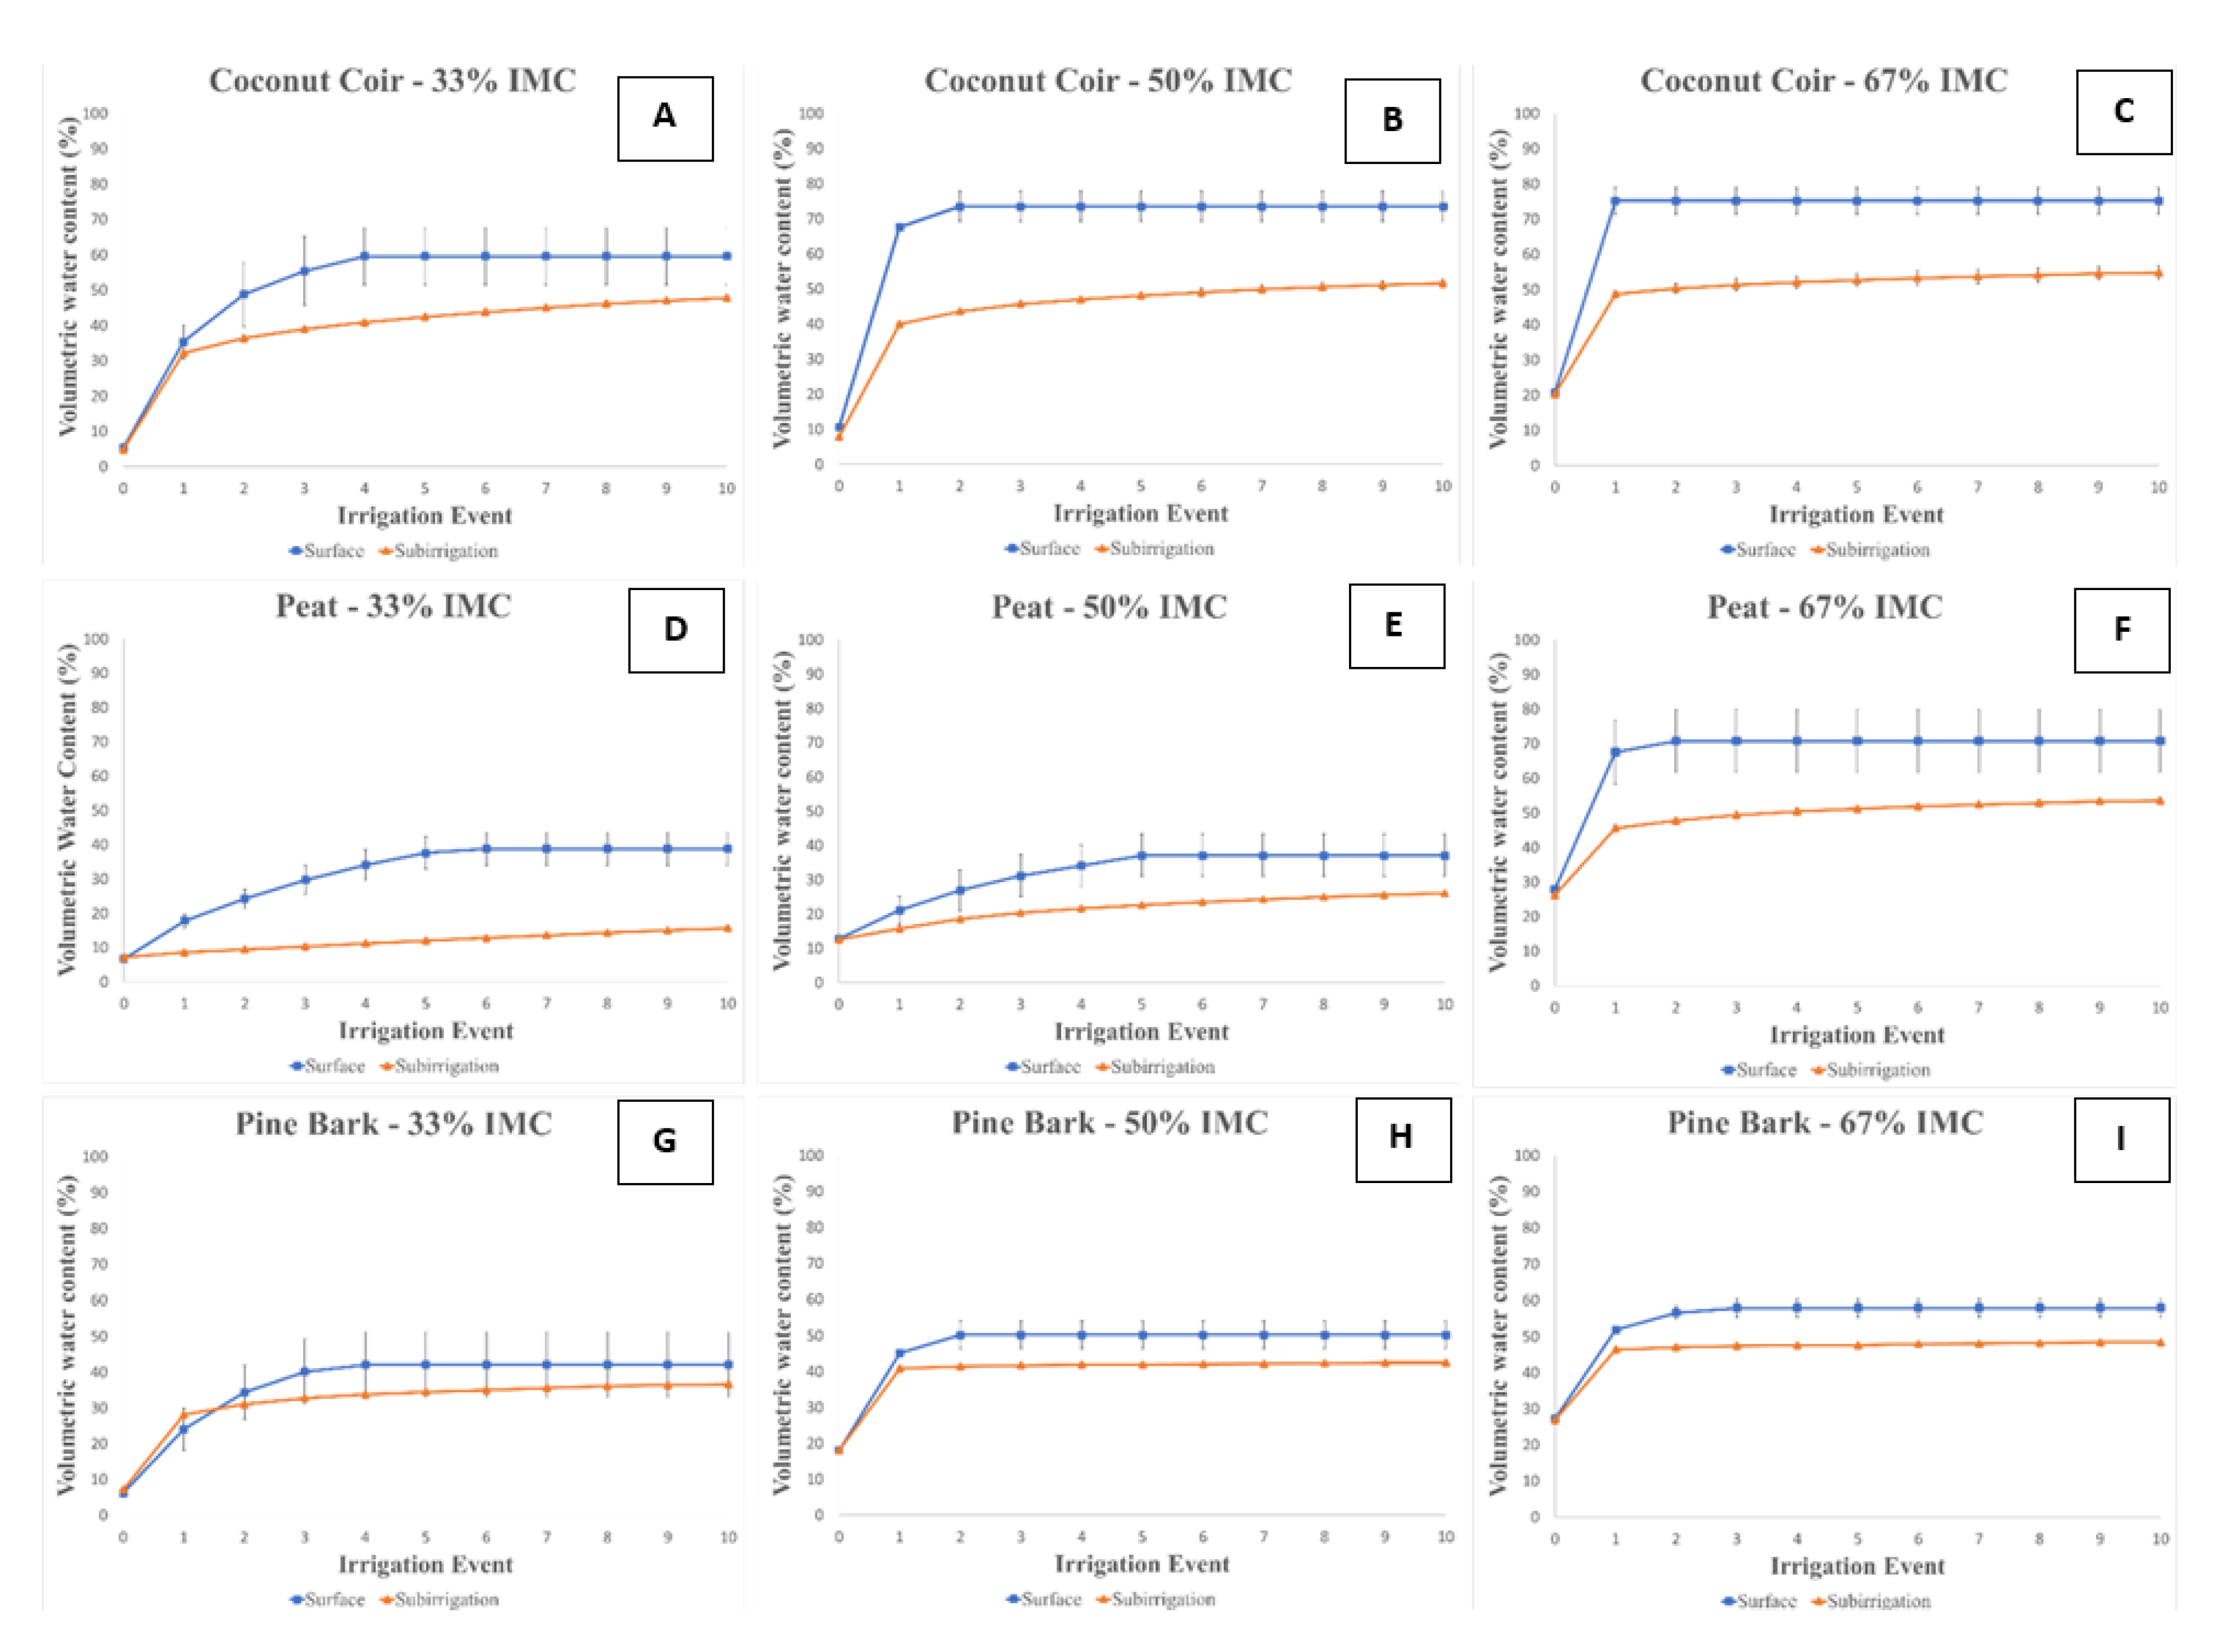
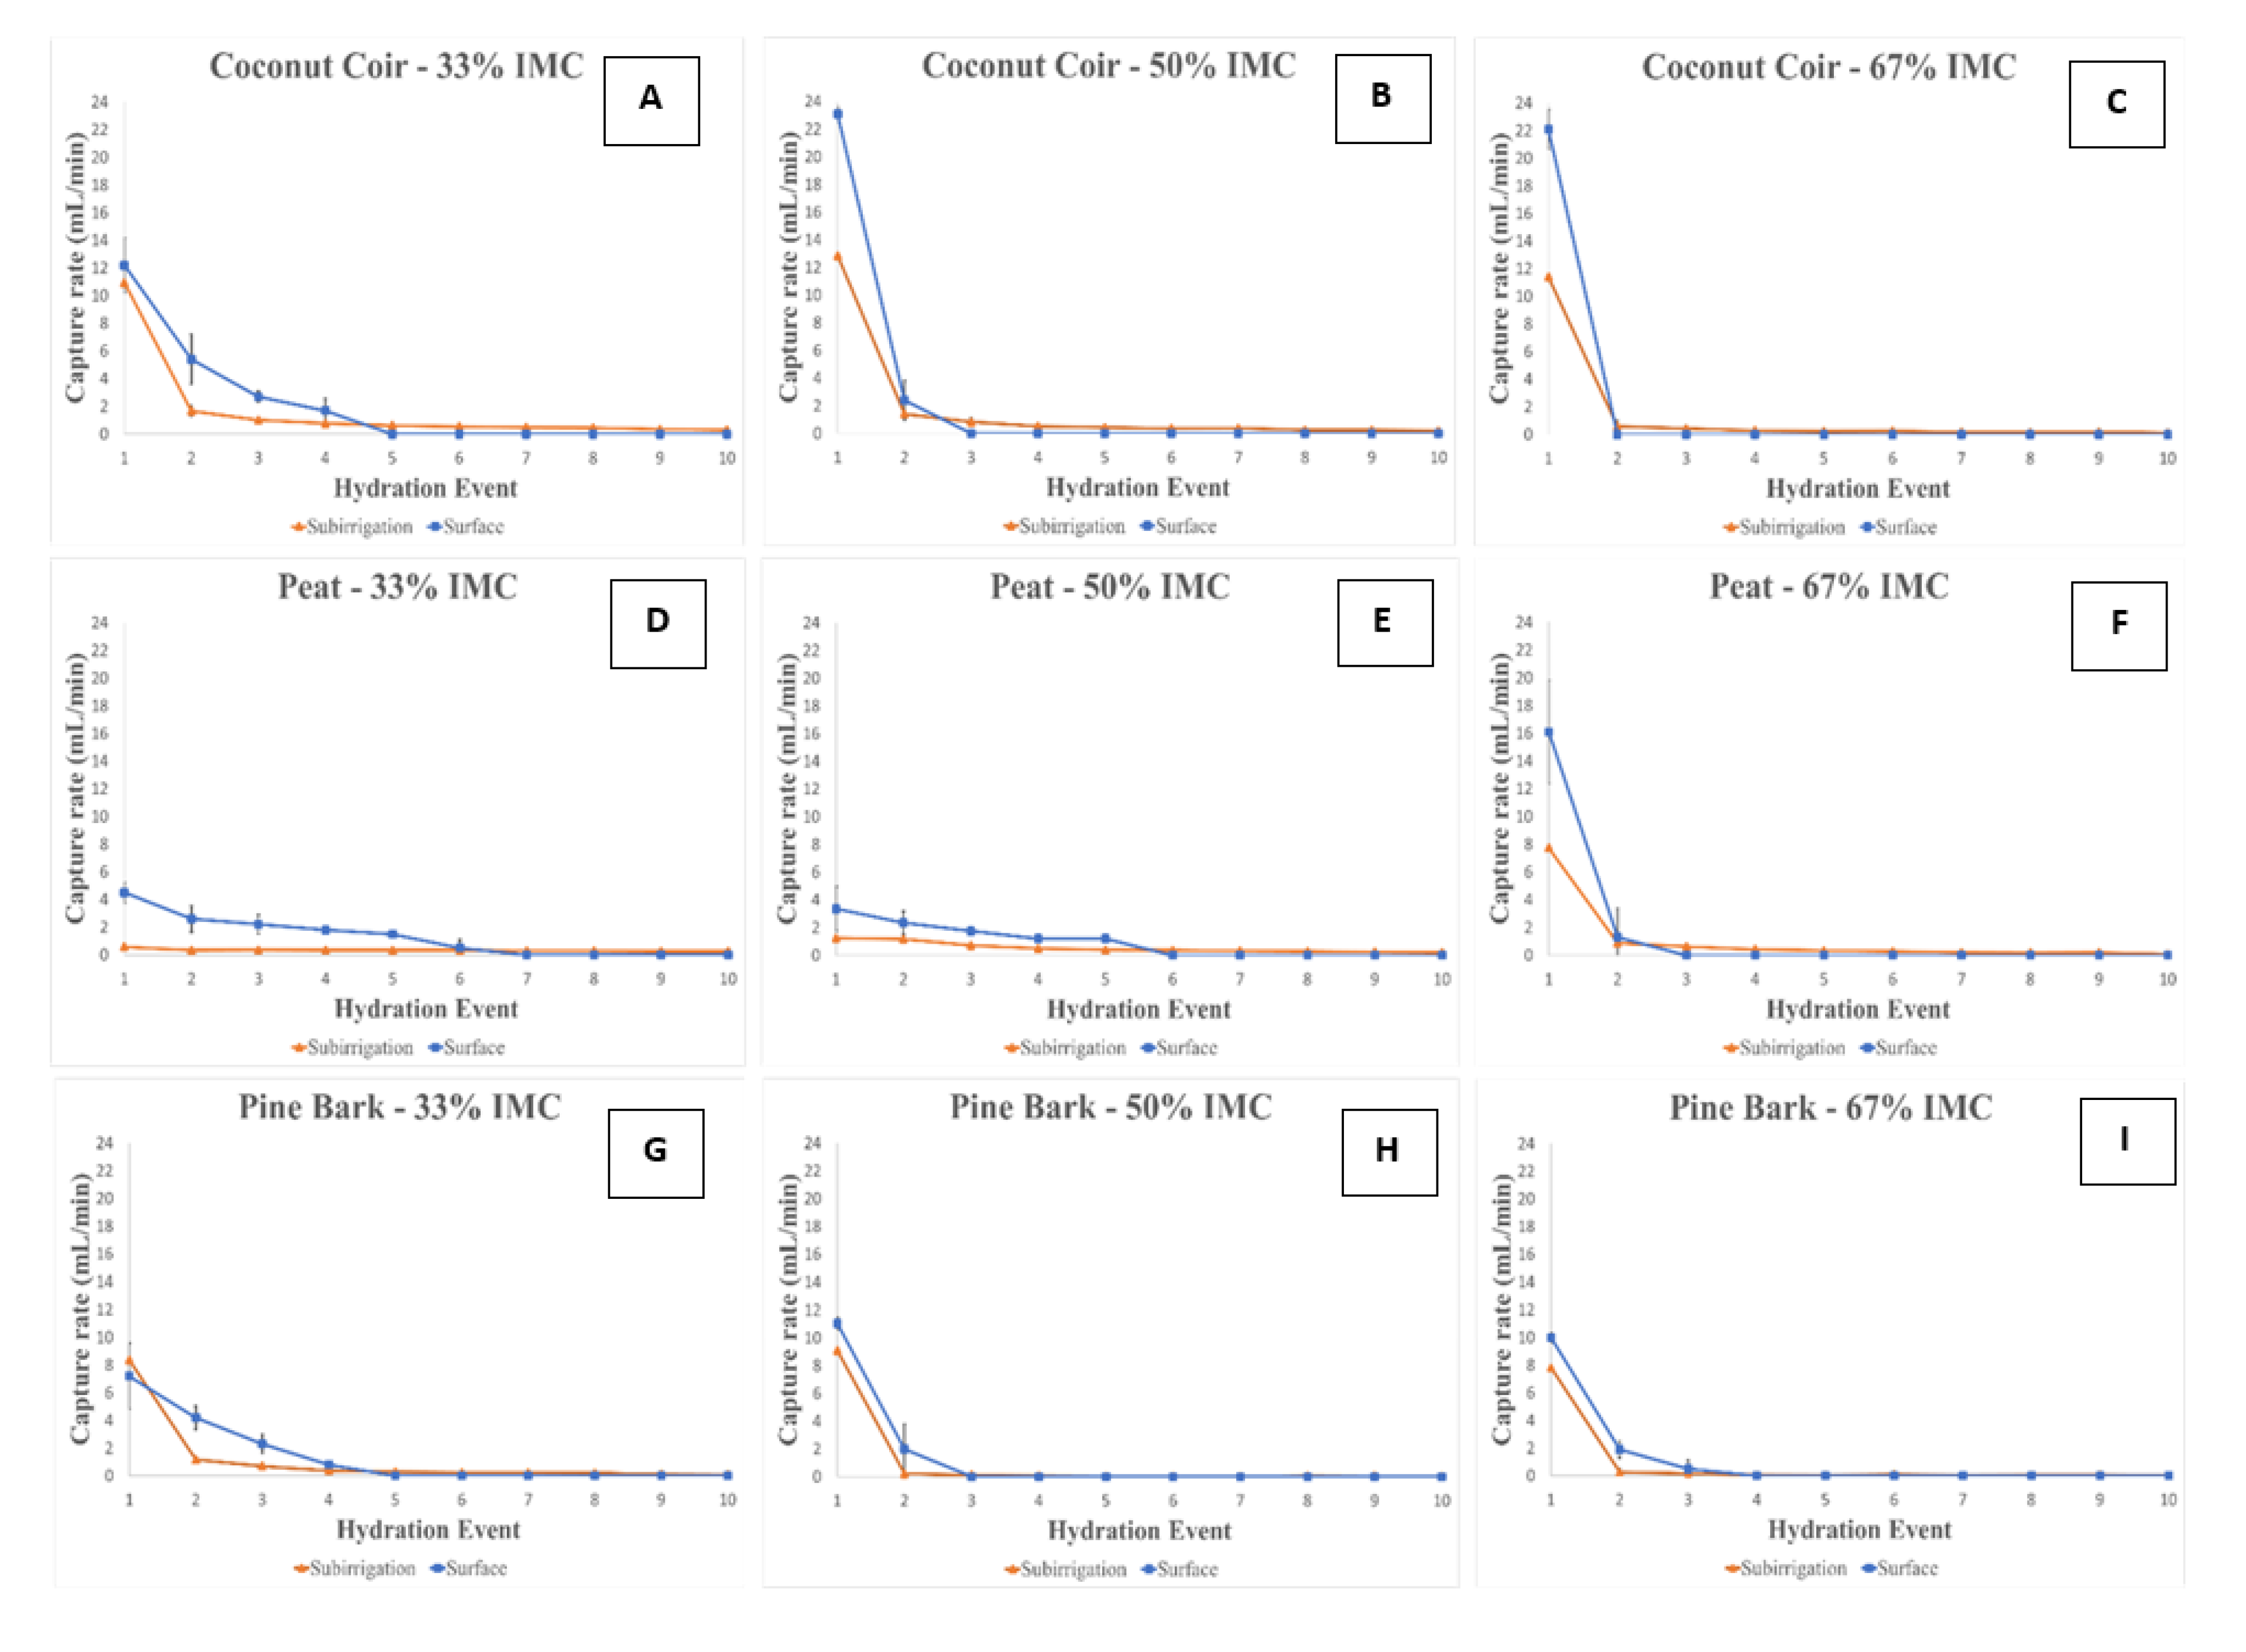
From the data in
Figure 4 and
Figure 5, it appears that initial moisture content prior to the first irrigation event had the overall greatest effect on the water capture and retention of peat, coir, and pine bark across both irrigation techniques. The container capacity of pine bark and coir were less affected by irrigation technique than peat. Surface irrigation provided the highest water capture in the first hydration across nearly all substrates and IMCs. Peat had higher initial and final hydration values with surface irrigation compared to subirrigation over all IMCs.
At all initial moisture levels, coir was able to take up water. However, IMC altered the intensity of imbibition. With surface irrigation, coir at 33% IMC needed four irrigation events to reach its maximum of 60% VWC. At 50% IMC, coir needed two irrigation events, and at 67% IMC it needed just one for water capture to equal CC. Coir is known to be very hydrophilic, having a sponge-like ability to capture and hold water [
33]. Surface irrigation has the additional potential of gravity to draw water through the substrate, allowing droplets to travel a path of least resistance. This allows water to move through macro and mesopores to hydrate the substrate. Conversely, with subirrigation, water must travel via capillary action and against gravity, along particle surfaces and through mostly micro-pores [
34]. Initial moisture content did not have an effect on coir CC. With 92% of coir particles ranging from 2 mm or less (
Table 1), water retention was very high.
For peat, IMC had the greatest influence on the substrate’s ability to capture water with surface irrigation. As is well documented, intensity of hydrophobicity of peat increases at lower substrate moisture contents. These hydrophobic intensities can influence rewetting and impair the physical properties of the substrate [
35,
36]. At 33% IMC and 50% IMC, peat had difficulty hydrating through the first five irrigation events (
Figure 4A). In the case of peat at 33% IMC and irrigated from the surface, water delivery from the separatory funnel had to be slowed to reduce ponding of water on the surface and increasing the hydraulic head at the substrate surface. For perspective, the first hydration at 33% IMC and 50% IMC through surface irrigation for peat was 17.8% and 21.1% (
Table 2) respectively, while the first hydration of coir at the same moisture levels reached 35.4% and 67.6% respectively (
Table 2). It wasn’t until 67% IMC that peat began to capture and retain water during surface irrigation. The large proportion of coarse particles may relate to a greater portion of macro-pores in peat than coir (
Table 1). These larger pores allowed surface irrigated water to preferentially flow through peat, even at lower initial moisture levels. Water moved through the large pores with less wetting of the substrate matrix due to increased intensity of hydrophobicity of the peat at both 33% IMC and 50% IMC Conversely, with subirrigation, at 33% IMC, peat was unable to eclipse 13% VWC after 10 irrigation events, representing the lowest first hydration of all treatments. At 50% IMC, peat reached 23% VWC with a final hydration of 37.1% VWC and a CC of 58.0 (
Table 2). Compared to coir, irrigation method and IMC both impacted the CC of peat. However, at 67% IMC, the substrate absorbed water in the first irrigation event. The capture potential, or total volumetric water captured, of peat was nearly 40% less than that of coir.
In pine bark, an increase in fine (greater than 0.5 mm) particles has been shown to greatly influence the physical properties (AS and CC), while larger particle sizes had a minor influence on physical properties [
9]. Larger particles, for surface irrigation, may provide water with more channels to move through the container, better hydrating the bark as pine bark just doesn’t have as much surface area/microporosity for absorption. However, micro and meso-pores have higher abilities to capture and retain water. Larger pore sizes tend to drain more easily under gravitational potentials than smaller pores [
37]. Pine bark can have variable properties based on processing, and it can have more AS, lower TP and easily available water than both peat and coir [
38]. Pine bark had the most similar water capture and retention across all IMC and, aside from 33% IMC, reached their maximum VWC in the first two irrigation events.


