Seasonal Variation of Soil Respiration in the Mongolian Oak (Quercus mongolica Fisch. Ex Ledeb.) Forests at the Cool Temperate Zone in Korea


1
Department of Biology, Graduate School of Seoul Women’s University, Seoul 01797, Korea
2
Center for Atmospheric and Environmental Modeling, Seoul National University Research Park, Seoul 08826, Korea
3
Faculty of Environment and Life Sciences, Seoul Women’s University, Seoul 01797, Korea
*
Author to whom correspondence should be addressed.
†
Present Address: National Institute of Ecology, Seocheon 33657, Korea.
Forests 2020, 11(9), 984; https://doi.org/10.3390/f11090984
Submission received: 21 July 2020
/
Revised: 9 September 2020
/
Accepted: 9 September 2020
/
Published: 12 September 2020
(This article belongs to the Special Issue Forests Carbon and Water Dynamics)
Abstract
:To investigate the variation in seasonal soil respiration (SR) as a function of soil temperature (Ts) and soil water content (SWC) in Mongolian oak (Quercus mongolica) forests in urban (Mt. Nam) and well-reserved (Mt. Jeombong) areas in South Korea, we conducted continuous field measurements of SR and other environmental parameters (Ts and SWC) using an automated chamber system. Overall, the SR rates in both stands were strongly correlated with the Ts variable during all seasons. However, abrupt fluctuations in SR were significantly related to episodic increases in SWC on a short time scale during the growing season. The integrated optimal regression models for SR using Ts at a depth of 5 cm and SWC at a depth of 15 cm yielded the following: the SR rate in Mt. Nam = SR(Ts) + ΔSR(Ts) = 104.87 exp(0.1108Ts) − 10.09(SWC)2 + 604.2(SWC) − 8627.7 for Ts ≥ 0 °C, and the SR rate in Mt. Jeombong = SR(Ts) + ΔSR(Ts) = 95.608 exp(0.1304Ts) − 33.086(SWC)2 + 1949.2(SWC) − 28499 for Ts ≥ 0 °C. In both cases, SR = 0 for Ts < 0 °C. As per these equations, the estimated annual total SRs were 1339.4 g C m−2 for Mt. Nam and 1003.0 g C m−2 for Mt. Jeombong. These values were quite similar to the measured values in field. Our results demonstrate that the improved empirical equation is an effective tool for estimating and predicting SR variability and provide evidence that the SR of Q. mongolica forests in the cool temperate zone of Korean Peninsula depends on Ts and SWC variables.
1. Introduction
Carbon dioxide (CO2) efflux from the soil to the atmosphere (hereafter, referred to as soil respiration, SR) is one of the major pathways in the global carbon (C) cycle [1,2,3,4]. Potential SR rate changes in response to environmental conditions could either accelerate global warming driven by rising atmospheric CO2 concentrations (via SR) or mitigate climate change by enhancing ecosystem C sequestration [5,6,7]. However, the high temporal-spatial variations in SR make it difficult to evaluate the soil C budget on a global scale and to quantify the feedback relationships with global warming and climate [8,9]. If we are to accurately predict ecosystem responses to climate change, it is crucial to quantify the processes of SR on the local scale by using high-resolution data and high frequency measurements [10,11,12].
Forests are regarded as significant CO2 sinks [13,14,15,16], not only covering ~30% (4.2 × 10⁹ ha) of the global land area [17], but also containing over 80% of all aboveground vegetation C and ~40% of all belowground soil C [18,19]. Given these large amounts and capacities in the forest C pool, small changes in the C balance between forest ecosystem production and respiration could have significant impacts on the global C cycle.
Soil respiration originates from both autotrophic (living roots associated with the rhizosphere) and heterotrophic (soil microbes and fauna) respiration and is therefore a biological process and important component in the forest C cycle [20,21,22]. Soil respiration has been reported to contribute from 30% to 80% of the total ecosystem respiration in forests [23,24,25]. The SR rate is primarily correlated with the two environmental factors temperature (T) and soil water content (SWC) via rainfall, which varies on hourly, diel, seasonal, and annual timescales [26,27]. Thus, many studies have focused on the relationships between these two main factors (T and SWC) and the SR rates on different temporal scales or in different forest regions [28,29,30,31,32]. Temperature is a strong factor driving diurnal and seasonal SR rate variations in the world’s soils [33,34,35]. If SWC is not limiting, the SR rate typically increases with T [36,37], although its sensitivity to T markedly varies with regional and temporal changes [25]. The SWC factor regulating SR rates is related to complex interactions in forest ecosystems, and is often confused with the response of SR to the T variable [38]. Drought conditions in forest soils due to evapotranspiration exceeding rainfall can cause abrupt regional changes in SR [39,40]. However, our understanding of how SWC affects temporal changes in SR in forest ecosystems remains limited [10,38].
About 65% (6.3 × 10⁶ ha) of the total land area of South Korea is forested. In particular, the Mongolian oak (Quercus mongolica Fisch.) forest is one of the dominant broad-leaved deciduous forest types in the cool temperate regions of the Korean Peninsula [41,42]. Carbon sequestration in Q. mongolica forests has functioned as a large sink for atmospheric CO2 [12,14,43]. A few studies have performed quantitative evaluations of the SR and C dynamics within Q. mongolica-dominated forest areas using manual chamber methods and short-term measurement periods, mainly during the day or on clear days (e.g., [44,45,46]). However, there is not enough information on the seasonal, daily, and annual trends in SR and the many uncertainties regarding the potential effects of environmental factors on them. Thus, the continuous acquisition of SR data using automated chamber methods such as an automated opening and closing chamber system (AOCC) to acquire short-and long-term measurements is necessary to accurately quantify the temporal variabilities in SR rates associated with changes in various environmental factors [12].
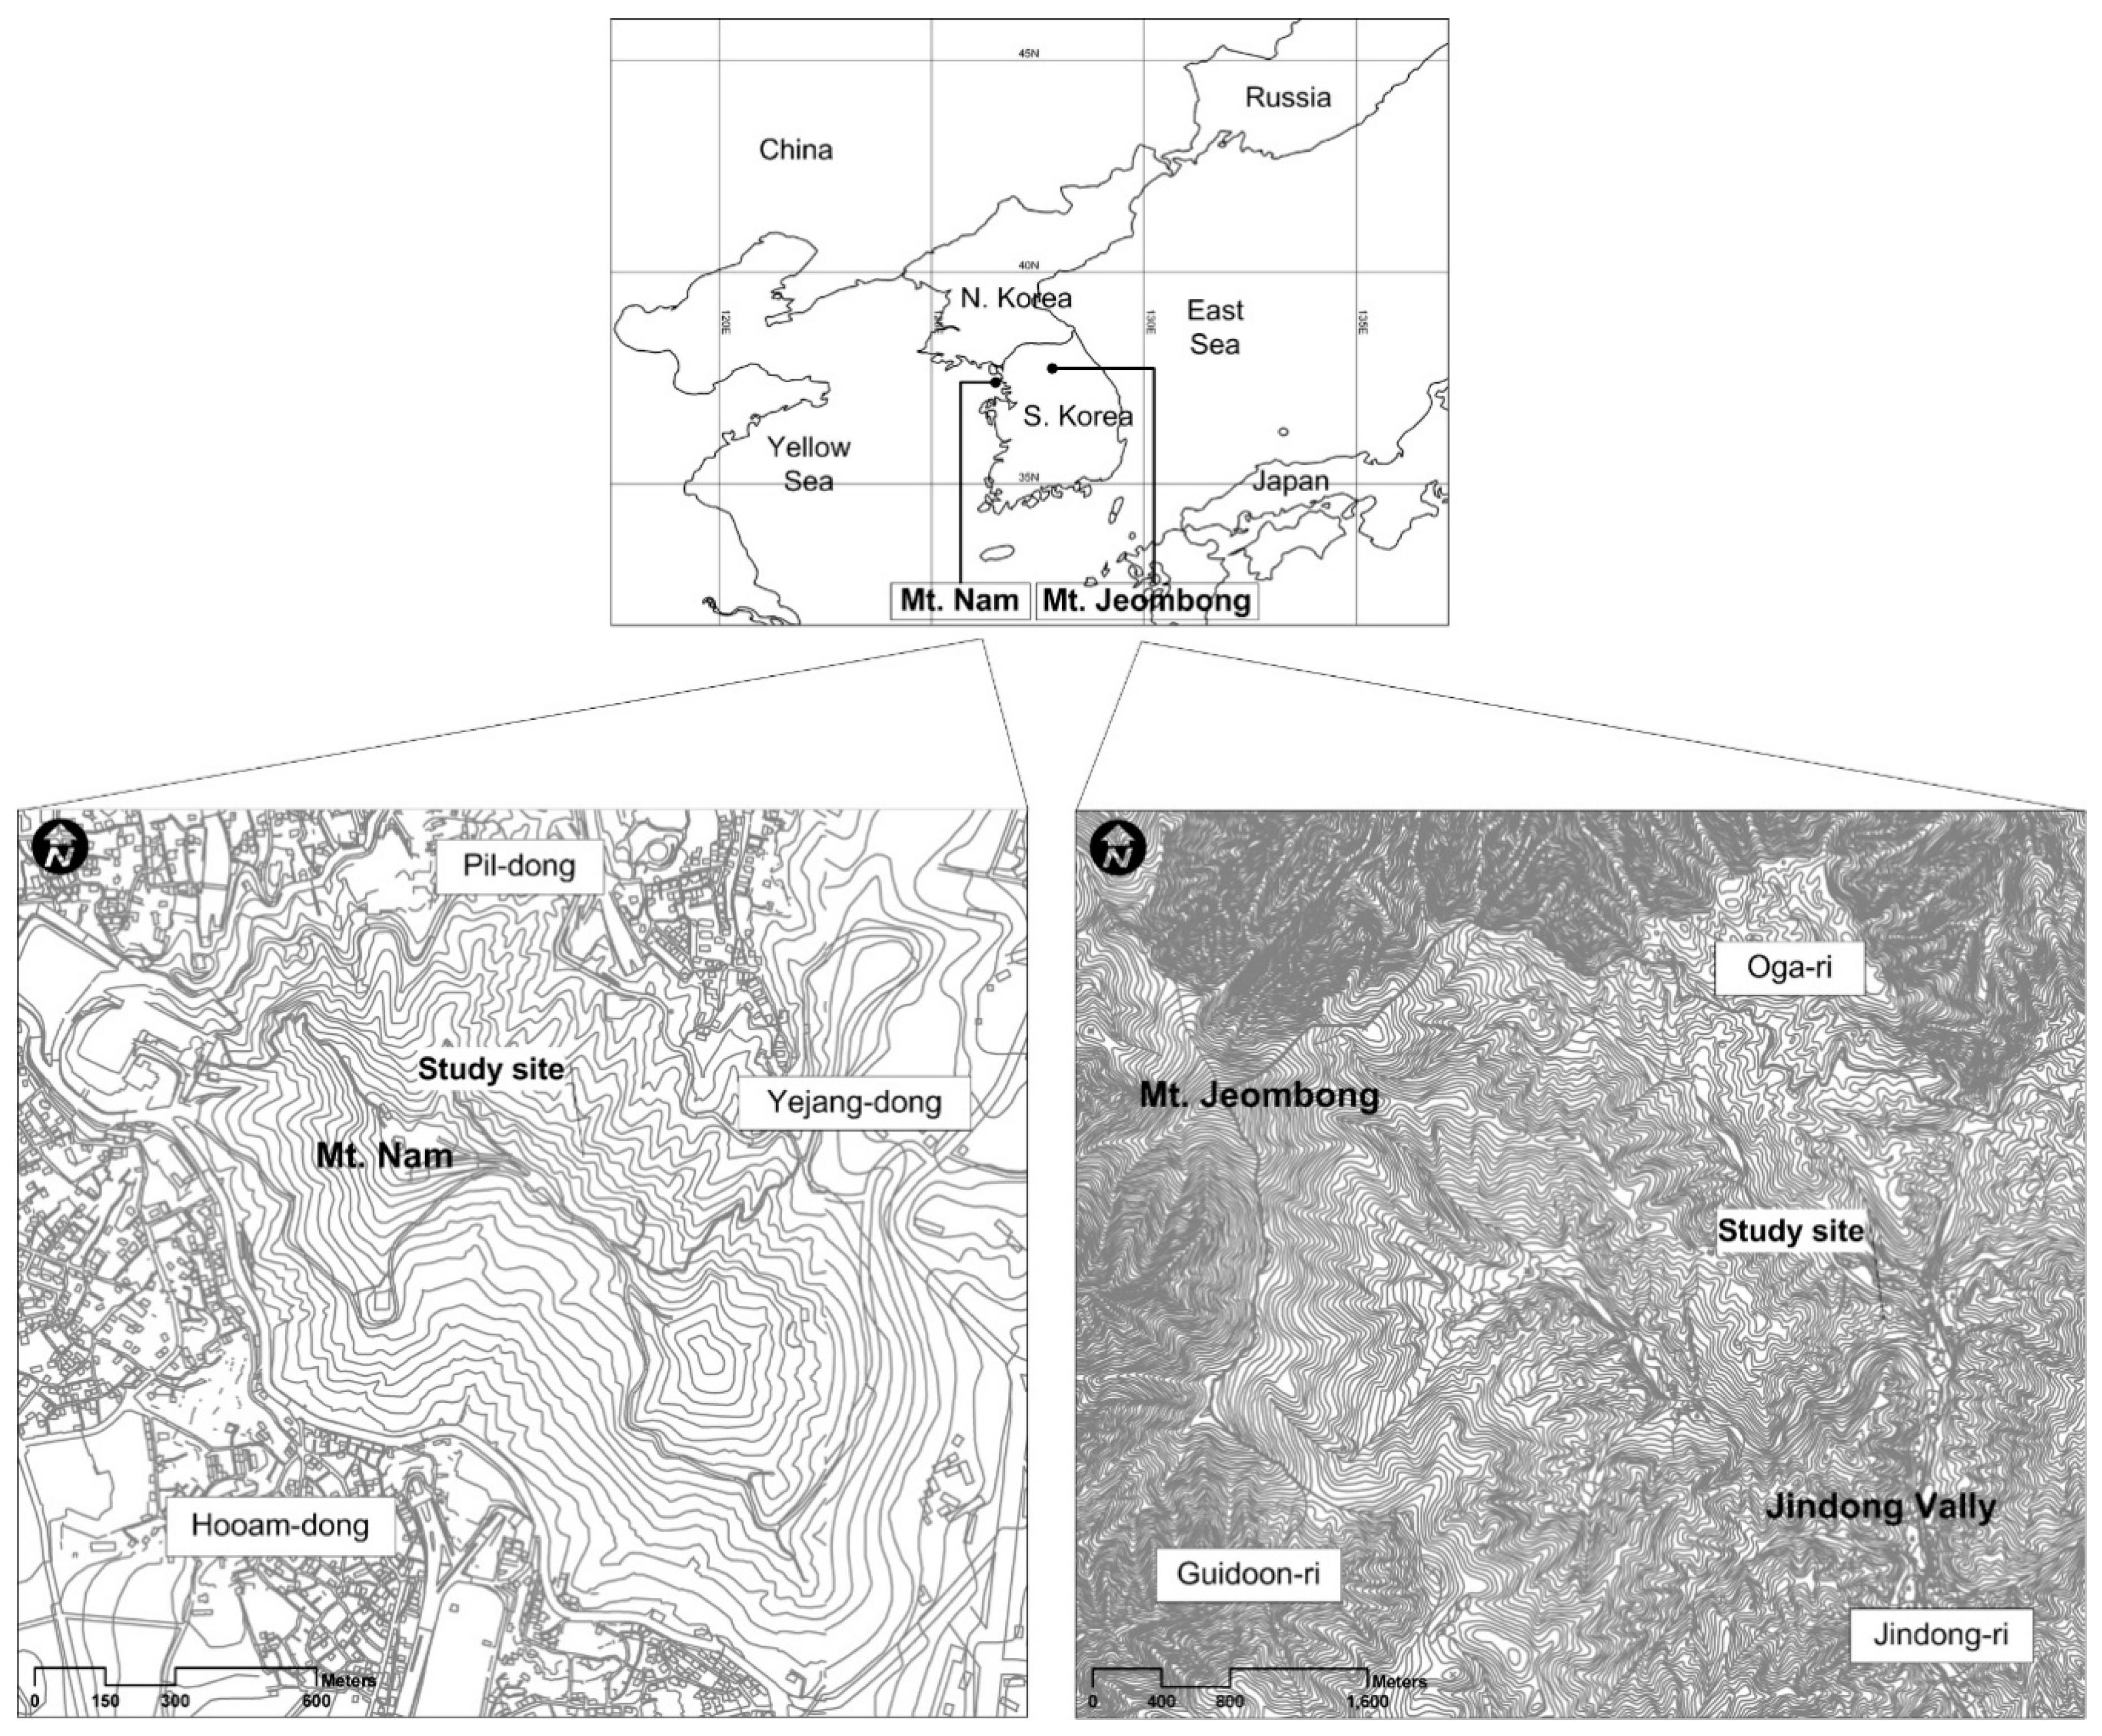
The Mt. Nam and Mt. Jeombong experimental sites were designated as the representative cool-temperate broad-leaved deciduous forest sites for the Korean National Long-term Ecological Research (KNLTER) program in central western and central eastern Korea (Figure 1). Eco-towers for long-term monitoring, which included automated meteorological instruments and AOCCs, were established at the experimental sites to take continuous measurements of the ecosystem CO2 flux, SR rates, and various meteorological variables in Q. mongolica forests [12,47].
The specific objectives of this study were (1) to improve the empirical models for SR in Mongolian oak (Q. mongolica) forests derived from high-temporal frequency SR, temperature (T), and soil water content (SWC) measurements and (2) to investigate seasonal variations in SR in two Q. mongolica forest stands located in central western (Mt. Nam) and central eastern (Mt. Jeombong) Korea and their dependence on T and SWC.
2. Materials and Methods
2.1. Study Site
2.1.1. Mt. Nam
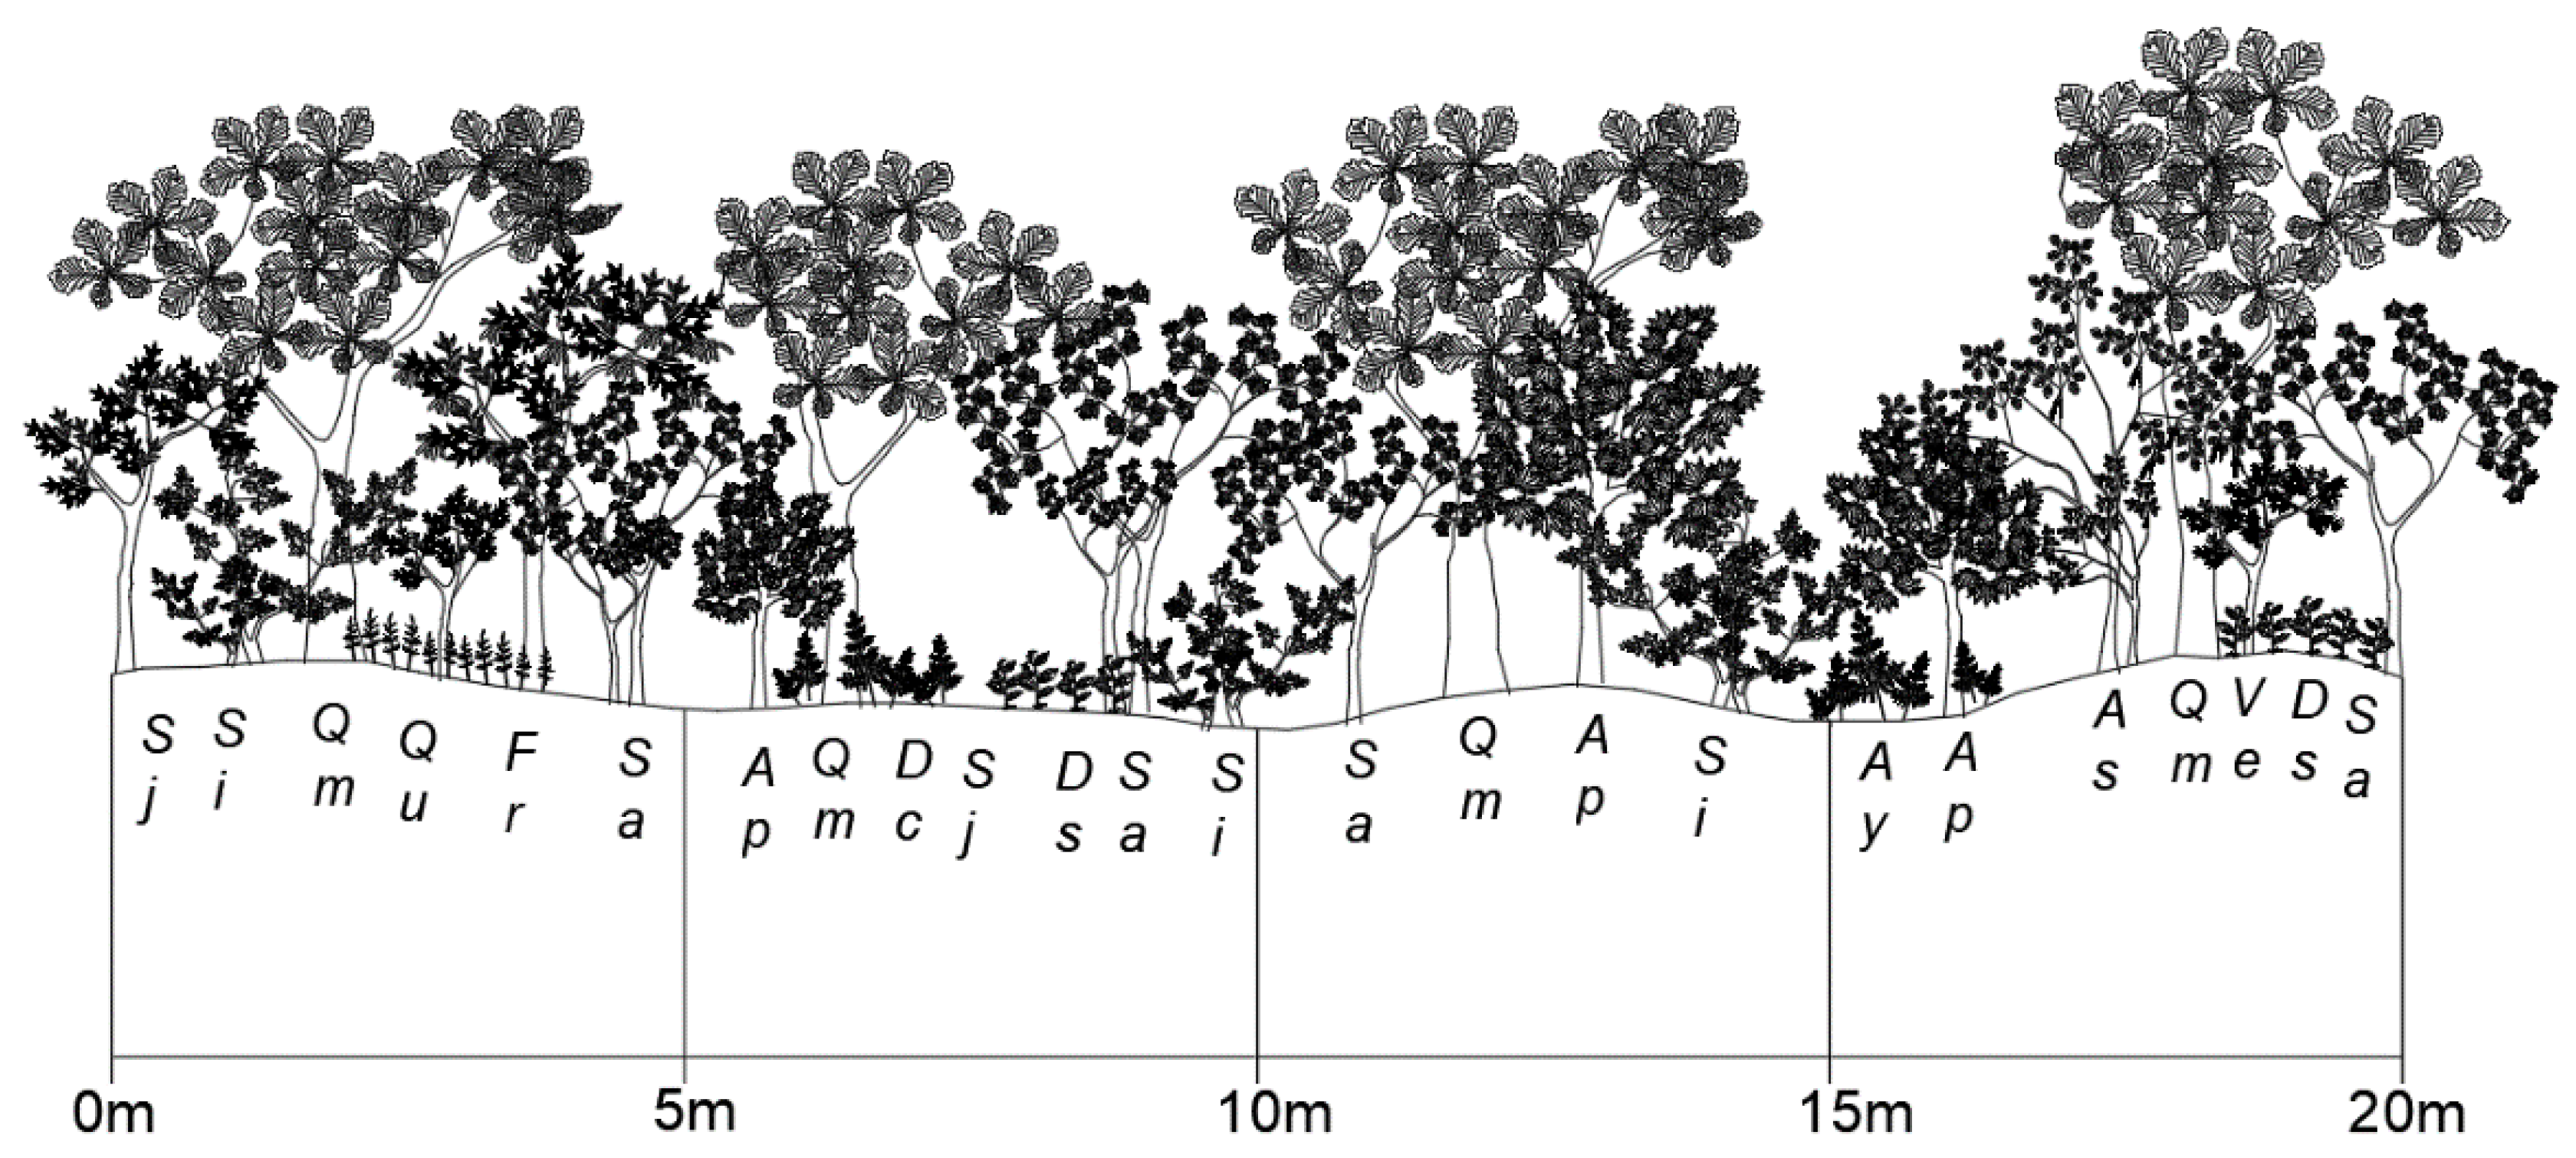
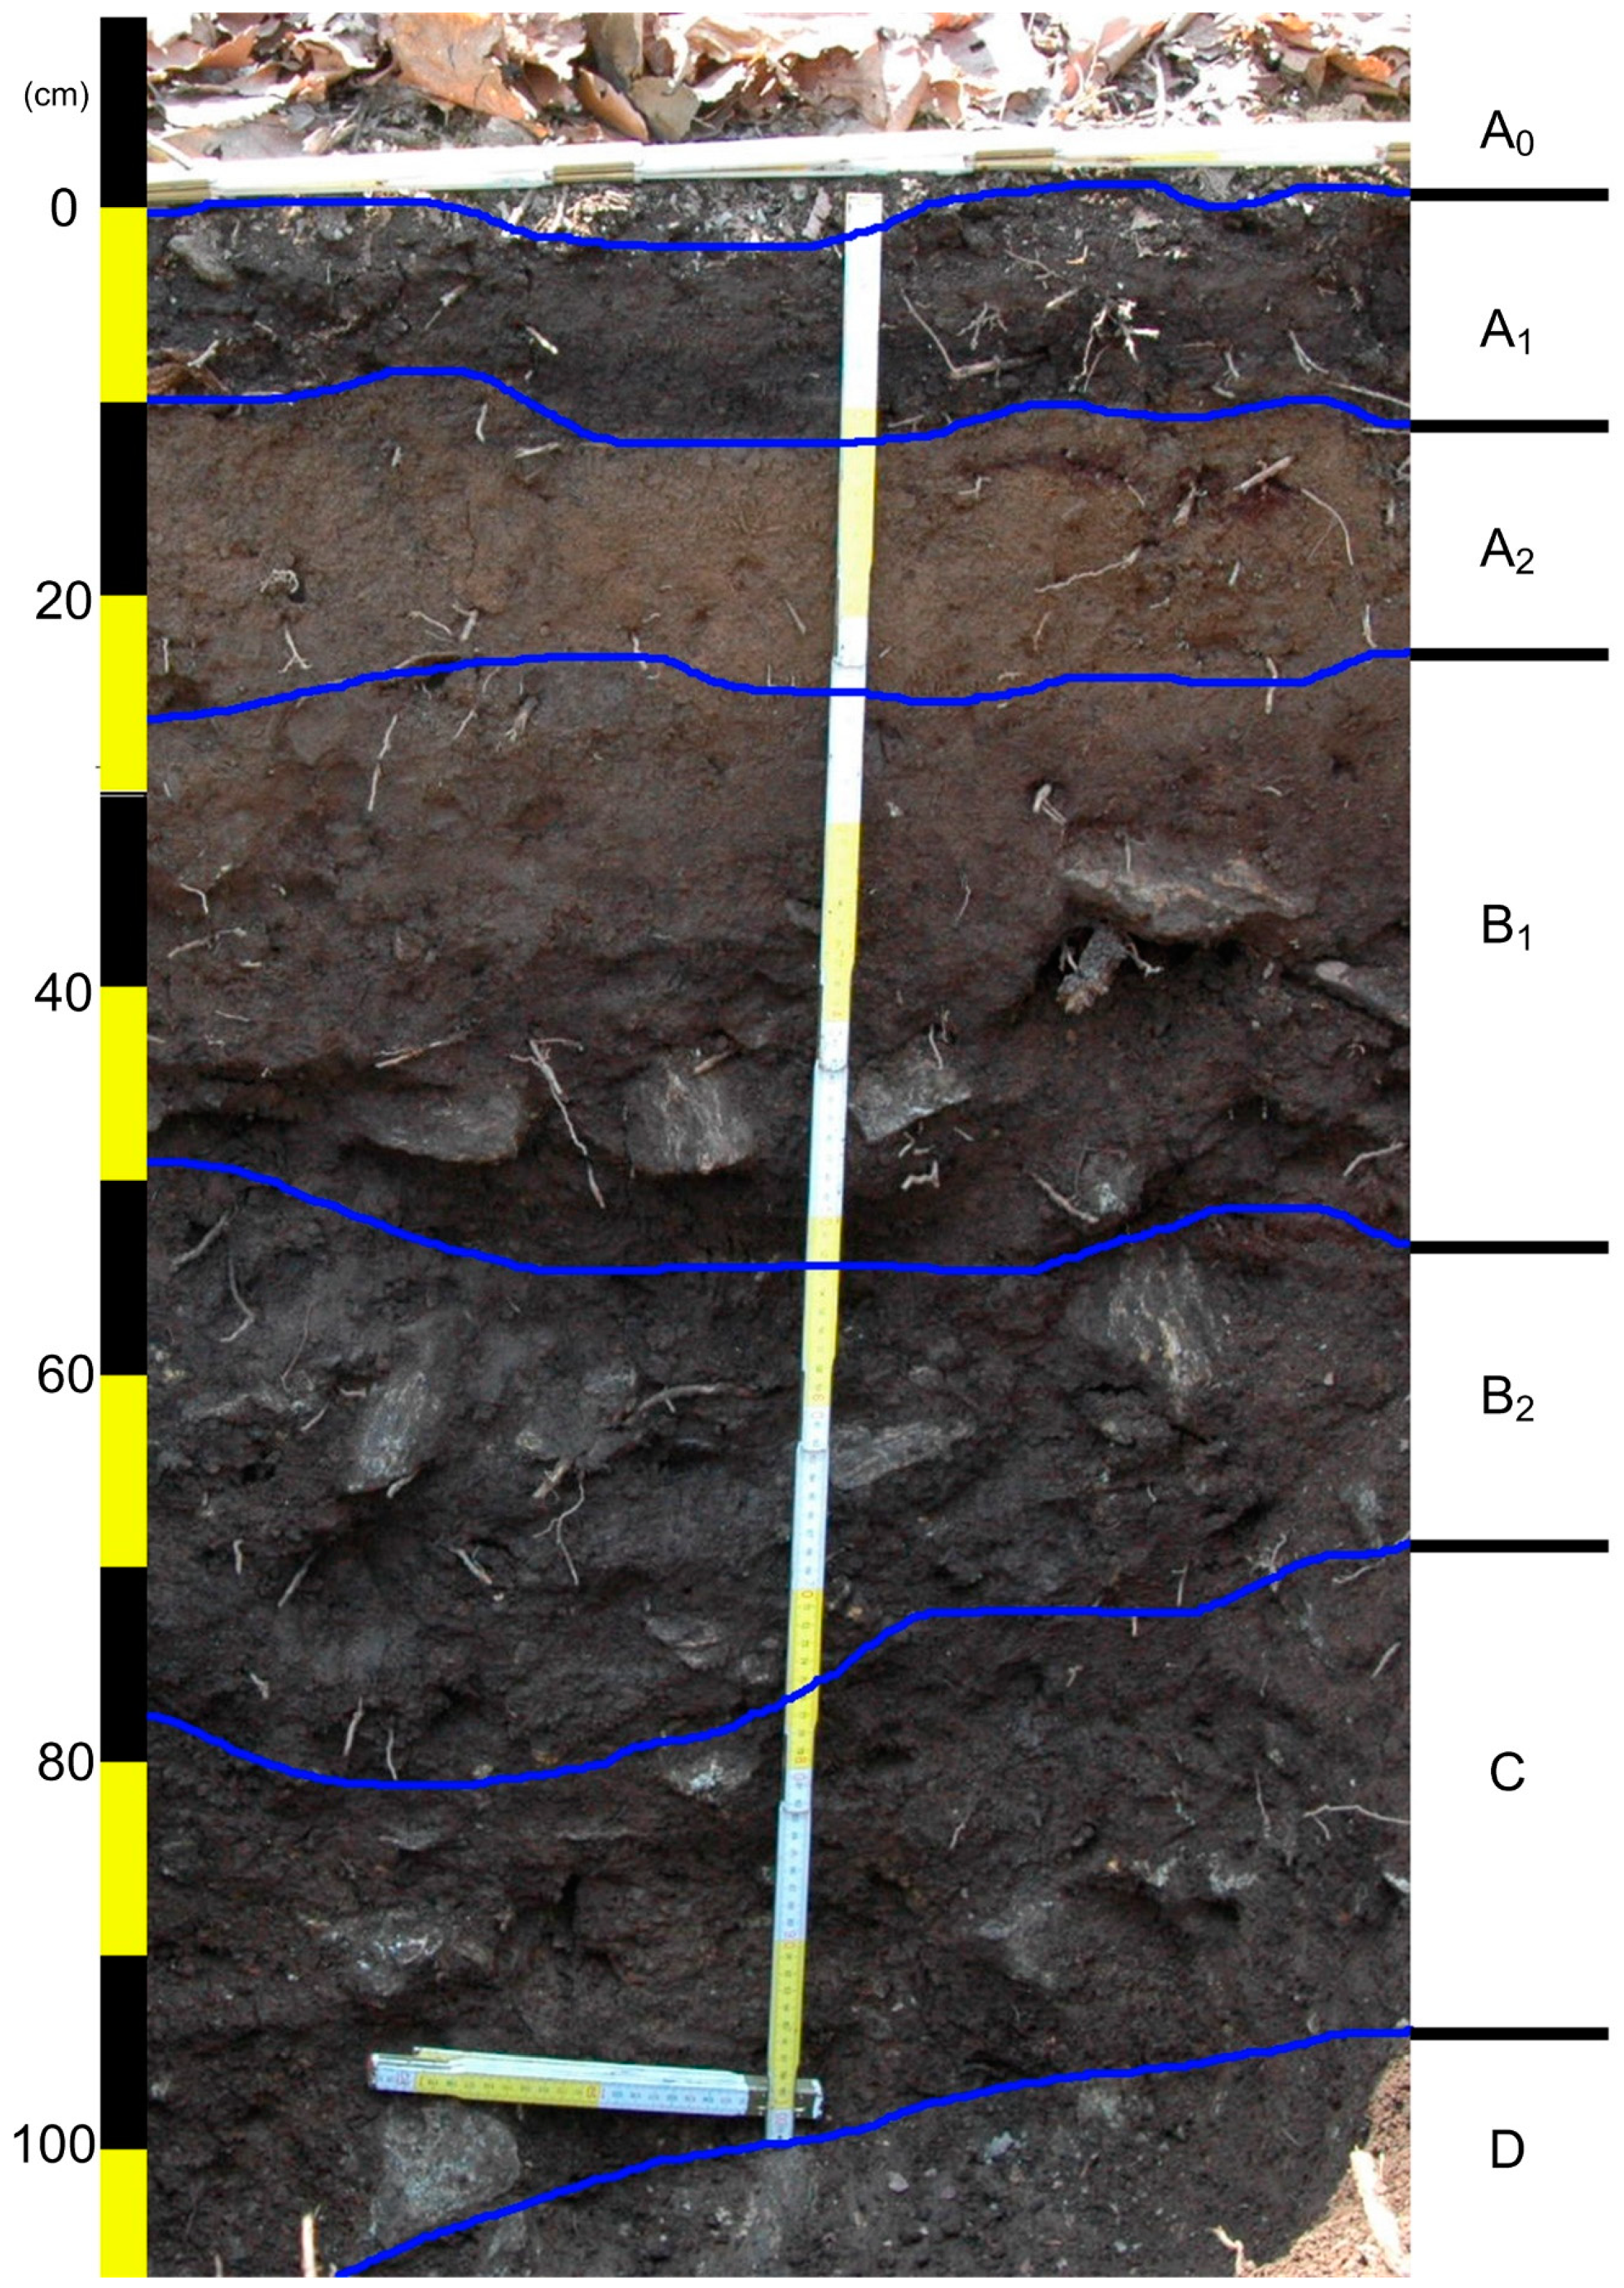
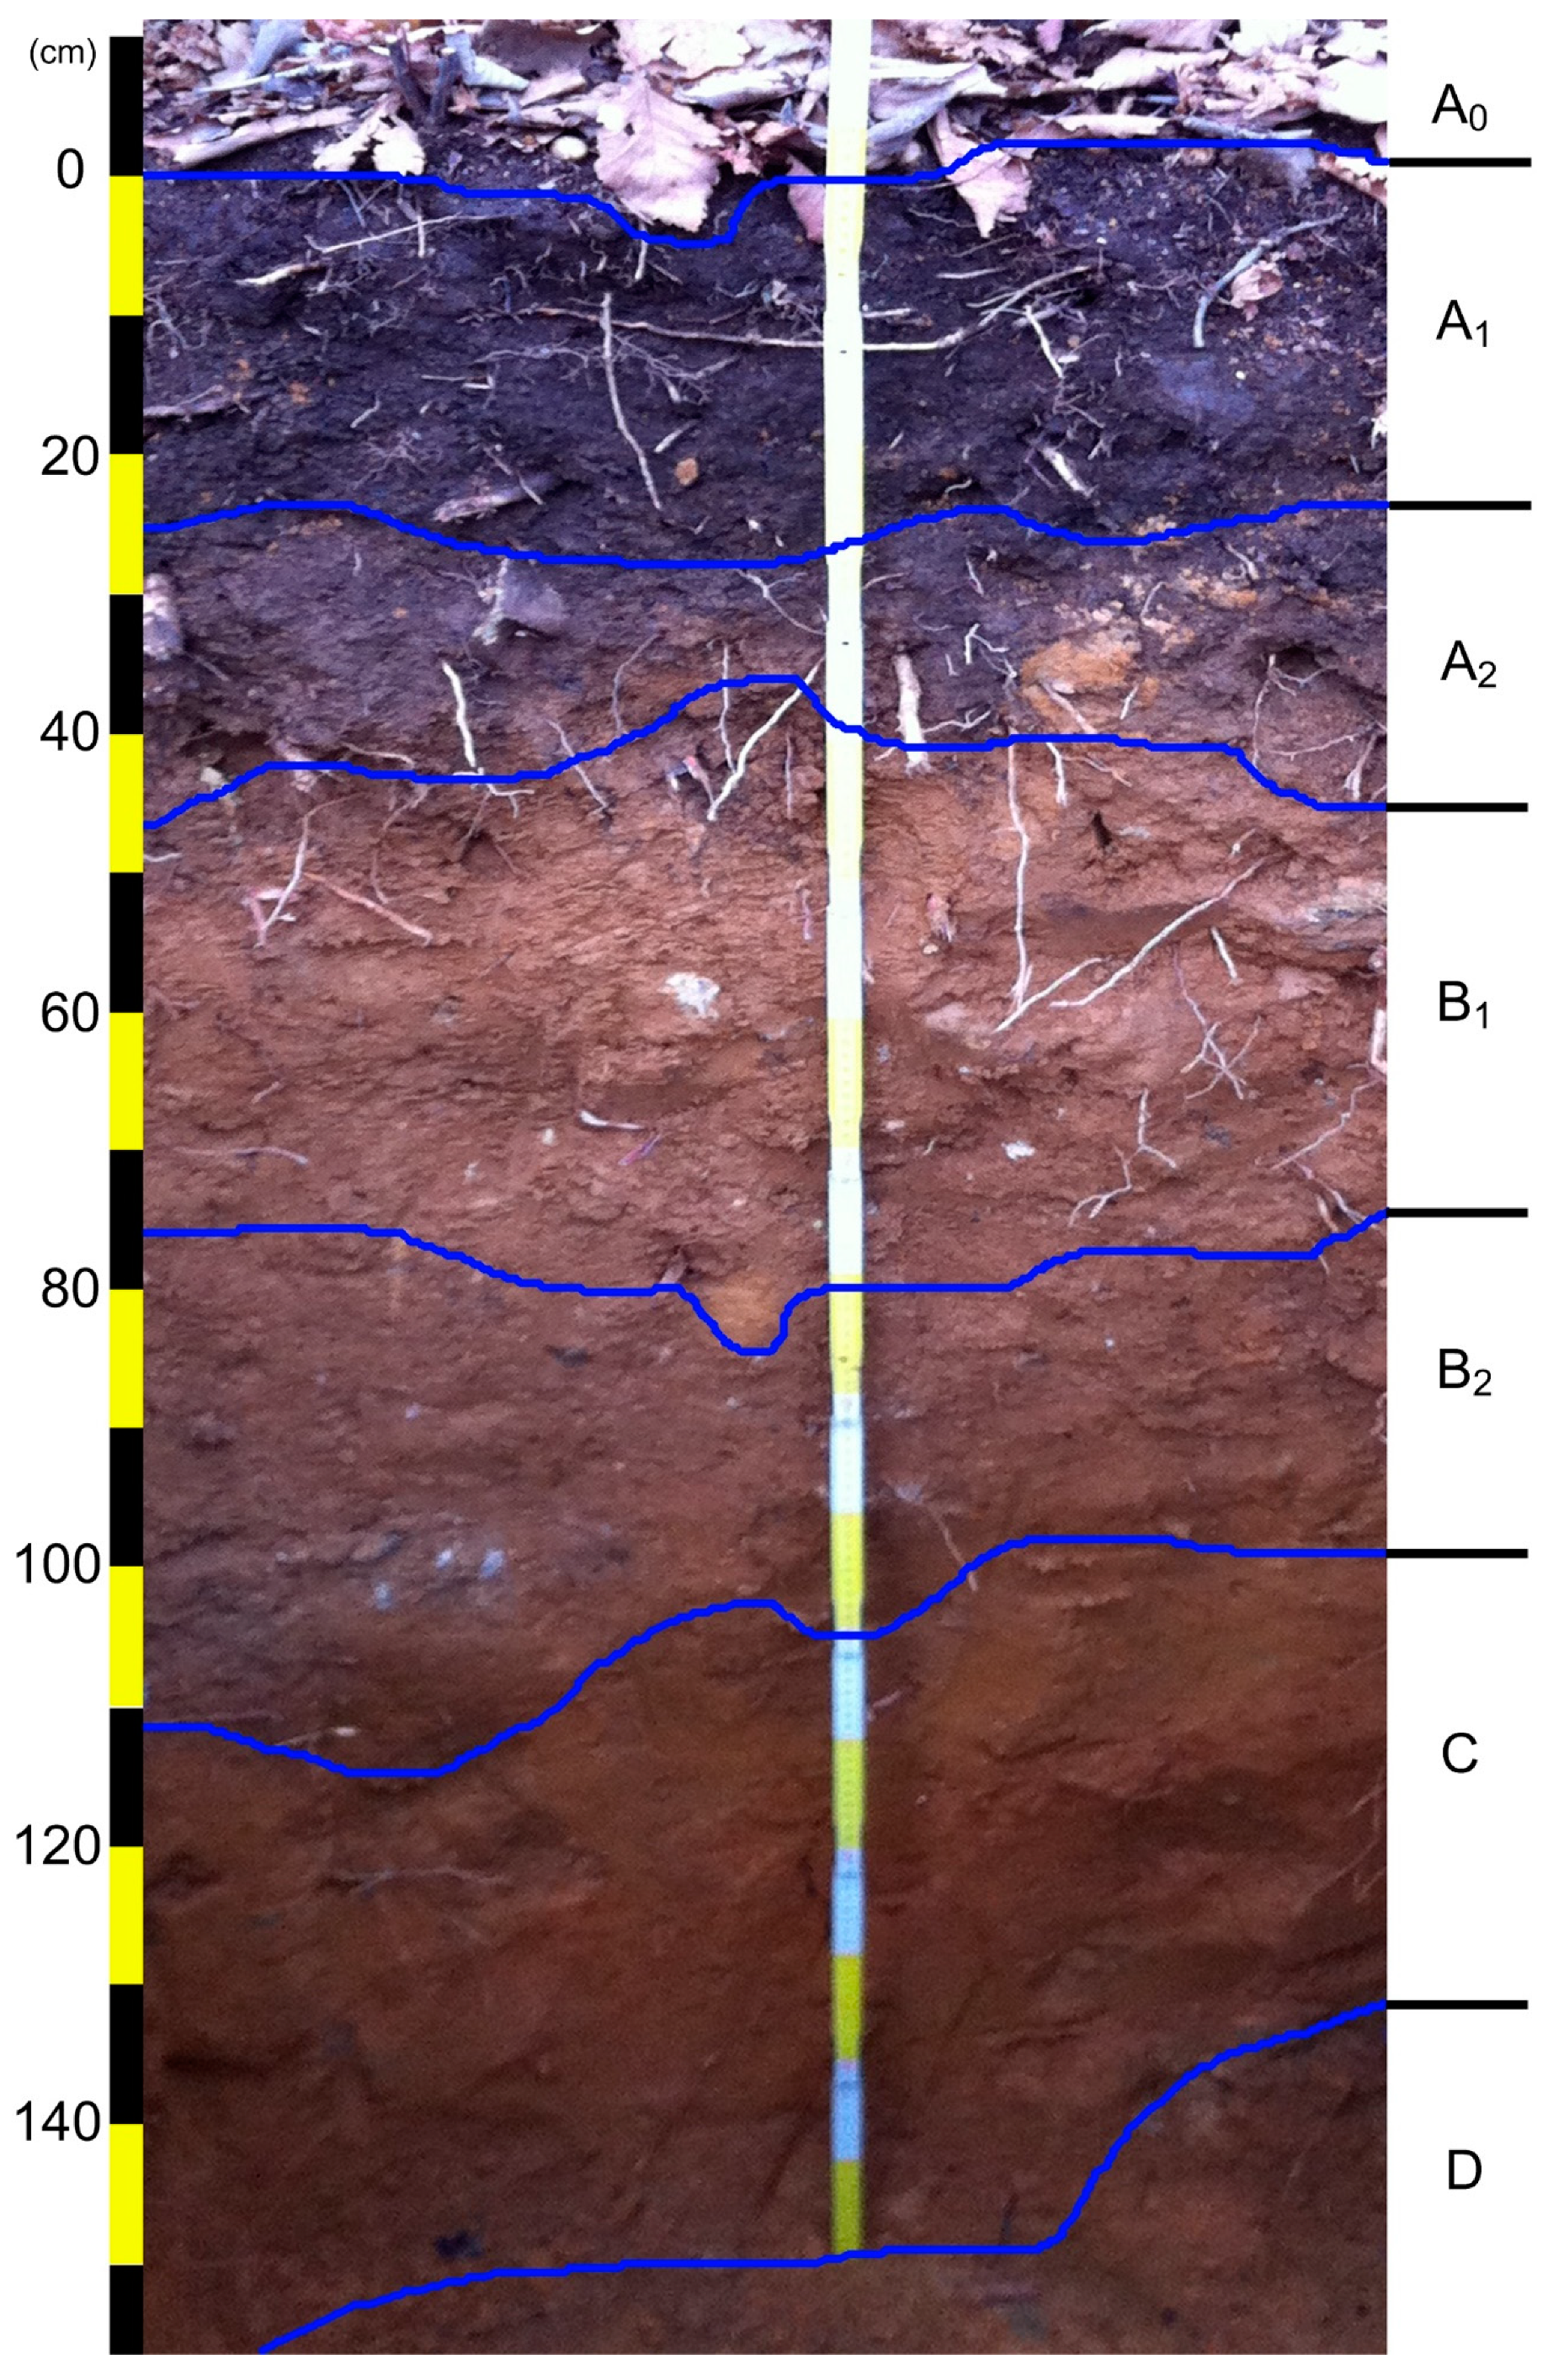
The Mt. Nam ecological experimental site has a northeastern gentle slope and is located in the central western part of the Korean Peninsula (37°33′ N, 126°59′ E; 220 m a.s.l.; Figure 1). This region has a cool-temperate climate under the influence of the Asian monsoon and is characterized by mild springs and autumns, hot and humid summers, and cold and snowy winters. According to the climate database from the Seoul Weather Station of the Korea Meteorological Administration close to this site, the mean annual air temperature and precipitation are 13.3 °C and 1212.3 mm, respectively. The monthly mean temperatures in the coldest and warmest months are 0.4 °C in January and 26.5 °C in August, respectively. The vegetation at the study site is classified as a broad-leaved deciduous forest (~49–55 years old) dominated by Mongolian oak (Quercus mongolica). The mean canopy height, average diameter at breast height (DBH), and vegetation density are 15.1 m, 23.2 cm, and 482 trees per hectare (ha−1), respectively. The vegetation is stratified into four layers composed of trees (>12 m), subtrees (4.5–8 m), shrubs (1–2.5 m) and herbs (<0.5 m), with coverages of 82.8%, 57.3%, 30.9%, and 33.3%, respectively. The mid- and understory vegetation is primarily composed of Sorbus alnifolia, Styrax japonica, and Acer pseudosieboldianum (Figure 2). Among these, S. alnifolia and S. japonica are flourishing species in extremely polluted areas such as industrial complexes [48,49]. These species reflect Mt. Nam’s exposure to severe environmental pollution and human interference. The leaves of the dominant broad-leaved deciduous trees at the site begin to develop in April and fall from October to November. The topography of this stand has both ridge forms and middle slopes (18° to 22.7°). The soil profile at the site (Figure 3) includes a 1–4 cm soil depth organic layer (A0), a 12–25 cm topsoil layer (A1 and A2) overlaid on the subsoil layer (B1 and B2), and a parent material layer of granite or granite-gneiss (C and D). The soil is classified as a brown forest soil (Dystric Cambisols according to FAO-UNESCO [50]). Further description of the site was provided in [12].
2.1.2. Mt. Jeombong
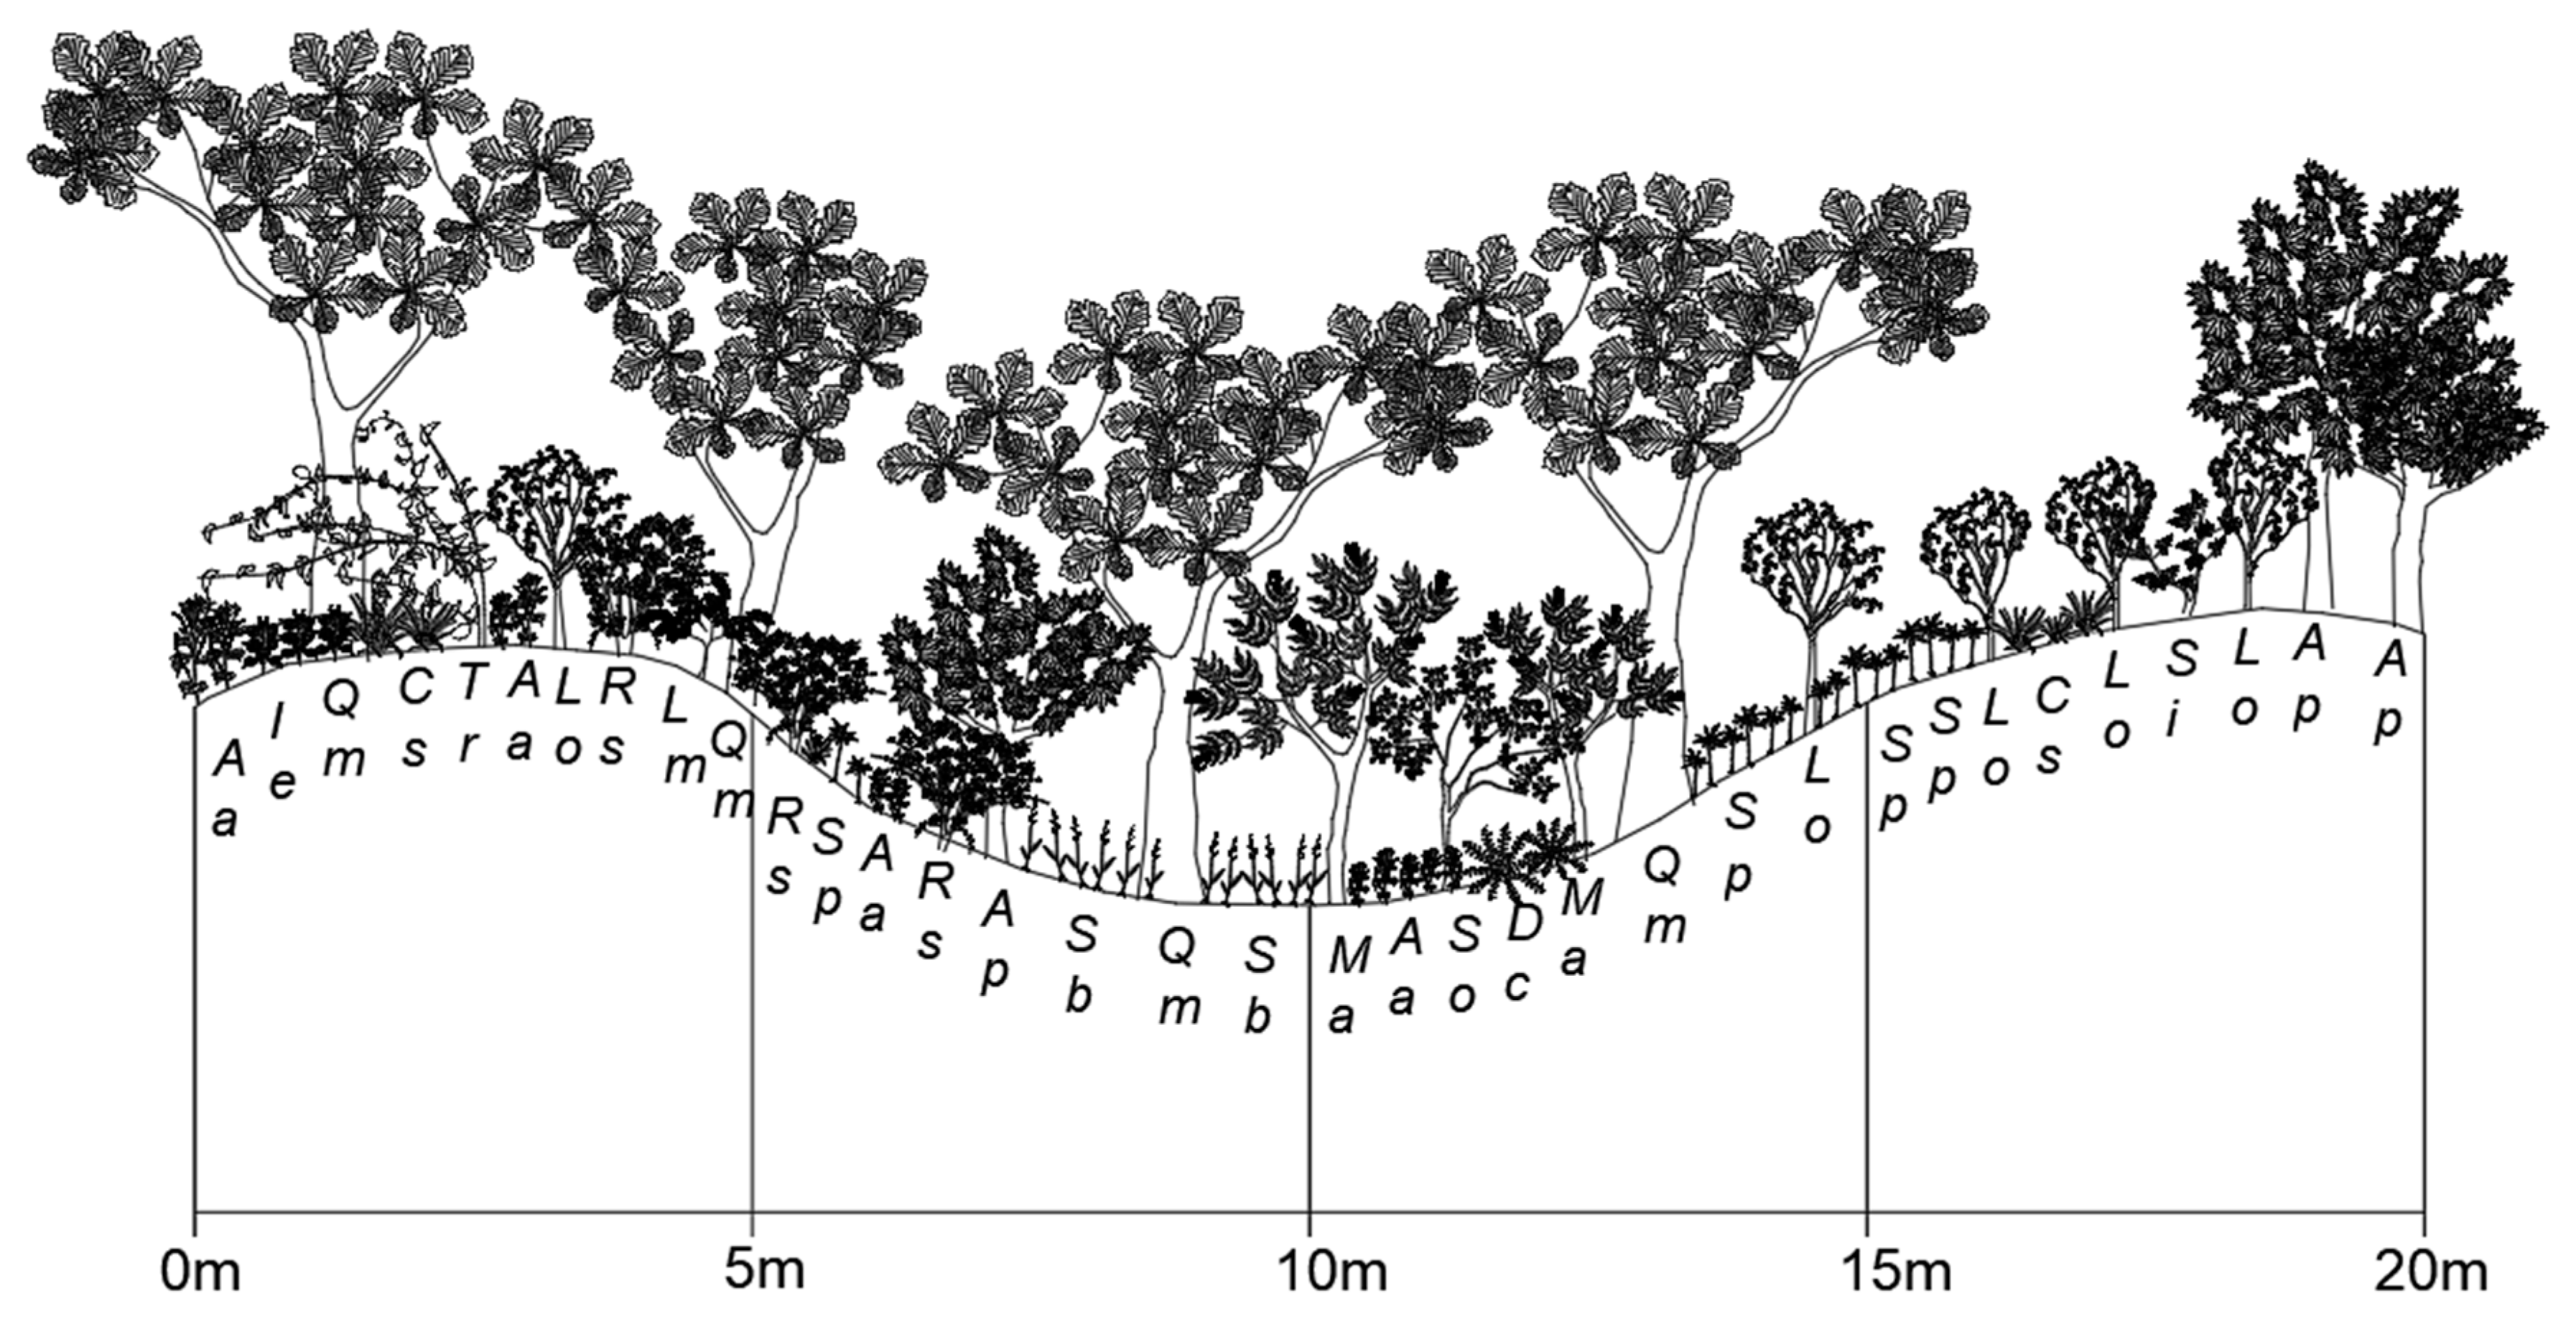
The Mt. Jeombong ecological experimental site is located on a gentle southeastern slope in a natural forest area in Inje county, Gangwon province, which is in the central eastern part of the Korean Peninsula (38°02′ N, 128°28′ E; 765 m a.s.l.; Figure 1). This mountainous region has well-preserved forests and is designated as a Biosphere Reserve by the United Nations Educational, Scientific and Cultural Organization (UNESCO)’s Man and Biosphere Project. Like Mt. Nam, this region also has a cool-temperate climate under the influence of the Asian monsoon. According to the climate database from the Inje Weather Station of the Korea Meteorological Administration close to this site, the annual mean air temperature and precipitation are 10.2 °C and 1135.7 mm, respectively. The monthly mean temperatures in the coldest and warmest months are −4.8 °C in January and 16.6 °C in August, respectively. The ground surface of this region is usually covered with snow from mid-December to early March. The vegetation at the study site is classified as a broad-leaved deciduous forest (~61–68 years old) dominated by Mongolian oak (Quercus mongolica). The mean canopy height, DBH, and density in the forest stand are 18.4 m, 23.6 cm, and 431 ha−1, respectively. The vegetation is stratified into four layers composed of trees (>16 m), subtrees (7–12 m), shrubs (1–4 m) and herbs (<0.6 m), with coverages of about 78.2%, 36.2%, 66.6%, and 59.8%, respectively. The mid- and understory vegetation is composed of Acer pseudosieboldianum, Styrax obassia, Carpinus cordata, and Tilia amurensis (Figure 4). The A. pseudosieboldianum and S. obassia species are typical sub-trees in Q. mongolica forests [51]. This species composition reflects that Mongolian oak forest established in Mt. Jeombong is a typical natural forest. The leaves of the dominant broad-leaved deciduous trees begin to develop in April and begin falling in October. The topography of this stand has both ridge forms and middle slopes (15° to 24°). The soil profile (Figure 5) includes a 1–5 cm soil depth organic layer (A0), a 27–42 cm topsoil layer (A1 and A2) overlaying the subsoil layer (B1 and B2), and a parent material layer of granite (C and D). The soil is classified as a brown forest soil (Dystric Cambisols, [50]). Further site descriptions were provided by Kim et al. [47].
2.2. Measuring Soil Respiration with an Automated Chamber System
An AOCC based on the closed dynamic method was used for continuous SR measurements from the forest soil surface at multiple locations. This system consists of eight automated chambers, an 8-channel gas sampler, an infrared gas analyzer (IRGA; Li-840; Li-COR, Lincoln, NE, USA), a data logger (CR1000; Campbell Scientific Inc., Logan, UT, USA), and a notebook computer. The chamber (cylindrical with a 30 cm internal diameter, 20 cm height, and 0.5 cm wall thickness) has a wall made of transparent polycarbonate (PC) with a hinged lid on the side wall. The transparent PC lid (5 mm thick) can be opened and closed automatically by a fixed 12-V DC motor. To ensure a gas-tight seal between the cylindrical chamber body and the closed lid, a soft rubber gasket was attached to the top edge of the chamber. While the chamber is closed, a mixing fan (KMFH-12; Nihon Blower, Tokyo, Japan) inside each chamber maintains air movement at a speed of 0.1 m s−1.
One study plot sized in 30 m × 30 m was established on the forest floor of the Q. mongolica forest stand beneath the eco-towers at Mt. Nam and Mt. Jeombong, respectively. The eight chambers were randomly installed at least 1 m away from the surrounding overstory trunks in the forest stand study plots and inserted 3 cm below the top of the litter layer. With the exception of the deep snow-coverage season, the SR rates in the forest stands at Mts. Nam and Jeombong were measured continuously from January to December 2011. All green plants were periodically removed from inside each chamber. When the chamber was open (during non-measuring times) a section of the chamber lid was raised vertically to allow rainfall, snow, leaves, litter, and twigs to reach the soil surface inside the chamber.
Teflon tubes (20 m long) were used to sample the air from each chamber. While the chamber air was withdrawn sequentially from all eight chambers, only the air from the closed chamber was supplied to the multichannel gas sampler system by an air pump (CM-50 with a maximum flow rate of 5 L min−1; EMP, Tokyo, Japan). The flow rate in each chamber was monitored and balanced by a mass-flow controller (SEF-21A; STEC, Kyoto, Japan). The 5 L min−1 airstream from the outlet of the chamber was divided by two mass-flow meters; one airstream line of 0.7 L min−1 flowed to the IRGA to measure the CO2 concentration, while the other bypassed the IRGA (4.3 L min−1). The air exhausted from the IRGA went to a bypass tube, with the total remaining air continuously flowing into the chamber inlet. To avoid any pressure changes, the same amount of air supplied to the chamber inlet was simultaneously withdrawn by an air pump from the chamber outlet. Over the course of a half hour, the chambers were closed sequentially and continuously by an 8-channel relay driver controlled by a program in the data logger. We set a sampling time of 225 s per chamber. The data logger acquired output from the IRGA at one second intervals, and the output was averaged and recorded every ten seconds. The raw signal data for the CO2 concentration from the IRGA were used to calculate the SR rates (Equation (1)). The data collected from the eight automated chambers were averaged for each 30 min cycle. The IRGA was calibrated with CO2 zero gas (pure nitrogen), and two span gasses with different CO2 concentrations at least once every three months. In both study sites, the precipitation was measured at hourly intervals using a weighing bucket rain gauge (Model-R301, Weather Tec. Seoul, Korea) installed and mounted on the top of eco-tower at a height of 30 m above ground.
2.3. Measuring Temperature and Soil Water Content
The air temperature (Ta) 1.5 m above the ground surface, the soil surface temperature (Tss; 0 cm depth), and soil temperatures (Ts) at 5 and 10 cm depths were obtained with copper-constantan thermocouple probes, and the volumetric soil water content (SWC, 0–100 vol% = [Vw m3 (the volume of water)/Vt m3 (the bulk volume of soil)] × 100) at the 15 cm depth was obtained with a time-domain reflectometry (TDR) probe (CS-616; Campbell Scientific Inc., Logan, UT, USA). These measurements were taken near the automated chambers simultaneously with the SR rate measurements. All sensors were calibrated at six month intervals. All micrometeorological data were continuously measured at one second intervals, and the selected data were averaged and recorded once every ten seconds by a datalogger (CR1000, Campbell Scientific Inc., Logan, UT, USA). After removing erroneous raw data, 30 min averages for the Ta, Ts, Tss, and SWC data were calculated and used to analyze the mean 30 min SR rates.
2.4. Data Analysis
The half-hourly measurements made by the eight automated chambers were averaged to obtain representative 30 min data for the Q. mongolica forest stands on Mts. Nam and Jeombong. Over the course of the field measurements, some SR data could not be obtained due to electrical malfunctions, IRGA calibrations, instrument failures, heavy snowfall, or heavy snow accumulation, mostly during the winter season.
The soil respiration rate (mg CO2 m−2 s−1) was calculated as
where a is the change rate of the CO2 concentration in the chamber (μmol mol−1 s−1); p is the CO2 density in the air (mg m−3); V is the chamber volume, including the volume of the tubes; and A is the soil surface area (m2) enclosed by the chamber. Thirty minute averages of the SR rate values from the eight automated chambers were used to obtain the empirical models.
SR rate = 10−6·a·p·V·A−1,
Optimal regression equations were derived to examine the relationships among SR, Ta (1.5 m above ground), Ts (5 and 10 cm below ground), Tss (soil surface), and SWC. The dependence of the SR rate on temperature (Ta, Ts and Tss) was modeled using the following regression equation:
where the SR rate is the measured SR (mg CO2 m−2 s−1); t is the measured Ta (°C), Tss (°C), or Ts (°C); α is the coefficient of the basic respiration rate at a reference temperature of 0 °C, and b is the sensitivity of the SR to temperature (Ta, Ts and Tss). The sensitivity (b) is related to Q10, which is derived as follows:
where Q10 is the SR rate increase for a 10 °C rise in temperature (T). The a, b, and Q10 parameter values derived from the observed field data reflect the effects of T and other variables on SR. Thus, Q10 is generally used to describe the temperature dependence of SR.
SR rate = α·exp(bt),
Q10 = exp(10b).
3. Results
3.1. Seasonal Temperature and Soil Water Content Variation
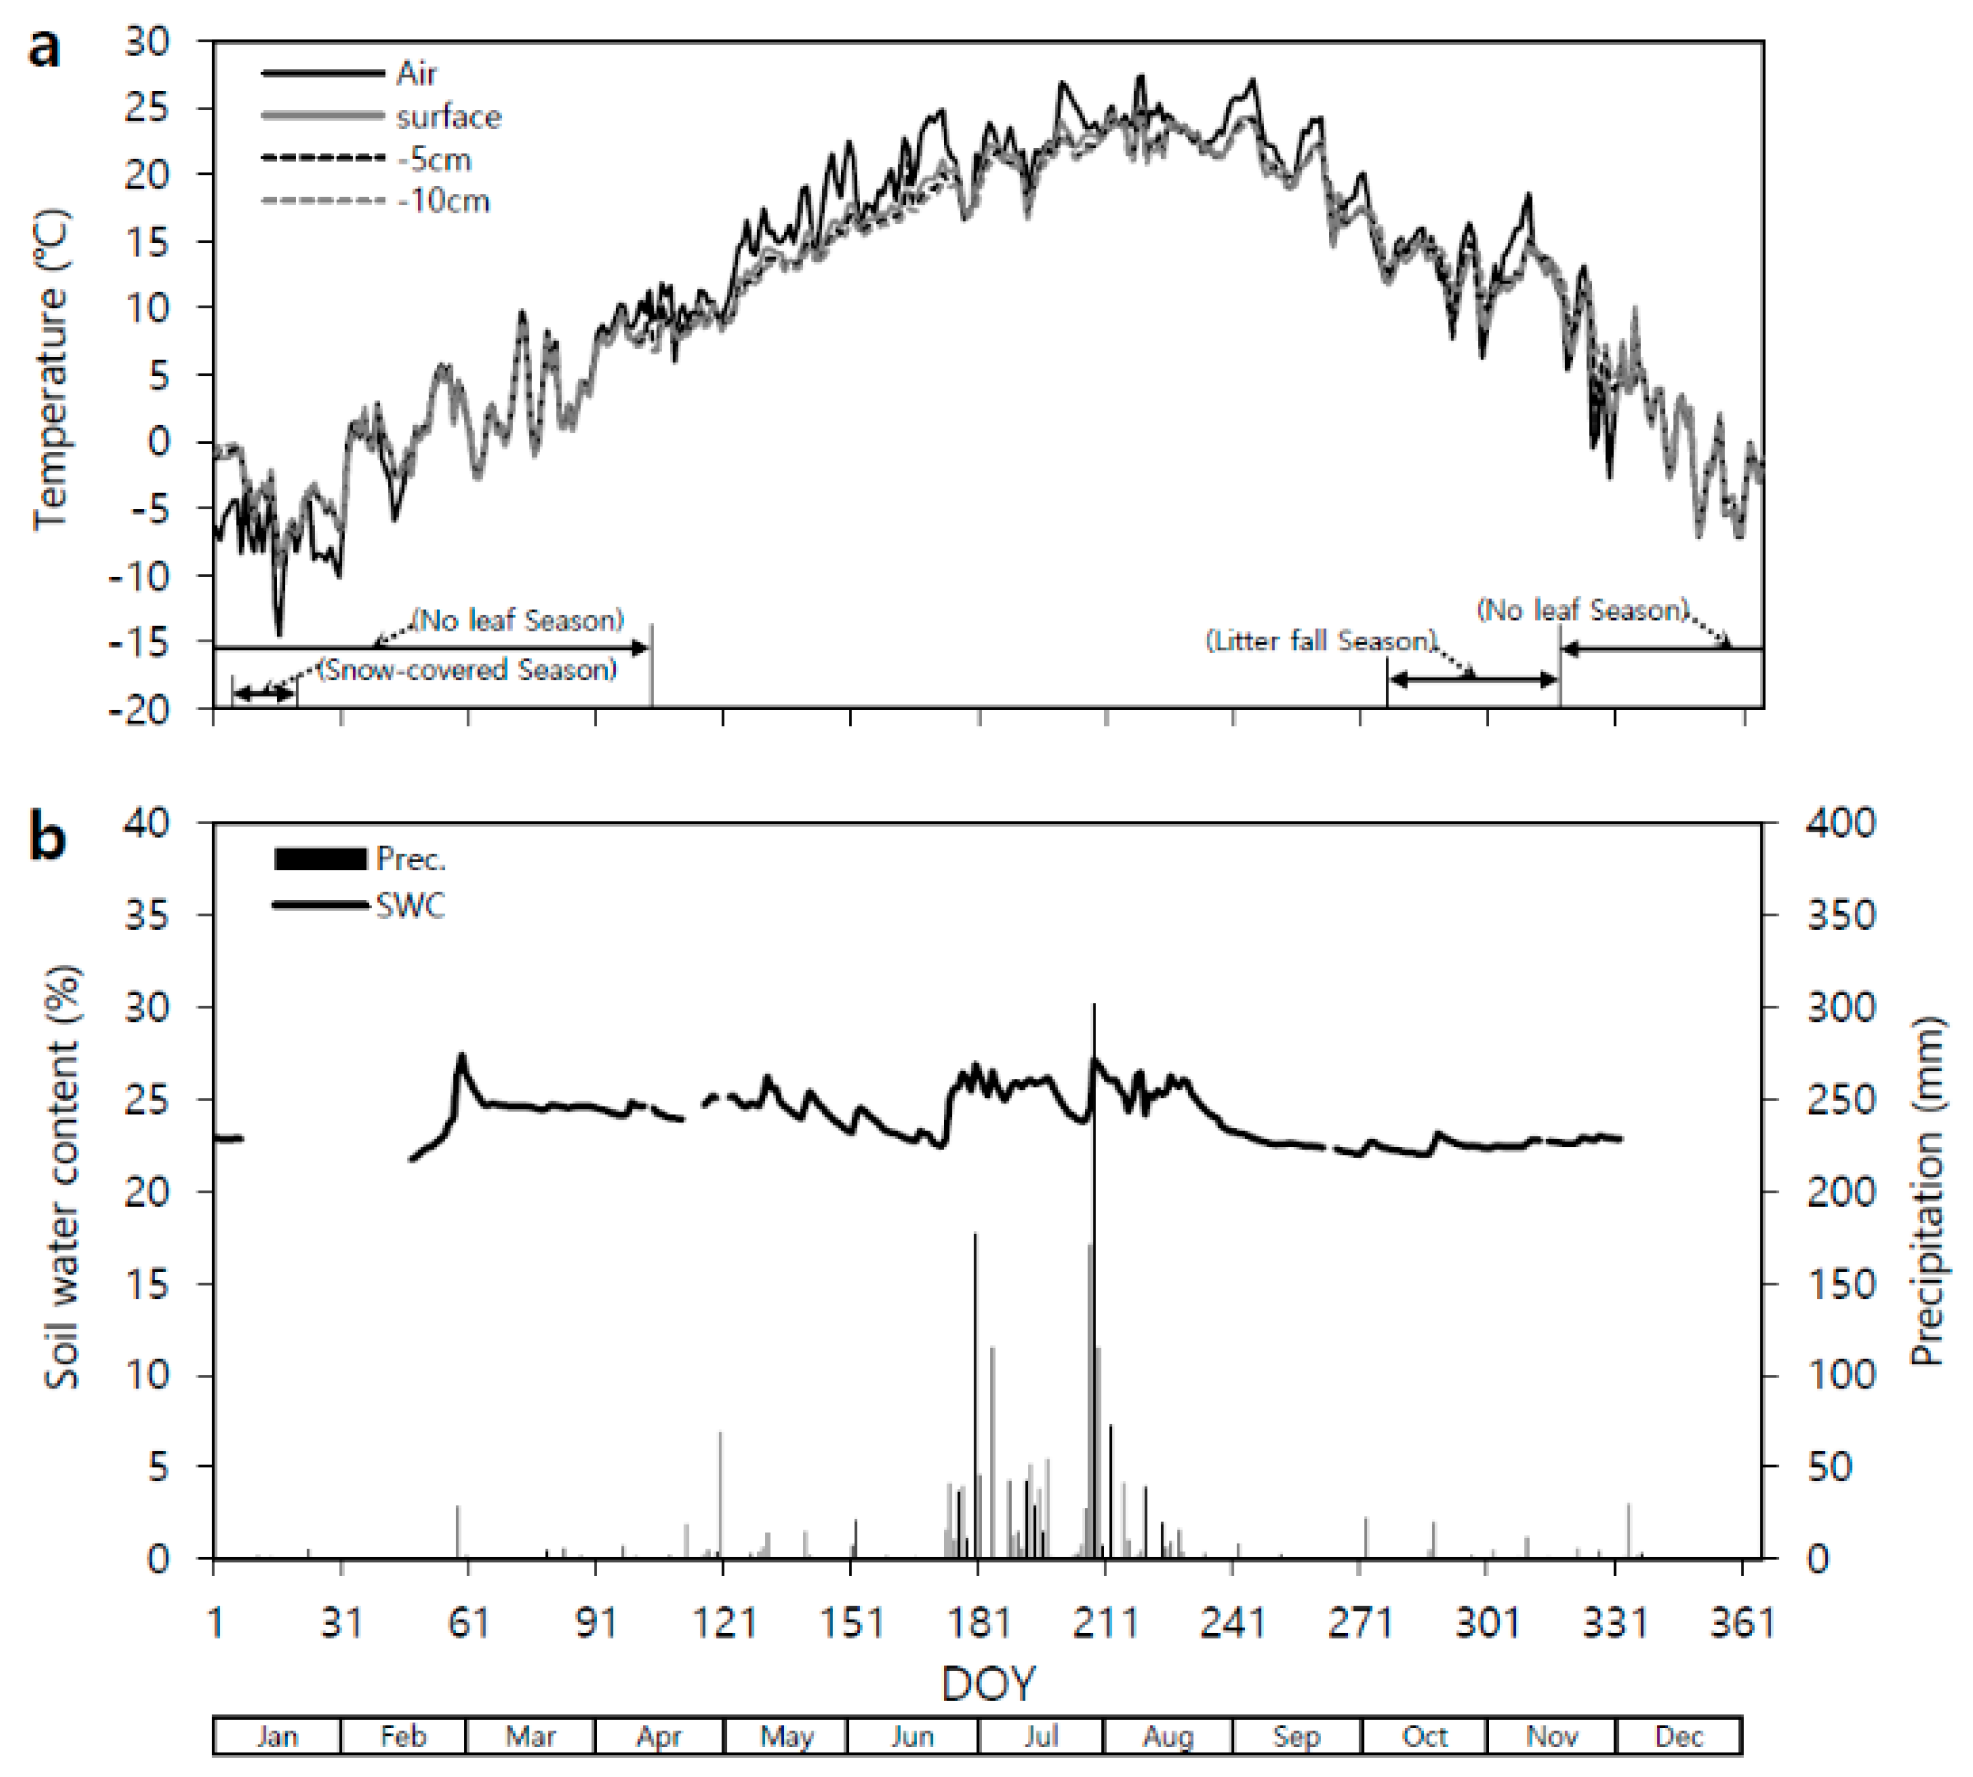
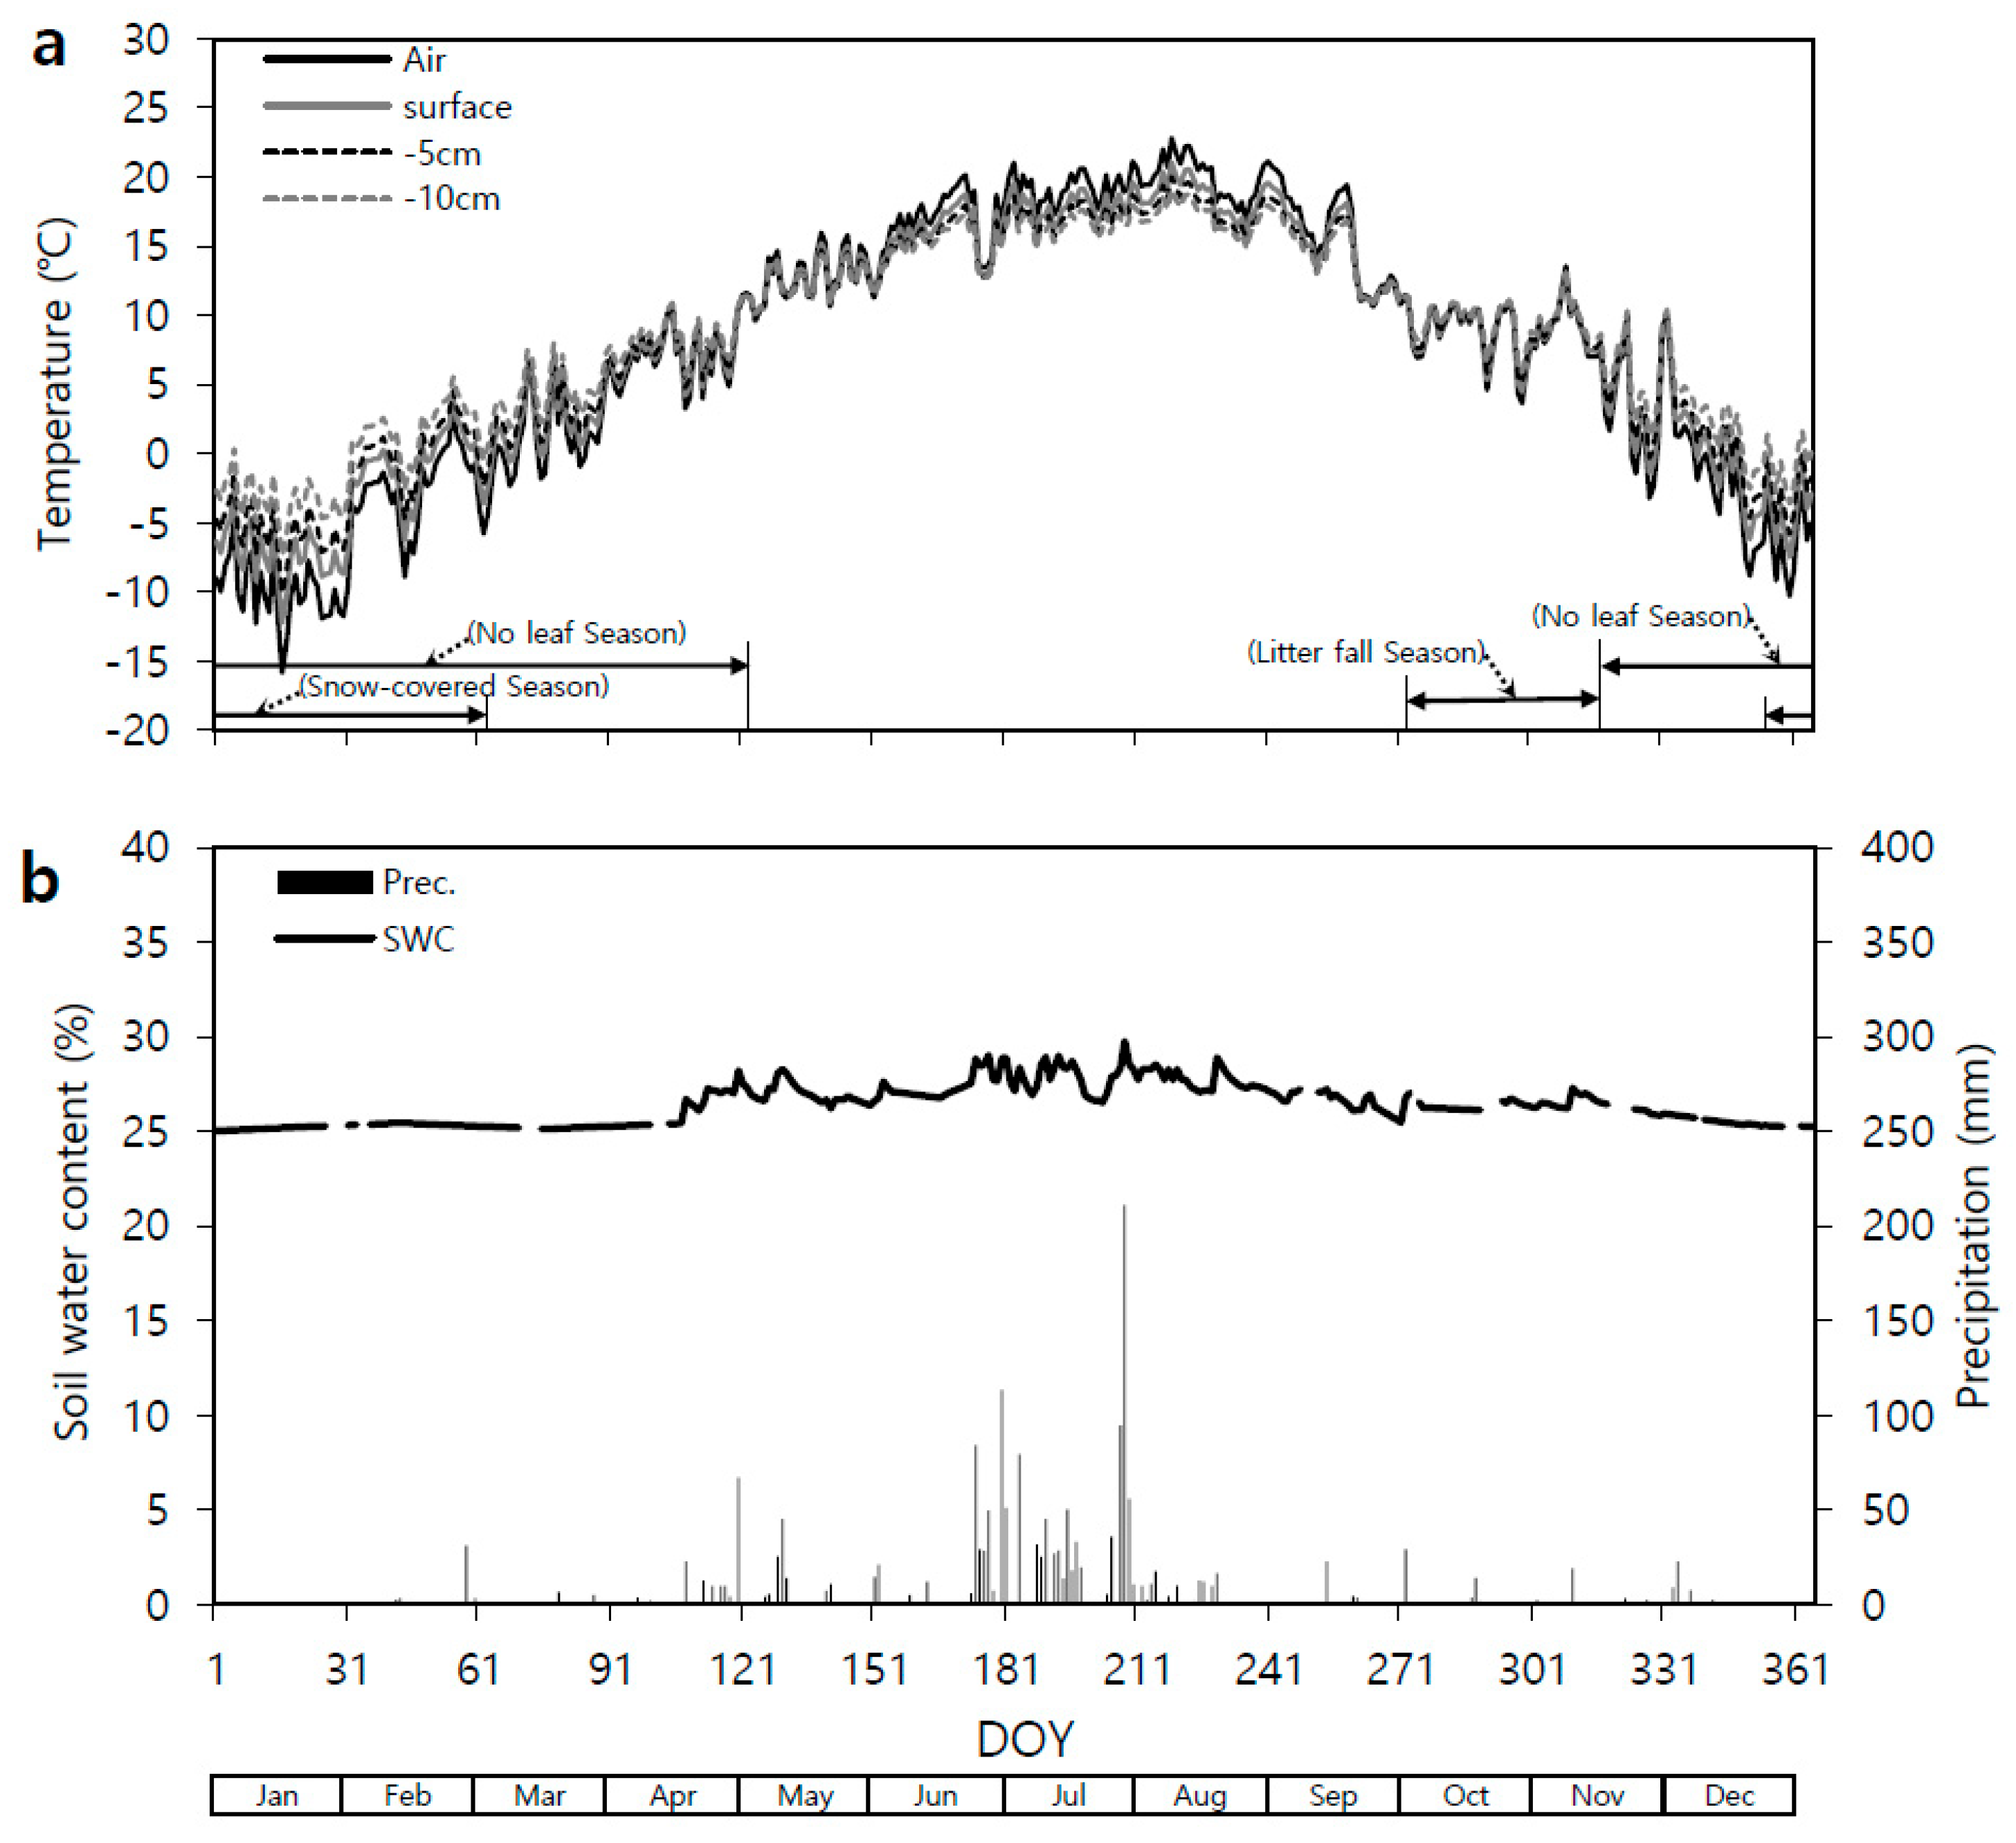
Both Q. mongolica forest stands (Mts. Nam and Jeombong) showed significant seasonal variation (Figure 6 and Figure 7) in their daily mean Ta (1.5 m height), Tss (soil surface), and Ts (5 and 10 cm depths) values. The lowest daily mean Ta and 5-cm Ts values were on Day of Year (DOY) 16 in January 2011: −14.5 and −8.1 °C, respectively, at Mt. Nam and −16.9 and −5.5 °C at Mt. Jeombong. After that, the Ta and Ts steadily increased, reaching their highest values in August: 28.1 (DOY 219) and 24.9 °C (DOY 219), respectively, at Mt. Nam and 23.9 (DOY 219) and 20.7 °C (DOY 240) at Mt. Jeombong. The Ta and Ts then gradually decreased with the change in seasons to autumn and winter. The seasonal Tss and Ts patterns were similar to the Ta pattern throughout the entire experimental period from January to December.
The stand at Mt. Nam showed a temporary increase in the daily mean volumetric SWC at the 15 cm depth in late February 2011 (Figure 6). The SWC tended to decrease continuously from early May to mid-June, and then had relatively high values during the rainy season from late June to July. The SWC then decreased up to early September, after which it maintained constant values without any significant changes. The daily mean SWC ranged from 22.0% to 29.2% at the Mt. Nam site, and 64% of the total annual precipitation fell in July and August.
Except for relatively high values from mid-April to late August at the Mt. Jeombong site, there were no clear seasonal changes in the daily mean volumetric SWC (range: 24.6% to 28.9%) at the 15 cm depth (Figure 7). Fifty percent of the total annual precipitation fell in July and August at this site.
3.2. Seasonal Variations in Soil Respiration
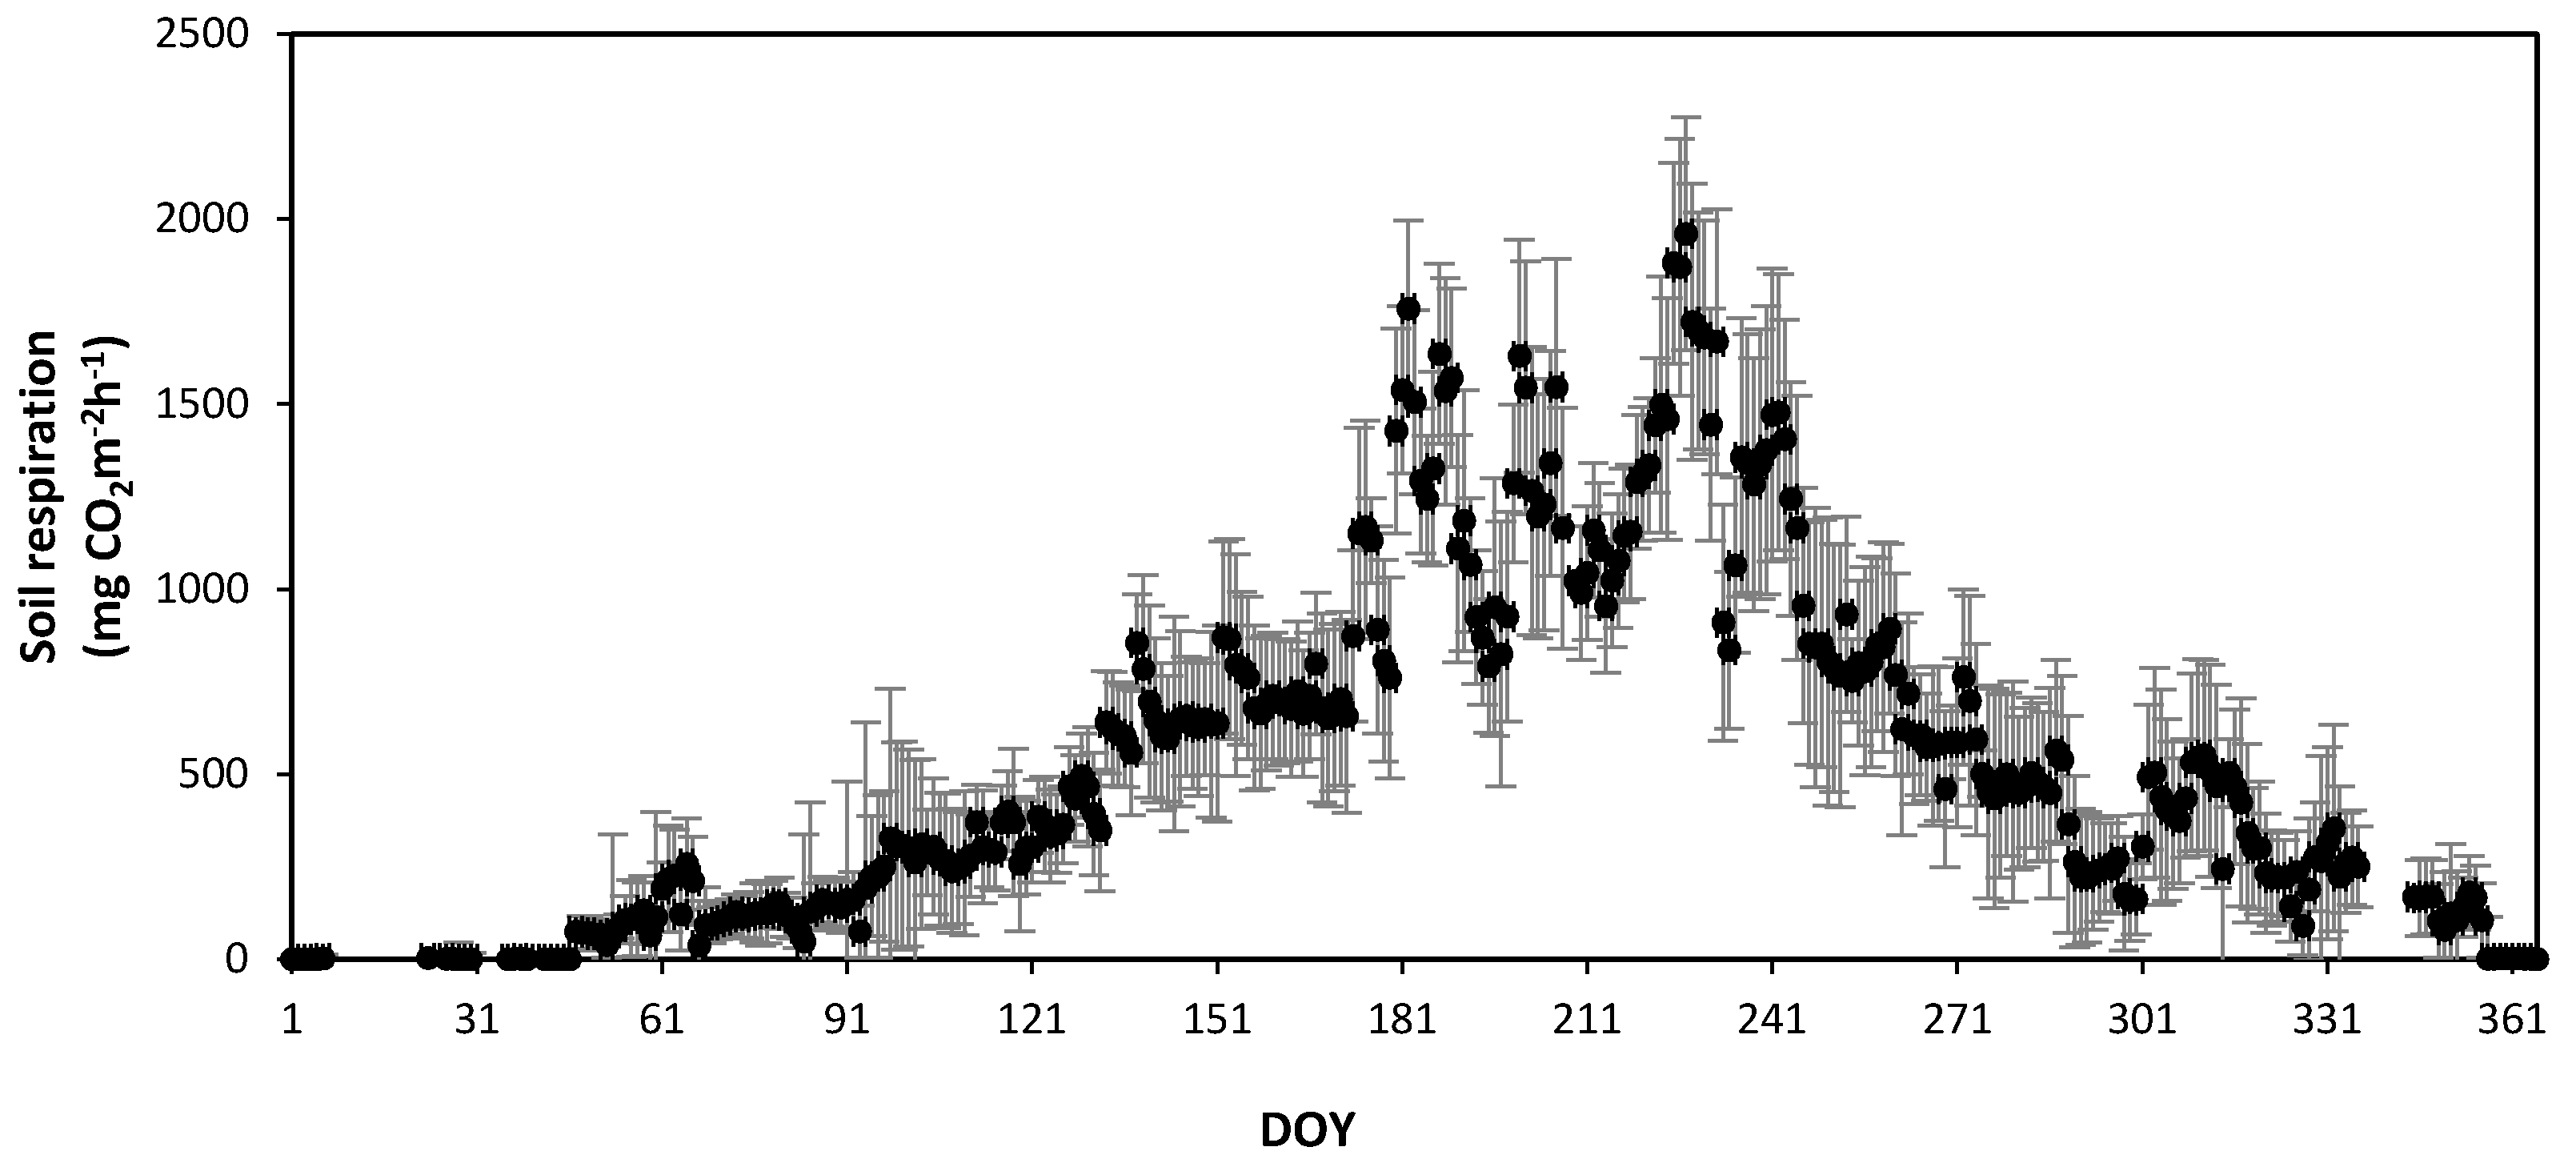
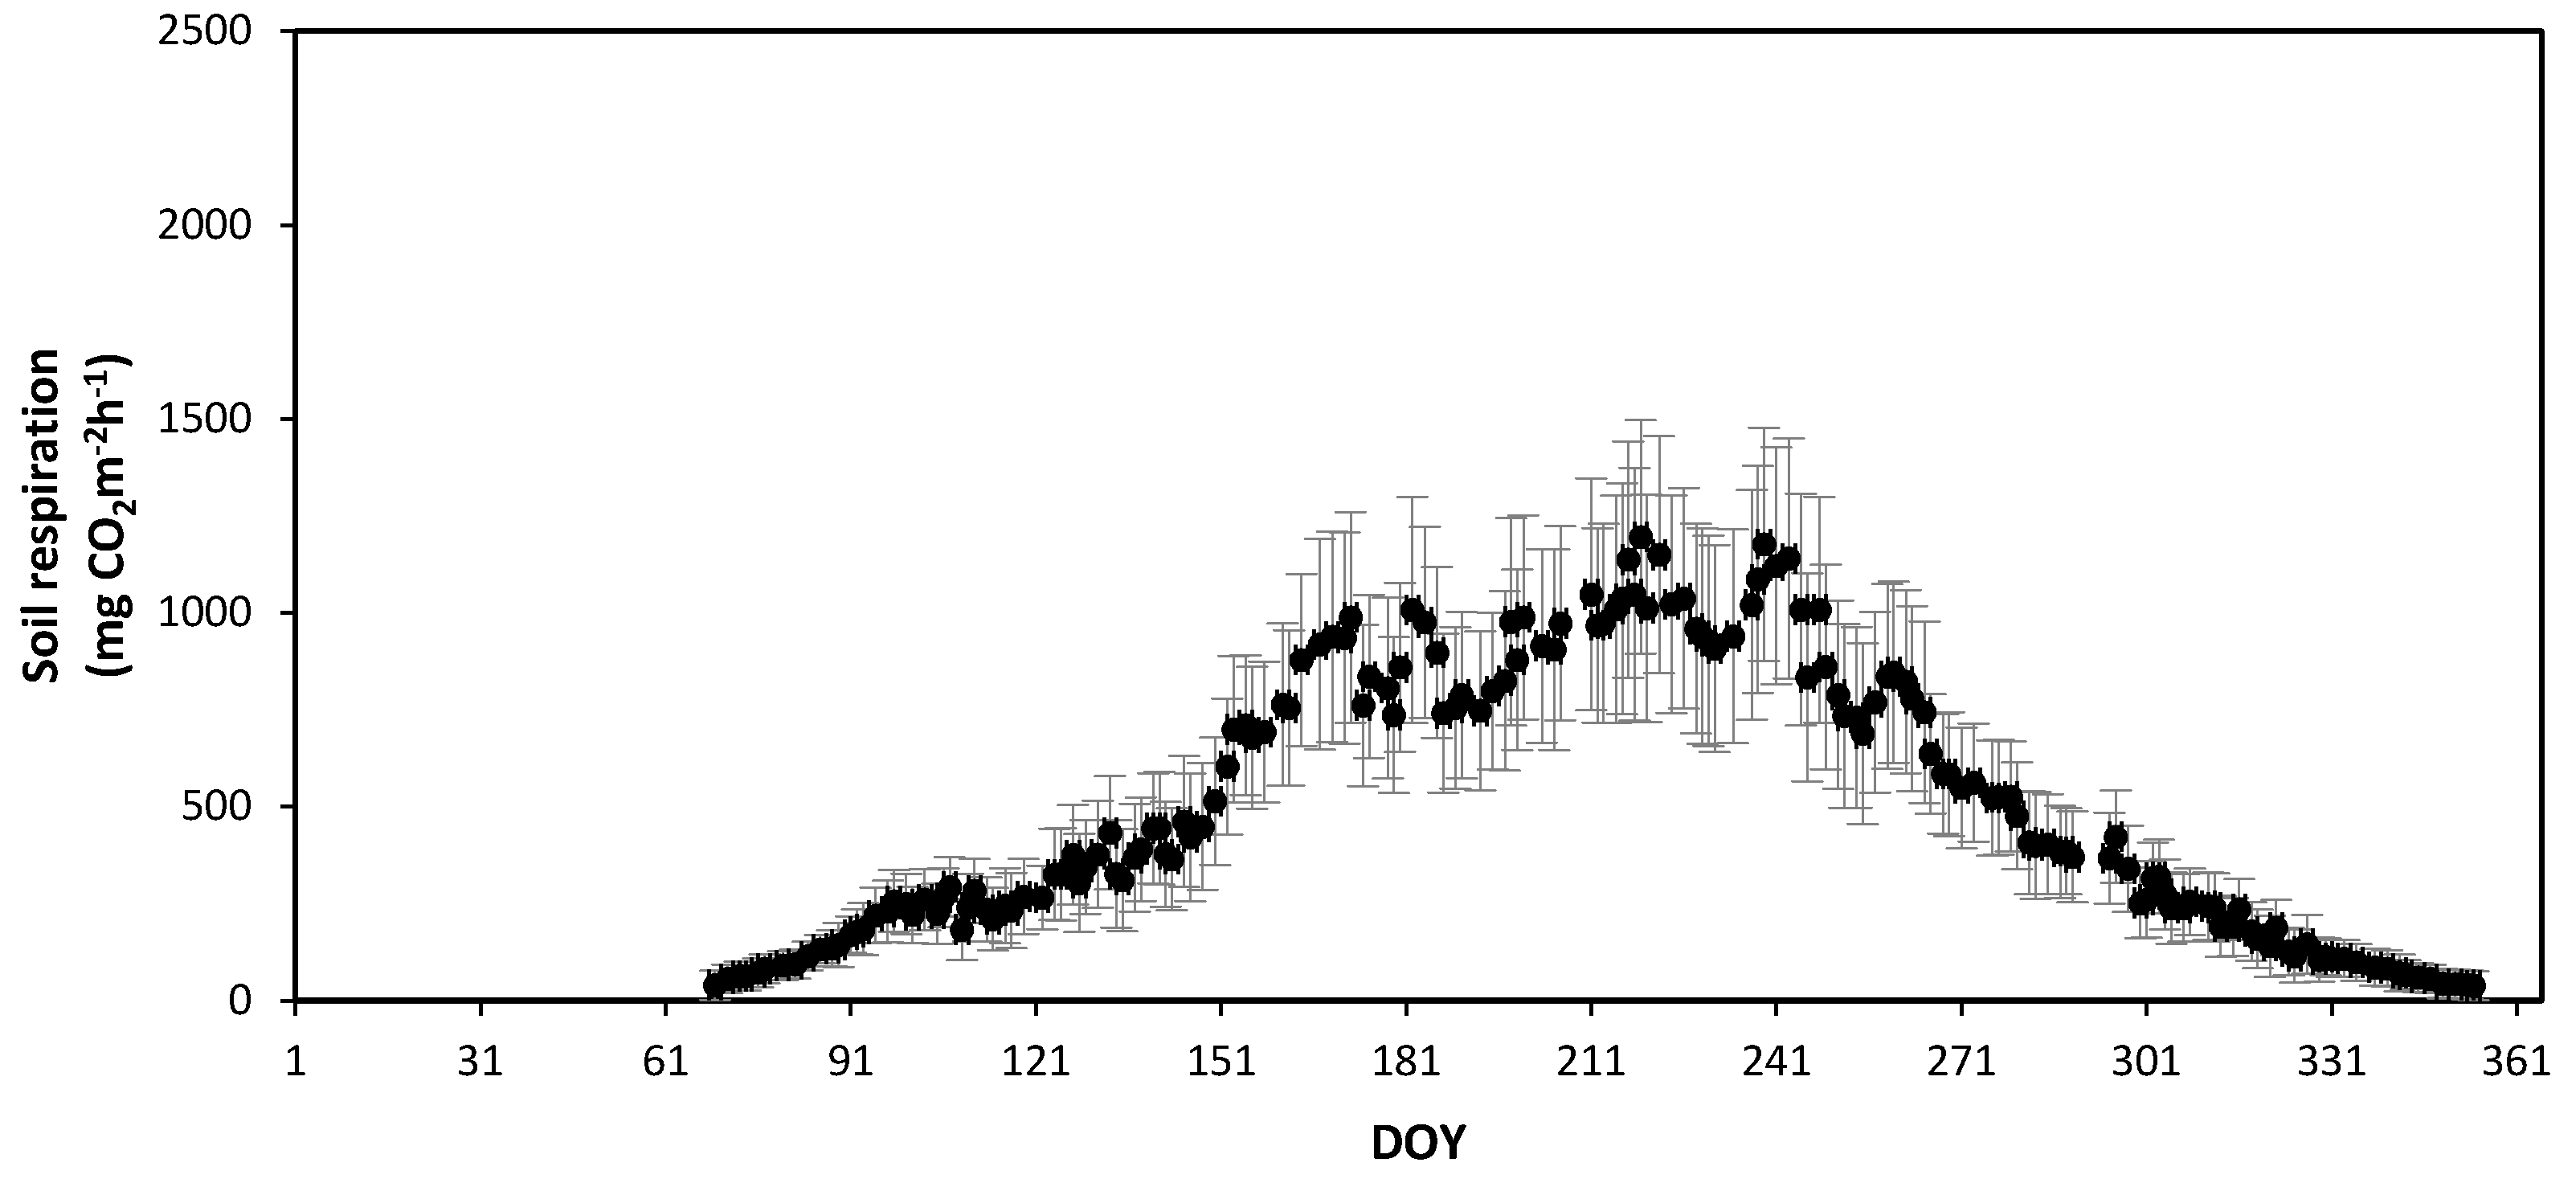
The SR rates in the forest stands at Mts. Nam and Jeombong were measured continuously from January to December 2011 using the AOCCs (Figure 8 and Figure 9). The mean annual SR was 549.8 ± 185.6 mg CO2 m−2 h−1 at Mt. Nam and 539.5 ± 148.1 mg CO2 m−2 h−1 at Mt. Jeombong. For both forest stands, the daily mean SR showed significant seasonal changes, similar to those seen for temperature (Figure 6 and Figure 7). The daily mean SR increased markedly from the spring (DOY 60 to DOY 151: 75–399 mg CO2 m−2 h−1 at Mt. Nam; 49–367 mg CO2 m−2 h−1 at Mt. Jeombong) to the summer seasons (DOY 152 to DOY 243: 835–1960 mg CO2 m−2 h−1 at Mt. Nam and 801–1195 mg CO2 m−2 h−1 at Mt. Jeombong), and then decreased gradually from autumn (DOY 244 to DOY 334: 90–551 mg CO2 m−2 h−1 at Mt. Nam; 98–305 mg CO2 m−2 h−1 at Mt. Jeombong) to winter (DOY 335 to DOY 59: 0–190 mg CO2 m−2 h−1 at Mt. Nam and 0–131 mg CO2 m−2 h−1 at Mt. Jeombong; Figure 8 and Figure 9). The seasonal SR variations were significantly correlated with T in both forest stands throughout the entire experimental period (r2 = 0.78–0.91, p < 0.01), but had no significant correlation with the SWC (r2 = 0.13–0.27, p > 0.05). However, the SR rate abruptly increased with an increase in the SWC due to precipitation during the growing season (Figure 6, Figure 7, Figure 8 and Figure 9). These results show that SWC can cause abrupt fluctuations in SR on short time scales following rainfall events, but it is the constant influence of T that reflects the seasonal time scale.
3.3. Relationships between Soil Respiration and Temperature
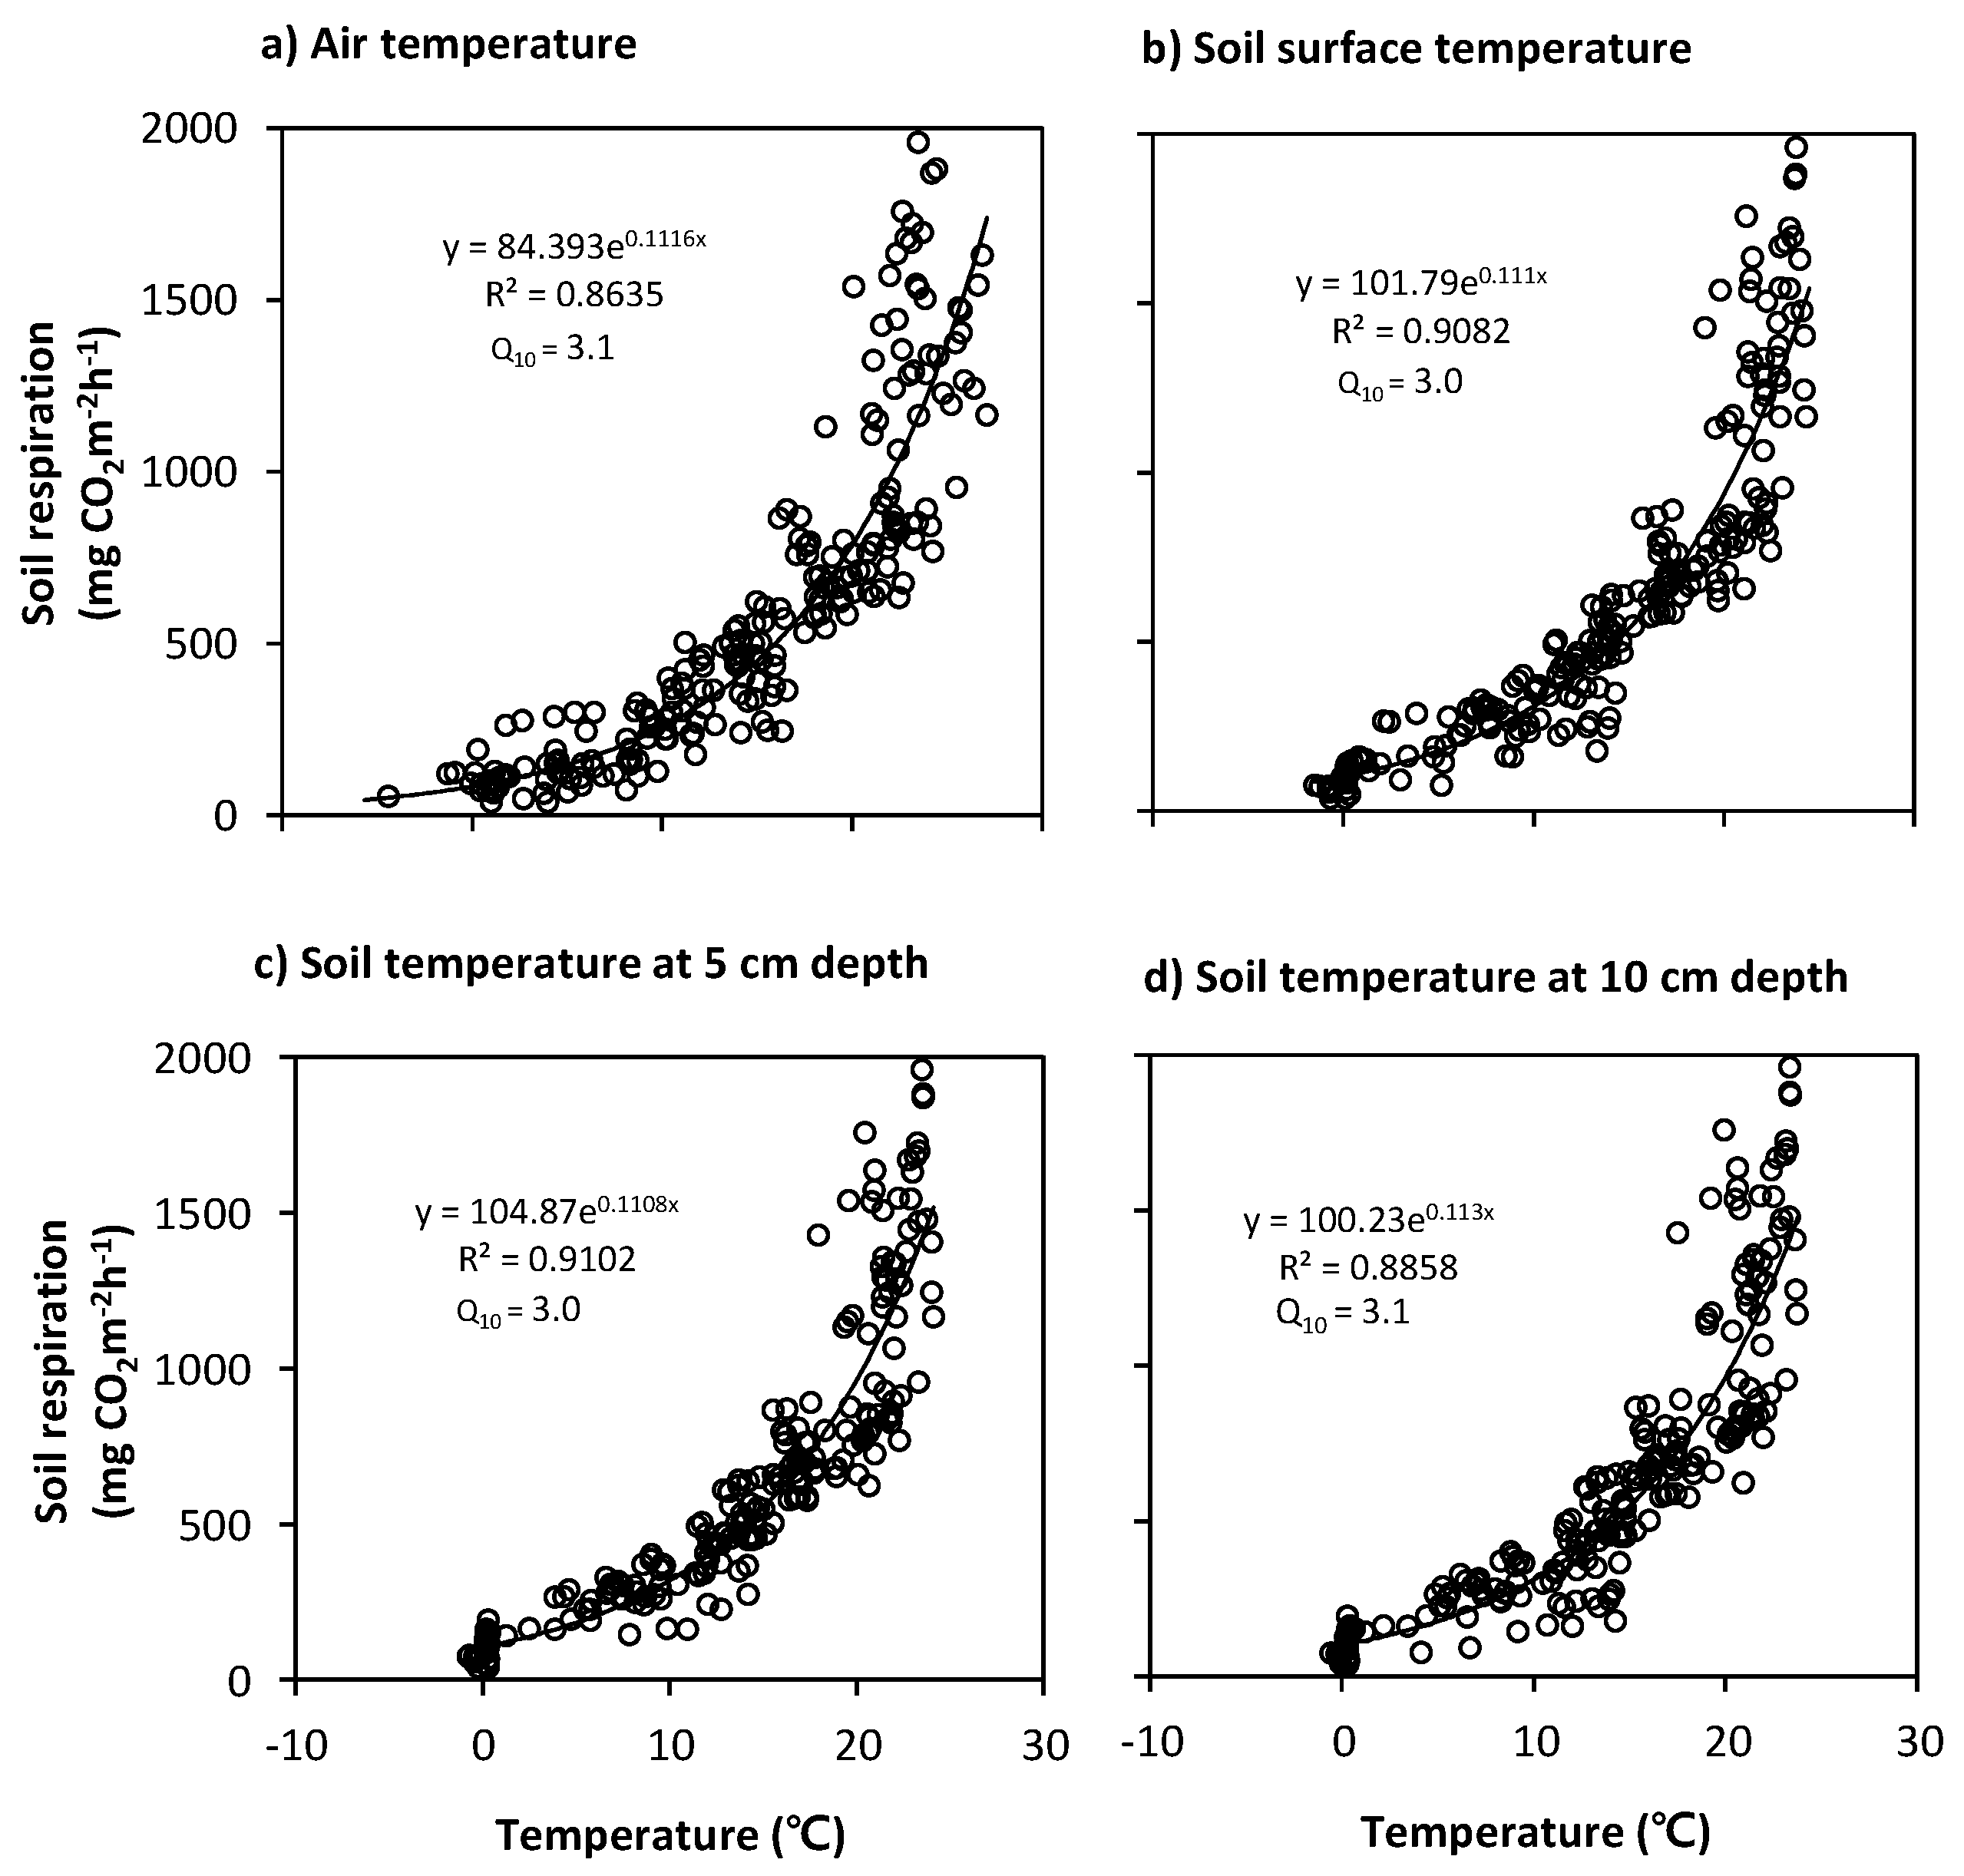
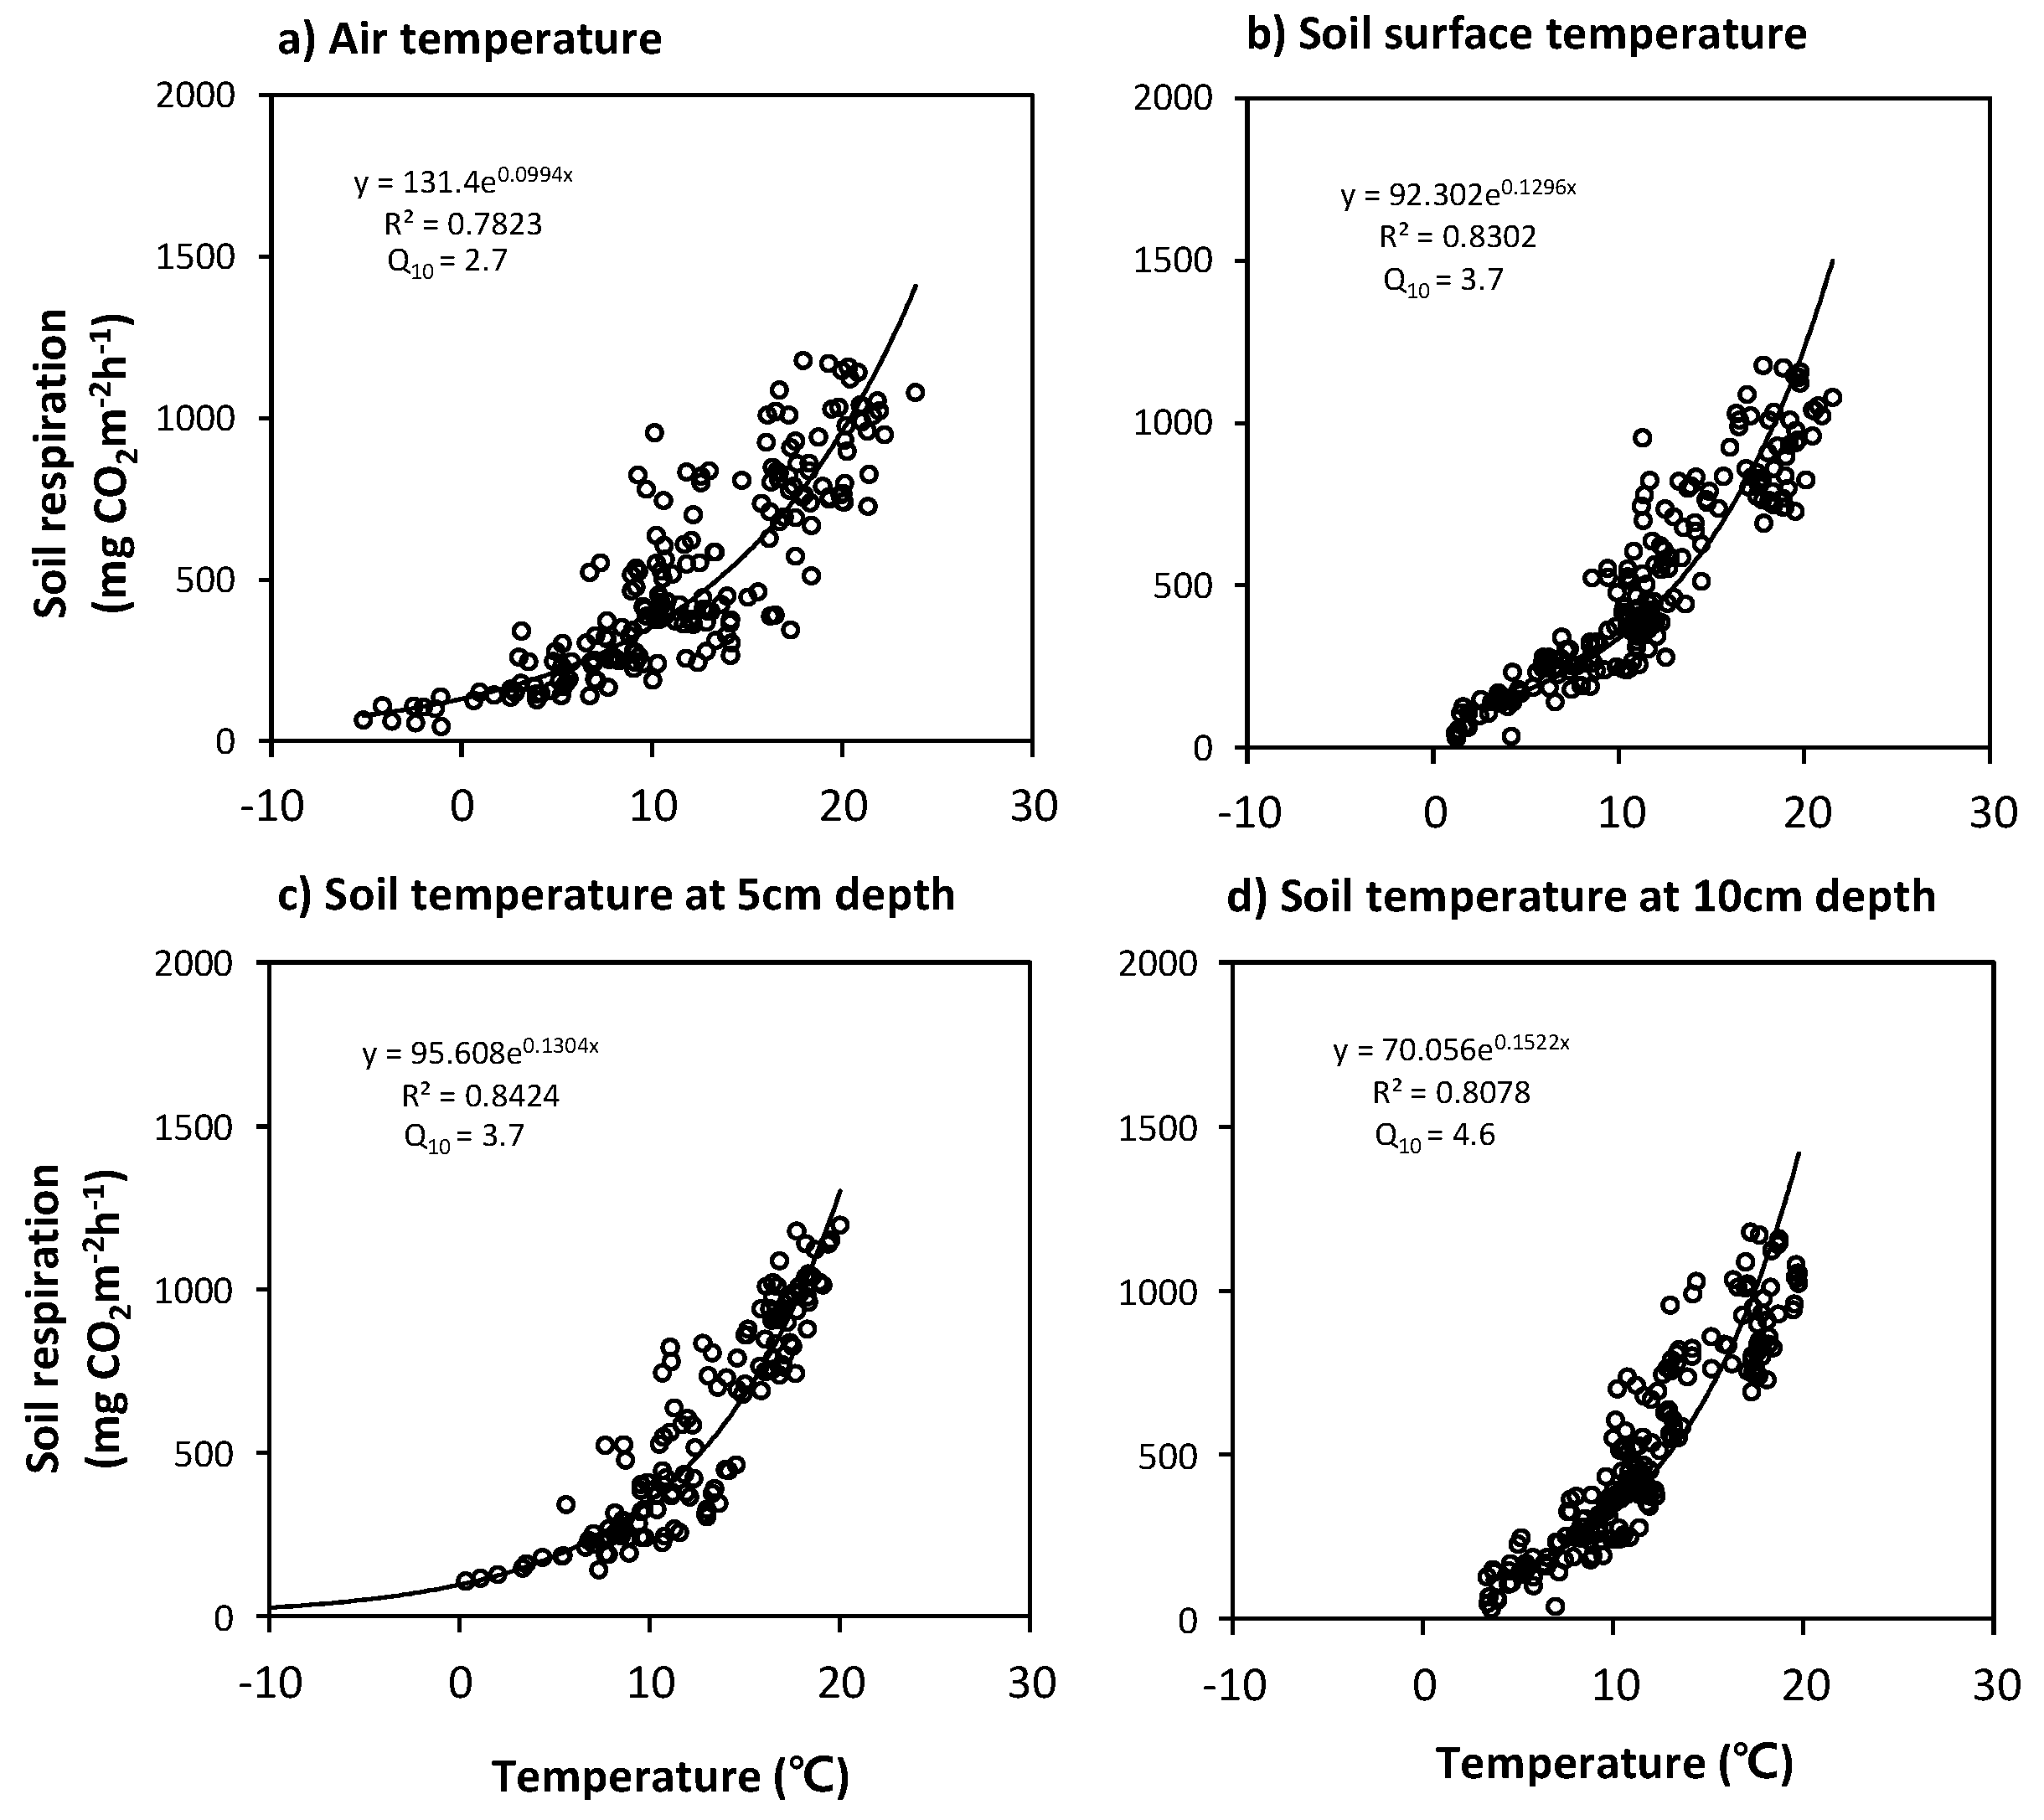
To elucidate the dependence of SR on the temporal variabilities of temperature in the forest stands, optimal regression equations using the exponential form of Equation (2) were derived from the relationships between the daily mean SR rates and the temperatures (Ta, Tss and Ts) observed at several different depths (1.5 m above ground, soil surface, and 5 and 10 cm soil depths) for the entire experimental period (Figure 10 and Figure 11). The Ts measurements at the 5 cm depth were found to be highly correlated with the SR for both forest stands.
The best regression equations [SR(Ts)] for the Q. mongolica forest stands are
SR(Ts) at Mt. Nam = 104.87 exp(0.1108Ts) and
SR(Ts) at Mt. Jeombong = 95.608 exp(0.1304Ts).
Equation (4) (r2 = 0.91, Q10 = 3.0) and Equation (5) (r2 = 0.84, Q10 = 3.7) are valid for the Ts at 5 cm depth, which is above 0 °C, and the rate of SR (Ts) for Ts < 0 °C is near-zero value.
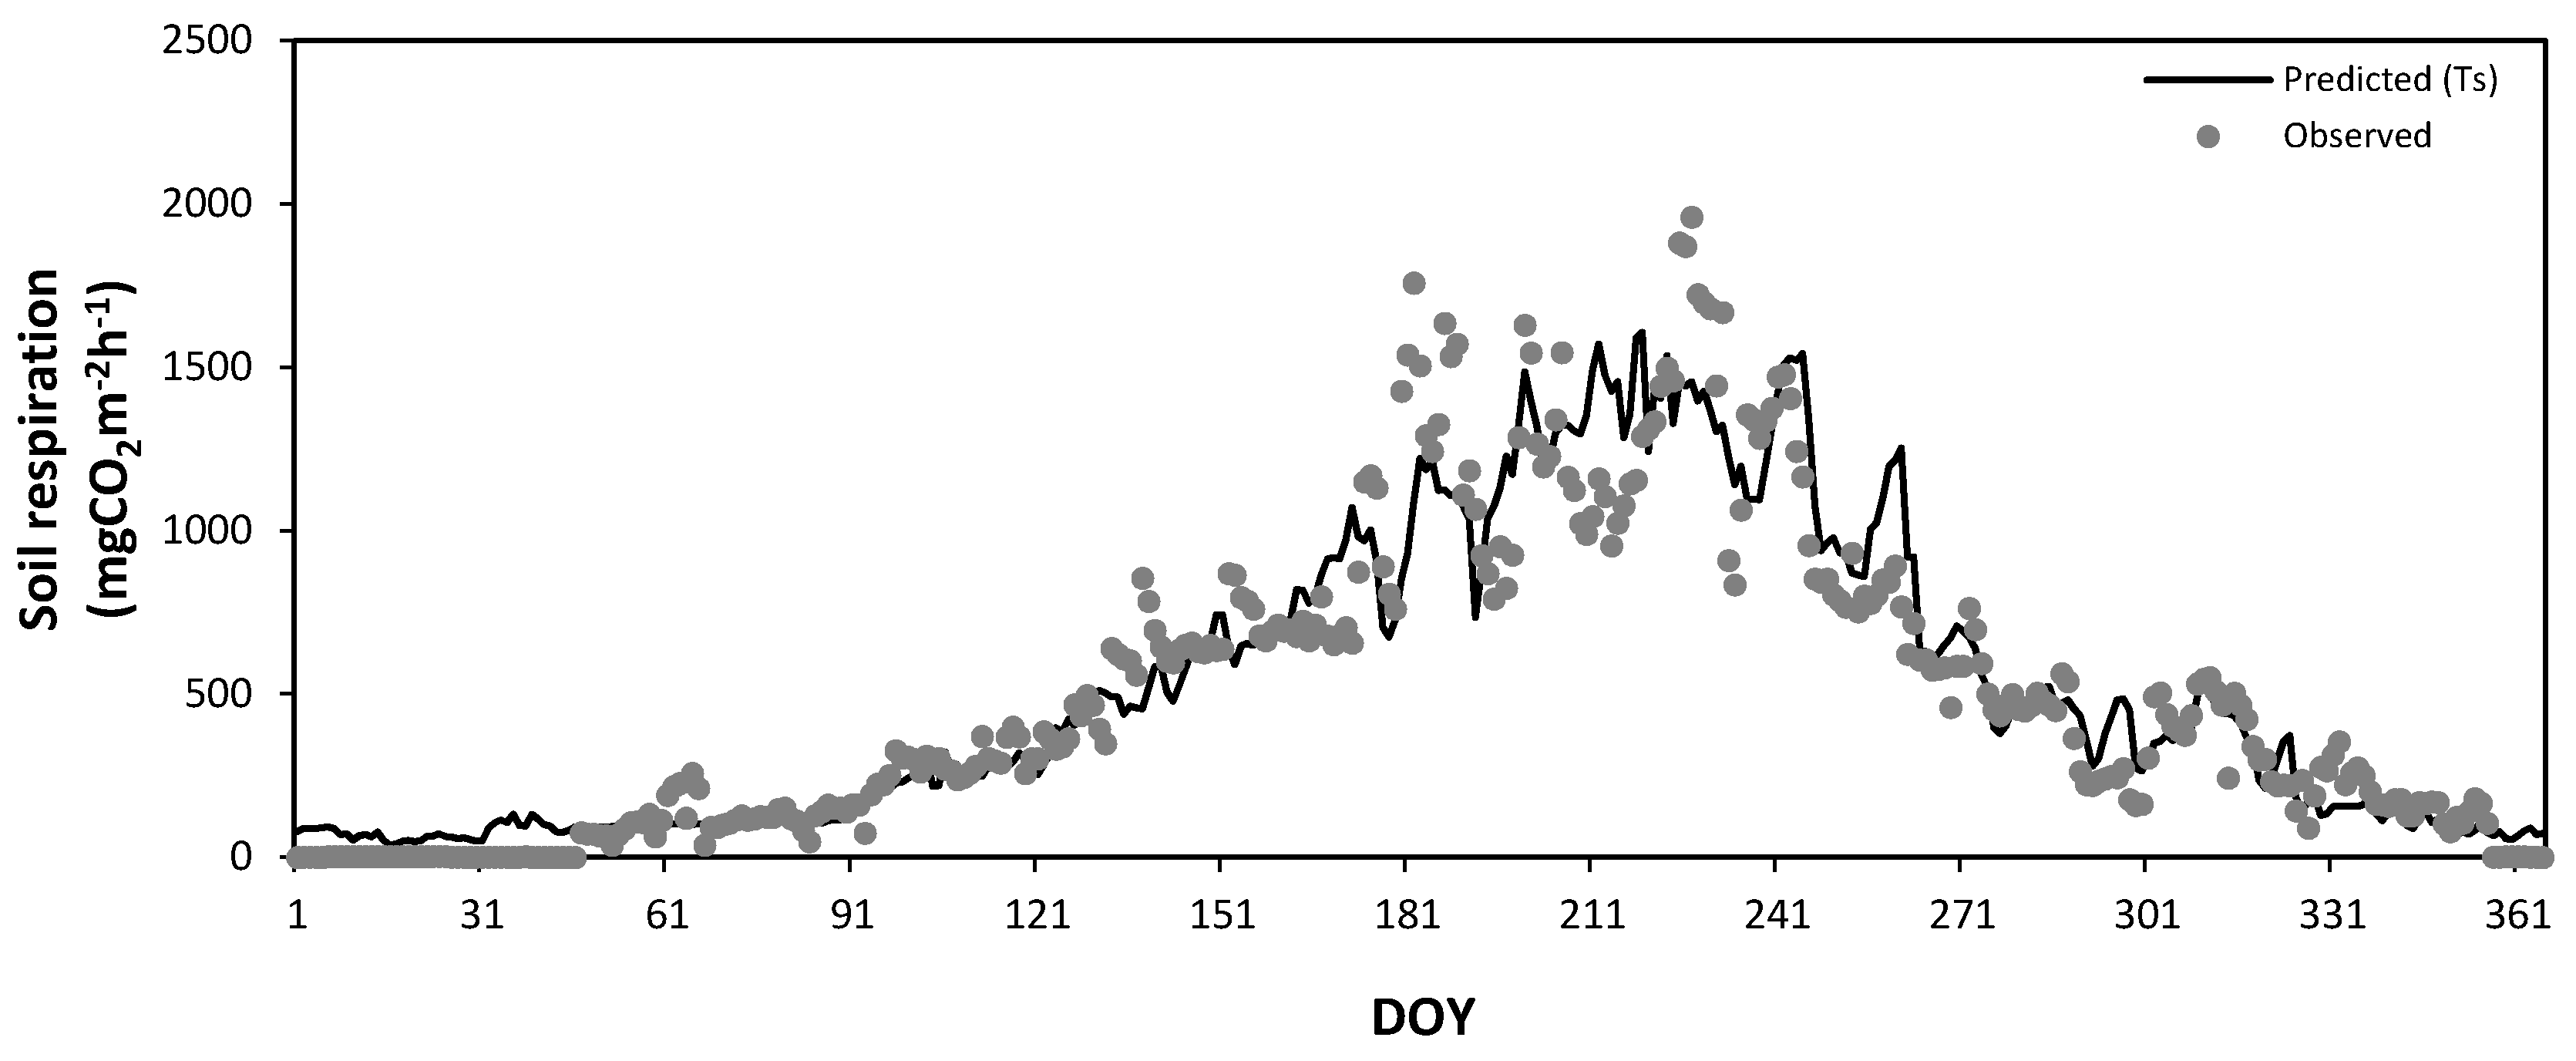
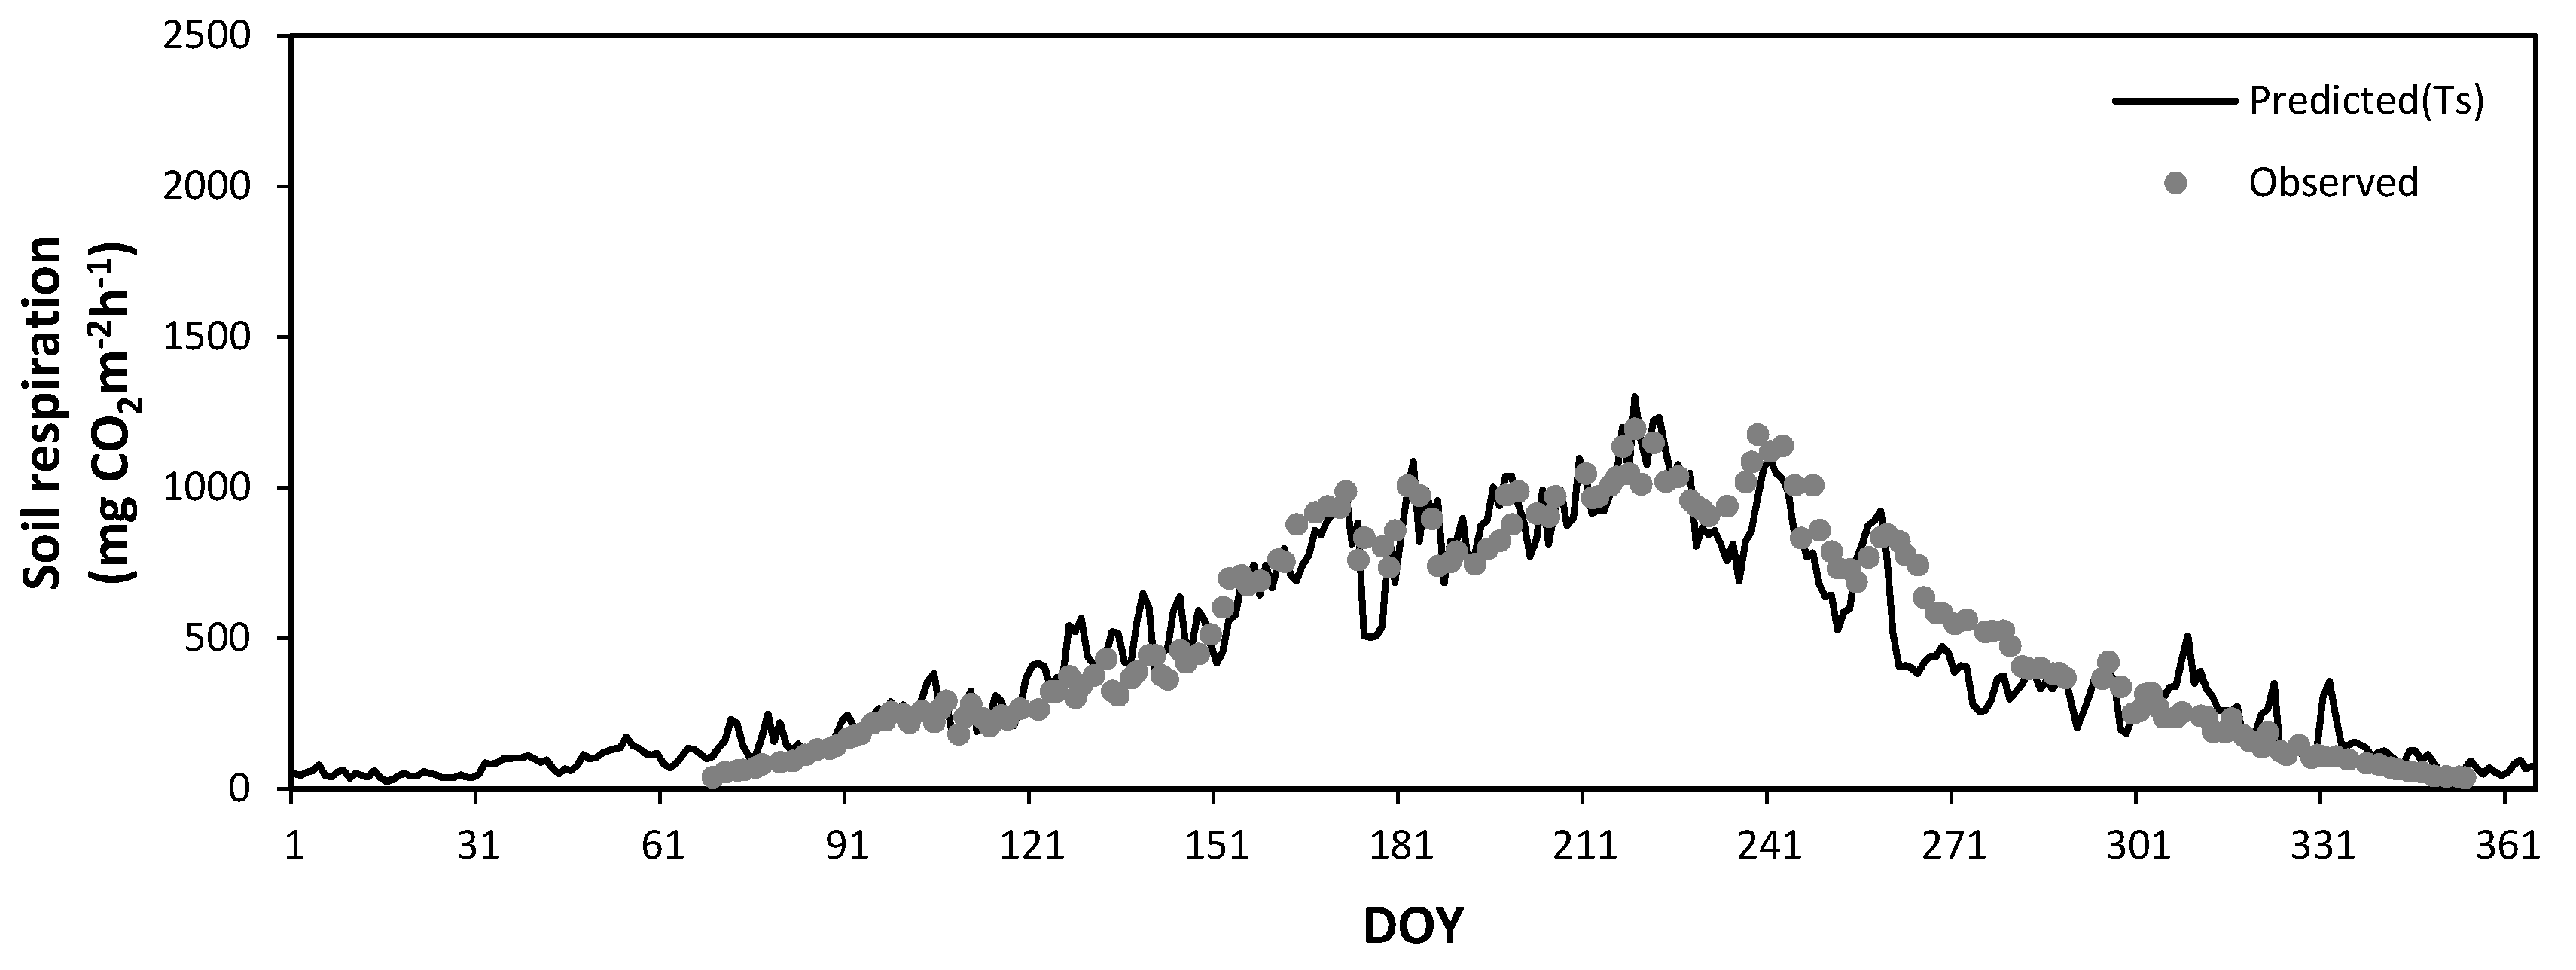
Figure 12 and Figure 13 show the seasonal variations in the observed daily mean SR rates at Mt. Nam (Figure 8) and Mt. Jeombong (Figure 9) along with the values predicted by Equations (4) and (5) using the soil temperature at the 5 cm depth. The best regression equations in Figure 12 and Figure 13 reflect the seasonal trends of the observed daily mean SR rates for both Q. mongolica forest stands well; however, they cannot explain the peak SR values observed. The abrupt short-term fluctuations in the observed SR rates seem to be related to the SWC fluctuations in both forest stands.
3.4. Relationships between Soil Respiration and Soil Water Content
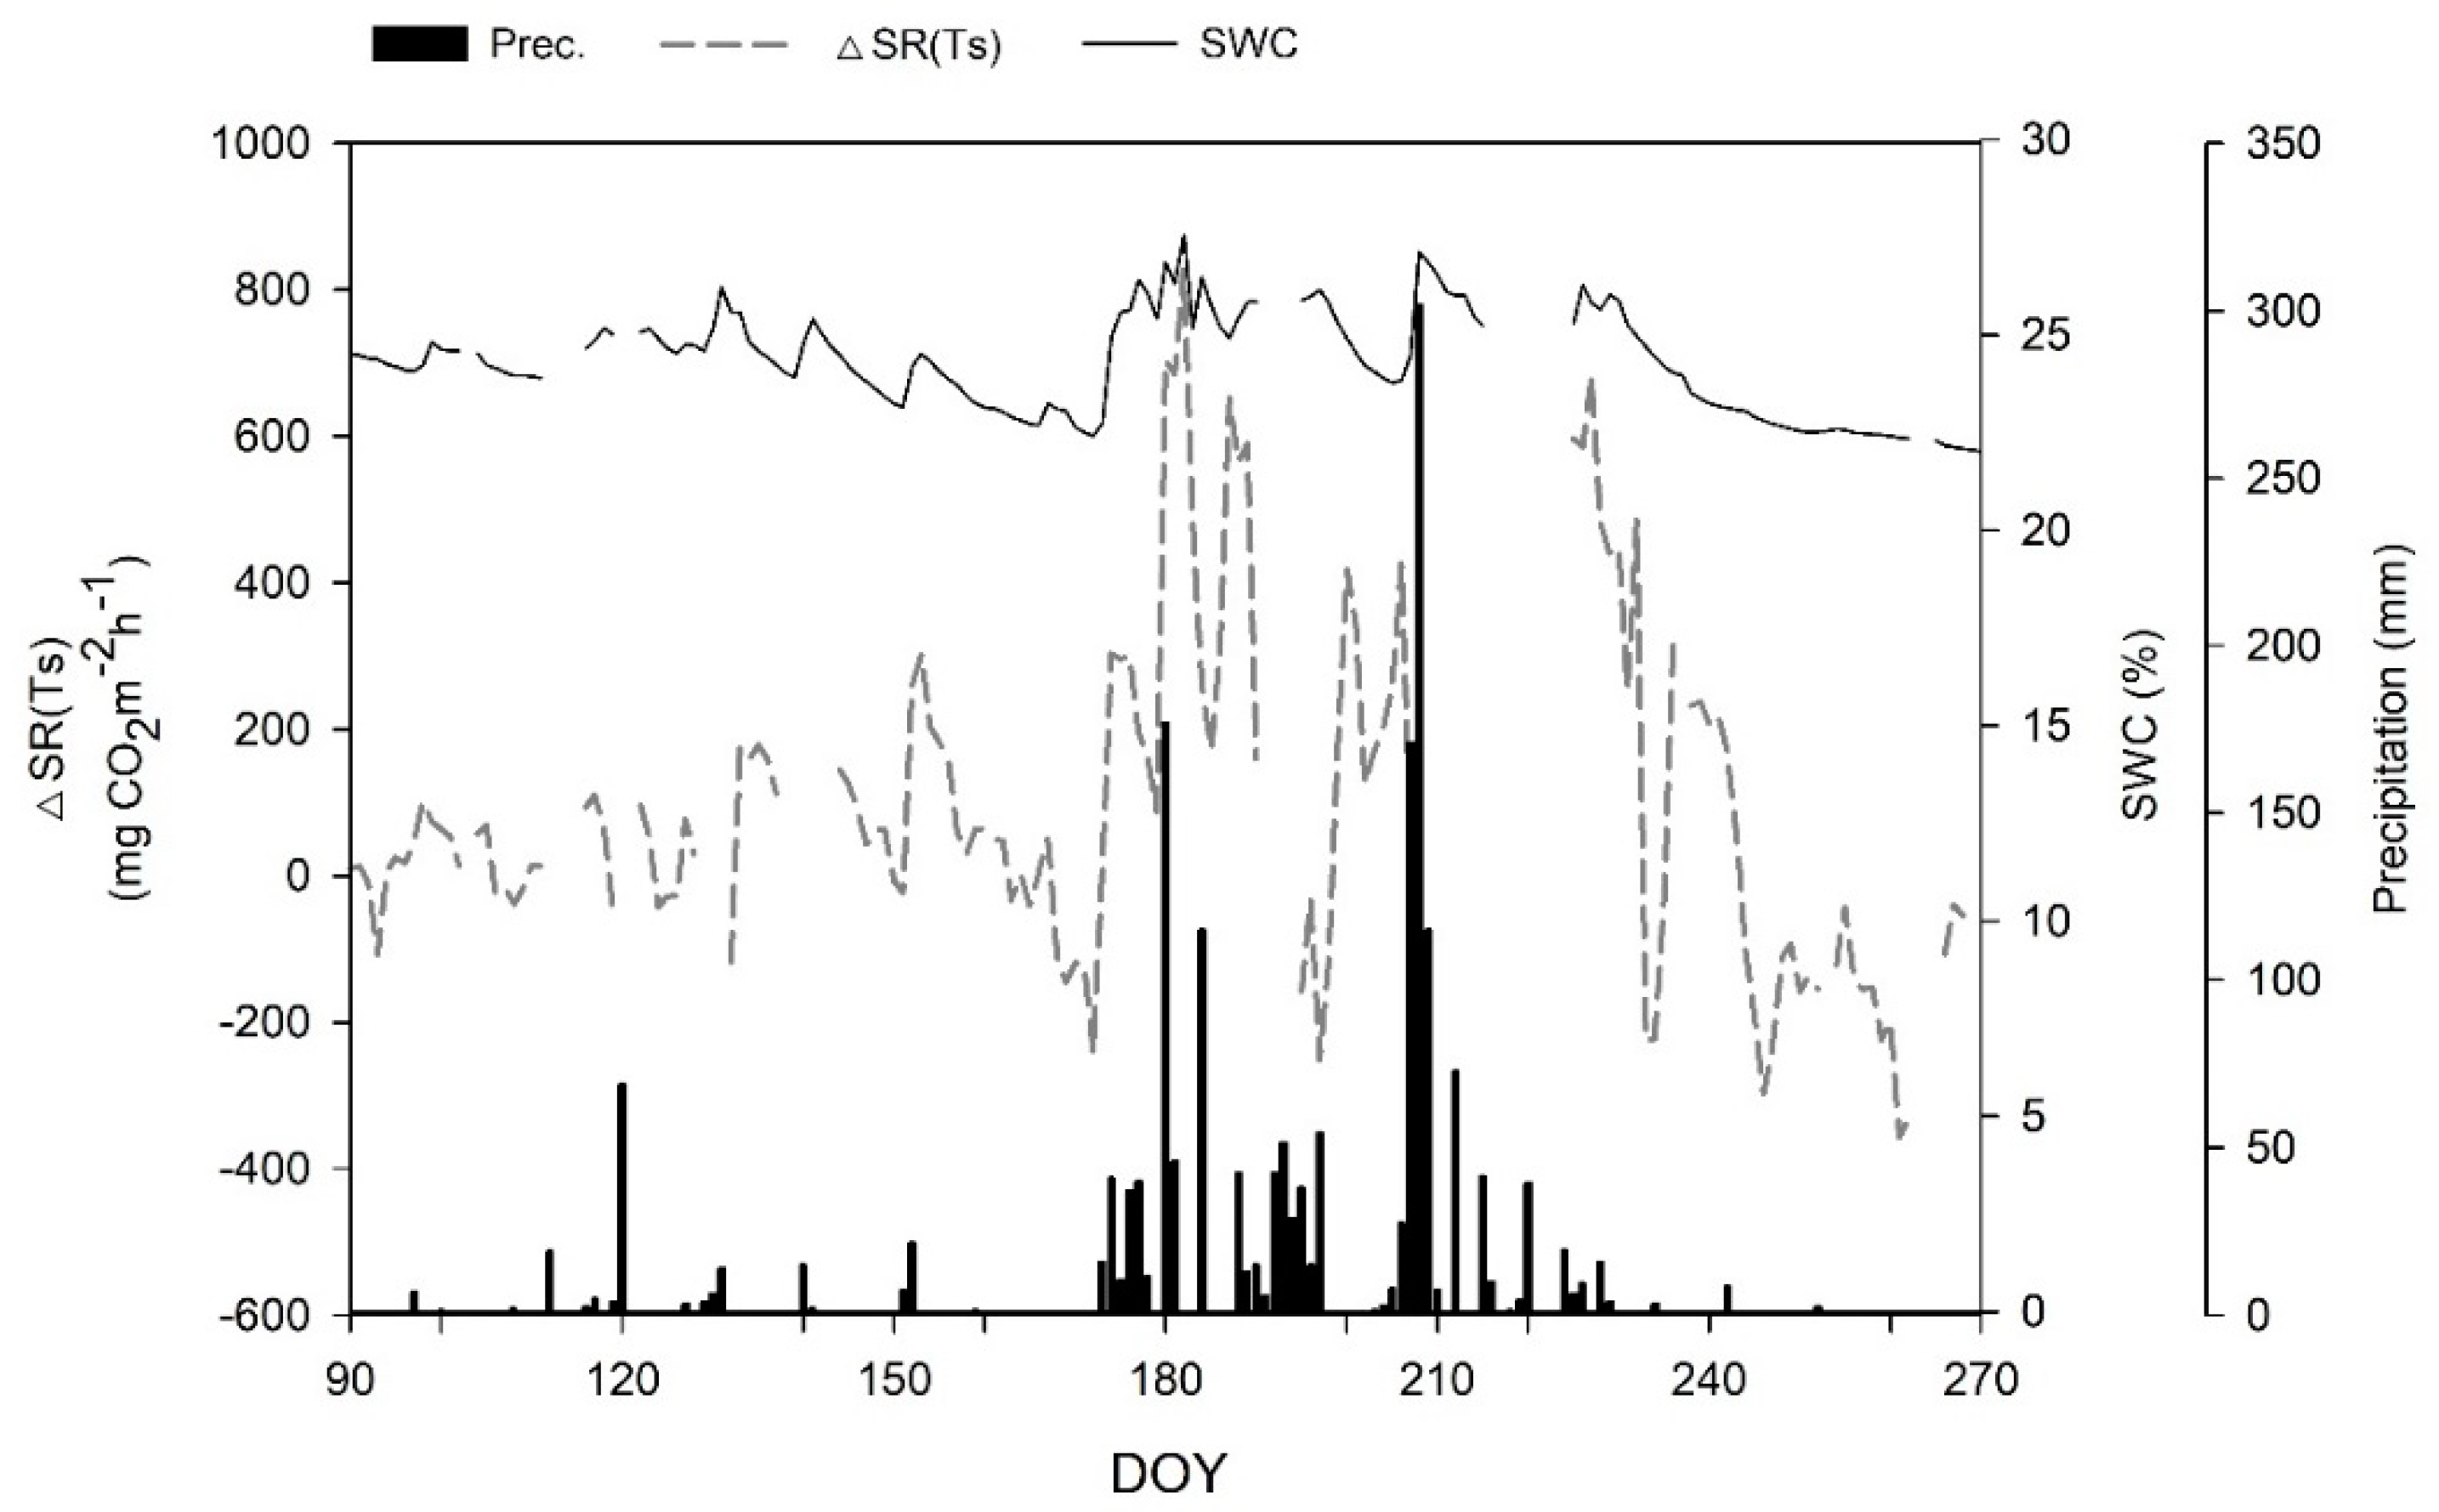
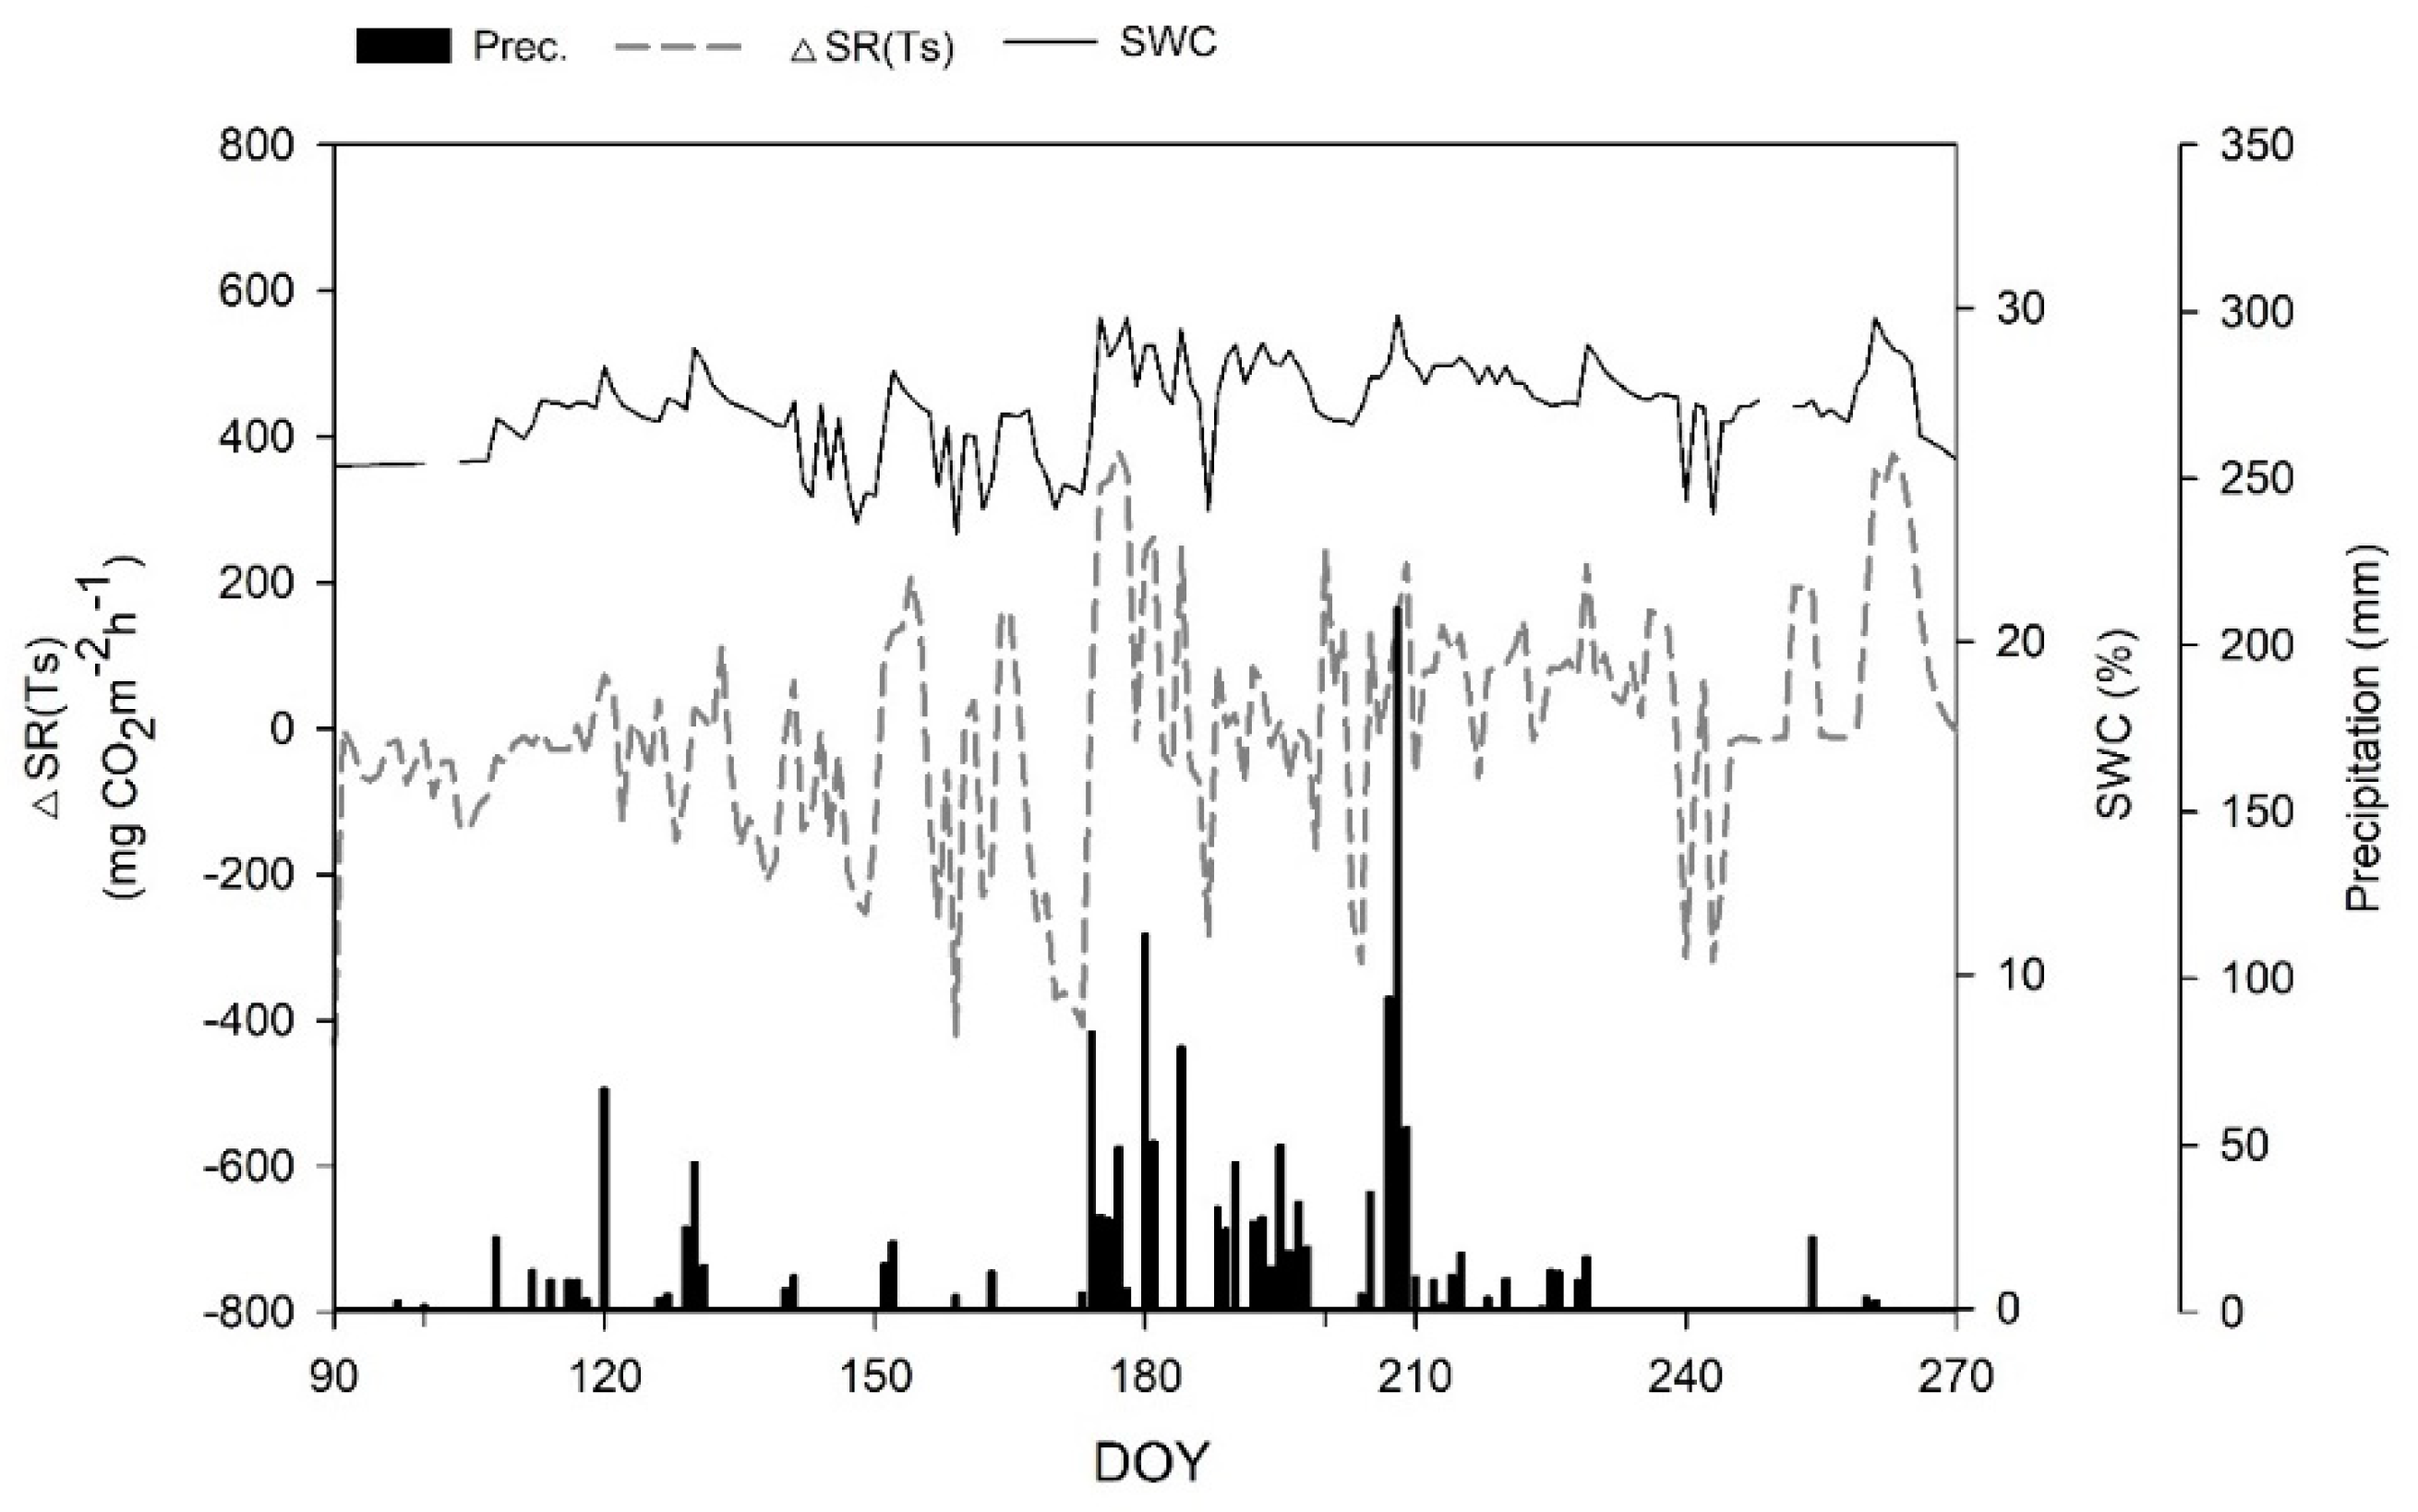
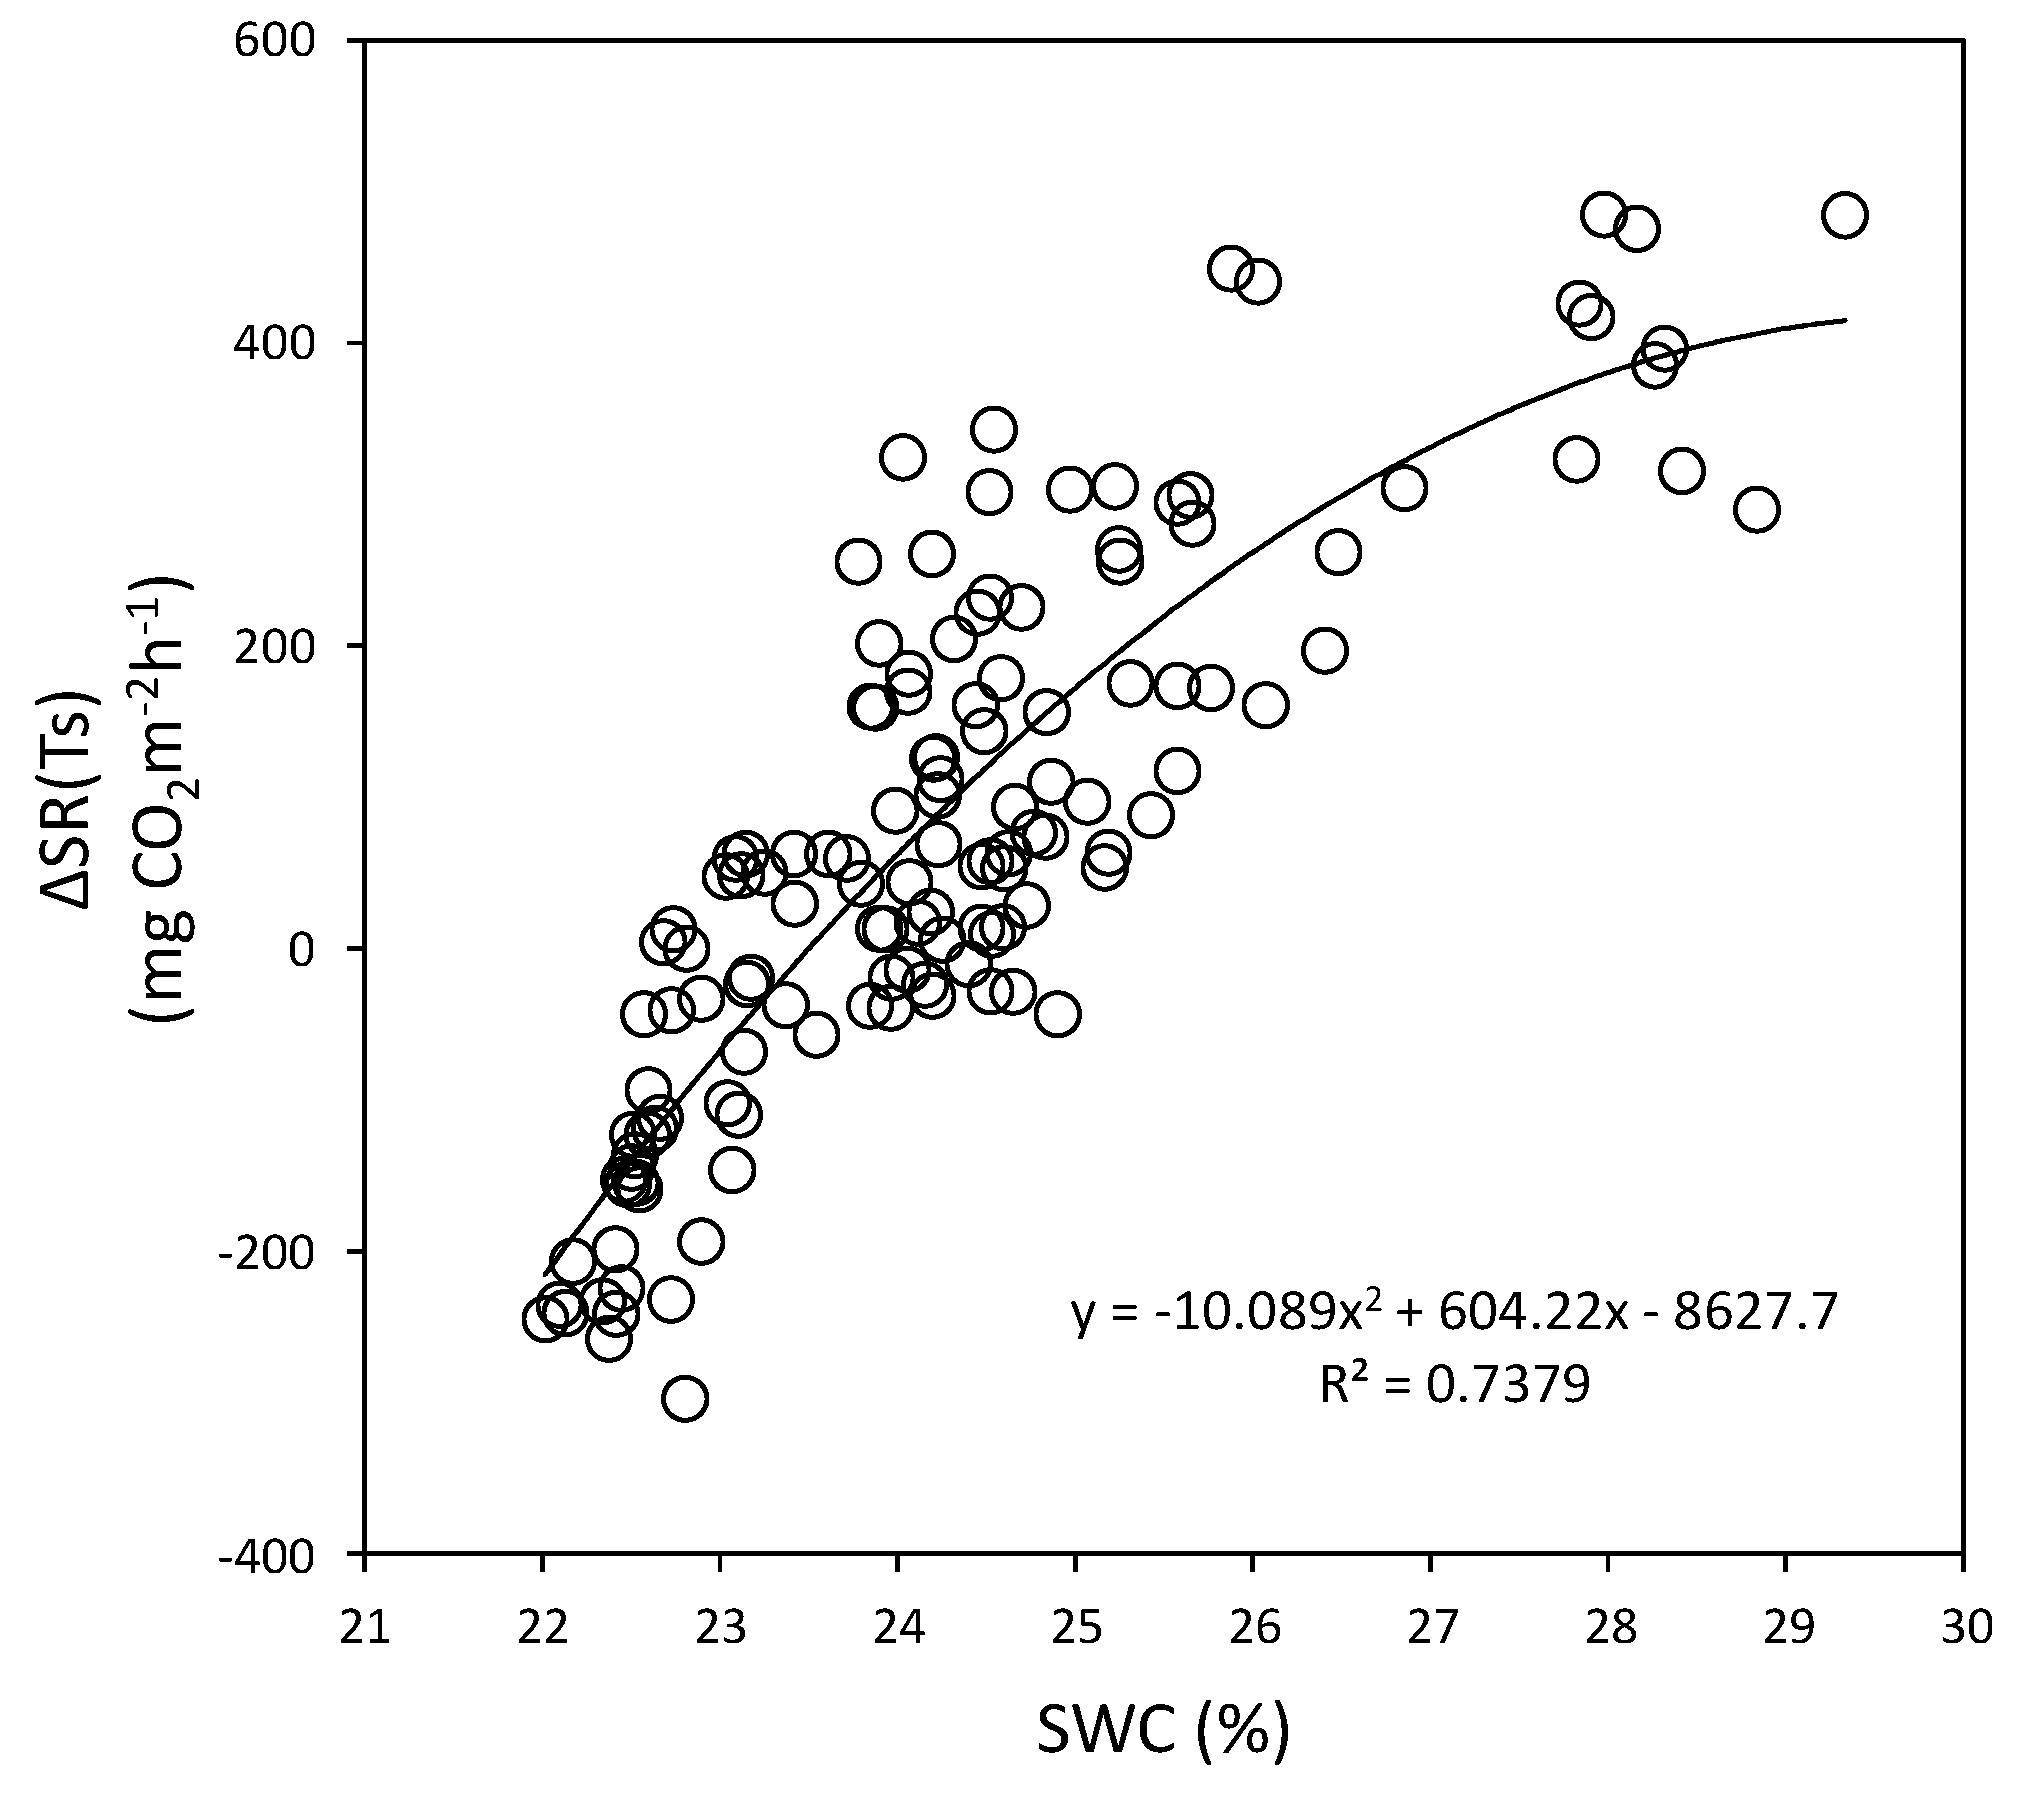
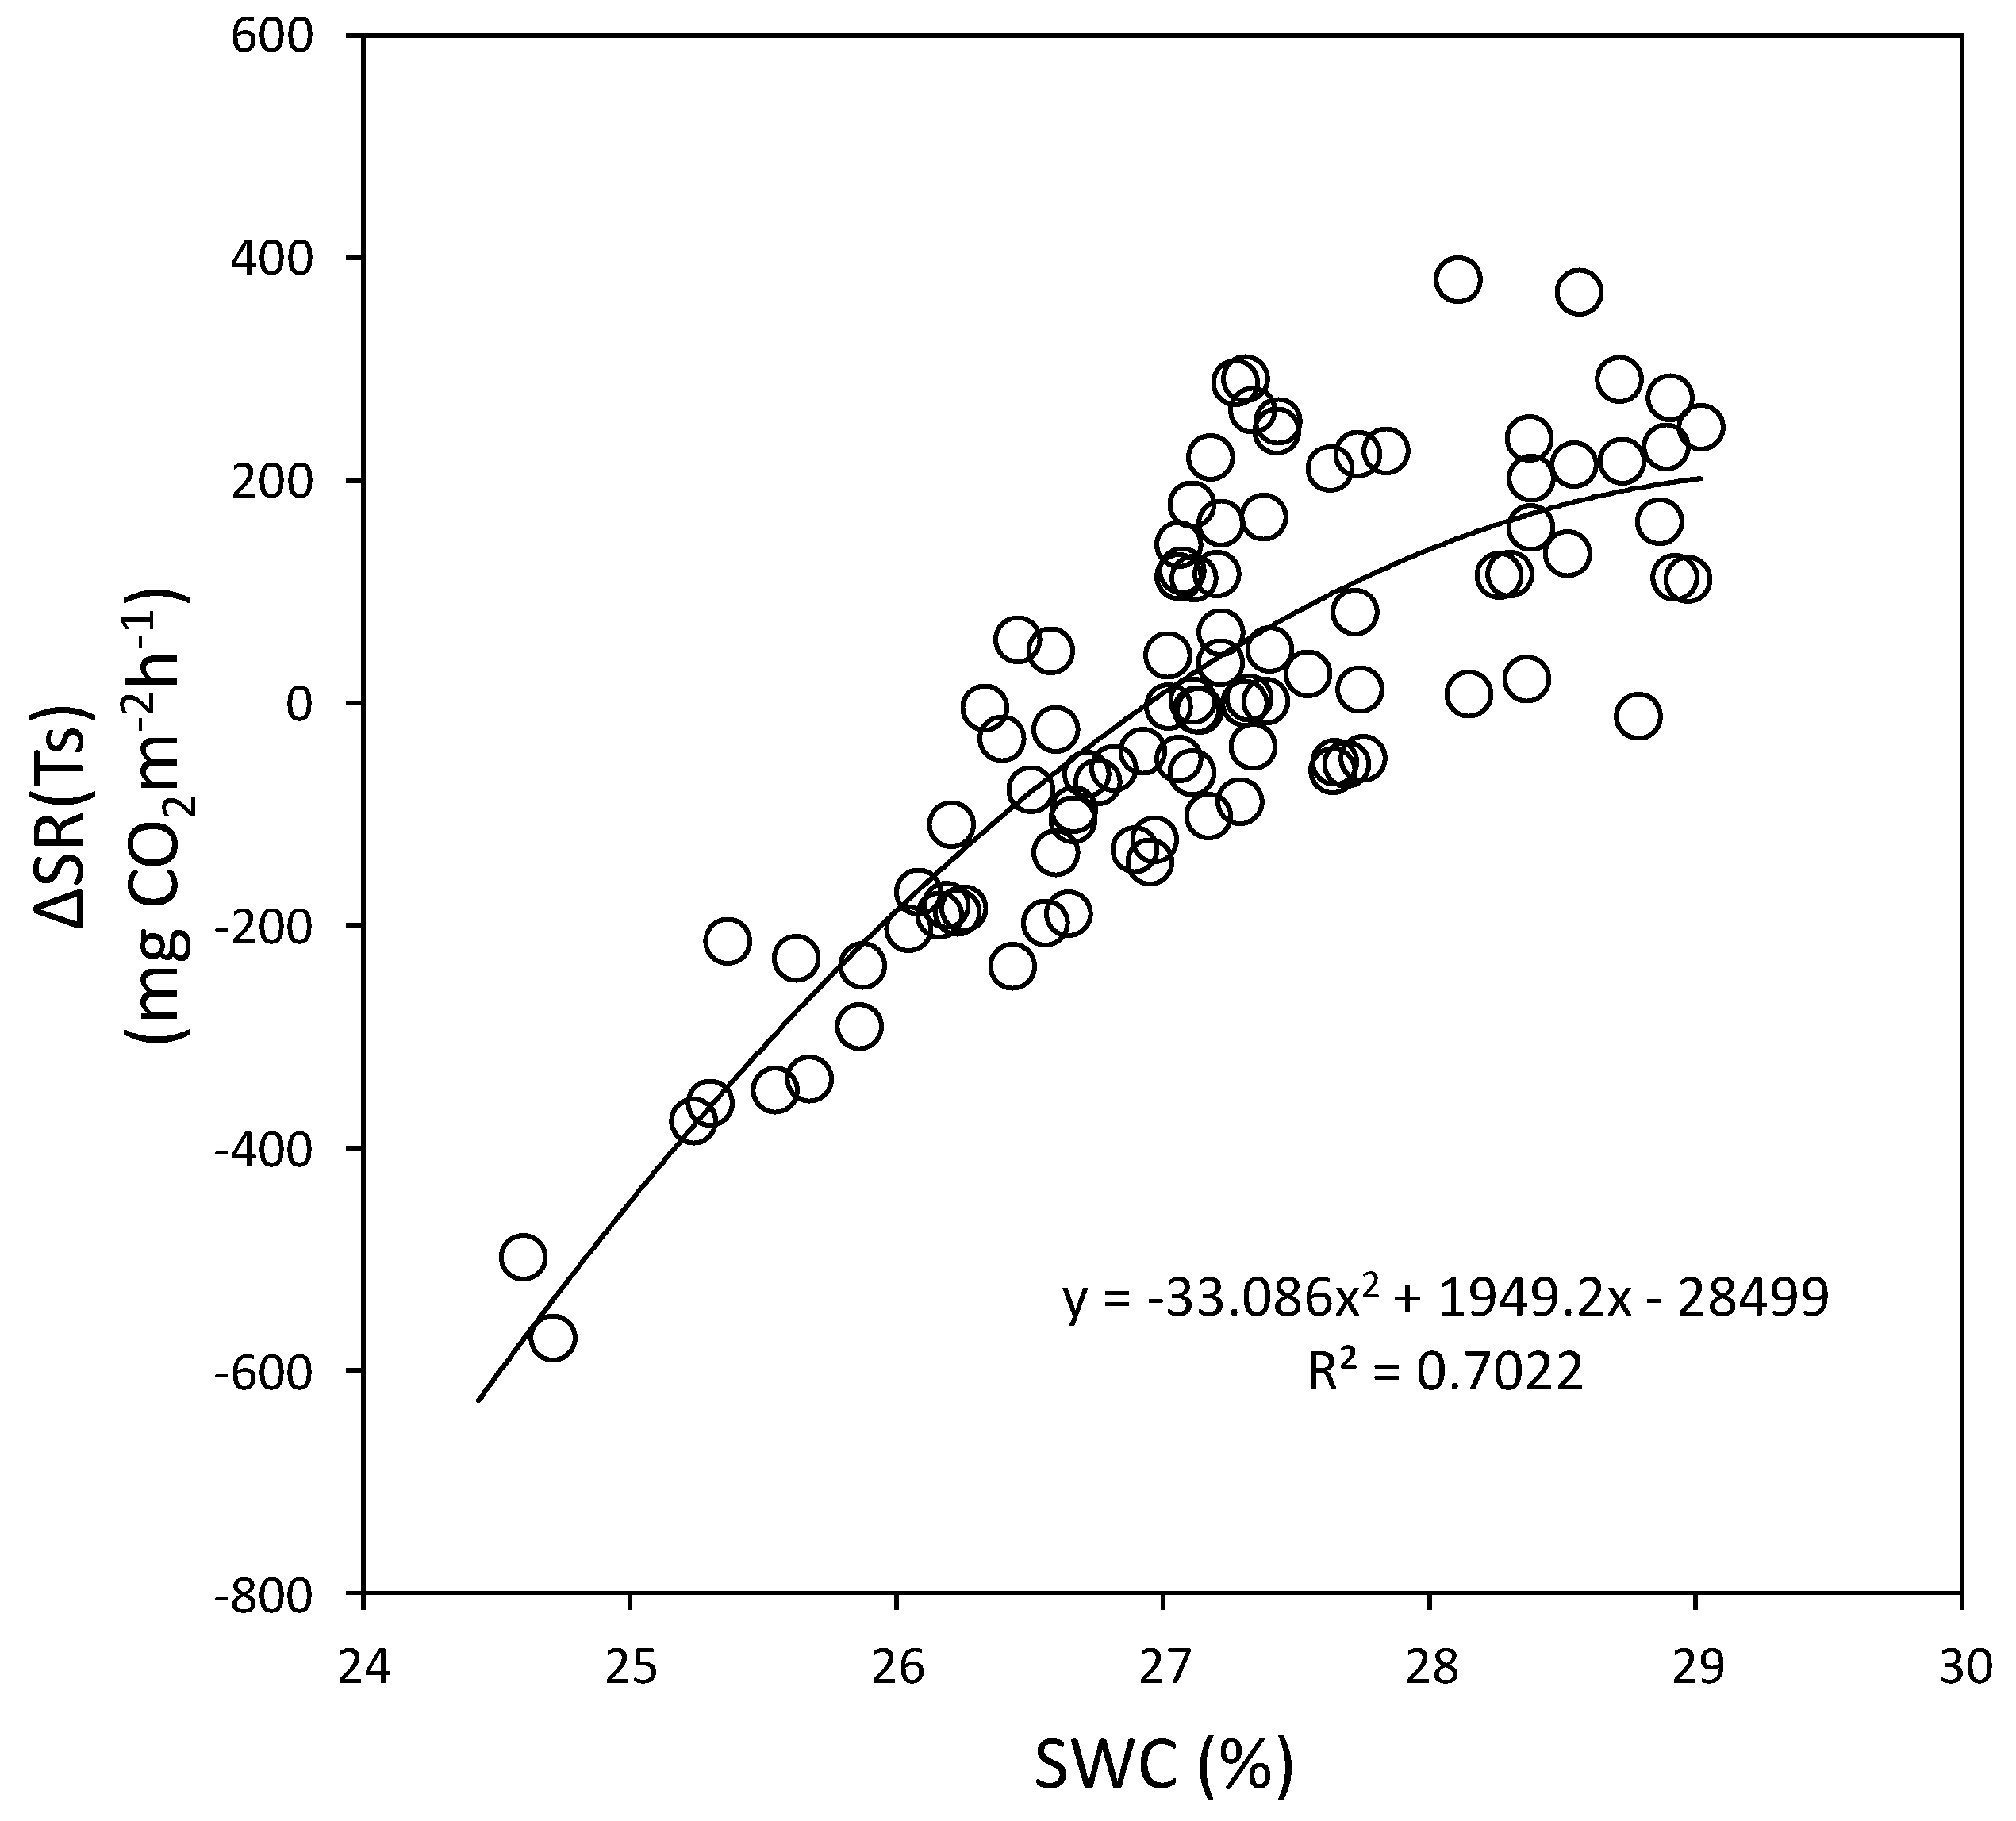
To identify the dependence of SR on the temporal variability of SWC in the Q. mongolica forests, we ran a time series of the difference [ΔSR(Ts)] between the observed and predicted (regressions using Equations (4) or (5)) values, the SWC measured at a 15 cm depth, and the daily total precipitation (mm d−1) in each forest stand (Figure 14 and Figure 15). The SWC was markedly correlated with the precipitation rate in both forest stands, and the peak ΔSR(Ts) values were closely associated with the dramatic increase in SWC during the forest growing season. Figure 16 (Mt. Nam) and Figure 17 (Mt. Jeombong) show the clear correlation between ΔSR(Ts) and SWC for both Q. mongolica forest stands.
The best regression equations between the ΔSR(Ts) and SWC using second order polynomial equations for the Mt. Nam and Mt. Jeombong Q. mongolica forest stands are as follows:
Equations (6) and (7) indicate that SR increases at Mts. Nam (r2 = 0.74) and Jeombong (r2 = 0.70) with increases in SWC up to 29.2% and 28.9%, respectively. But SR tended to remain at a stable state in further increase in SWC.
Mt. Nam ΔSR(Ts) = −10.09(SWC)2 + 604.2(SWC) − 8627.7
Mt. Jeombong ΔSR(Ts) = −33.086(SWC)2 + 1949.2(SWC) − 28499.
3.5. Seasonal Variation of Soil Respiration Estimated by Soil Temperature and Soil Water Content
To quantify the seasonal variability in the SR rates in the Q. mongolica forest stands at Mts. Nam and Jeombong, optimal integrated regression equations were constructed with both the Ts and SWC variables driving the SR rates.
The integrated SR = SR(Ts) + RSR(Ts) =
for Mts. Nam and Jeombong, respectively. The SR rate = 0 for Ts < 0 °C
104.87 exp(0.1108Ts) − 10.09(SWC)2 + 604.2(SWC) − 8627.7 and
95.608 exp(0.1304Ts) − 33.086(SWC)2 + 1949.2(SWC) − 28499
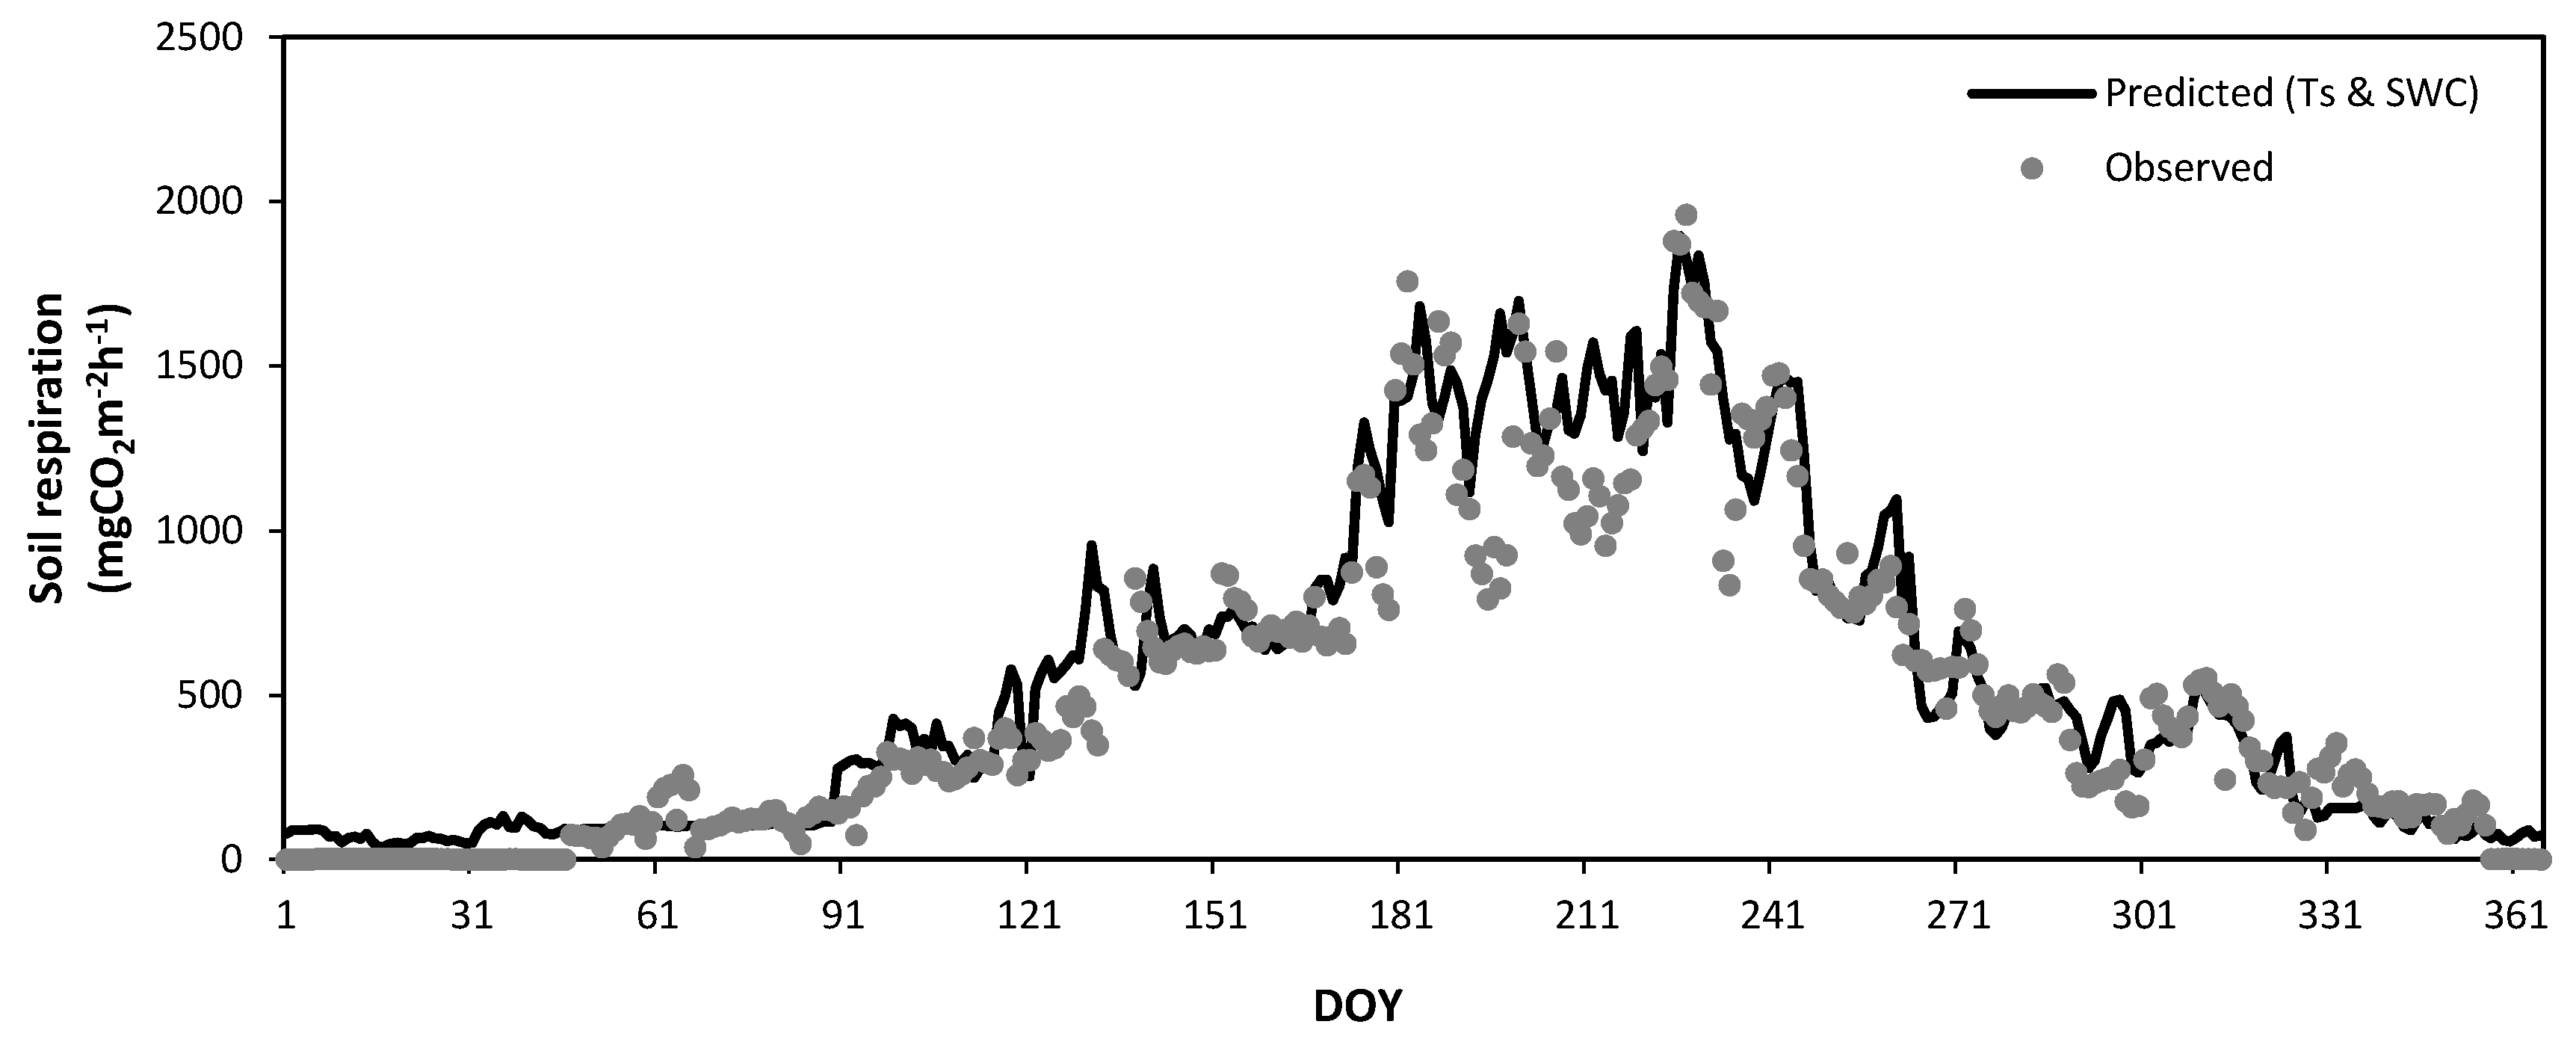
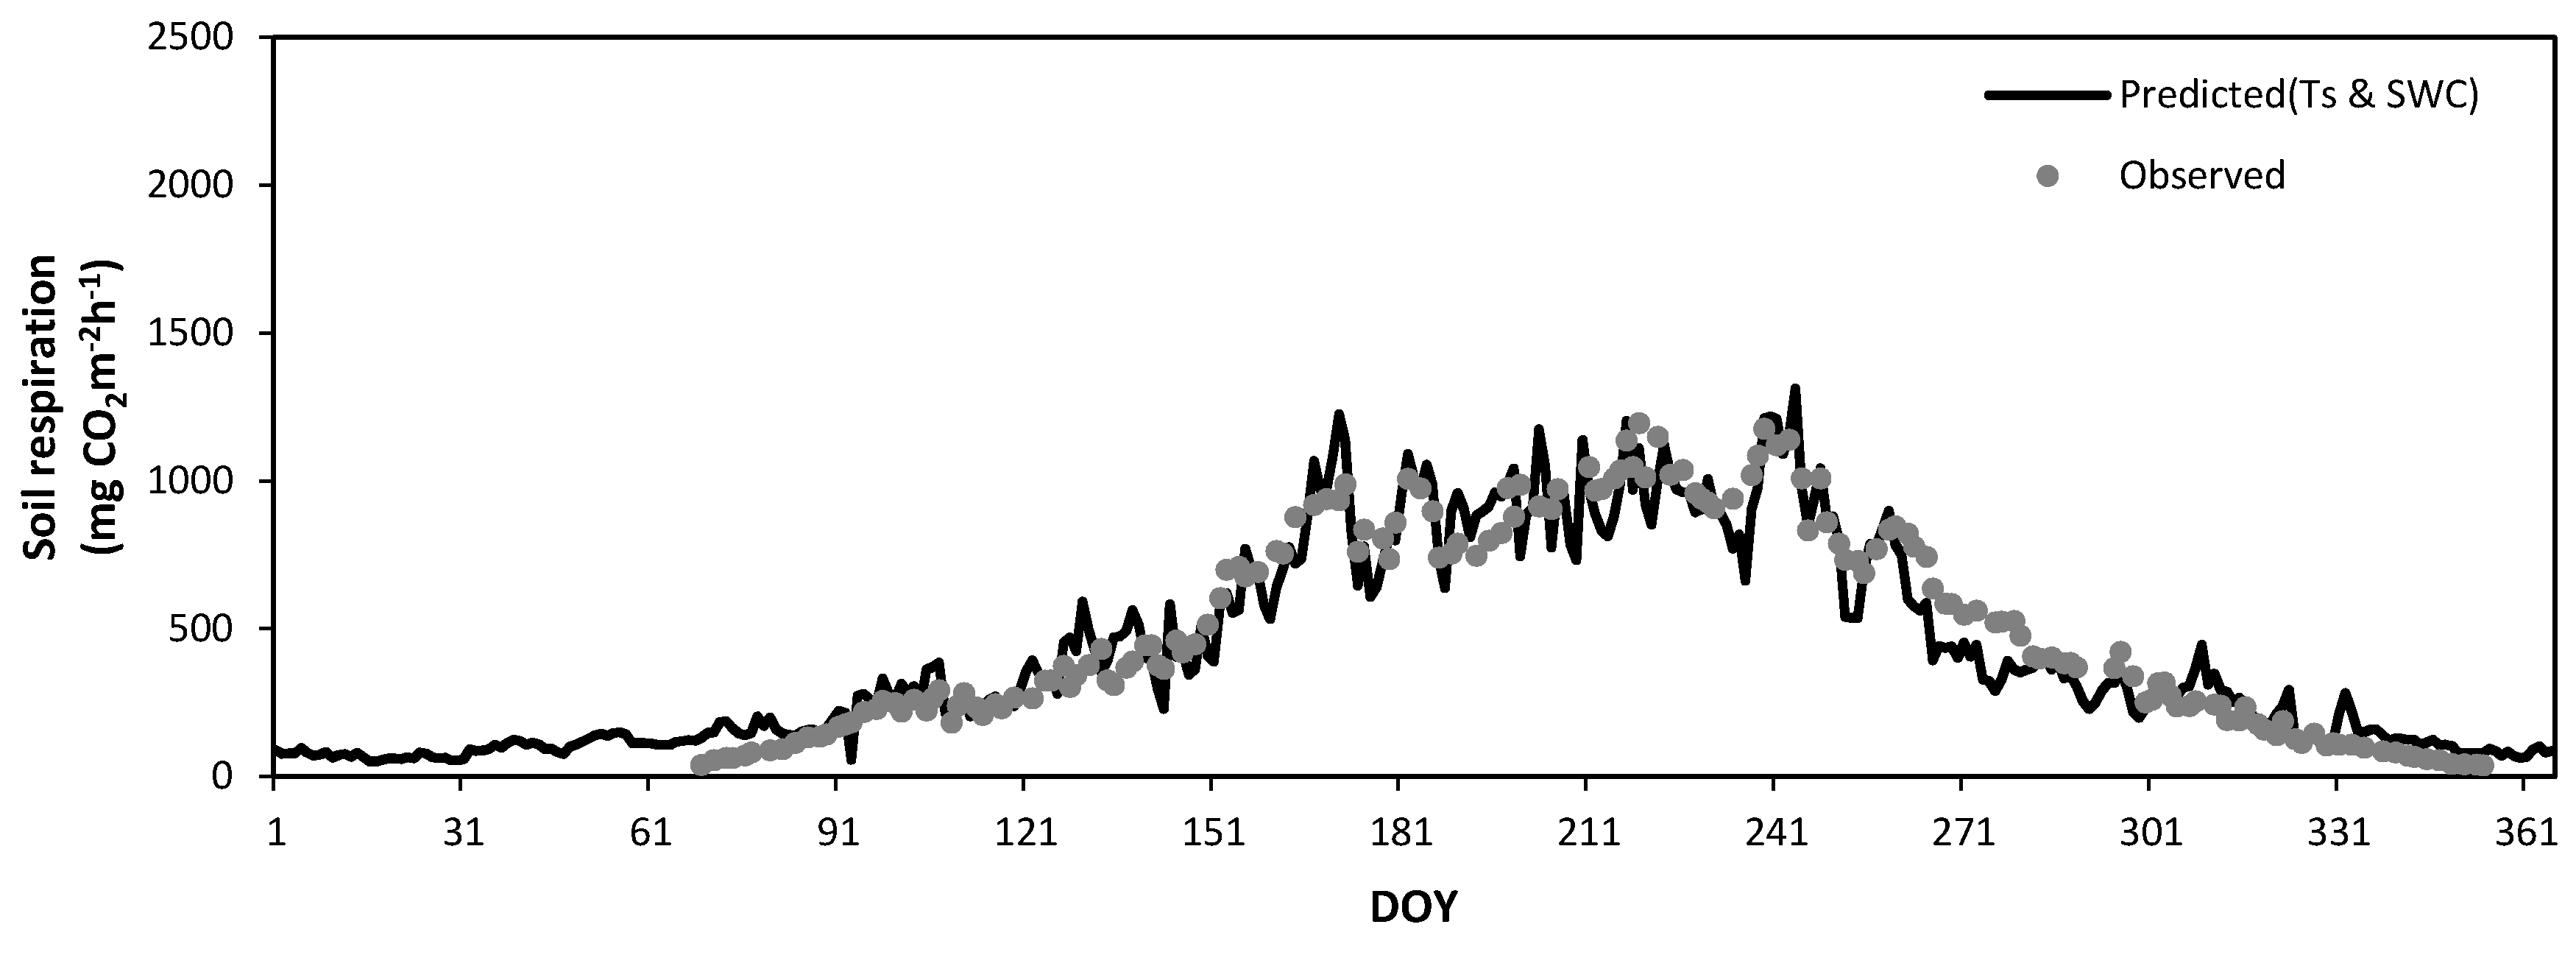
Equations (8) and (9) were quite effective for use at all temperature (T) ranges in the two forest stands, whereas the SWC variables were more effective for the Q. mongolica forest growing season (Figure 18 and Figure 19).
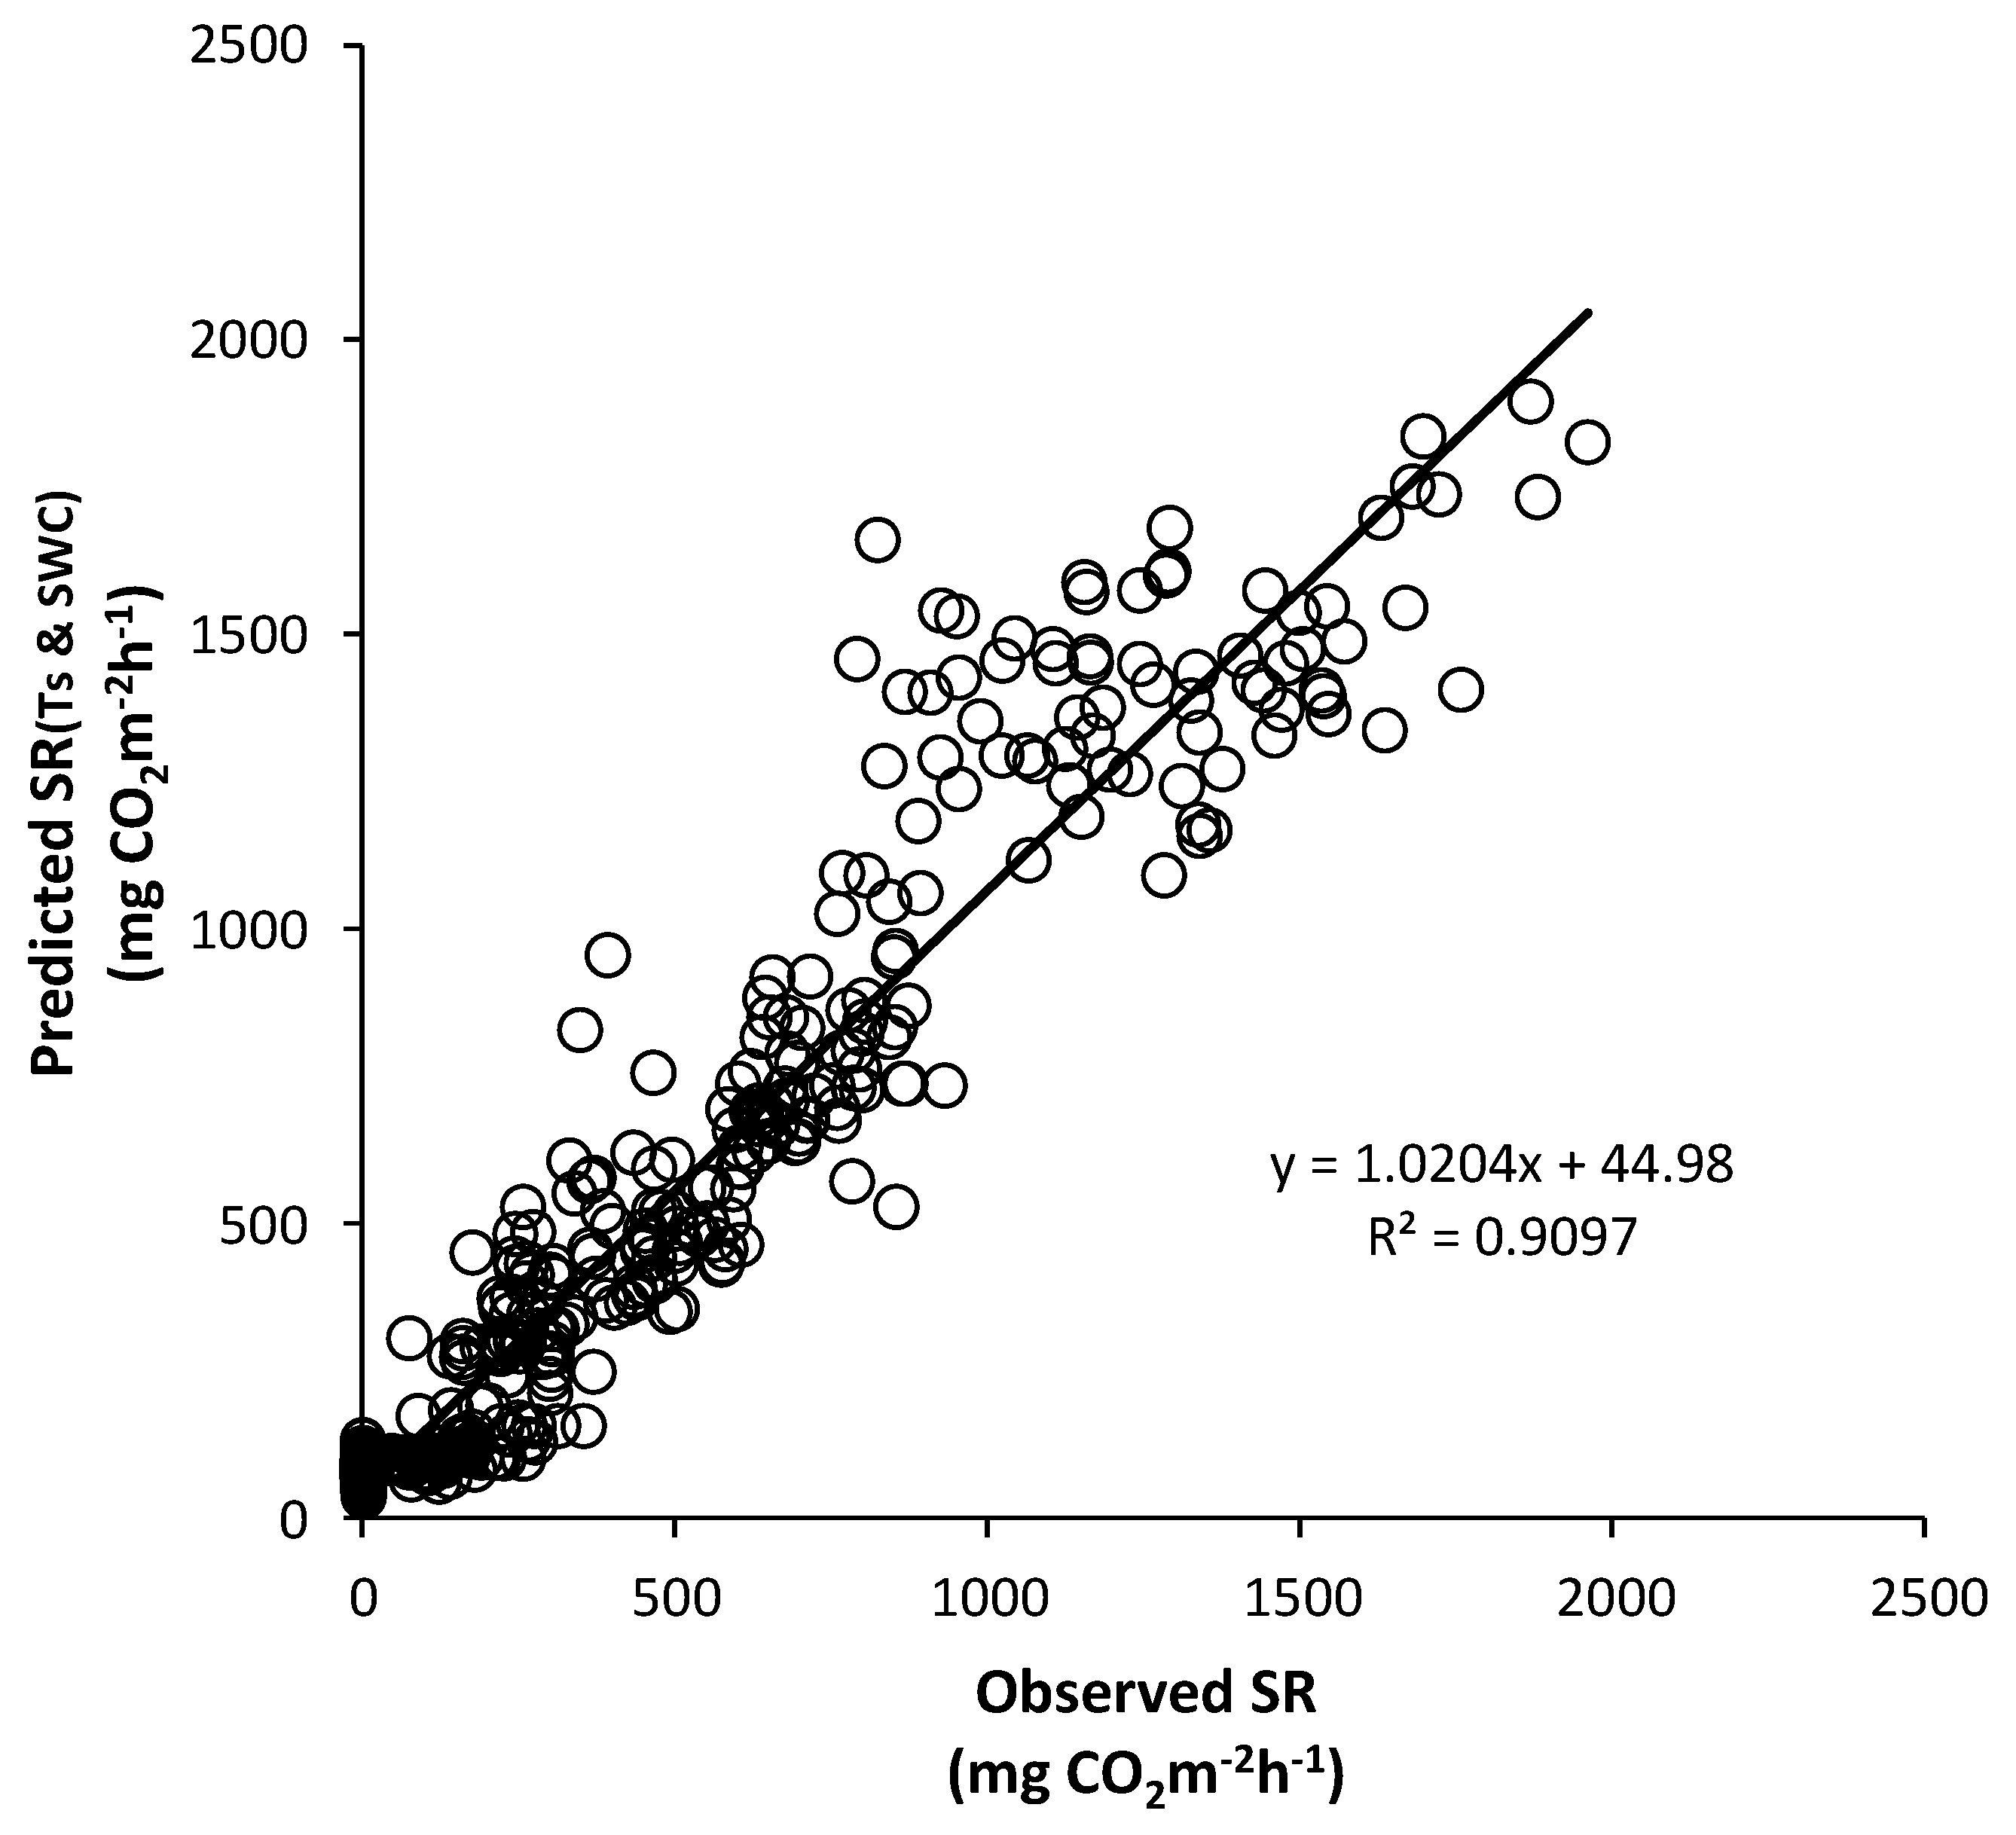
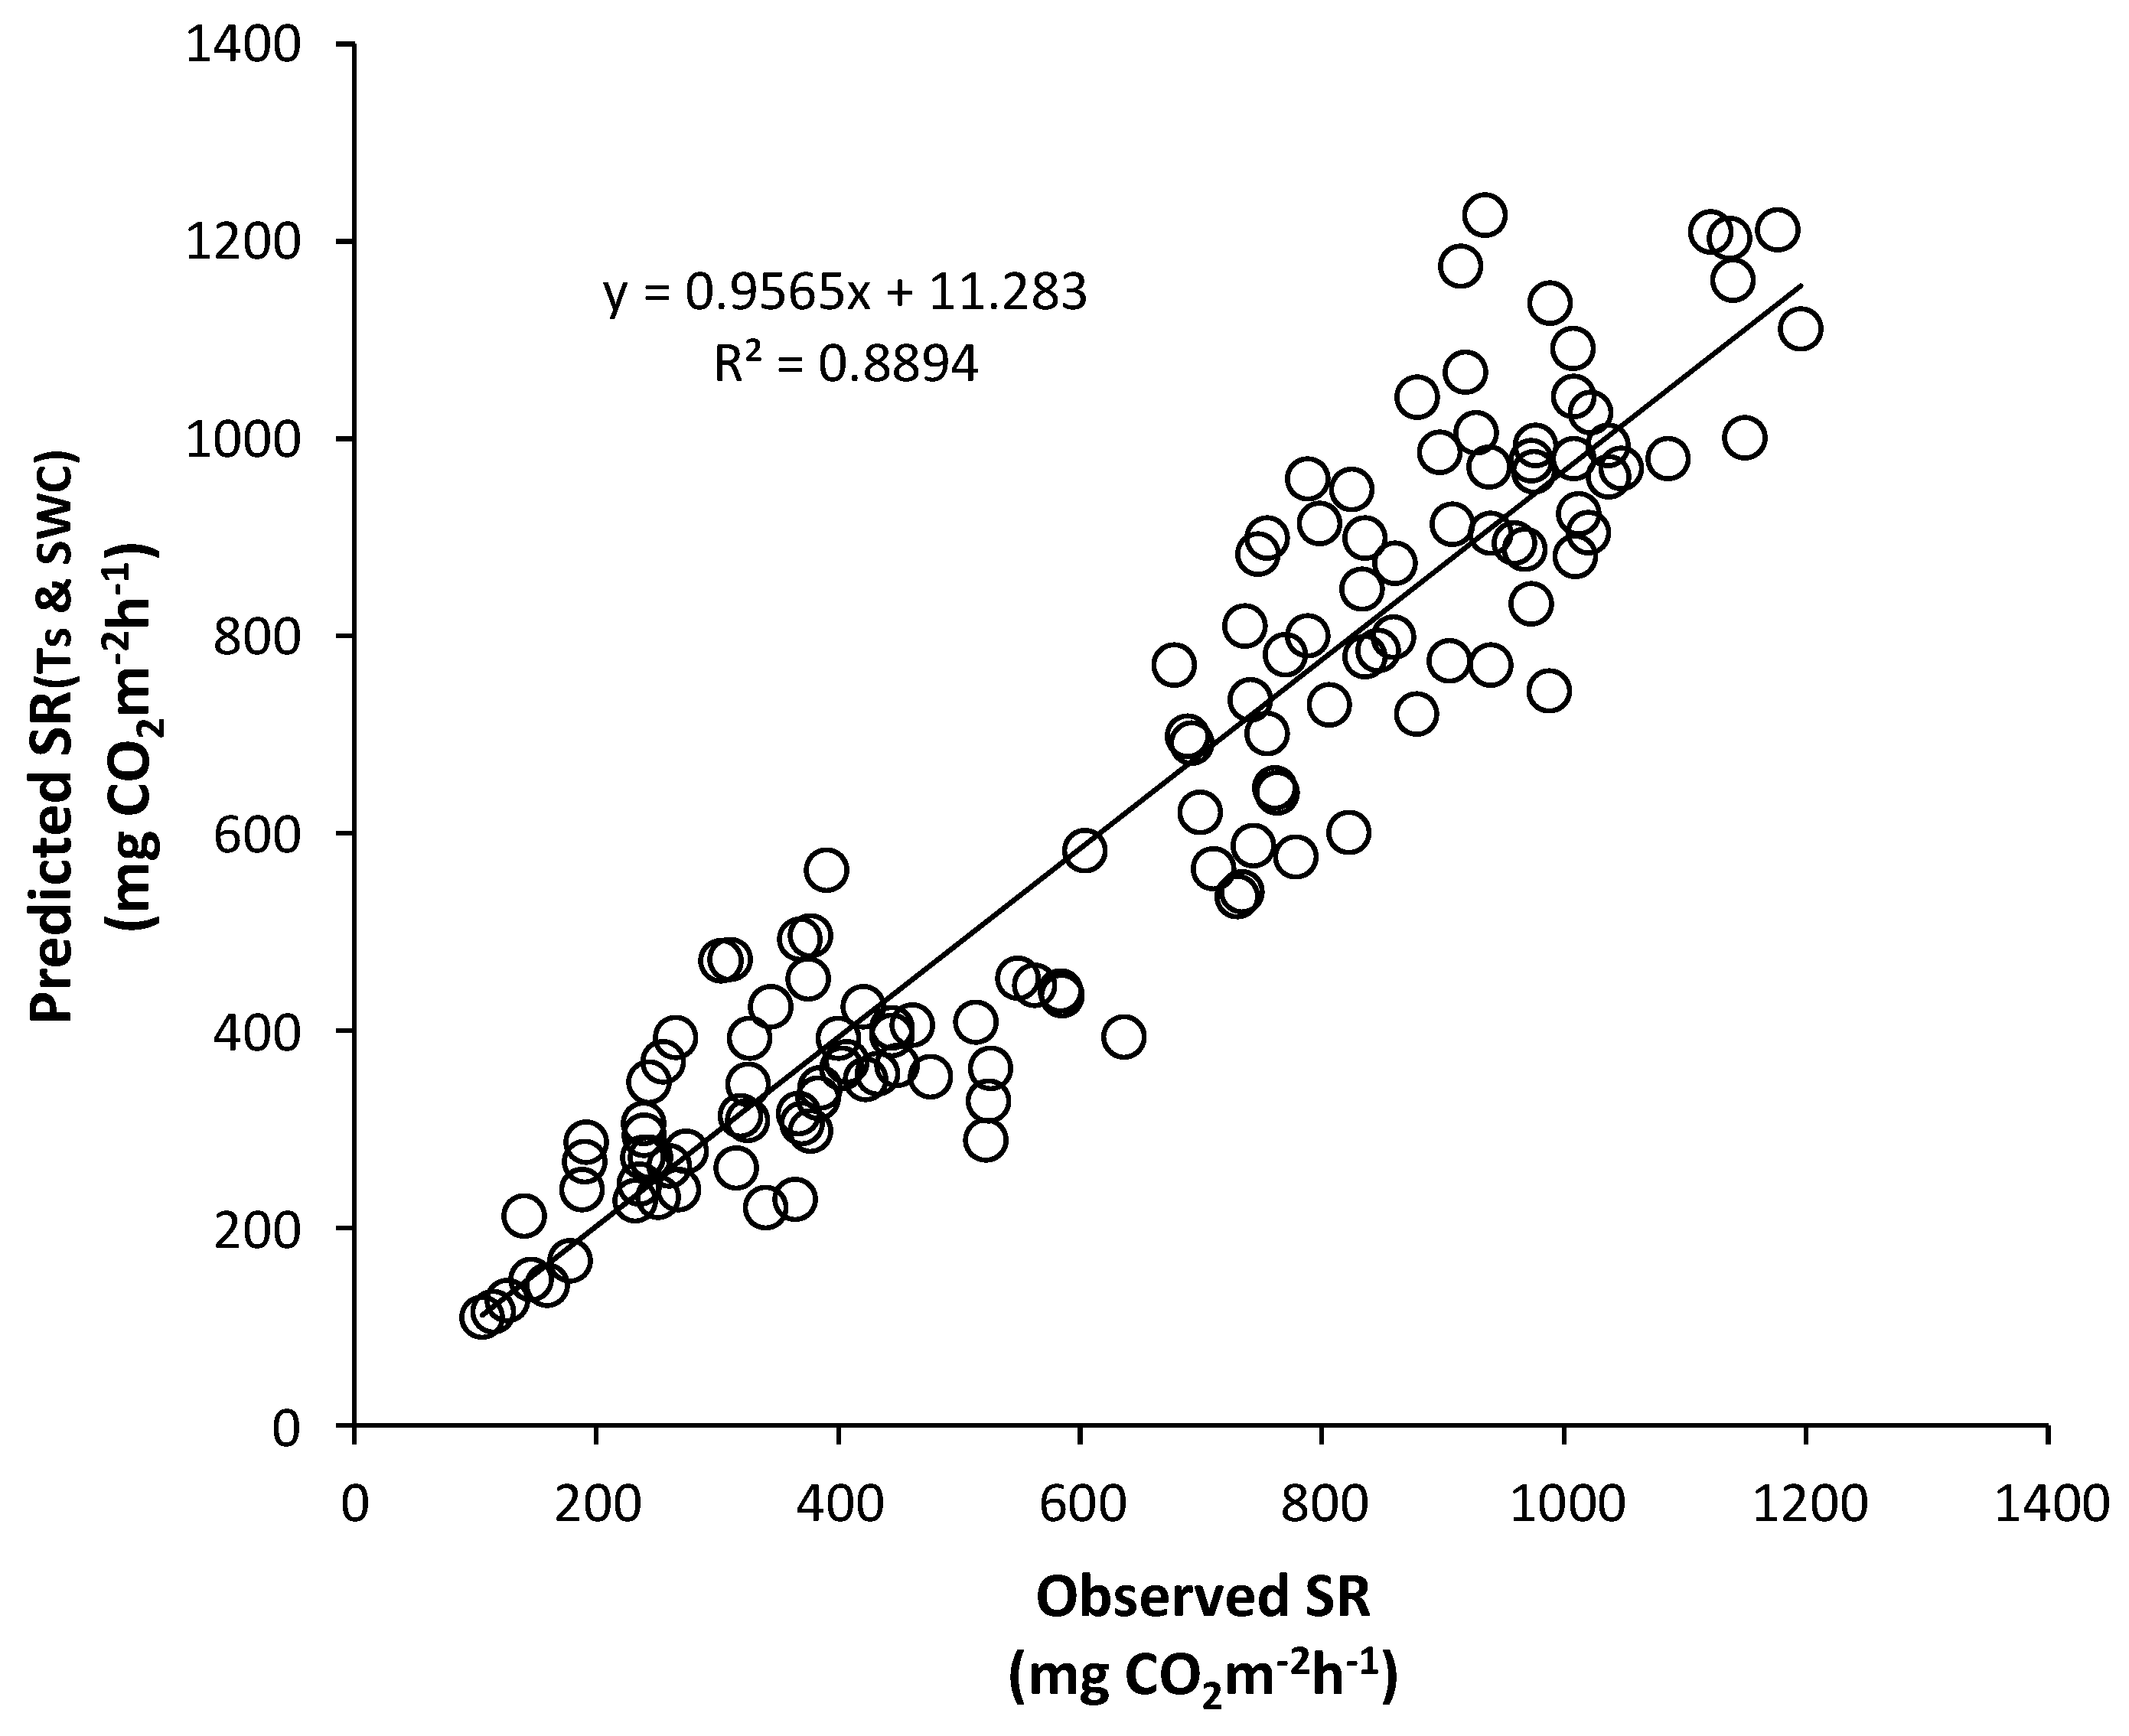
Figure 20 and Figure 21 show scatter plots of the observed SRs vs. those predicted by the integrated regression equations using the Ts and SWC data. The seasonal SR rates predicted by Equations (8) and (9) simulated the values of the observed SRs quite well, with a slope of 1.02 (r2 = 0.90) for Mt. Nam and a slope of 0.96 (r2 = 0.89) for Mt. Jeombong. This indicates that including the Ts and SWC variables improved the optimal regression equations for the quantitative estimations of the SR rates in the forest stands.
3.6. Annual Total Soil Respiration Rates
Table 1 and Table 2 show the seasonal and annual total SR rates estimated from the observed SRs in Figure 8 and Figure 9, the optimal regression Equations (4) and (5) constructed using only soil temperature (Ts), and the integrated regression Equations (8) and (9) constructed from both the Ts and SWC data. For both Q. mongolica forest stands, the total annual SR rates obtained from the measured data were slightly lower than those predicted by the regression equations. The measured results may be underestimated due to ‘missing days’ (no field data due to various problems) at each forest stand site during the course of the experiment. The total annual SR rates estimated from the observed data were ~1207.3 g C m−2 at Mt. Nam and ~975.9 g C m−2 at Mt. Jeombong, whereas those predicted by the integrated regression equations using both Ts and SWC were ~1339.4 and ~1003.0 g C m−2, respectively (Table 1 and Table 2). The total annual total SR values estimated by Equations (4) and (5) that used only Ts and by Equations (8) and (9), which also included SWC, were ~1.2 and ~1.3 times lower for Mt. Jeombong than for Mt. Nam, respectively.
4. Discussion
Soil respiration rates in forested regions depend on changes in primary environmental factors such as Ta, Ts, and SWC [29,31,32,52] as well as other factors such as the soil C substrates, vegetation, and forest management practices [28,30,53]. Several studies have focused on investigating the effects of the Ta and Ts variables driving the SR rate in temperate and cool-temperate forest regions under the Asian monsoon climate [10,12,26,45]. In these studies, Ta and Ts typically accounted for more than 70% of the SR variability on the seasonal and annual time scales. Our results show that SR rates normally fluctuate in parallel with the seasonal changes in Ta and Ts throughout the year (Figure 6, Figure 7, Figure 8 and Figure 9). In particular, among all T variables, the Ts at the 5 cm soil depth showed the highest correlation with SR at both Q. mongolica forest stands (Figure 10 and Figure 11). This was the most important environmental parameter, accounting for more than 84% of the seasonal SR variability (Figure 12 and Figure 13). These results are in agreement with previous studies on cool-temperate Q. mongolica forest regions (e.g., [12,45]). At both experimental sites, the soil layers at the 5 cm depth were classified as topsoil (A-layer), with large amounts of organic matter and plant roots, which have much more soil C and nutrients than the layers below and abundant soil microbes (bacteria and fungi) and fauna. Fierer et al. [54] reported that high SR rate values for the topsoil layer are largely attributable to the rapid responses of soil microorganisms to changes in Ts. Wang et al. [55] showed that the rate of SR is especially affected by the replenishment and availability of soil substrates from the bulk organic C pool under favorable conditions of T and SWC. Eberwein et al. [56] also highlighted that the response of SR to N enrichment and changes in T is dependent on the C availability of soil substrates.
The Q10 exponential function for the SR sensitivity to T has been widely used in SR studies in various forest ecosystems to provide an effective empirical equation for estimating annual SR rates and their T-dependence [25,26,39,54,57]. The annual Q10 values derived from the Ta variables for our forest stands are similar to the 1.3 to 3.3 range reported by a literature review of SR studies on various forest soils [57]. The annual Q10 values derived from the Ts variables increased with increasing soil depth, from 3.0 to 3.1 at Mt. Nam and from 3.7 to 4.6 at Mt. Jeombong (Figure 10 and Figure 11). These increasing values with soil depth are within the 3.8 to 5.5 range reported by Mo et al. [26] for cool-temperate broad-leaved deciduous forests. Uchida et al. [58] suggested that the high Q10 values in cool-temperate forests can be partly explained by the strong T-dependence of microbial respiration under low Ts conditions. In contrast, Pumpanen et al. [59] reported that the annual Q10 value in a Scots pine forest during an extremely dry, hot year was almost half of that during a normal year.
Soil water content is known to be one of the environmental factors that influences SR, because it affects the respiratory processes of the living plant roots and soil microbial community [29,60,61]. A high SWC in soils can delay soil CO2 diffusion [62], whereas a low SWC can restrain root and soil microbial respiration [63]. Thus, it is known that moderate SWC is the most effective condition for SR [38]. In our study, the temporal changes in the Ta and Ts variables described the seasonal variability in SR for both forest stands well, but the SWC values did not follow the seasonal SR trends (Figure 6, Figure 7, Figure 8 and Figure 9). Liang et al. [10] also found no significant relationship between SR and SWC in temperate and cool-temperate forests under the influence of the Asian monsoon. Indeed, with the exception of during short-term drought and saturation periods, the effects of SWC on SR are rarely observed in the field and forest soils of these regions [26]. Accordingly, the SWC at our forest stand sites fluctuated little throughout the year, because the sites also have abundant precipitation during the rainy season, even frequent rainfall, and the typhoons of the monsoon climate regime [12]. However, for both forest stands, there was an episodic increase in SWC that coincided significantly with the peak SR rates during the summer from June to August (Figure 14, Figure 15, Figure 16 and Figure 17). It seems that the rapid SR rate increase during the peak forest growing period is linked to the resulting moderate soil conditions by rainfall events and may be partly affected by the enhanced plant photosynthetic capacity and assimilation as well as by accelerated soil microbial activities [33,35,64].
The results of our study show that AOCCs with short- and long-term measurements can provide sequential continuous high-quality data on the SR rates associated with environmental parameters (Ta, Ts, SWC, rainfall, etc.), ensure the effects of the main parameters on SR, and improve empirical models for estimating seasonal and annual SR in dominant Mongolian oak forest stands in the cool-temperate regions of the Korean Peninsula. Our results suggest that the seasonal SR variation at both forest stands is strongly correlated with the 5-cm depth Ts throughout all seasons, while the abrupt fluctuations in SR during the forest growing season from June to August are closely correlated with SWC at the 15-cm depth. We found that the SR rate increased with increases in Ts above 0 °C and increased SWC (up to 29.9% at Mt. Nam and 29.5% at Mt Jeombong) enhanced the SR rate on a short time scale. Further increases in the SWC would probably lead to a plateau in the SR rate due to reductions in soil aeration and gas diffusivity.
Based on the integrated optimal regression equations (Equations (8) and (9)) that use the measured Ts and SWC values in the Q. mongolica forest stands, the total annual SR rates were estimated to be 1003.0 (Mt. Jeombong) to 1339.4 g C m−2 (Mt. Nam) and. These values are near or within the ranges reported for temperate mixed oak forests (610−1414 g C m−2) [57], mixed oak forests in southern Europe (511−2660 g C m−2) [65], deciduous forests in eastern North America (800−1207 g C m−2) [13], and the cool-temperate deciduous (Q. mongolica) forests of central Korea (1107−1246 g C m−2) [45]. These equations, with their two main parameters (Ts and SWC) based on field measurements, provide a useful empirical tool that improves the estimation and prediction of SR rate variability in response to environmental change in the Q. mongolica forests in the cool-temperate region of the Korean Peninsula.
In this study, the precipitation and vegetation density in the Q. mongolica forest stands at Mt. Nam were slightly higher than those at Mt. Jeombong, which agrees with previous studies in the same areas (e.g., [12,47]). There was no apparent difference in the SWC values between the Mt. Nam and Mt. Jeombong sites. However, the Ts and Ta variables exhibited higher variability in Mt. Nam compared to Mt. Jeombong, and their temporal fluctuations exerted a strong influence on the seasonal variation in SR. The total annual SR at Mt. Nam, which is artificially disturbed by urbanization, was higher than that at Mt. Jeombong, which is surrounded by a natural landscape. In fact, the urban forest at Mt. Nam is located at the center of metropolitan Seoul and has been more consistently affected by heat island effects, air pollution, and direct or indirect human disturbances than the well-preserved natural forest at Mt. Jeombong [47,48,49]. Urbanization can change ecosystem functions by altering the biogeochemical cycles and driving forces (e.g., temperature, precipitation, C dynamics) [66,67].
Further detailed studies are required to examine other SR controlling factors such as the vegetation phenology, photosynthate allocation, growth of plant roots, activities of soil microorganisms and fauna, soil physicochemical characteristics, vegetation composition, and disturbance intensity in various urban and natural forest stands in order to understand and predict potential changes to the C cycle and budget in forest ecosystems in the cool temperate region of the Korean Peninsula.
Author Contributions
Investigation, Data curation and Formal analysis, Writing—original draft, G.S.K.; Conceptualization, Writing—review & editing, S.J.J.; Conceptualization, Supervision, Writing—review & editing, C.S.L. All authors have read and agreed to the published version of the manuscript.
Funding
This research received no external funding.
Conflicts of Interest
There are no potential conflicts of interest to declare.
References
- Raich, J.W.; Potter, C.S.; Bhagawati, D. Interannual variability in global soil respiration, 1980–1994. Glob. Chang. Biol. 2002, 8, 800–812. [Google Scholar] [CrossRef]
- Trumbore, S. Carbon respired by terrestrial ecosystems-recent progress and challenges. Glob. Chang. Biol. 2006, 12, 141–153. [Google Scholar] [CrossRef] [Green Version]
- Roby, M.C.; Scott, R.L.; Barron-Gafford, G.A.; Hamerlynck, E.P.; Moore, D.J.P. Environmental and vegetative controls on soil CO2 efflux in three semiarid ecosystems. Soil Syst. 2019, 3, 6. [Google Scholar] [CrossRef] [Green Version]
- Silletta, L.C.; Cavallaro, A.; Kowal, R.; Pereyra, D.A.; Silva, R.A.; Arias, N.S.; Goldstein, G.; Scholz, F.G.; Bucci, S.J. Temporal and spatial variability in soil CO2 efflux in the Patagonian steppe. Plant Soil 2019, 444, 165–176. [Google Scholar] [CrossRef]
- Cox, P.M.; Betts, R.A.; Jones, C.D.; Spall, S.A.; Totterdell, I.J. Acceleration of global warming due to carbon-cycle feedbacks in a coupled climate model. Nature 2000, 408, 184–187. [Google Scholar] [CrossRef] [PubMed]
- Goh, K.M. Carbon sequestration and stabilization in soils: Implications for soil productivity and climate change. Soil Sci. Plant Nutr. 2004, 50, 467–476. [Google Scholar] [CrossRef] [Green Version]
- Adair, E.C.; Reich, P.B.; Trost, J.J.; Hobbie, S.E. Elevated CO2 stimulates grassland soil respiration by increasing carbon inputs rather than by enhancing soil moisture. Glob. Chang. Biol. 2011, 17, 3546–3563. [Google Scholar] [CrossRef]
- Kirschbaum, M.U.F. Will changes in soil organic carbon act as a positive or negative feedback on global warming? Biogeochemistry 2000, 48, 21–51. [Google Scholar] [CrossRef]
- Scott-Denton, L.E.; Sparks, K.L.; Monson, R.K. Spatial and temporal controls of soil respiration rate in a high-elevation, subalpine forest. Soil Biol. Biochem. 2003, 35, 525–534. [Google Scholar] [CrossRef]
- Liang, N.; Nakadai, T.; Hirano, T.; Qu, L.; Koike, T.; Fujinuma, Y.; Inoue, G. In site comparison of four approaches to estimating soil CO2 efflux in a northern larch (Larix kaempferi Sarg.) forest. Agric. For. Meteorol. 2004, 123, 97–117. [Google Scholar] [CrossRef]
- Hou, L.; Lei, R.; Liu, J.; Shang, L. Soil respiration in Pinus tabulaeformis forest during dormant period at Huoditang forest zone in the Qinling Mountains, China. Acta Ecol. Sin. 2008, 28, 4070–4077. [Google Scholar]
- Joo, S.J.; Park, M.S.; Kim, G.S.; Lee, C.S. CO2 flux in a cool-temperate deciduous forest (Quercus mongolica) of Mt. Nam in Seoul, Korea. J. Ecol. Field Biol. 2011, 34, 95–106. [Google Scholar] [CrossRef] [Green Version]
- Curtis, P.S.; Hanson, P.J.; Bolstad, P.; Barford, C.; Randolph, J.C.; Schmid, H.P.; Wilson, K.B. Biometric and eddy-covariance based estimates of annual carbon storage in five eastern North American deciduous forests. Agric. For. Meteorol. 2002, 113, 3–19. [Google Scholar] [CrossRef]
- Fang, J.Y.; Guo, Z.; Hu, H.; Kato, T.; Muraoka, H.; Son, Y. Forest biomass carbon sinks in East Asia, with special reference to the relative contributions of forest expansion and forest growth. Glob. Chang. Biol. 2014, 20, 2019–2030. [Google Scholar] [CrossRef] [PubMed]
- Qubaja, R.; Grünzweig, J.M.; Rotenberg, E.; Yakir, D. Evidence for large carbon sink and long residence time in semiarid forests based on 15 year flux and inventory records. Glob. Chang. Biol. 2020, 26, 1626–1637. [Google Scholar] [CrossRef]
- LIN, B.; Jiamin, G. Carbon sinks and output of China’s forestry sector: An ecological economic development perspective. Sci. Total Environ. 2019, 655, 1169–1180. [Google Scholar] [CrossRef]
- Bonan, G.B. Forests and climate change forcings, feedbacks, and the climate benefits of forests. Science 2008, 320, 1444–1449. [Google Scholar] [CrossRef] [Green Version]
- Rustad, L.E.; Huntington, T.G.; Boone, R.D. Controls on soil respiration: Implications for climate change. Biogeochemistry 2000, 48, 1–6. [Google Scholar] [CrossRef]
- Pan, Y.D.; Birdsey, R.A.; Fang, J.Y. A large and persistent carbon sink in the world’s forests. Science 2011, 333, 988–993. [Google Scholar] [CrossRef] [Green Version]
- Bowden, R.D.; Nadelhoffer, K.J.; Boone, R.D.; Melillo, J.M.; Garrison, J.B. Contributions of aboveground litter, belowground litter, and root respiration to total soil respiration in a mixed hardwood forest. Can. J. For. Res. 1993, 23, 1402–1407. [Google Scholar] [CrossRef]
- Hanson, P.J.; Edwards, N.T.; Garten, C.T.; Andrews, J.A. Separating root and soil microbial contributions to soil respiration: A review of methods and observations. Biogeochemistry 2000, 48, 115–146. [Google Scholar] [CrossRef]
- D’Andrea, E.; Guidolotti, G.; Scartazza, A.; De Angelis, P.; Matteucci, G. Small-Scale Forest Structure Influences Spatial Variability of Belowground Carbon Fluxes in A Mature Mediterranean Beech Forest. Forests 2020, 11, 255. [Google Scholar] [CrossRef] [Green Version]
- Law, B.E.; Ryan, M.G.; Anthoni, P.M. Seasonal and annual reparation of a ponderosa pine ecosystem. Glob. Chang. Biol. 1999, 5, 169–182. [Google Scholar] [CrossRef] [Green Version]
- Janssens, I.A.; Matteucci, H.G.; Kowalski, A.S.; Buchman, N.; Epron, D.; Pilegaard, K.; Kutsch, W.; Longdoz, B.; Grunwald, T. Productivity overshadows temperature in determining soil ecosystem reparation across European forests. Glob. Chang. Biol. 2001, 7, 269–278. [Google Scholar] [CrossRef]
- Davidson, E.A.; Janssens, I.J.; Luo, Y. On the variability of respiration in terrestrial ecosystems: Moving beyond Q10. Glob. Chang. Biol. 2006, 12, 154–164. [Google Scholar] [CrossRef]
- Mo, W.; Lee, M.S.; Masaki, U.; Motoko, I. Seasonal and annual variations in soil respiration in a cool-temperate deciduous broad-leaved forest in Japan. Agric. For. Meteorol. 2005, 134, 81–94. [Google Scholar] [CrossRef]
- Reich, P.B. The carbon dioxide exchange. Science 2010, 329, 774–775. [Google Scholar] [CrossRef] [Green Version]
- Raich, J.W.; Tufekcioglu, A. Vegetation and soil respiration: Correlations and controls. Biogeochemistry 2000, 48, 71–90. [Google Scholar] [CrossRef]
- Li, H.J.; Yan, J.X.; Yue, X.F.; Wang, M.B. Significance of soil temperature and moisture for soil respiration in a Chinese mountain area. Agric. For. Meteorol. 2008, 148, 490–503. [Google Scholar] [CrossRef]
- Fenn, K.M.; Malhi, Y.; Morecroft, M.D. Soil CO2 efflux in a temperate deciduous forest: Environmental drivers and component contributions. Soil Biol. Biochem. 2010, 42, 1685–1693. [Google Scholar] [CrossRef]
- Estruch, C.; Macek, P.; Armas, C.; Pistón, N.; Pugnaire, F.I. Species identity improves soil respiration predictions in a semiarid scrubland. Geoderma 2020, 363, 114153. [Google Scholar] [CrossRef]
- Zhang, H.; Qian, Z.; Zhuang, S. Effects of Soil Temperature, Water Content, Species, and Fertilization on Soil Respiration in Bamboo Forest in Subtropical China. Forests 2020, 11, 99. [Google Scholar] [CrossRef] [Green Version]
- Lingfei, Y.; Wang, H.; Wang, Y.; Zhang, Z.; Chen, L.; Liang, N.; He, J.S. Temporal variation in soil respiration and its sensitivity to temperature along a hydrological gradient in an alpine wetland of the Tibetan Plateau. Agric. For. Meteorol. 2020, 282, 107854. [Google Scholar]
- Zhao, P.; Pumpanen, J.; Kang, S. Spatio-temporal variability and controls of soil respiration in a furrow-irrigated vineyard. Soil Tillage Res. 2020, 196, 104424. [Google Scholar] [CrossRef]
- Davidson, E.A.; Janssens, I.J. Temperature sensitivity of soil carbon decomposition and feedbacks to climate change. Nature 2006, 440, 165–173. [Google Scholar] [CrossRef] [PubMed]
- Lloyd, J.; Taylor, J.A. On the temperature-dependence of soil respiration. Funct. Ecol. 1994, 8, 315–323. [Google Scholar] [CrossRef]
- Wan, S.; Norby, R.J.; Ledford, J. Responses of soil respiration to elevated CO2, air warming, and changing soil water availability in a model old-field grassland. Glob. Chang. Biol. 2007, 13, 2411–2424. [Google Scholar] [CrossRef]
- Luo, Y.; Zhou, X. Soil Respiration and the Environment; Elsevier Academic Press: Amsterdam, The Netherlands, 2006. [Google Scholar]
- Davidson, E.A.; Belk, E.; Boone, R.D. Soil water content and temperature as independent or confounded factors controlling soil respiration in temperate mixed hardwood forest. Glob. Chang. Biol. 1998, 4, 217–227. [Google Scholar] [CrossRef] [Green Version]
- Borken, W.; Savage, K.; Davidson, E.A.; Trumbore, S.E. Effects of experimental drought on soil respiration and radiocarbon efflux from a temperate forest soil. Glob. Chang. Biol. 2006, 12, 177–193. [Google Scholar] [CrossRef] [Green Version]
- Kwak, Y.S.; Kim, J.H. Secular changes of density, litterfall, phytomass and primary productivity in Mongolian oak (Quercus mongolica) forest. Korean J. Ecol. 1992, 15, 19–33. [Google Scholar]
- Son, Y.; Jun, Y.C.; Lee, Y.Y.; Kim, R.H.; Yang, S.Y. Soil carbon dioxide evolution, litter decomposition, and nitrogen availability four years after thinning in a Japanese larch plantation. Commun. Soil Sci. Plant Anal. 2004, 35, 1111–1122. [Google Scholar] [CrossRef]
- Kim, W.S.; Cho, J.I.; Myong, G.M.; Mano, M.; Komori, D.; Kim, S.D. Quality Assessment of Data from the Daegwallyeong Flux Measurement Station (DFMS) Based on Short-term Experiments. J. Agric. Meteorol. 2008, 64, 111–120. [Google Scholar] [CrossRef]
- Yi, M.J. Soil CO2 evolution in Quercus variabilis and Q. mongolica forests in Chunchon, Kangwon province. J. Korean For. Soc. 2003, 92, 263–269. [Google Scholar]
- Kang, S.; Doh, S.; Lee, D.; Lee, D.; Jin, V.L.; Kimball, J.S. Topographic and climatic controls on soil respiration in six temperate mixed-hardwood forest slopes, Korea. Glob. Chang. Biol. 2003, 9, 1427–1437. [Google Scholar] [CrossRef] [Green Version]
- Lee, J.C. Effects of micro-environment in ridge and southern slope on soil respiration in Quercus mongolica forest. J. Ecol. Environ. 2018, 42, 26. [Google Scholar] [CrossRef]
- Kim, G.S.; Song, H.K.; Lee, C.H.; Cho, H.J.; Lee, C.S. Ecological comparison of Mongolian oak (Quercus mongolica Fisch. Ex Ledeb.) community between Mt. Nam and Mt. Jeombong as a Long Term Ecological Research (LTER) site. J. Ecol. Field Biol. 2011, 34, 75–85. [Google Scholar] [CrossRef]
- Lee, C.S.; Moon, J.S.; Hwangbo, J.K.; You, Y.H. Selection of pollution-tolerant plants and restoration planning to recover the forest ecosystem degraded by air pollution in the industrial complex. Korean J. Biol. Sci. 2002, 6, 59–64. [Google Scholar] [CrossRef]
- Lee, C.S.; Kim, J.H.; Yi, H.; You, Y.H. Seedling establishment and regeneration of Korean red pine (Pinus densiflora S. et Z.) forests in Korea. For. Ecol. Manag. 2004, 199, 423–432. [Google Scholar] [CrossRef]
- FAO-UNESCO. World Reference Base for Soil Resources; FAO-UNESCO: Rome, Italy, 1998. [Google Scholar]
- Kim, G.Z.; Kim, J.H. Evaluation of Ecological Niche for Major Tree Species in the Natural Deciduous Forest of Mt. Chumbong. J. Korean Soc. For. Sci. 2001, 90, 380–387. [Google Scholar]
- Xu, M.; Qi, Y. Soil-surface CO2 efflux and its spatial and temporal variations in a young ponderosa pine plantation in northern California. Glob. Chang. Biol. 2001, 7, 667–677. [Google Scholar] [CrossRef] [Green Version]
- Lytle, D.E.; Cronan, C.S. Comparative soil CO2 evolution, litter decay, and root dynamics in clear cut and uncut spruce fir forest. For. Ecol. Manag. 1998, 103, 121–128. [Google Scholar] [CrossRef]
- Fierer, N.; Schimel, J.P.; Holden, P.A. Variations in microbial community composition through two soil depth profiles. Soil Biol. Biochem. 2003, 35, 167–176. [Google Scholar] [CrossRef]
- Wang, W.J.; Dalal, R.C.; Moody, P.W.; Smith, C.J. Relationships of soil respiration to microbial biomass, substrate availability and clay content. Soil Biol. Biochem. 2003, 35, 273–284. [Google Scholar] [CrossRef]
- Eberwein, J.R.; Oikawa, P.Y.; Allsman, L.A.; Jenerette, G.D. Carbon availability regulates soil respiration response to nitrogen and temperature. Soil Biol. Biochem. 2015, 88, 158–164. [Google Scholar] [CrossRef]
- Raich, J.W.; Schlesinger, W.H. The global carbon-dioxide flux in soil respiration and its relationship to vegetation and climate. Tellus. B Chem. Phys. Meteorol. 1992, 44, 81–99. [Google Scholar] [CrossRef] [Green Version]
- Uchida, M.; Mo, W.; Nakatsubo, T.; Tsuchiya, Y.; Horikoshi, T.; Koizumi, H. Microbial activity and litter decomposition under snow cover in a cool-temperate broad-leaved deciduous forest. Agric. For. Meteorol. 2005, 134, 102–109. [Google Scholar] [CrossRef]
- Pumpanen, J.; Ilvesnemi, H.; Peramaki, M.; Hari, P. Seasonal patterns of soil CO2 efflux and soil air CO2 concentration in a Scots pine forest: Comparison of two chamber techniques. Glob. Chang. Biol. 2003, 9, 371–381. [Google Scholar] [CrossRef]
- Billings, S.A.; Richter, D.D.; Yarie, J. Soil carbon dioxide fluxes and profile concentrations in two boreal forests. Can. J. For. Res. 1998, 28, 1773–1783. [Google Scholar] [CrossRef]
- Cook, F.J.; Orchard, V.A. Relationships between soil respiration and soil moisture. Soil Biol. Biochem. 2008, 40, 1013–1018. [Google Scholar] [CrossRef]
- Skopp, J.; Jawson, M.D.; Doran, J.W. Steady-state aerobicmicrobial activity as a function of soil water content. Soil Sci. Soc. Am. J. 1990, 54, 1619–1625. [Google Scholar] [CrossRef] [Green Version]
- Curiel Youste, J.; Janssens, J.; Carrara, I.A.; Meiresonne, A.; Ceulemans, L. Interactive effects of temperature and precipitation on soil respiration in a temperate maritime pine forest. Tree Physiol. 2003, 23, 1263–1270. [Google Scholar] [CrossRef] [PubMed] [Green Version]
- Hogberg, P.; Nordgren, A.; Buchmann, N. Large-scale forest girdling shows that current photosynthesis drives soil respiration. Nature 2001, 411, 789–792. [Google Scholar] [CrossRef] [PubMed]
- Rey, A.; Pegoraro, E.; Tedeschi, V.; de Parri, I.; Jarvis, P.G.; Valentini, R. Annual variation in soil respiration and its components in a coppice oak forest in Central Italy. Glob. Chang. Biol. 2002, 8, 851–866. [Google Scholar] [CrossRef]
- Kordowski, K.; Kuttler, W. Carbon dioxide fluxes over an urban park area. Atmos. Environ. 2010, 44, 2722–2730. [Google Scholar] [CrossRef]
- Park, M.S.; Joo, S.J.; Lee, C.S. Effects of an urban park and residential area on the atmospheric CO2 concentration and flux in Seoul Korea. Adv. Atmos. Sci. 2013, 30, 503–514. [Google Scholar] [CrossRef]
Figure 1.
Geographical maps of Mt. Nam and Mt. Jeombong showing the study site locations.

Figure 2.
Cross-sectional diagram of the Quercus mongolica forest stand on Mt. Nam. Sj, Styrax japonicus; Si, Stephanandra incisa; Qm, Quercus mongolica; Ou, Oplismenus undulatifolius; Fr, Fraxinus rhynchophylla; Sa, Sorbus alnifolia; Ap, Acer palmatum; Dc, Dryopteris chinensis; Ds, Disporum smilacinum; Ay, Athyrium yokoscense; As, Alnus sibirica; Ve, Viburnum erosum.

Figure 3.
Forest soil profile at various depths at the Mt. Nam experimental site. A0, A1 and A2, B1, C and D indicate the organic, topsoil, subsoil, parent material, and rock layers, respectively.
Figure 3.
Forest soil profile at various depths at the Mt. Nam experimental site. A0, A1 and A2, B1, C and D indicate the organic, topsoil, subsoil, parent material, and rock layers, respectively.

Figure 4.
Cross-sectional diagram of the Quercus mongolica forest stand on Mt. Jeombong. Aa, Ainsliaea acerifolia; Ie, Isodon excisus; Qm, Quercus mongolica; Cs, Carex siderosticta; Tr, Tripterygium regelii; Lo, Lindera obtusiloba; Rs, Rhododendron schlippenbachii; Lm, Lespedeza maximowiczii; Sp, Syneilesis palmata; Ap, Acer pseudosieboldianum; Sb, Sasa borealis; Ma, Maackia amurensis; So, Styrax obassia; Dc, Dryopteris crassirhizoma; Si, Stephanandra incisa.

Figure 5.
Forest soil profile with various depths at the Mt. Jeombong experimental site. A0, A1 and A2, B1, and C and D indicate the organic, topsoil, subsoil, parent material, and rock layers, respectively.
Figure 5.
Forest soil profile with various depths at the Mt. Jeombong experimental site. A0, A1 and A2, B1, and C and D indicate the organic, topsoil, subsoil, parent material, and rock layers, respectively.

Figure 6.
Seasonal variation in the observed daily mean (a) air (°C; solid line) and soil (°C; dashed line, 5 cm depth) temperatures, (b) soil water content (SWC; solid line) at the 15 cm depth and precipitation (Prec; bars) in the Quercus mongolica forest stand on Mt. Nam in 2011. DOY, day of year.

Figure 7.
Seasonal variations in the observed daily mean (a) air (°C; solid line) and soil (°C; dashed line, 5 cm depth); (b) soil water content (SWC; solid line) at the 15 cm depth and precipitation (Prec; bars) in the Quercus mongolica forest stand of Mt. Jeombong in 2011. DOY, day of year.
Figure 7.
Seasonal variations in the observed daily mean (a) air (°C; solid line) and soil (°C; dashed line, 5 cm depth); (b) soil water content (SWC; solid line) at the 15 cm depth and precipitation (Prec; bars) in the Quercus mongolica forest stand of Mt. Jeombong in 2011. DOY, day of year.

Figure 8.
Seasonal variation in the observed daily mean soil respiration in the Quercus mongolica forest stand on Mt. Nam in 2011. Bars, ± standard deviation. DOY, day of year.
Figure 8.
Seasonal variation in the observed daily mean soil respiration in the Quercus mongolica forest stand on Mt. Nam in 2011. Bars, ± standard deviation. DOY, day of year.

Figure 9.
Seasonal variation in the observed daily mean soil respiration in the Quercus mongolica forest stand on Mt. Jeombong in 2011. Bars, ± standard deviation. DOY, day of year.
Figure 9.
Seasonal variation in the observed daily mean soil respiration in the Quercus mongolica forest stand on Mt. Jeombong in 2011. Bars, ± standard deviation. DOY, day of year.

Figure 10.
Scatter plots of the observed daily mean soil respiration vs. temperatures (°C) measured at (a) 1.5 m height, (b) soil surface, (c) 5 cm depth and (d) 10 cm depth in the forest stand on Mt. Nam. The optimal regression equation values (r2 = 0.91 and Q10 = 3.0) were for the 5 cm depth (c).
Figure 10.
Scatter plots of the observed daily mean soil respiration vs. temperatures (°C) measured at (a) 1.5 m height, (b) soil surface, (c) 5 cm depth and (d) 10 cm depth in the forest stand on Mt. Nam. The optimal regression equation values (r2 = 0.91 and Q10 = 3.0) were for the 5 cm depth (c).

Figure 11.
Scatter plots of the observed daily mean soil respiration vs. temperatures (°C) measured at (a) 1.5 m height, (b) soil surface, (c) 5 cm depth and (d) 10 cm depth in the forest stand on Mt. Jeombong. The optimal regression equation values (r2 = 0.84 and Q10 = 3.7) were for the 5 cm depth (c).

Figure 12.
Seasonal variation in the observed soil respiration (closed circles) and that predicted by a regression equation (solid line) constructed from the soil temperatures (TS) in the Quercus mongolica forest stand on Mt. Nam during the experimental period. DOY, day of year.
Figure 12.
Seasonal variation in the observed soil respiration (closed circles) and that predicted by a regression equation (solid line) constructed from the soil temperatures (TS) in the Quercus mongolica forest stand on Mt. Nam during the experimental period. DOY, day of year.

Figure 13.
Seasonal variation in the observed soil respiration (closed circles) and that predicted by a regression equation (solid line) constructed from the soil temperatures (TS) in the Quercus mongolica forest stand on Mt. Jeombong during the experimental period. DOY, day of year.
Figure 13.
Seasonal variation in the observed soil respiration (closed circles) and that predicted by a regression equation (solid line) constructed from the soil temperatures (TS) in the Quercus mongolica forest stand on Mt. Jeombong during the experimental period. DOY, day of year.

Figure 14.
Temporal variation in the ∆SR(Ts) (difference between the observed and predicted SRs, dashed line), soil water content (SWC) at the 15 cm depth (solid line), and precipitation (bars) in the Quercus mongolica forest stand on Mt. Nam during the forest growing season from April to September. SR, soil respiration; Ts, soil temperature; DOY, day of year.

Figure 15.
Temporal variation in the ∆SR(Ts) (between the observed and predicted (regressions using Equations (4) or (5)) values, dashed line), soil water content (SWC) at the 15 cm depth (solid line), and precipitation (bars) in the Quercus mongolica forest stand on Mt. Jeombong during the forest growing season from April to September. SR, soil respiration; Ts, soil temperature; DOY, day of year.

Figure 16.
Relationship between ∆SR (Ts) and soil water content (SWC) at a depth of 15 cm in the Quercus mongolica forest stand on Mt. Nam. The second order polynomial regression is indicated by the curve. SR, soil respiration; Ts, soil temperature.
Figure 16.
Relationship between ∆SR (Ts) and soil water content (SWC) at a depth of 15 cm in the Quercus mongolica forest stand on Mt. Nam. The second order polynomial regression is indicated by the curve. SR, soil respiration; Ts, soil temperature.

Figure 17.
Relationship between ∆SR (Ts) and soil water content (SWC) at the 15 cm depth in the Quercus mongolica forest stand on Mt. Jeombong. The second order polynomial regression is indicated by the curve. SR, soil respiration; Ts, soil temperature.
Figure 17.
Relationship between ∆SR (Ts) and soil water content (SWC) at the 15 cm depth in the Quercus mongolica forest stand on Mt. Jeombong. The second order polynomial regression is indicated by the curve. SR, soil respiration; Ts, soil temperature.

Figure 18.
Seasonal variation in the observed soil respiration (closed circles) and that predicted by the integrated regression equation (solid line) constructed from the soil temperature (TS) and soil water content (SWC) in the Quercus mongolica forest stand at Mt. Nam during the experimental period. DOY, day of year.

Figure 19.
Seasonal variation in the observed soil respiration (closed circles) and that predicted by the integrated regression equation (solid line) constructed from the soil temperature (TS) and soil water content (SWC) in the Quercus mongolica forest stand at Mt. Jeombong over the experimental period. DOY, day of year.

Figure 20.
Scatter plot of the observed soil respiration (SR) and that predicted by the integrated regression equation using soil temperature (Ts) and soil water content (SWC) for the Quercus mongolica forest stand at Mt. Nam.
Figure 20.
Scatter plot of the observed soil respiration (SR) and that predicted by the integrated regression equation using soil temperature (Ts) and soil water content (SWC) for the Quercus mongolica forest stand at Mt. Nam.

Figure 21.
Scatter plot of the observed soil respiration (SR) and that predicted by the integrated regression equation using soil temperature (TS) and soil water content (SWC) in the Quercus mongolica forest stand on Mt. Jeombong.
Figure 21.
Scatter plot of the observed soil respiration (SR) and that predicted by the integrated regression equation using soil temperature (TS) and soil water content (SWC) in the Quercus mongolica forest stand on Mt. Jeombong.


Table 1.
Total quarterly and annual soil respiration (SR) rates observed and predicted by the regression equations for the Quercus mongolica forest stand on Mt. Nam. Numbers in square brackets are the sum of missing days. Ts, soil temperature; SWC, soil water content.
Table 1.
Total quarterly and annual soil respiration (SR) rates observed and predicted by the regression equations for the Quercus mongolica forest stand on Mt. Nam. Numbers in square brackets are the sum of missing days. Ts, soil temperature; SWC, soil water content.
| Observed SR | Predicted SR by Ts | Predicted SR by Ts and SWC | |
|---|---|---|---|
| g C m−2 yr−1 | g C m−2 yr−1 | g C m−2 yr−1 | |
| Jan–Mar | 34.5 (25) | 52.8 | 53.8 |
| Apr–Jun | 328.1 (17) | 306.9 | 372.6 |
| Jul–Sep | 678.6 (15) | 704.1 | 746.7 |
| Oct–Dec | 166.2 (21) | 166.3 | 166.3 |
| Annual total | 1207.3 (78) | 1230.0 | 1339.4 |
Table 2.
Annual total soil respiration (SR) rates observed and predicted by the regression equations for the Quercus mongolica forest stand on Mt. Jeombong. Numbers in square brackets are the sum of missing days. Ts, soil temperature; SWC, soil water content.
Table 2.
Annual total soil respiration (SR) rates observed and predicted by the regression equations for the Quercus mongolica forest stand on Mt. Jeombong. Numbers in square brackets are the sum of missing days. Ts, soil temperature; SWC, soil water content.
| Observed SR | Predicted SR by Ts | Predicted SR by Ts and SWC | |
|---|---|---|---|
| g C m−2 yr−1 | g C m−2 yr−1 | g C m−2 yr−1 | |
| Jan–Mar | 25.3 (75) | 36.4 | 37.2 |
| Apr–Jun | 285.0 (51) | 309.3 | 289.1 |
| Jul–Sep | 538.9 (36) | 544.7 | 556.2 |
| Oct–Dec | 126.7 (33) | 120.5 | 120.5 |
| Annual total | 975.9 (195) | 1010.9 | 1003.0 |
© 2020 by the authors. Licensee MDPI, Basel, Switzerland. This article is an open access article distributed under the terms and conditions of the Creative Commons Attribution (CC BY) license (http://creativecommons.org/licenses/by/4.0/).
Share and Cite
MDPI and ACS Style
Kim, G.S.; Joo, S.J.; Lee, C.S. Seasonal Variation of Soil Respiration in the Mongolian Oak (Quercus mongolica Fisch. Ex Ledeb.) Forests at the Cool Temperate Zone in Korea. Forests 2020, 11, 984. https://doi.org/10.3390/f11090984
AMA Style
Kim GS, Joo SJ, Lee CS. Seasonal Variation of Soil Respiration in the Mongolian Oak (Quercus mongolica Fisch. Ex Ledeb.) Forests at the Cool Temperate Zone in Korea. Forests. 2020; 11(9):984. https://doi.org/10.3390/f11090984
Chicago/Turabian StyleKim, Gyung Soon, Seung Jin Joo, and Chang Seok Lee. 2020. "Seasonal Variation of Soil Respiration in the Mongolian Oak (Quercus mongolica Fisch. Ex Ledeb.) Forests at the Cool Temperate Zone in Korea" Forests 11, no. 9: 984. https://doi.org/10.3390/f11090984
Note that from the first issue of 2016, this journal uses article numbers instead of page numbers. See further details here.