Controls on Ocean Color Spectra Observed During the North Atlantic Aerosols and Marine Ecosystems Study (NAAMES)
 James G. Allen
 David A. Siegel2
  Norman B. Nelson
 Stuart Halewood
- 1School of Ocean and Earth Science and Technology, University of Hawai‘i at Mānoa, Honolulu, HI, United States
- 2Department of Geography, Earth Research Institute, University of California, Santa Barbara, Santa Barbara, CA, United States
Satellite ocean color remote sensing is the primary method to retrieve synoptic measurements of the optical properties of the ocean on large spatial and regular time scales. Through bio-optical modeling, changes in ocean color spectra can be linked to changes in marine ecosystem and biogeochemical properties. Bio-optical algorithms rely on assumptions about the covariance of marine constituents as well as the relationships among their inherent and apparent optical properties. Validation with in situ measurements of in-water constituents and their optical properties is required to extrapolate local knowledge about ocean color variations to global scales. Here, we evaluate seasonal and spatial relationships between optical constituents and their inherent and apparent optical properties throughout the annual cycle of the North Atlantic plankton bloom using bio-optical data from four cruises conducted as part of the North Atlantic Aerosols and Marine Ecosystems Study (NAAMES). Our results show ocean color variability, quantified using field observations of the remote sensing reflectance spectrum at each NAAMES station, is driven by colored dissolved organic matter (CDOM) absorption in the ultraviolet wavelengths, phytoplankton absorption in the blue wavelengths, and total particulate backscattering in the green wavelengths. Results from a recently storm-mixed station at the height of the spring bloom demonstrate that significant changes in bio-optical properties can occur on daily scales. By testing the effects of variations in lighting conditions and solar geometries, we also demonstrate that, for this data set, remote sensing reflectance should be considered a quasi-inherent optical property. We find that the temporal and spatial chlorophyll concentrations and the magnitudes of inherent optical properties can be accurately assessed using previously published ocean color algorithms. However, changes in the spectral slopes of the inherent optical properties are often poorly retrieved, indicating the need for improvements in the retrieval of optical constituent composition. The characterization of such a dynamic environment provides beneficial insights for future bio-optical algorithms.
Introduction
Algal blooms are driven by a complicated array of biological, chemical, and physical dynamics governing the growth and loss rates of phytoplankton (e.g., Sverdrup, 1953; Siegel et al., 2002; Behrenfeld and Boss, 2018). The North Atlantic is home to the largest phytoplankton bloom on Earth, and sustained observations of the region have led to new insights into the mechanisms behind bloom formation and cessation (e.g., Behrenfeld et al., 2013; Westberry et al., 2016). The North Atlantic Aerosols and Marine Ecosystems Study (NAAMES; Behrenfeld et al., 2019) consisted of 4 month-long field expeditions to the western subarctic Atlantic with the goal of investigating the phases of the annual phytoplankton bloom and improving understanding of the seasonal influences on marine aerosols and boundary layer clouds by marine ecosystems. Knowledge gained from this study can be extended by identifying how biological and ecological changes ultimately affect ocean color, such that satellite data can be used to assess regional changes over time.
Satellite ocean color observations and their derived products have provided a synoptic view of ecological and biogeochemical processes for the past two decades (e.g., McClain et al., 2004; Behrenfeld et al., 2006; Siegel et al., 2013). The NAAMES project presents a unique opportunity to outline relationships between the optical properties of in-water constituents and ocean color over a diverse set of bloom states and lighting conditions. It also serves as a useful benchmark to test the retrievals of satellite products from empirical and semi-analytical bio-optical algorithms (IOCCG, 2006). Empirical algorithms, such as the OC Chlorophyll algorithm (O’Reilly et al., 1998; Werdell and Bailey, 2005), directly relate global matchups of bio-optical products and ocean color observations; while semi-analytical algorithms (e.g., Loisel and Stramski, 2000; Maritorena et al., 2002; Lee et al., 2014) use a combination of empirical relationships and theoretical expressions to determine the contributions of ocean constituents to ocean color spectra. The performance of both types of algorithms can be limited by assumptions about the relationships between radiometric variables and their underlying optical constituents (Werdell et al., 2018). Validating and improving these bio-optical algorithms with in situ data will lead to enhanced characterization of regional to global scale models of phytoplankton dynamics (Siegel et al., 2013) and marine productivity (Behrenfeld et al., 2005; Westberry et al., 2008).
Linking ocean biological processes to satellite data requires knowledge of the optical properties of the ocean. Marine optical constituents, typically broadly categorized as phytoplankton, detrital particles, and colored dissolved organic matter (CDOM), each have unique spectral signatures (e.g., Kirk, 1983; Mobley, 1994). Inherent optical properties (IOPs), such as the absorption, total scattering, backscattering, and beam attenuation coefficients, are functions of the magnitude and composition of the dissolved and suspended particulate constituents in the water column. The total absorption coefficient spectrum, atot(λ), is the sum of each individual absorption coefficient:
where the subscripts ph, d, g, and w indicate contributions from phytoplankton, detritus, CDOM, and seawater, respectively. Since ad(λ) and ag(λ) have similar spectral shapes, they are often combined as adg(λ). The total backscattering coefficient spectrum, bbtot(λ), can be partitioned into the contributions by particles and water as:
The NAAMES study allows for an investigation into the variability of not only the magnitudes of each of the constituent IOPs but their spectral shapes within the context of an annual bloom cycle, as well as their relationships to changes in ocean color.
Ocean color is quantified here using remote sensing reflectance spectra, rrs(λ), and is defined as the ratio of upwelling radiance to downwelling irradiance spectra immediately below the water surface, or:
Values of rrs(λ) can be related to the IOPs of the water column as:
where f/Q is a factor describing the bidirectional structure of the upward radiance field (e.g., Morel et al., 2002). As an apparent optical property (AOP), variability in rrs(λ) comes from both IOPs and the illumination conditions as well as the roughness of the sea surface. Thus, values of f/Q are a function of solar geometries and the IOPs of the water column (e.g., Morel et al., 2002). Often, values of f/Q are set either as a constant or as a simple function of IOP values (e.g., Gordon et al., 1988; Lee et al., 1999), suggesting that rrs(λ) can be considered a quasi-inherent optical parameter.
Another useful AOP is the diffuse attenuation coefficient, Kd(λ), which is defined as the vertical attenuation coefficient for the exponential decay of surface downwelling irradiance:
Values of Kd(λ) are used to predict the spectrum of incident spectral irradiance at depth (Smith and Baker, 1978; Morel and Maritorena, 2001) and is related to the IOPs of the water column using single scattering theory as a measure of the photons lost along a path [proportional to atot(λ) + bbtot(λ)]. Typically values of atot(λ) + bbtot(λ) are related to Kd(λ) using a constant Do (Gordon, 1989; Mobley, 1994):
Few studies have evaluated variations in these properties using open ocean data including both IOPs and AOPs (e.g., Loisel et al., 2001; Morel and Maritorena, 2001; Reynolds et al., 2001; Kostadinov et al., 2007). NAAMES provides the opportunity to examine the quasi-inherency assumption over a range of open ocean conditions.
The primary goal of this study is to assess the relationships among in-water constituents and IOPs and their role in the variability of the AOPs of the water column in the annual North Atlantic bloom cycle. Bio-optical data from the four NAAMES cruises are used to assess the optical properties of in-water constituents and their role in driving variability in ocean color during different phases of the North Atlantic phytoplankton bloom. We use this data to (1) investigate the seasonal and spatial trends in ocean constituents and their associated IOPs and AOPs, (2) evaluate relationships between optical parameters and constituents, and (3) investigate the performance of a suite of existing empirical and semi-analytical bio-optical algorithms. We aim to improve understanding of the relationships between different optical parameters and whether current satellite algorithms are well-suited to assess changes in the optical properties of the North Atlantic Bloom ecosystem. The analysis of the field data collected as part of NAAMES will also inform the development of future bio-optical algorithms to take advantage of improved sensors such as those flown on the upcoming NASA Plankton, Aerosol, Cloud, ocean Ecosystem mission (PACE; Werdell et al., 2019).
Materials and Methods
Cruises
Four NAAMES cruises were conducted between November 2015 and April 2018 in the western subarctic Atlantic, nominally between 40°N and 55°N along the 40°W longitude (Behrenfeld et al., 2019). Optical profiles and supporting information were collected across a latitudinal gradient over four distinct physical and biological provinces: subpolar, temperate, subtropical, and Sargasso Sea waters (Della Penna and Gaube, 2019). Details for each of the optics-related casts are shown in Table 1.
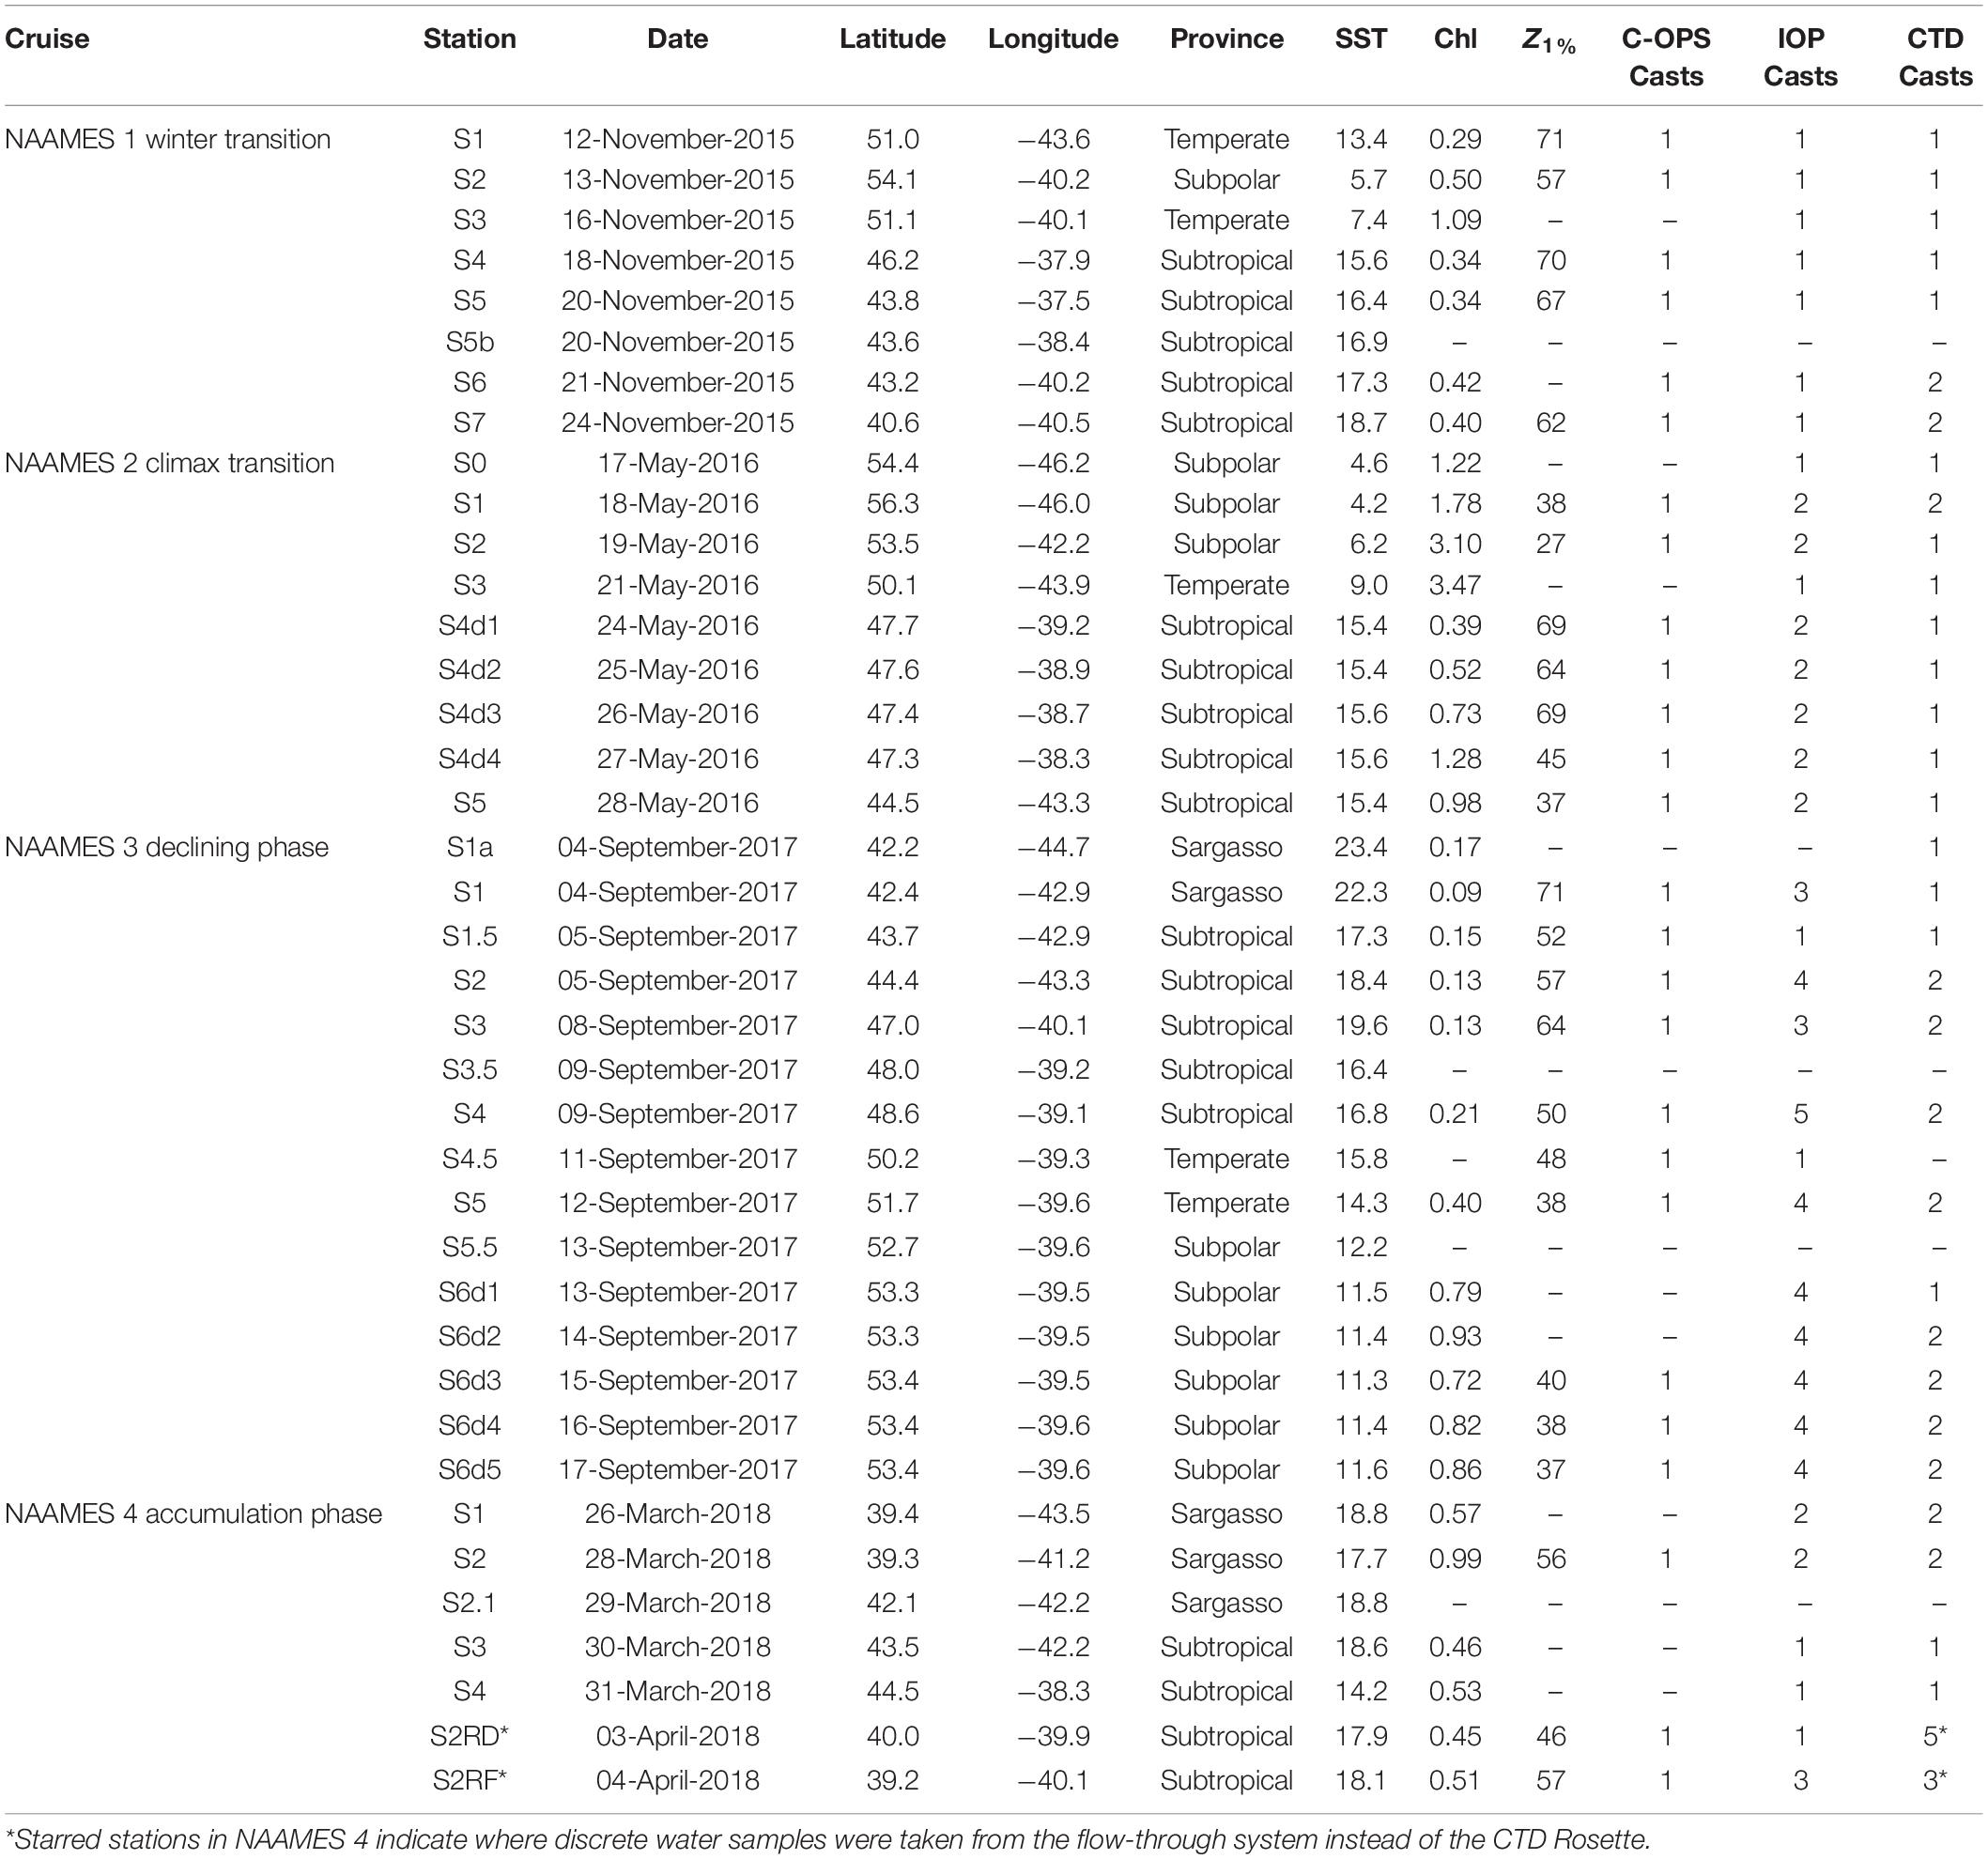
Table 1. Location and metadata for all optical profiles for the NAAMES Project.
Each cruise was designed to investigate the annual cycle of phytoplankton biomass within the context of the “Disturbance-Recovery Hypothesis” (Behrenfeld and Boss, 2018). The “Winter Transition” phase of the annual bloom was sampled during NAAMES 1 (November 2015) and was characterized by deep mixed layer depths exceeding 100 m, low photosynthetically available radiation (PAR), and optically clear waters, with euphotic zone depths, Z1% (1% surface PAR) reaching 55–70 m. During the “Climax Transition,” captured in NAAMES 2 (May 2016), the northern subpolar and temperate stations were marked by low surface temperatures and shallower euphotic zone depths (25–40 m) relative to the southern subtropical stations. A unique opportunity to measure the recovery of a storm-mixed water column presented itself at Station 4, which was occupied for 4 days from 24 May through 27 May. NAAMES 3 (September 2017) occurred during the “Declining Phase” of the bloom and consisted of typically clear sky conditions and relatively shallow mixed layer depths (∼10–40 m) at all stations. There was a strong latitudinal gradient in this cruise, with warmer, optically clearer waters at the southern subtropical stations and cooler waters with shallow euphotic zone depths at the northern subpolar stations. The final cruise, NAAMES 4 (March – April 2018) sampled the “Accumulation Phase” of the bloom; however, weather conditions and ship’s equipment failure limited optical profiles to the Subtropical and Sargasso stations.
Multiple CTD Rosette casts were made at nearly all optics stations (Table 1), and discrete water samples for optics were collected before sunrise and in the late afternoon. Profiles of radiometric data and inherent optical properties were made at solar noon at each station using a profiling spectroradiometer (C-OPS described below) and the in situ IOP package. In NAAMES 2 and subsequent cruises, multiple profiles of the inherent optical properties were made throughout the day. Optical variables with different sampling resolution were matched up one-to-one with the nearest neighbor using the more sparsely sampled variable if they co-occurred within 8 h of each other. Typically, time offsets between optics and CTD casts were within 6 h.
Apparent Optical Property Determinations
A Biospherical Instruments Compact Optical Profiling System, C-OPS (Morrow et al., 2010), was used to obtain profiles of upwelling radiance, Lu(λ), and downwelling irradiance, Ed(λ) at 18 wavelengths between 320 and 780 nm. The free-falling C-OPS was deployed nominally at solar noon from the ship stern to minimize the potential impacts of solar zenith angles on the measurements. Remote sensing reflectance just below the surface, rrs(λ), was computed using Eq. 4. Remote sensing reflectance values were converted to above-water values (Mobley, 1994):
Vertical profiles of the diffuse attenuation coefficient for downwelling irradiance, Kd(z, λ), were calculated as the log derivative of Ed(z, λ) at each depth using a 10 m bin window following Siegel et al. (1995). Mean values of Kd(z, λ) calculated over the upper 15 m were used to calculate near-surface determinations of the diffuse attenuation coefficient, Kd(λ).
In situ Inherent Optical Property Determinations
The Inherent Optical Property Package included a SBE25 CTD (SeaBird), an ECO BB9 backscattering meter (WetLabs), and an AC-S hyperspectral absorption and attenuation meter (WetLabs). One cast consisted of two deployments, with the first deployment incorporating a 0.2 μm filter on the AC-S to allow for calculations of the particulate absorption and beam attenuation coefficients. Only the downcast was used, which was selected as the minimum depth (∼5 m) after a de-bubbling protocol down to the maximum depth (∼100 m) from the SBE25 CTD time and depth data. Temperature, salinity, and conductivity profiles for the overall cast were combined and mean bin-averaged to every 2 m using a 1 m window. The upper 15 m of profile data were averaged to obtain surface IOP values.
The ECO BB9 backscattering meter was used to obtain profiles of the particulate backscattering coefficient bbp(z, λ) at λ = 412, 440, 488, 510, 532, 595, 660, 676, and 715 nm. NAAMES 1 did not include the 412 nm channel due to stability issues. After subtracting dark offsets made at the beginning of each cruise and applying a factory-derived scale factor, the BB9 measures the total volume scattering β(z, λ) at an angle of 117°. Beta measurements were mapped to the downcast determined from the SBE25 CTD and then converted to the total backscattering coefficient following Boss and Pegau (2001):
where the seawater Beta values, βsw(z, λ), comes from Zhang et al. (2009) using temperature and salinity observations, and χp is 1.1 for 117° (Boss and Pegau, 2001). Data from both deployments were combined, then median bin-averaged to every 2 m using a 1 m window. Surface particulate backscattering spectral slopes,η, were determined using a power law fit over the all available wavelengths:
where λ0 is set to 443 nm.
Profiles of absorption and beam attenuation coefficient spectra at 83 wavelengths between 400 and 750 nm were made with a WetLabs AC-S absorption and attenuation meter (Moore et al., 1992). A calibration independent technique (Slade et al., 2010) was used to obtain particulate absorption and beam attenuation by subtracting the 0.2 μm-filtered AC-S data from the total unfiltered AC-S data. Negative values and extreme values (> 1 m–1) were removed. A mismatch in spectral band positions between absorption and attenuation was corrected by interpolating all beam attenuation data to the absorption wavelengths. Data from each deployment was binned separately using a median filter at every 2 m with a 1 m bin window. After retrieving particulate absorption using from the total and filtered data, it was corrected for residual temperature and scattering after Slade et al. (2010). Particulate attenuation was also corrected for a residual temperature effect. Values of the total particulate scattering coefficient bp(λ) were calculated by subtracting particulate absorption spectra from particulate beam attenuation. Particulate beam attenuation spectral slopes were measured using a power law function over the entire spectrum.
Discrete Water Sample Analyses
High performance liquid chromatography (HPLC) pigment analysis was used to derive a suite of pigment concentrations in this analysis. Five water samples from the top 100 m of the morning and afternoon deep CTD Rosette casts for each station were collected in 1 L dark Nalgene bottles and filtered using 25 mm glass fiber filters (GF/F). Samples were stored in aluminum foil packets in liquid nitrogen and processed at NASA Goddard Space Flight Center (Van Heukelem and Hooker, 2011; Hooker et al., 2012).
Chromophoric Dissolved Organic Matter (CDOM) absorption spectra, ag(λ), were collected and prepared according to the UCSB CDOM protocol (Nelson et al., 2007) with recent modifications as specified by the draft NASA/IOCCG CDOM protocol (Mannino et al., 2019). Spectra were acquired from 280–700 nm and null corrected at long wavelengths (690–700 nm average). CDOM spectral slopes were determined by fitting an exponential function to ag(λ) between 300 and 450 nm.
Water samples for the decomposition of particulate absorption spectra into the detrital and phytoplankton contributions were collected and analyzed according to methods described in Mitchell et al. (2000) using a beta correction for multiple scattering effects determined from local natural populations (Nelson et al., 1998; Guillocheau, 2003). The phytoplankton absorption coefficient spectrum, aph(λ), was determined as the difference between ap(λ) and ad(λ). Detrital absorption spectral slopes were determined by fitting an exponential function to ad(λ) between 400 and 500 nm.
Particulate organic carbon (POC) samples were collected from both the inline flow-through system or from the CTD Rosette. POC concentrations were determined using a 3-volume regression method after Moran et al. (1999). Briefly, three volumes ranging from 0.5 to 2.135 L were filtered onto pre-combusted GF/F filters and wrapped in pre-combusted foil packets and stored in liquid nitrogen until analysis. Values represent the slope of the three-volume series corrected by subtracting the filter blank for each series. All POC filters were analyzed on an Exeter Analytics CE-440 elemental analyzer calibrated with acetanilide following manufacturer protocols.
For comparisons between the IOPs and AOPs, total absorption was derived by adding seawater absorption, calculated using Lee et al. (2015) between 350 and 550 nm, and Pope and Fry (1997) from 550 to 700 nm. Seawater backscattering was calculated using Zhang et al. (2009).
Results and Discussion
Bio-Optical Variability
Each of the four cruises captures a snapshot of the recurring annual bloom cycle, which to first order is reflected in the surface chlorophyll concentrations along latitudinal gradients (Table 1). Low concentrations in the NAAMES 1 Winter Transition (0.48 ± 0.28 mg m–3) are associated with deep mixing and low incident irradiance. As the mixed layer depth shoals, chlorophyll concentrations steadily increase (0.58 ± 0.20 mg m–3) through the Accumulation Phase measured during NAAMES 4 before peaking (1.49 ± 1.10 mg m–3) at the Climax Transition during NAAMES 2. The timing of the NAAMES 2 and NAAMES 4 cruises coincided with the middle and peak of the spring bloom, depending on the latitude, so northern stations would have progressed farther through the cycle than southern stations (Behrenfeld et al., 2019). During the Declining Phase of the bloom in the Fall months (NAAMES 3), there is a strong latitudinal gradient, with chlorophyll concentrations reaching 1 mg m–3 in the northern subpolar stations while Sargasso Sea waters show values below 0.1 mg m–3. The range of biological states measured during NAAMES makes it a very useful data set for the testing of satellite ocean color algorithms.
Particulate beam attenuation, cp(λ) (Figure 1A) follows changes in the chlorophyll concentrations to first order (R = 0.66), suggesting that phytoplankton play a dominant role in particle optics variability in this region. Cruise means in the Winter Transition show small magnitudes and little variability [cp(443) = 0.116 ± 0.042 m–1], indicating very low concentrations of particulate material during this period. The magnitude of the particulate beam attenuation coefficient increases through the Accumulation Phase and Climax Transition of the spring bloom [cp(443) = 0.192 ± 0.077 m–1 and 0.383 ± 0.178 m–1, respectively], and shows large amounts of variability, even when stations are concentrated around Sargasso Sea waters as in NAAMES 4. During the Declining Phase of the bloom, a strong latitudinal gradient was found, with higher magnitudes of particulate beam attenuation occurring in the subpolar stations [cp(443) = 0.437 ± 0.029 m–1] than in the other stations [cp(443) = 0.134 ± 0.135 m–1].
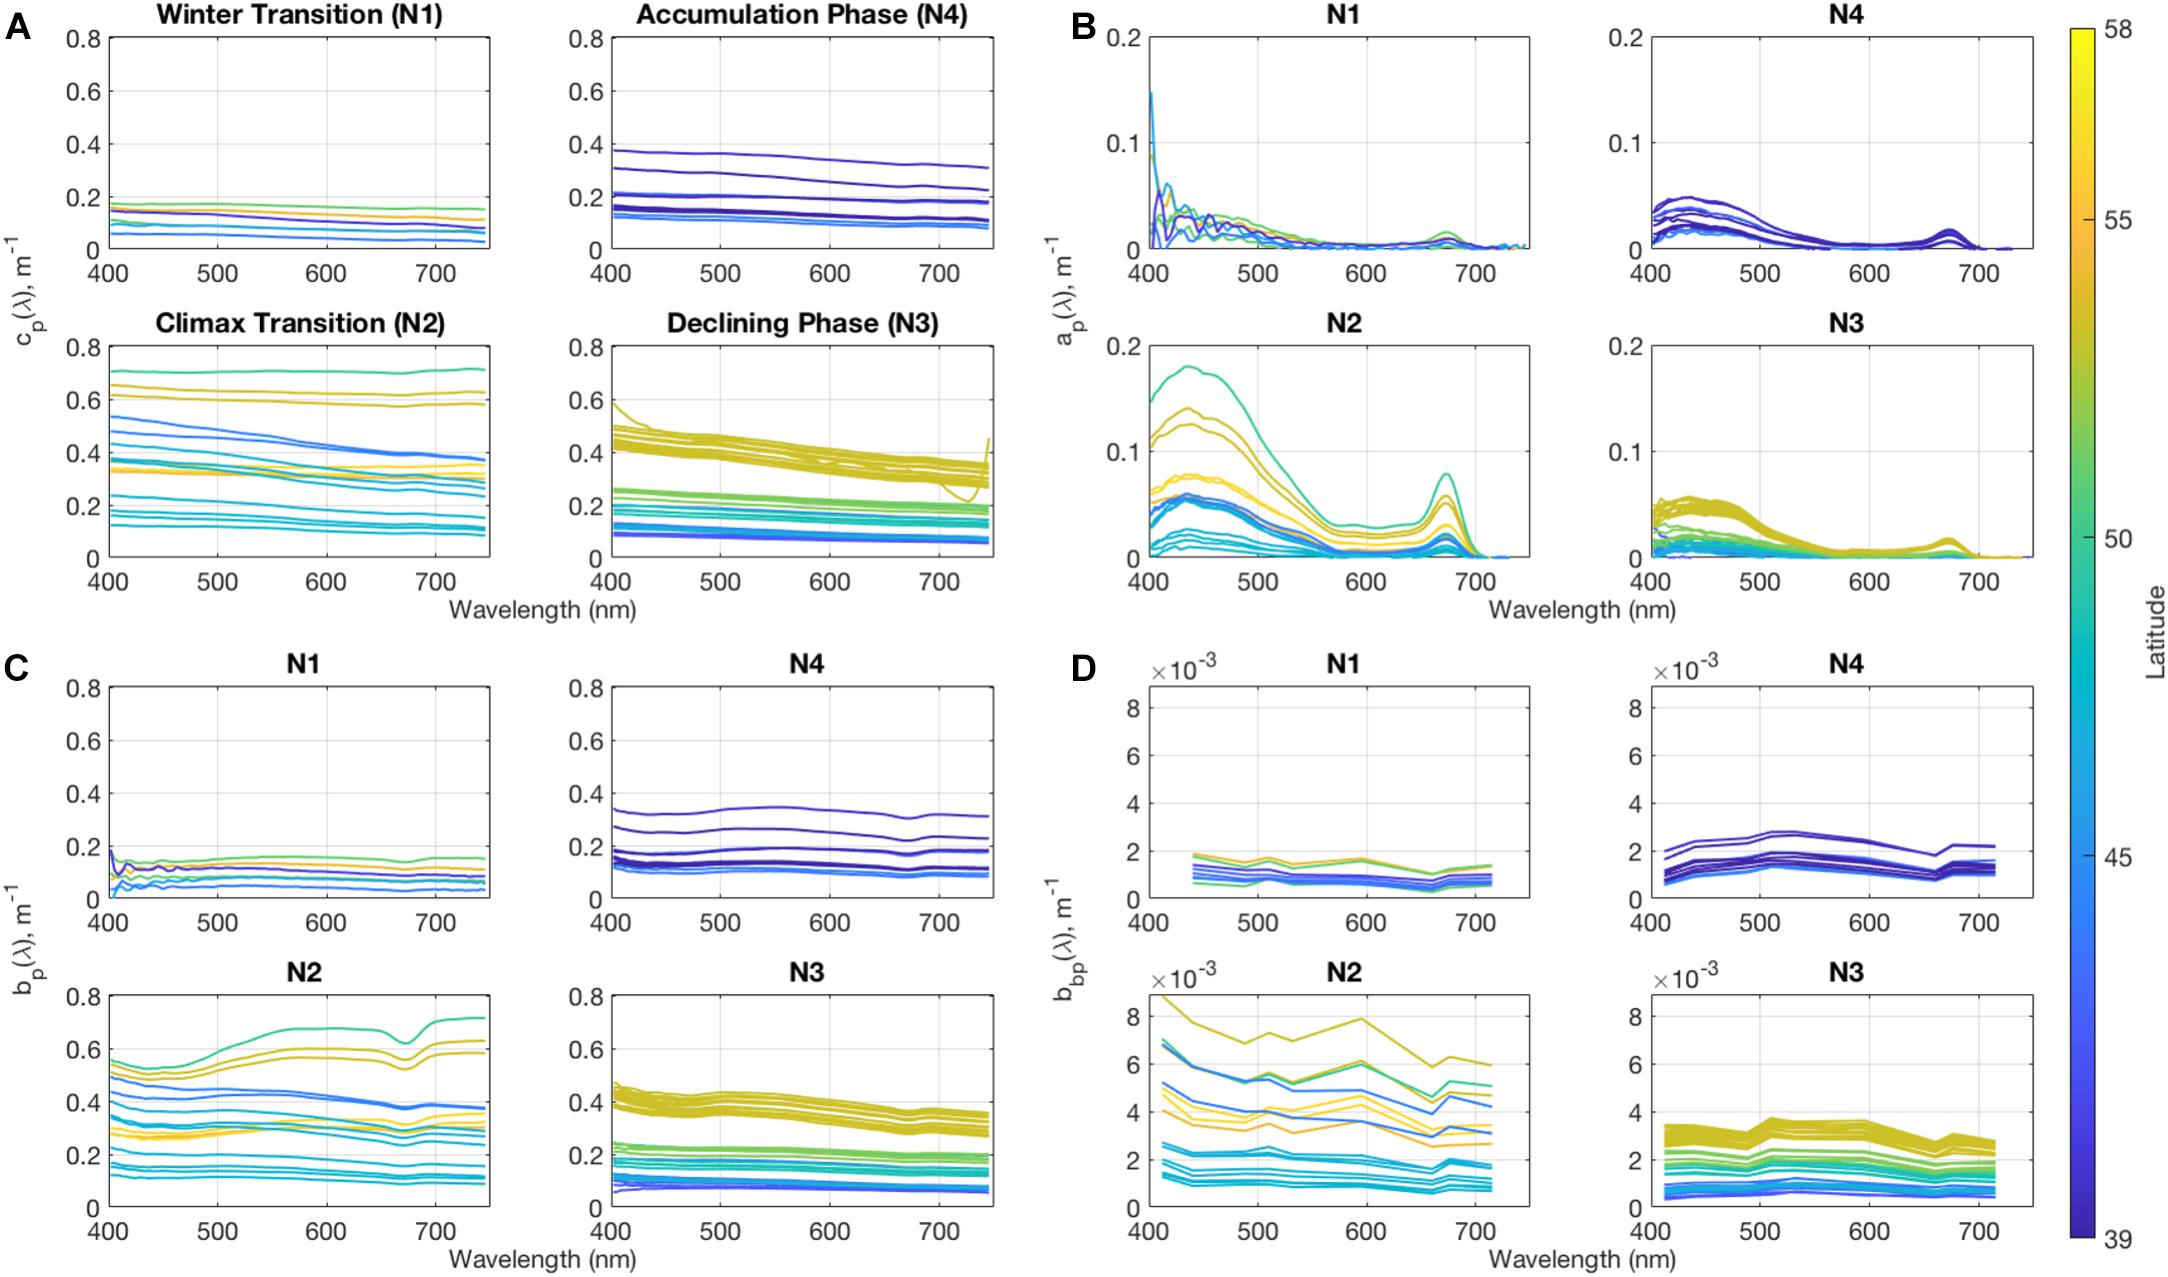
Figure 1. Surface mean values for (A) particulate beam attenuation, (B) particulate absorption, (C) particulate scattering, and (D) particulate backscattering coefficient spectra from the IOP Package for each of the NAAMES cruises (N1–N4). Note that y-axes vary to show detail.
Particulate beam attenuation can be separated into the different spectral contributions of particulate scattering and absorption (Figures 1B,C). Variability in particulate scattering largely follows the variability in particulate beam attenuation. Particulate scattering is spectrally flat at most wavelengths except near 443 nm, and, at times, the 676 nm region, where particulate absorption significantly contributes. Scattering contributes 88 (±5%) to cp(443), while it contributes 98 (±2%) to cp(555), indicating that absorption signals are more influential in the blue wavelengths than in the green.
Changes in the particulate backscattering spectrum, bbp(λ), (Figure 1D) will be directly related to ocean color variations (Eq. 5). Changes in the magnitude of bbp(490) closely follow changes in cp(490) (R = 0.92) with values of 9.7 (±3.4) × 10–4 m–1 during the Winter Transition, which increase to 16.0 (±4.5) × 10–4 m–1 and 31.1 (±18.1) × 10–4 m–1 during the Accumulation Phase and Climax Transition cruises, respectively. During the Declining Phase of the bloom, where variability strongly follows a latitudinal trend, bbp(490) decreases to values of 18.7 (±9.2) × 10–4 m–1. This suggests that to first order values of bbp(λ) are a good proxy for particle concentrations.
Particulate absorption (Figure 1B) clearly shows the chlorophyll a absorption peaks at 443 and 676 nm (Bidigare et al., 1990), indicating that phytoplankton are the main driver of particulate absorption spectra for the NAAMES region throughout the year. It is significantly higher than backscattering at shorter wavelengths, especially at stations with higher chlorophyll concentrations, but particulate backscattering plays a more prominent role in the green wavelengths.
Total non-water absorption can be decomposed into the component absorption by phytoplankton, detritus, and CDOM (Figure 2). As these are discrete samples measured in the laboratory, spectra extend to 300 nm in the ultraviolet (UV). Component absorption coefficients for phytoplankton show peaks at 443 and 676 nm due to chlorophyll a absorption as expected. The phytoplankton absorption peak near 320 nm is likely due to photoprotective pigments called mycosporine-like amino acids (MAAs), which have been related to increases in dinoflagellate populations (Morrison and Nelson, 2004; Barron et al., 2014). This also coincides with the largest concentrations of peridinin, a chemotaxonomic marker for photosynthetic dinoflagellates, from HPLC analysis found in the NAAMES dataset (R = 0.70). Observations of values were >0.3 mg m–3 for NAAMES 2 and between 0.03 and 0.07 mg m–3 for NAAMES 3, compared to cruise mean values ∼0.006 mg m–3. These peaks were found in all high latitude stations in NAAMES 2 and 3, suggesting that dinoflagellates play a large role in variability in this spectral region in the subpolar regions during both the peak of the spring bloom and its declining phase (Kramer et al., 2020). The magnitudes of phytoplankton absorption largely follow trends in particulate absorption, with the highest values occurring during the peak of the spring bloom and a latitudinal trend throughout all phases of the bloom.
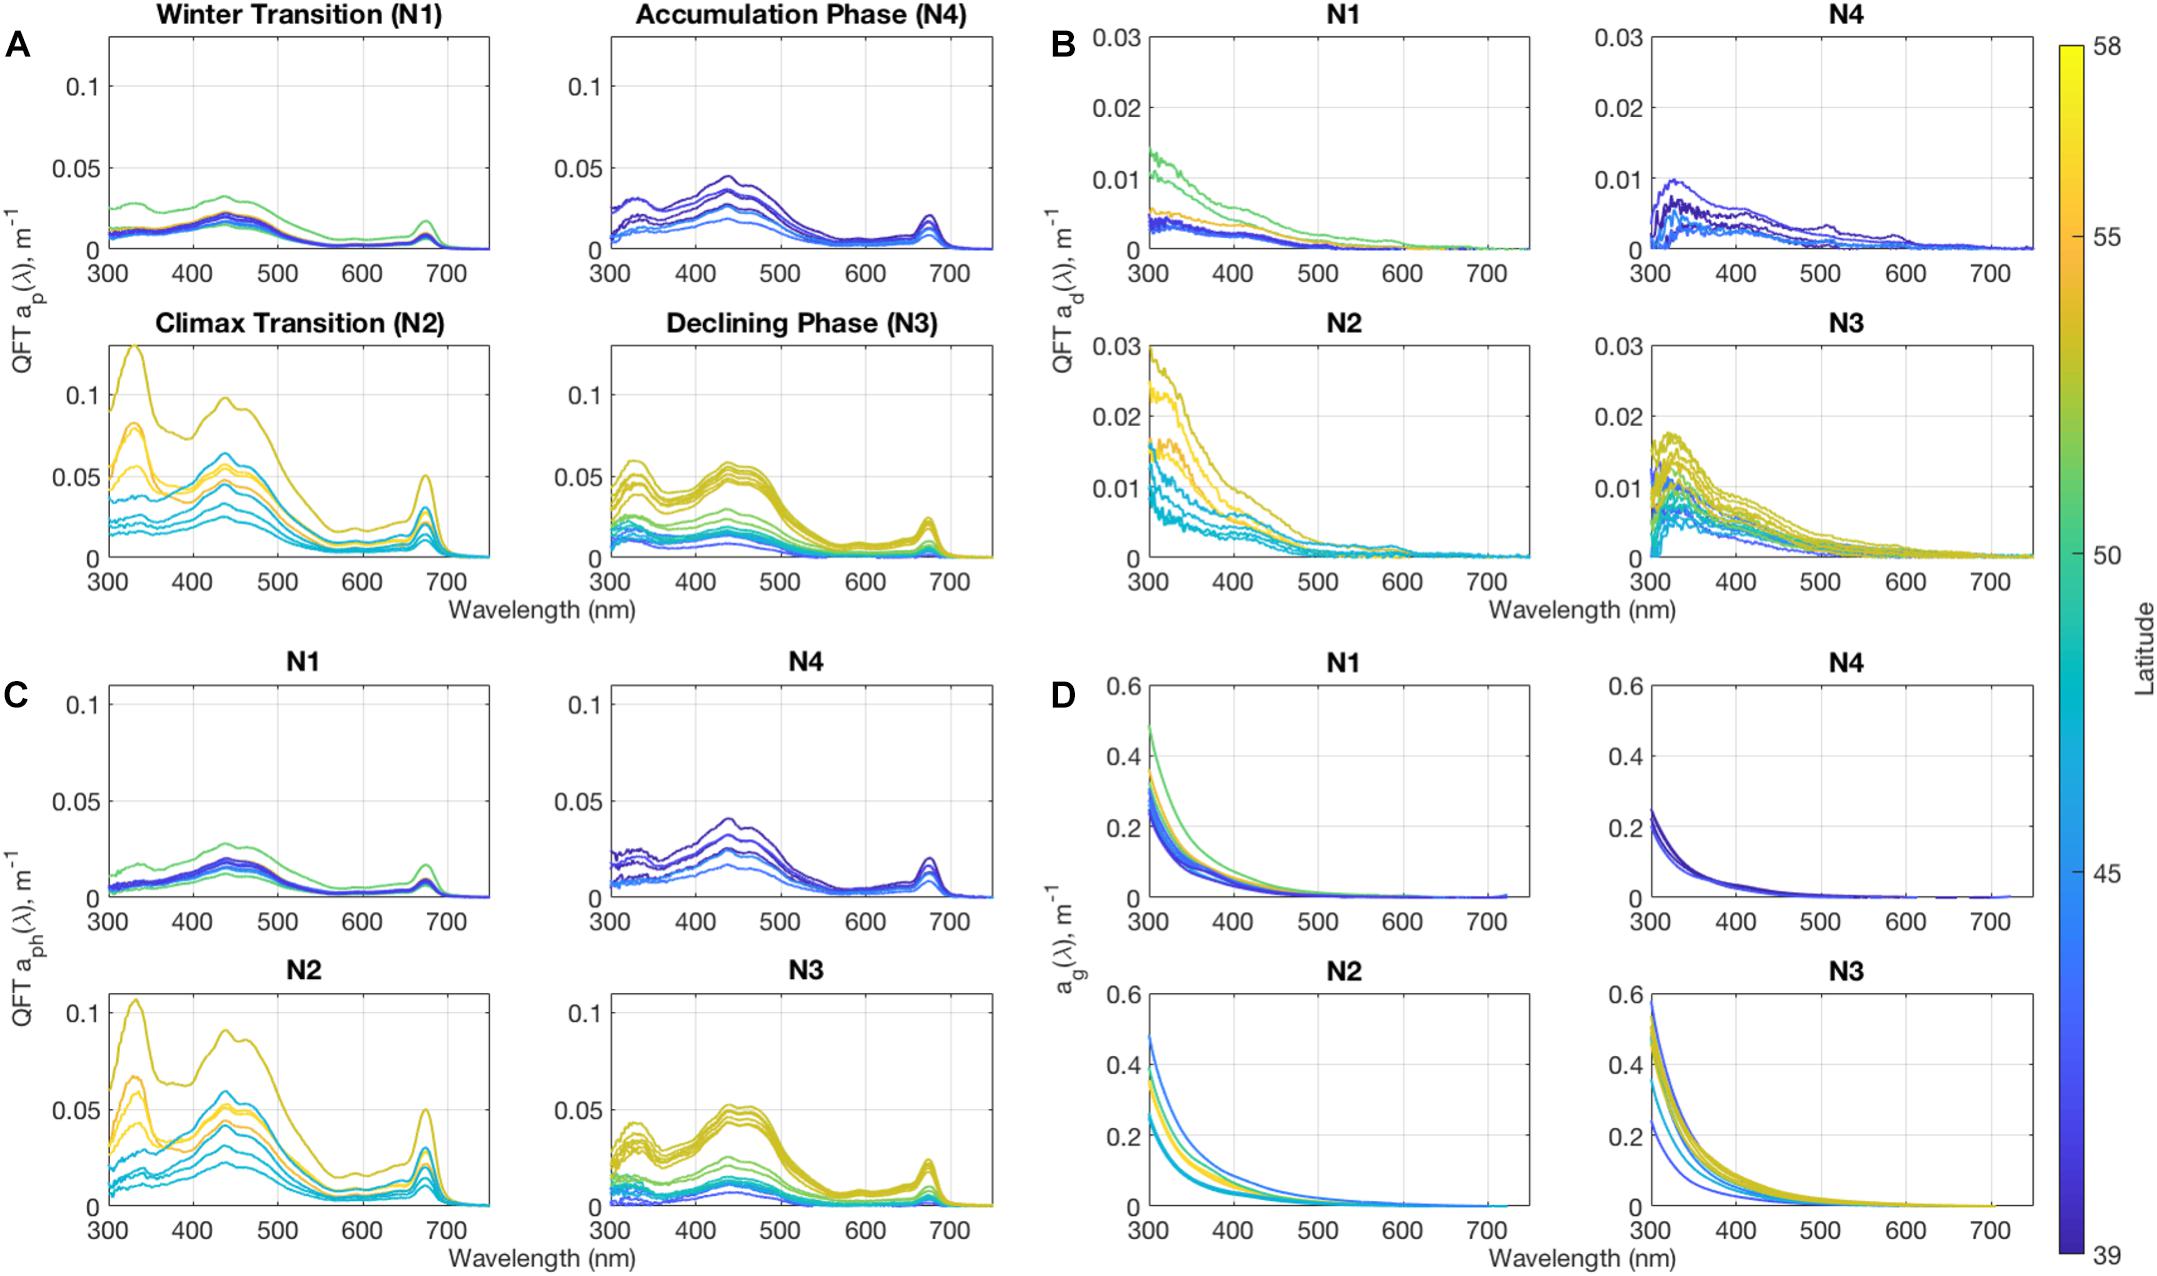
Figure 2. Surface mean values for (A) particulate absorption, (B) detrital absorption, (C) phytoplankton absorption, and (D) CDOM absorption coefficient spectra from discrete hydrography for each of the NAAMES cruises. Note that y-axes vary to show detail.
Detrital and CDOM absorption spectra (Figures 2B,C) have historically been approximated in bio-optical models as exponentially decaying functions with increasing wavelength (e.g., Bricaud et al., 1981; Roesler et al., 1989; Nelson and Siegel, 2013). Detrital slope values (0.0156 ± 0.005 nm–1, calculated between 400 and 500 nm) measured here are lower than CDOM slope values (0.0176 ± 0.0013 nm–1, calculated between 300 and 400 nm). Detrital absorption contributes between 20 and 50% of the total particulate absorption signal at wavelengths less than 400 nm, and between 5 and 20% of the signal between 400 and 500 nm, consistent with previous results (e.g., Roesler et al., 1989). CDOM absorption spectra are much smoother than other component absorption data and dominate UV-blue region, with values reaching over 0.5 m–1 at 300 nm, which has implications for retrievals of other absorption components using bio-optical algorithms (Nelson and Siegel, 2013; Siegel et al., 2013). The lack of spectral features in the 310–400 nm region suggests a lack of dissolved MAAs as has been observed in coastal waters during dinoflagellate blooms (Barron et al., 2014). Surface CDOM absorption shows some seasonal variability throughout NAAMES region. Absorption in the UV remains low during Winter Transition and the Accumulation Phase, particularly at the southern stations. Toward the Bloom Climax, the magnitude of CDOM absorption rises significantly, and values remain high through the decline of the bloom. However, no strong latitudinal trend is seen as with the other absorption constituents.
The relationship between chlorophyll a concentration and component absorption coefficients (Figure 3) allows for an assessment of the bio-optical assumption, where the bio-optical state of the open ocean is highly correlated with and dependent on chlorophyll concentration (e.g., Smith and Baker, 1978; Morel and Maritorena, 2001; Siegel et al., 2005). Also shown are matchups made with the NOMAD database for context with historical measurements (Werdell and Bailey, 2005). Correlation coefficients are calculated for the NAAMES dataset, the NOMAD dataset subsampled to the range of chlorophyll concentrations observed during NAAMES, and the total NOMAD dataset.
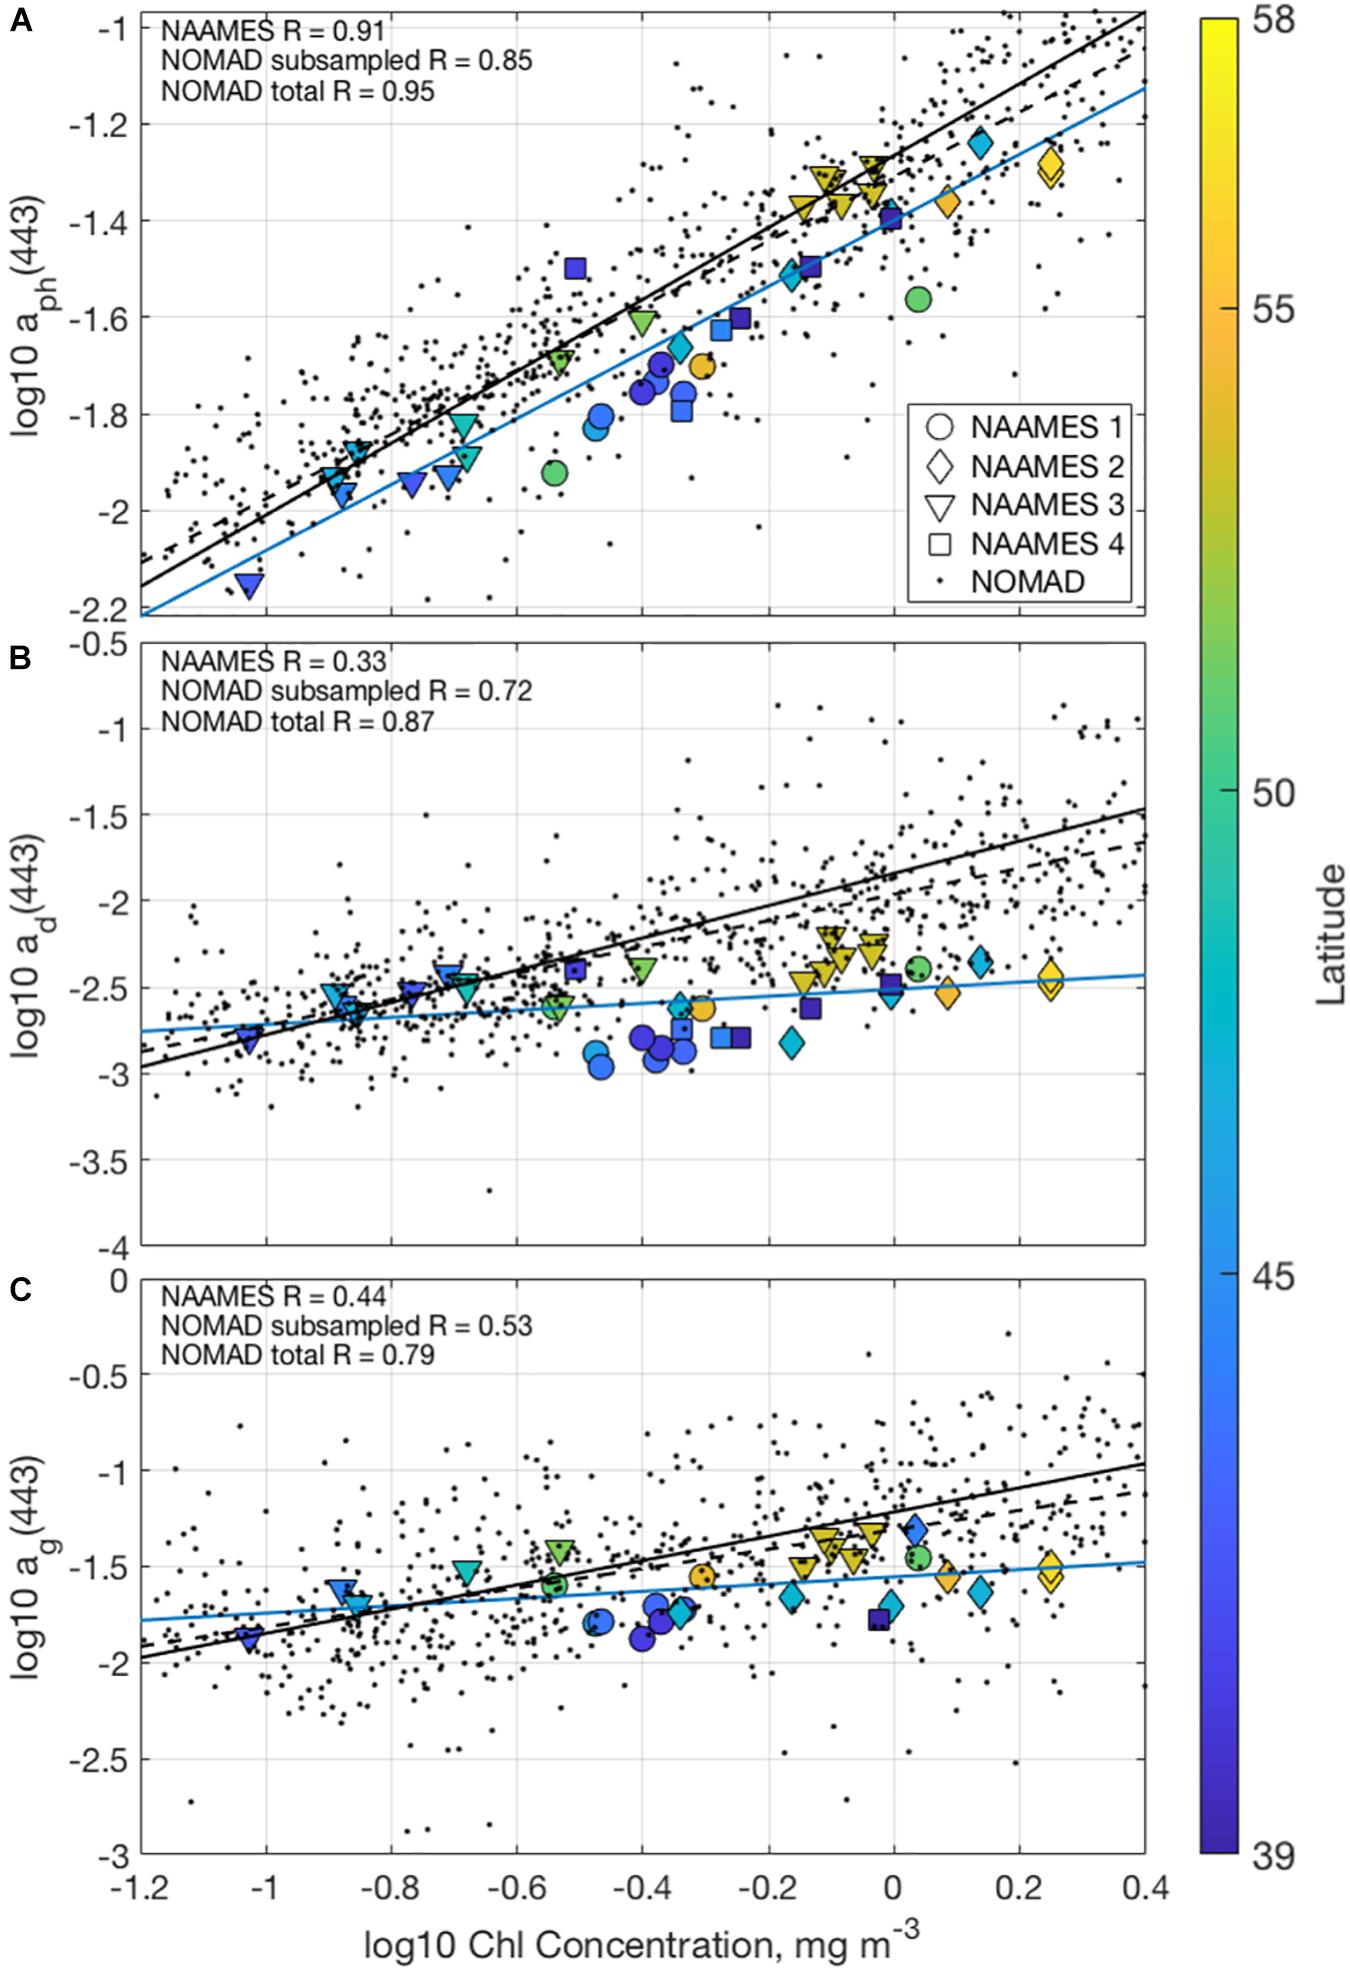
Figure 3. Scatterplots of log10 absorption by (A) phytoplankton, (B) detritus, and (C) CDOM at 443 nm, all organized by the log10 chlorophyll concentration. Colors correspond to the latitude of the measurement and shapes signify the cruise. Black dots are corresponding measurements from the NOMAD database. Trendlines are shown for the NAAMES (blue), subsampled NOMAD (black dashed), and total NOMAD datasets (black solid).
Phytoplankton absorption coefficient at 443 nm [aph(443); Figure 3A] is strongly correlated with chlorophyll a concentration as expected (R = 0.91, 0.85, and 0.95 for NAAMES, subsampled NOMAD, and total NOMAD). Contrasting the strong relationships found between values of aph(443) and the chlorophyll a concentration, values of detrital and CDOM absorption coefficients at 443 nm are only weakly correlated with chlorophyll a concentration, with R-values of 0.33 and 0.44, respectively. Similar coefficients found using the entire NOMAD dataset are much higher [R = 0.87 and 0.79 for the entire NOMAD data set between the chlorophyll a concentration and ad(443) and ag(443), respectively]. Some of the poor correspondence between these measures of detrital and CDOM absorption properties and chlorophyll concentrations may be due to the decreased dynamic range of the NAAMES data set relative to the entire NOMAD database. However, there is considerably less correspondence between these factors in the NOMAD dataset subsampled to match the chlorophyll concentration range observed during NAAMES [R = 0.72 and 0.53 for ad(443) and ag(443), respectively]. This demonstrates that the processes regulating CDOM dynamics during NAAMES are largely independent of those regulating phytoplankton variations. This observed decoupling of detrital and CDOM absorption changes from chlorophyll concentration also violates the bio-optical assumption, pointing to the importance of separating their contributions from ocean color spectra (e.g., Siegel et al., 2005, 2013).
The drivers of absorption spectral variability in the NAAMES dataset can be assessed by normalizing each of the component absorption spectra to the total absorption coefficient spectra. Figure 4 shows the mean relative contributions of detritus, phytoplankton, CDOM, and water (and their standard deviations) to absorption. CDOM is the dominant driver of absorption in the UV and blue wavelengths less than 440 nm for this region, contributing to over 90% of absorption at 300 nm and 70% at 400 nm, similar to the findings of Nelson and Siegel (2013) using a global data set. Phytoplankton pigment absorption then contributes nearly half to total absorption between 450 and 500 nm, while seawater dominates the absorption signal for longer wavelengths. Detritus contributes about 5% to the total absorption in the blue wavebands (350–450 nm) and very little at other wavelengths. These results demonstrate the importance of CDOM to variations in spectral absorption and, in turn, in values of ocean color spectra (e.g., Siegel et al., 2013).
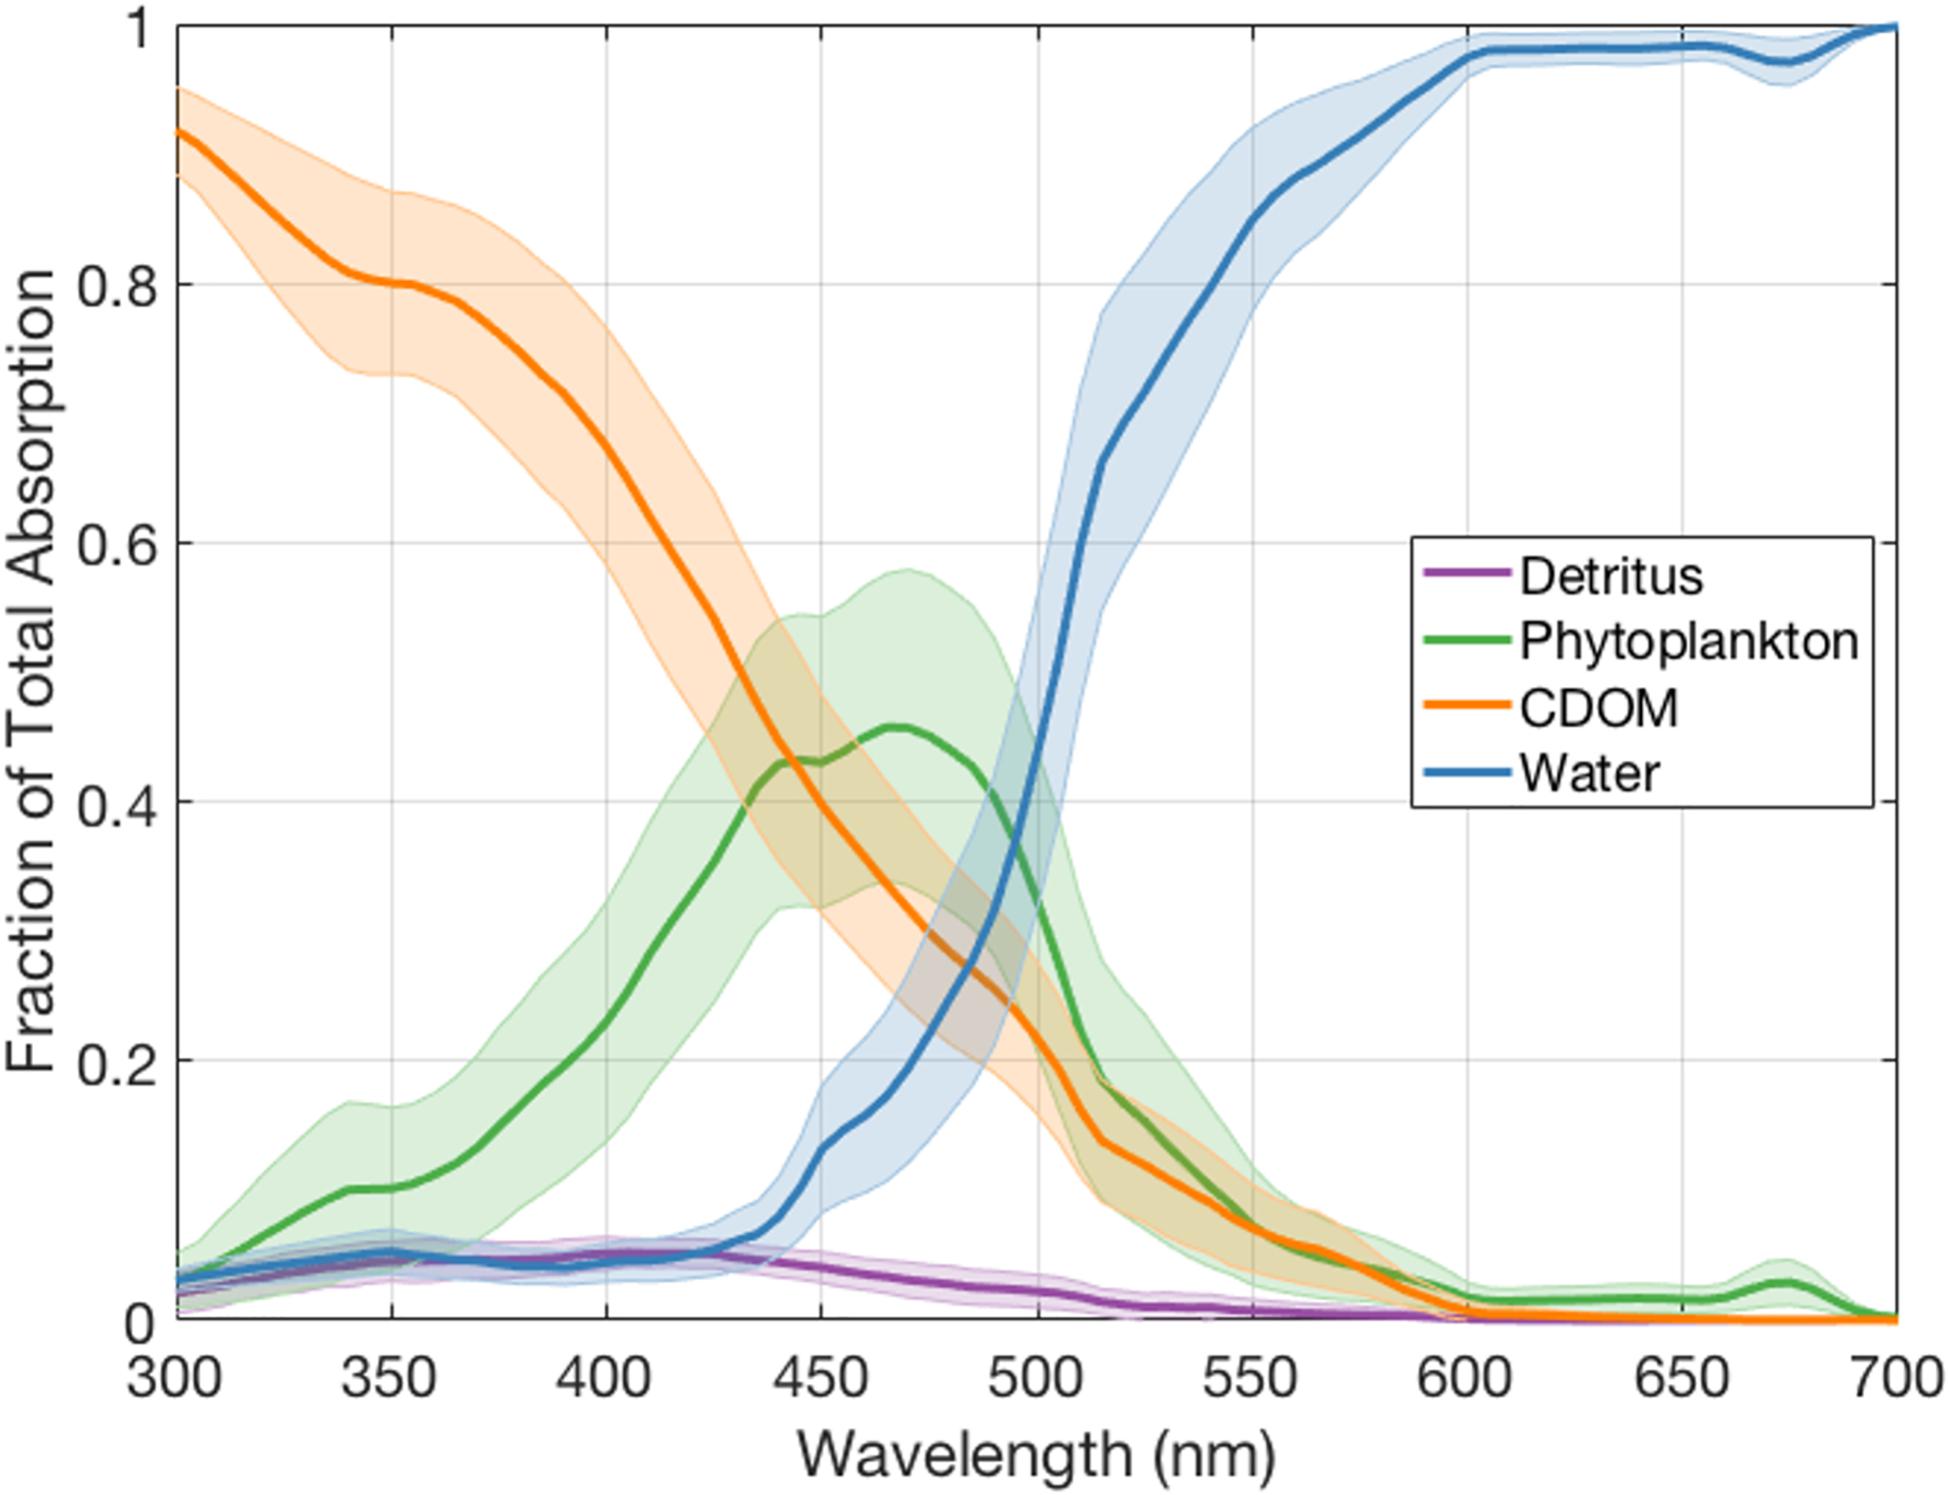
Figure 4. Mean relative contributions of Detritus, Phytoplankton, CDOM, and Water to total light absorption at wavelengths between 300 and 700 nm for the NAAMES dataset. Error bars represent one standard deviation for these estimates.
The spectral slopes in particulate beam attenuation and backscattering (Figures 5A,B) have been used to discern information about the particulate size distribution (e.g., Boss et al., 2001; Kostadinov et al., 2009; Slade and Boss, 2015). Steeper spectral slopes correspond to a population of particles increasingly dominated in numerical abundance by smaller particles. The majority of the values of the power law slope of particulate beam attenuation, calculated here between 400 and 750 nm, fall between 0 and 1 (Figure 5A) and are correlated with chlorophyll concentrations (R = −0.69). Lower values were found at higher chlorophyll concentrations such as the subpolar stations during the Climax Transition, suggesting a higher relative abundance of larger particles in these regions. The highest spectral slope values were measured during the Declining Phase at southern stations.
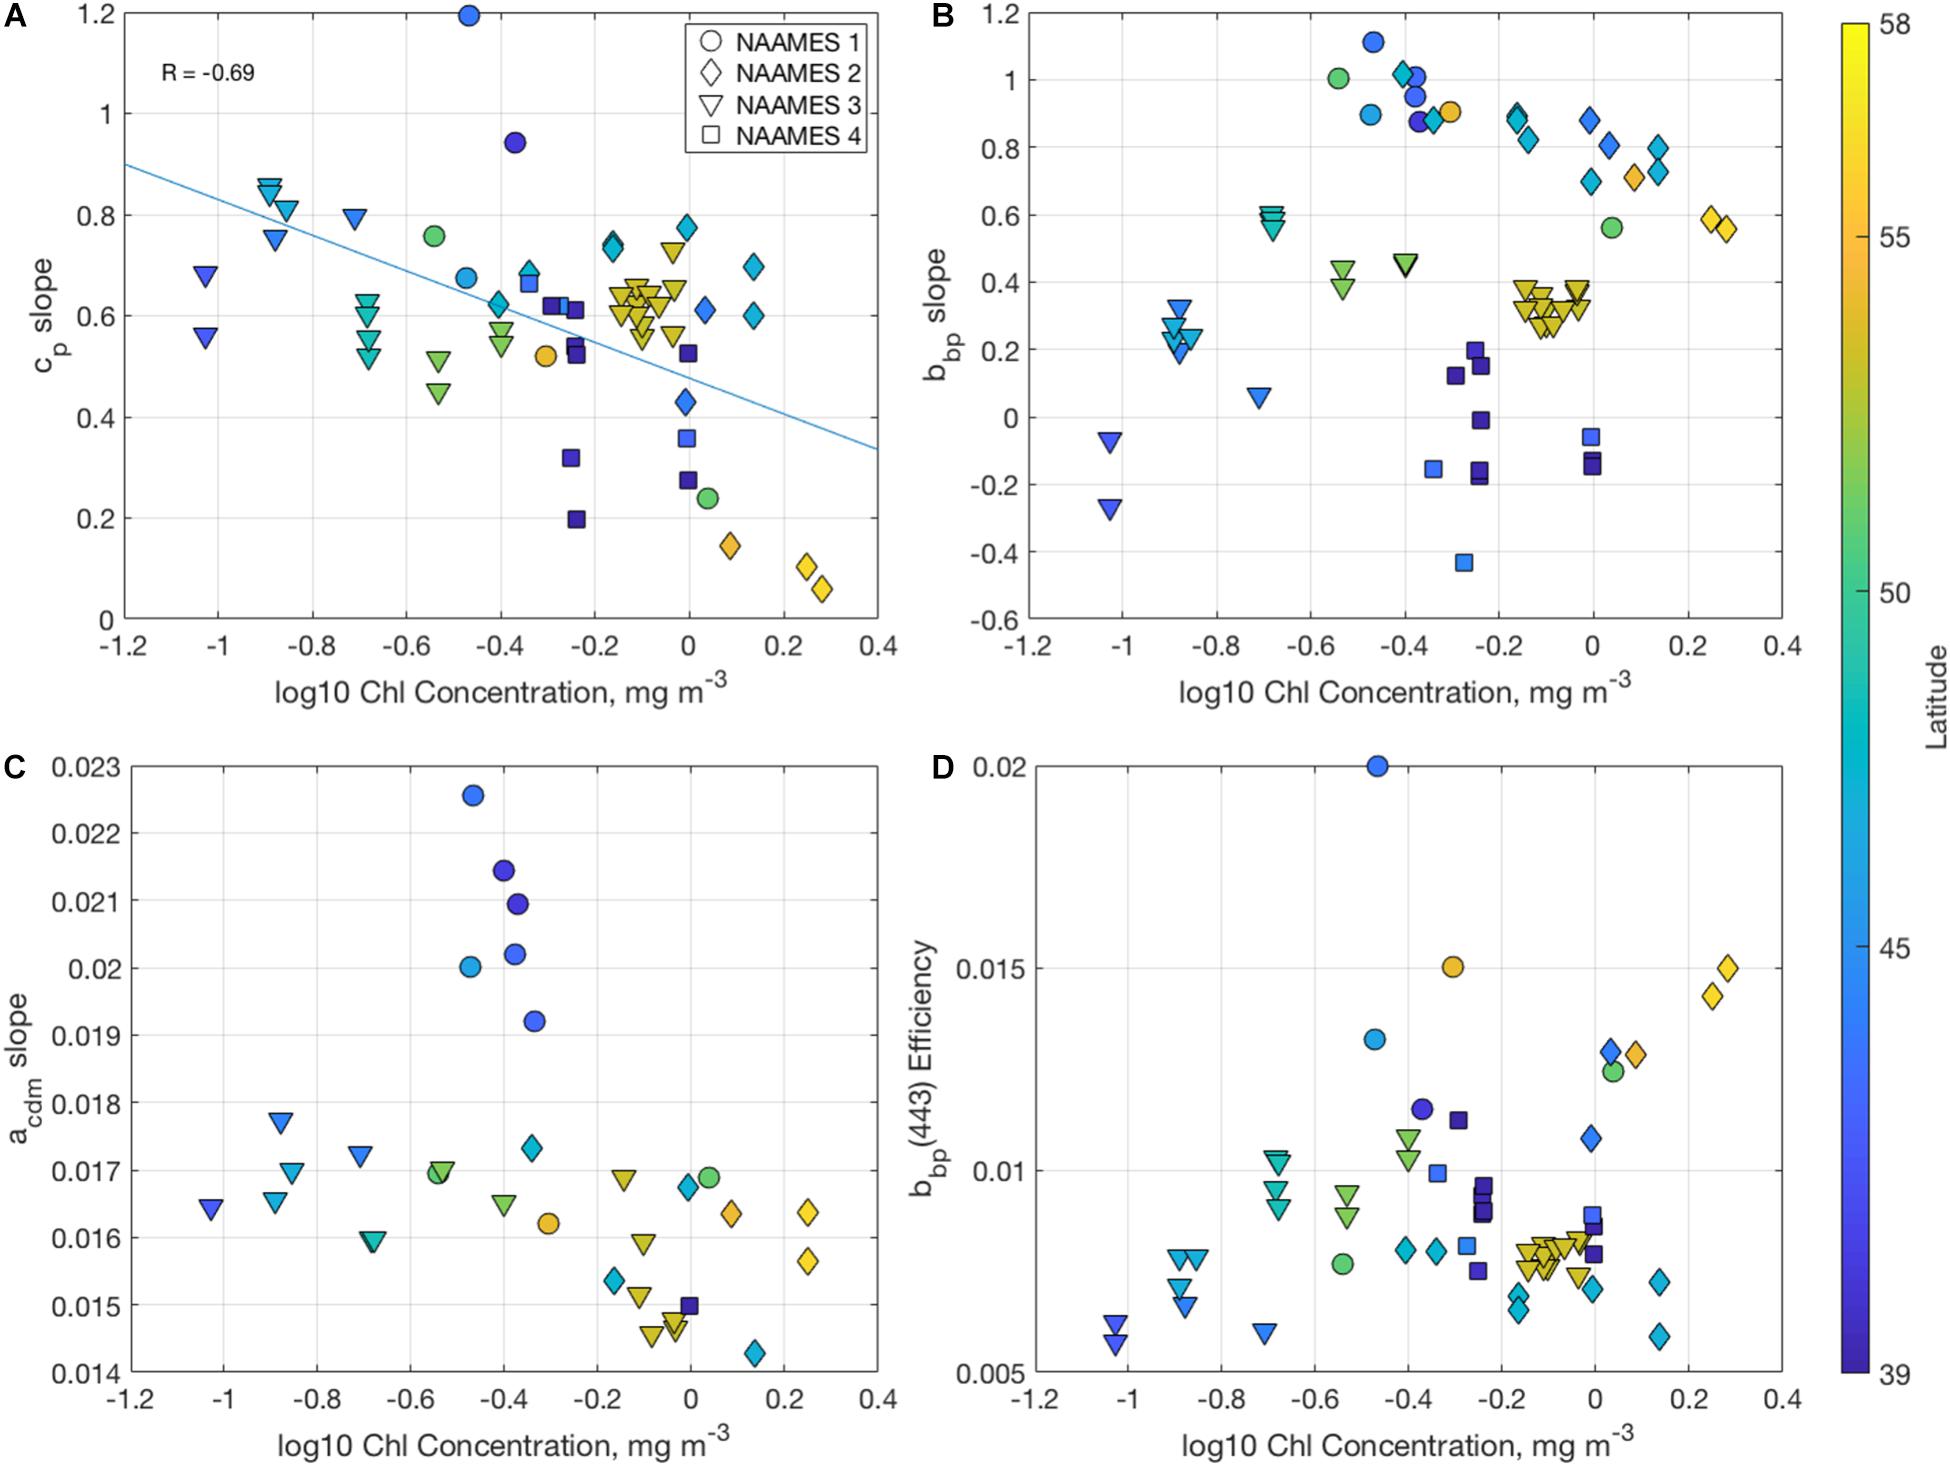
Figure 5. Scatterplots of (A) the particulate beam attenuation power law spectral slope (unitless), (B) the particulate backscattering power law spectral slope (unitless), (C) the colored detrital and CDOM absorption exponential slope (units of nm−1), and (D) the particulate backscattering efficiency at 443 nm (unitless), all organized by the log10 chlorophyll concentration (mg m−3). Colors correspond to the latitude of the measurement, and shapes signify the cruise.
Particulate backscattering slopes range between −0.4 and 1.2 and tend to aggregate by cruise, with the highest values found during winter mixing, then followed by the peak of the bloom, while the Sargasso waters during NAAMES 4 showed the lowest spectral slopes. However, there is no relationship between particulate backscattering spectral slopes and chlorophyll concentrations (R = 0.01) or the slope of the beam attenuation spectrum (R = 0.07) in this dataset. The spectral slopes of beam attenuation and backscattering incorporate different aspects of the inherent optical properties of particles (e.g., Bricaud and Morel, 1986). The beam attenuation coefficient includes total particulate scattering and absorption and hence its spectral slope would be less sensitive to significant changes in absorption than backscattering spectral slopes, particularly from algal populations (e.g., Slade and Boss, 2015). Underway data measured as part of this campaign from another group showed that particle size distributions significantly correlated with beam attenuation slopes during NAAMES 3, but not with backscattering slopes (Boss et al., 2018). Modeling of the relationship between bbp(λ) and PSD slopes by Kostadinov et al. (2009) showed the largest uncertainties in that relationship for bbp(λ) slopes < ∼0.5. Many NAAMES values are less than that, indicating a need for improvements for methods that try to quantify particle size distributions from optical data sets.
The spectral shapes and ratios of IOPs can also be used to describe the composition of absorbing and backscattering materials (IOCCG, 2006). The shapes of CDOM and detrital absorption (Figure 5C) are typically characterized as exponential decay functions and mathematically are often combined in optical inversions as the absorption by CDM, acdm(λ) (Roesler et al., 1989; Carder et al., 1991; Werdell et al., 2018). Values of the acdm(λ) slope vary between 0.013 and 0.021 nm–1 when calculated between 400 and 500 nm, which is consistent with previous analyses and suggests a higher absorption contribution from CDOM rather than detritus in this region (e.g., Roesler et al., 1989). There was a weak but statistically insignificant negative trend between chlorophyll concentrations and acdm slopes (Type II regression slope = −0.0015 nm–1 mg–1 m3, p = 0.0849). Only during NAAMES 1 are the slopes significantly steeper, which may correspond with freshly upwelled CDOM from the deep winter mixing and lower particle loads (Swan et al., 2012).
The particulate backscattering efficiency (Figure 5D), calculated as the ratio of backscattering to total scattering at 443 nm, largely varies as a function of both the particulate refractive index and size distribution (Twardowski et al., 2001). The values here fall between 0.5 and 1.5%, significantly lower than the historical Petzold (1972) measurements in the San Diego Harbor (1.8–2%) and off the coast of Southern California (1.3–1.4%), and suggest a significant contribution of larger particles or less refractive particles compared to these regions (Twardowski et al., 2001).
Values of the remote sensing reflectance spectra [rrs(λ), Figure 6A] will increase as the backscattering increases or as absorption signals decrease (Eq. 5). For ultraviolet wavelengths (<400 nm), reduction in rrs(λ) suggests that CDOM absorption dominates ocean color signals in the UV. Variability in rrs(λ) between 400 and 500 nm suggest that phytoplankton absorption dominates the ocean color signal and its variations in this spectral region. This is particularly evident in the valleys in rrs(λ) spectra during the Declining Phase associated with high phytoplankton absorption. The chlorophyll a fluorescence peak at 683 nm is also notable during both the Climax Transition of the bloom at all latitudes and at the northern stations during the Declining Phase. Reflectance spectra at all other times and regions show typical “bluer” waters associated with the oligotrophic open ocean.
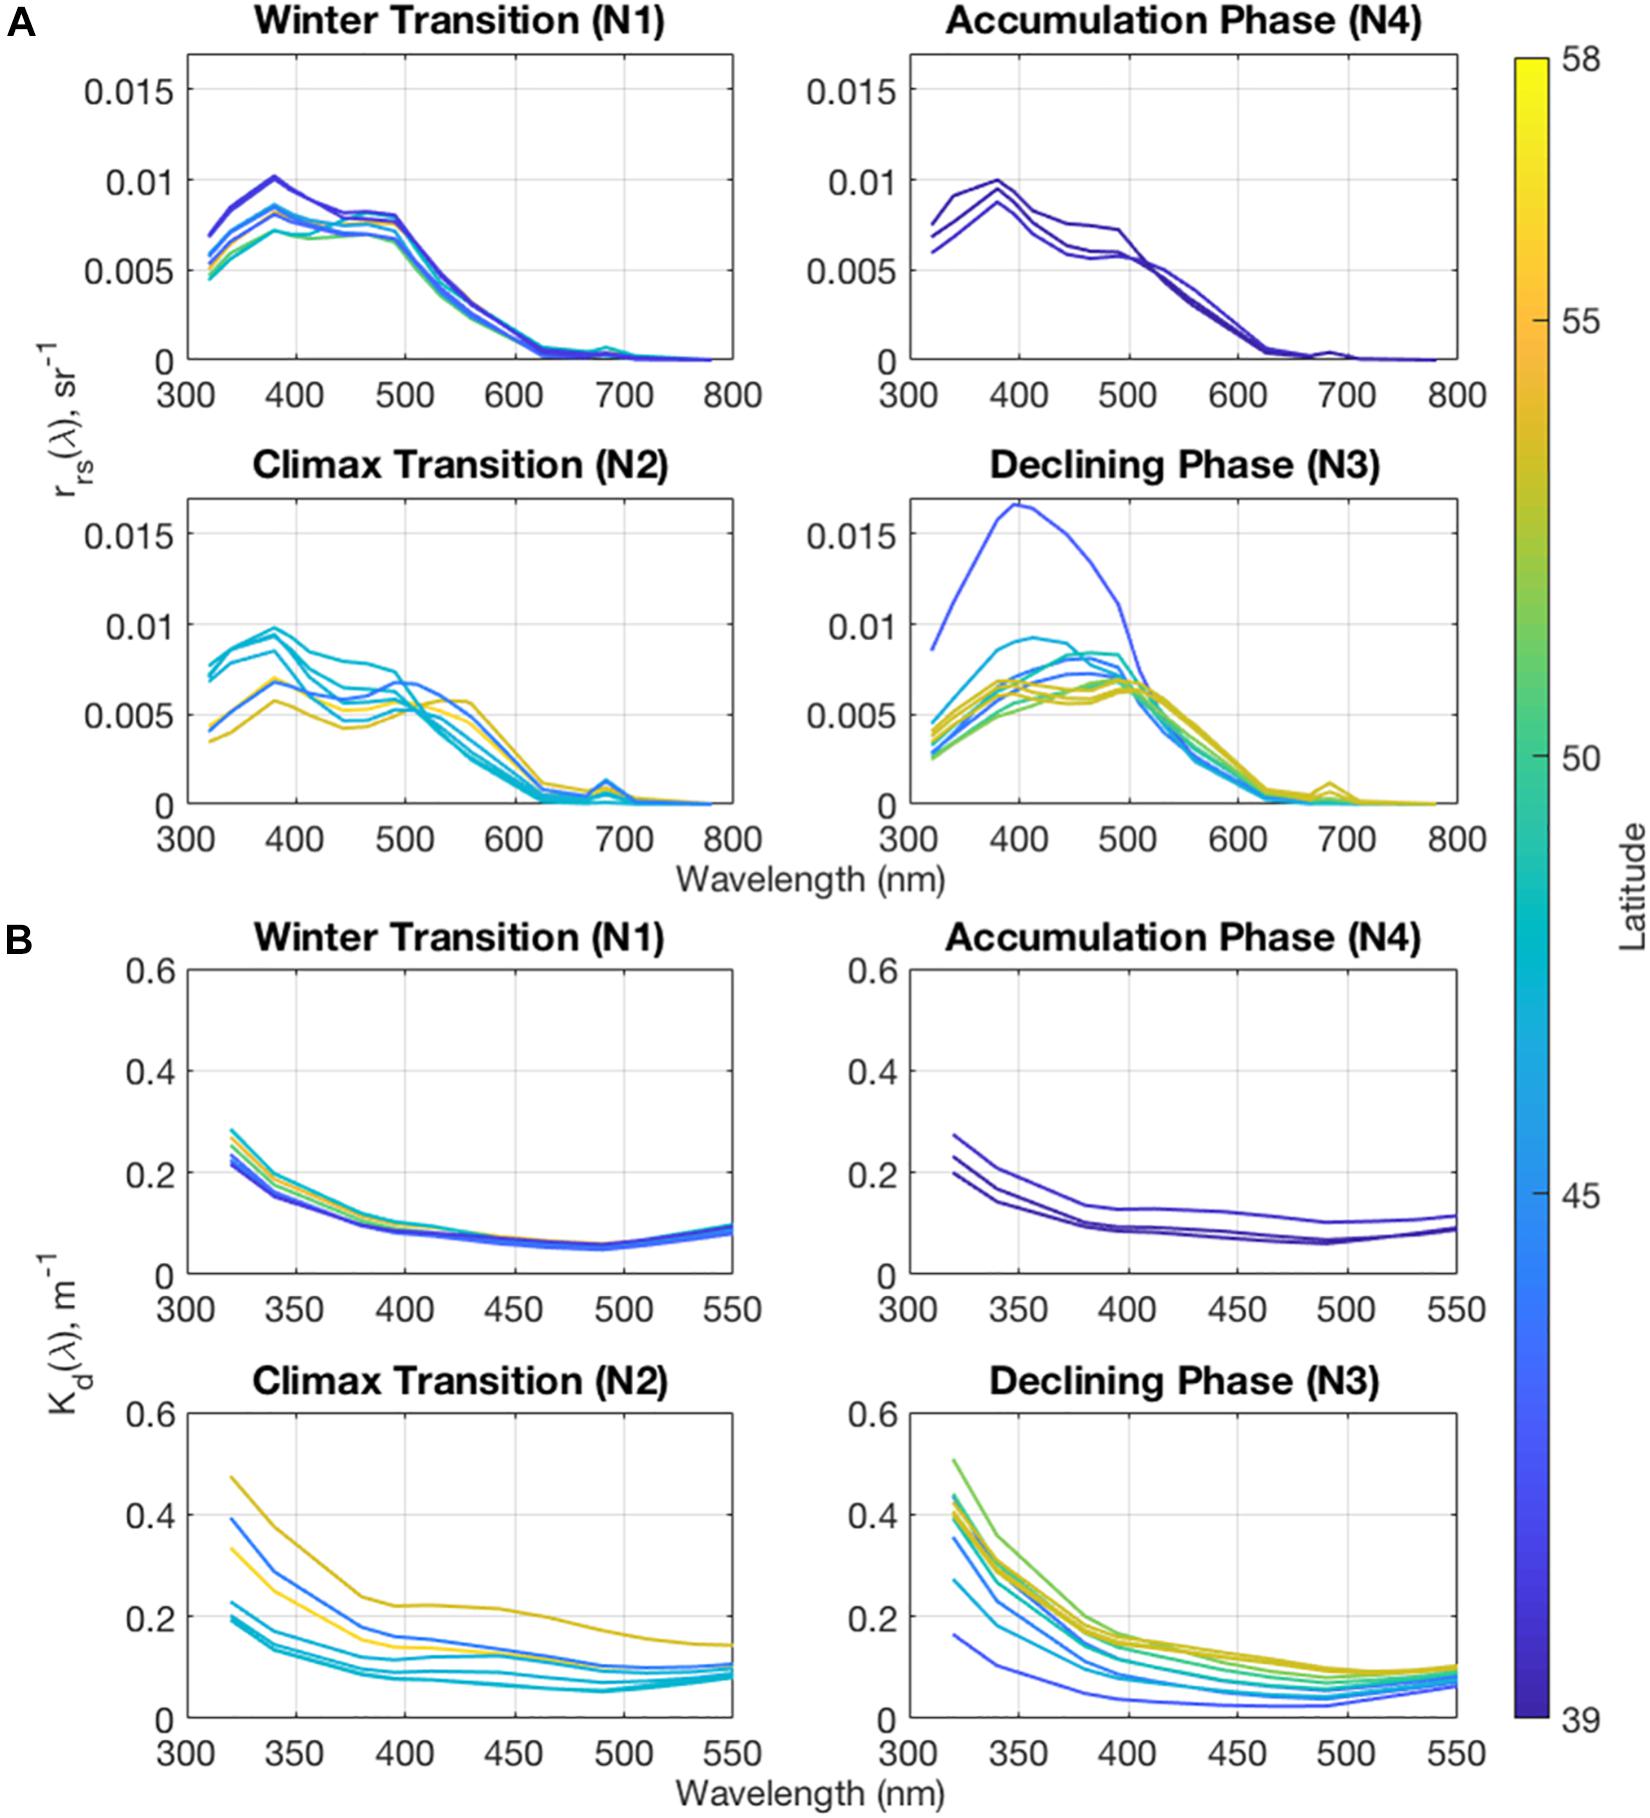
Figure 6. Surface mean values for (A) remote sensing reflectance and (B) diffuse attenuation coefficient spectra for each of the NAAMES cruises.
The diffuse attenuation coefficient (Figure 6B), Kd(λ), should be a strong function of both the backscattering and absorption of optical properties following Eq. (7). Kd(λ) is largely absorption driven since the total absorption coefficient is much larger than the total backscattering coefficient. The exponential shape of Kd(λ) at shorter wavelengths indicates that the CDM absorption signal, primarily from CDOM, dominates ocean color at short wavelengths throughout the NAAMES project, particularly during the Climax Transition and Declining Phase cruises. The increase in the Kd(λ) signal around 443 nm shows that phytoplankton contribute significantly to the blue-green region during the Climax Transition and at northern latitudes during the Declining Phase, but the signal is largely masked by CDM absorption.
Observations of Optical Property Variations on Daily Time Scales
Variations in the magnitude and composition of in-water constituents can also occur rapidly throughout the water column. An opportunity to sample a station during the peak bloom just after a storm occurred on May 24, 2016 during NAAMES 2 (Figure 7). Initially, the mixed layer depth was >200 m, followed by rapid shoaling to <30 m over the course of 4 days. A decoupling of phytoplankton growth and grazing allowed the accumulation of biomass (Graff and Behrenfeld, 2018; Morison et al., 2019). In the upper 25 m, chlorophyll concentrations and phytoplankton biomass increased, which in turn reduced the depth of the euphotic zone from ∼70 to ∼45 m depth (Table 1).
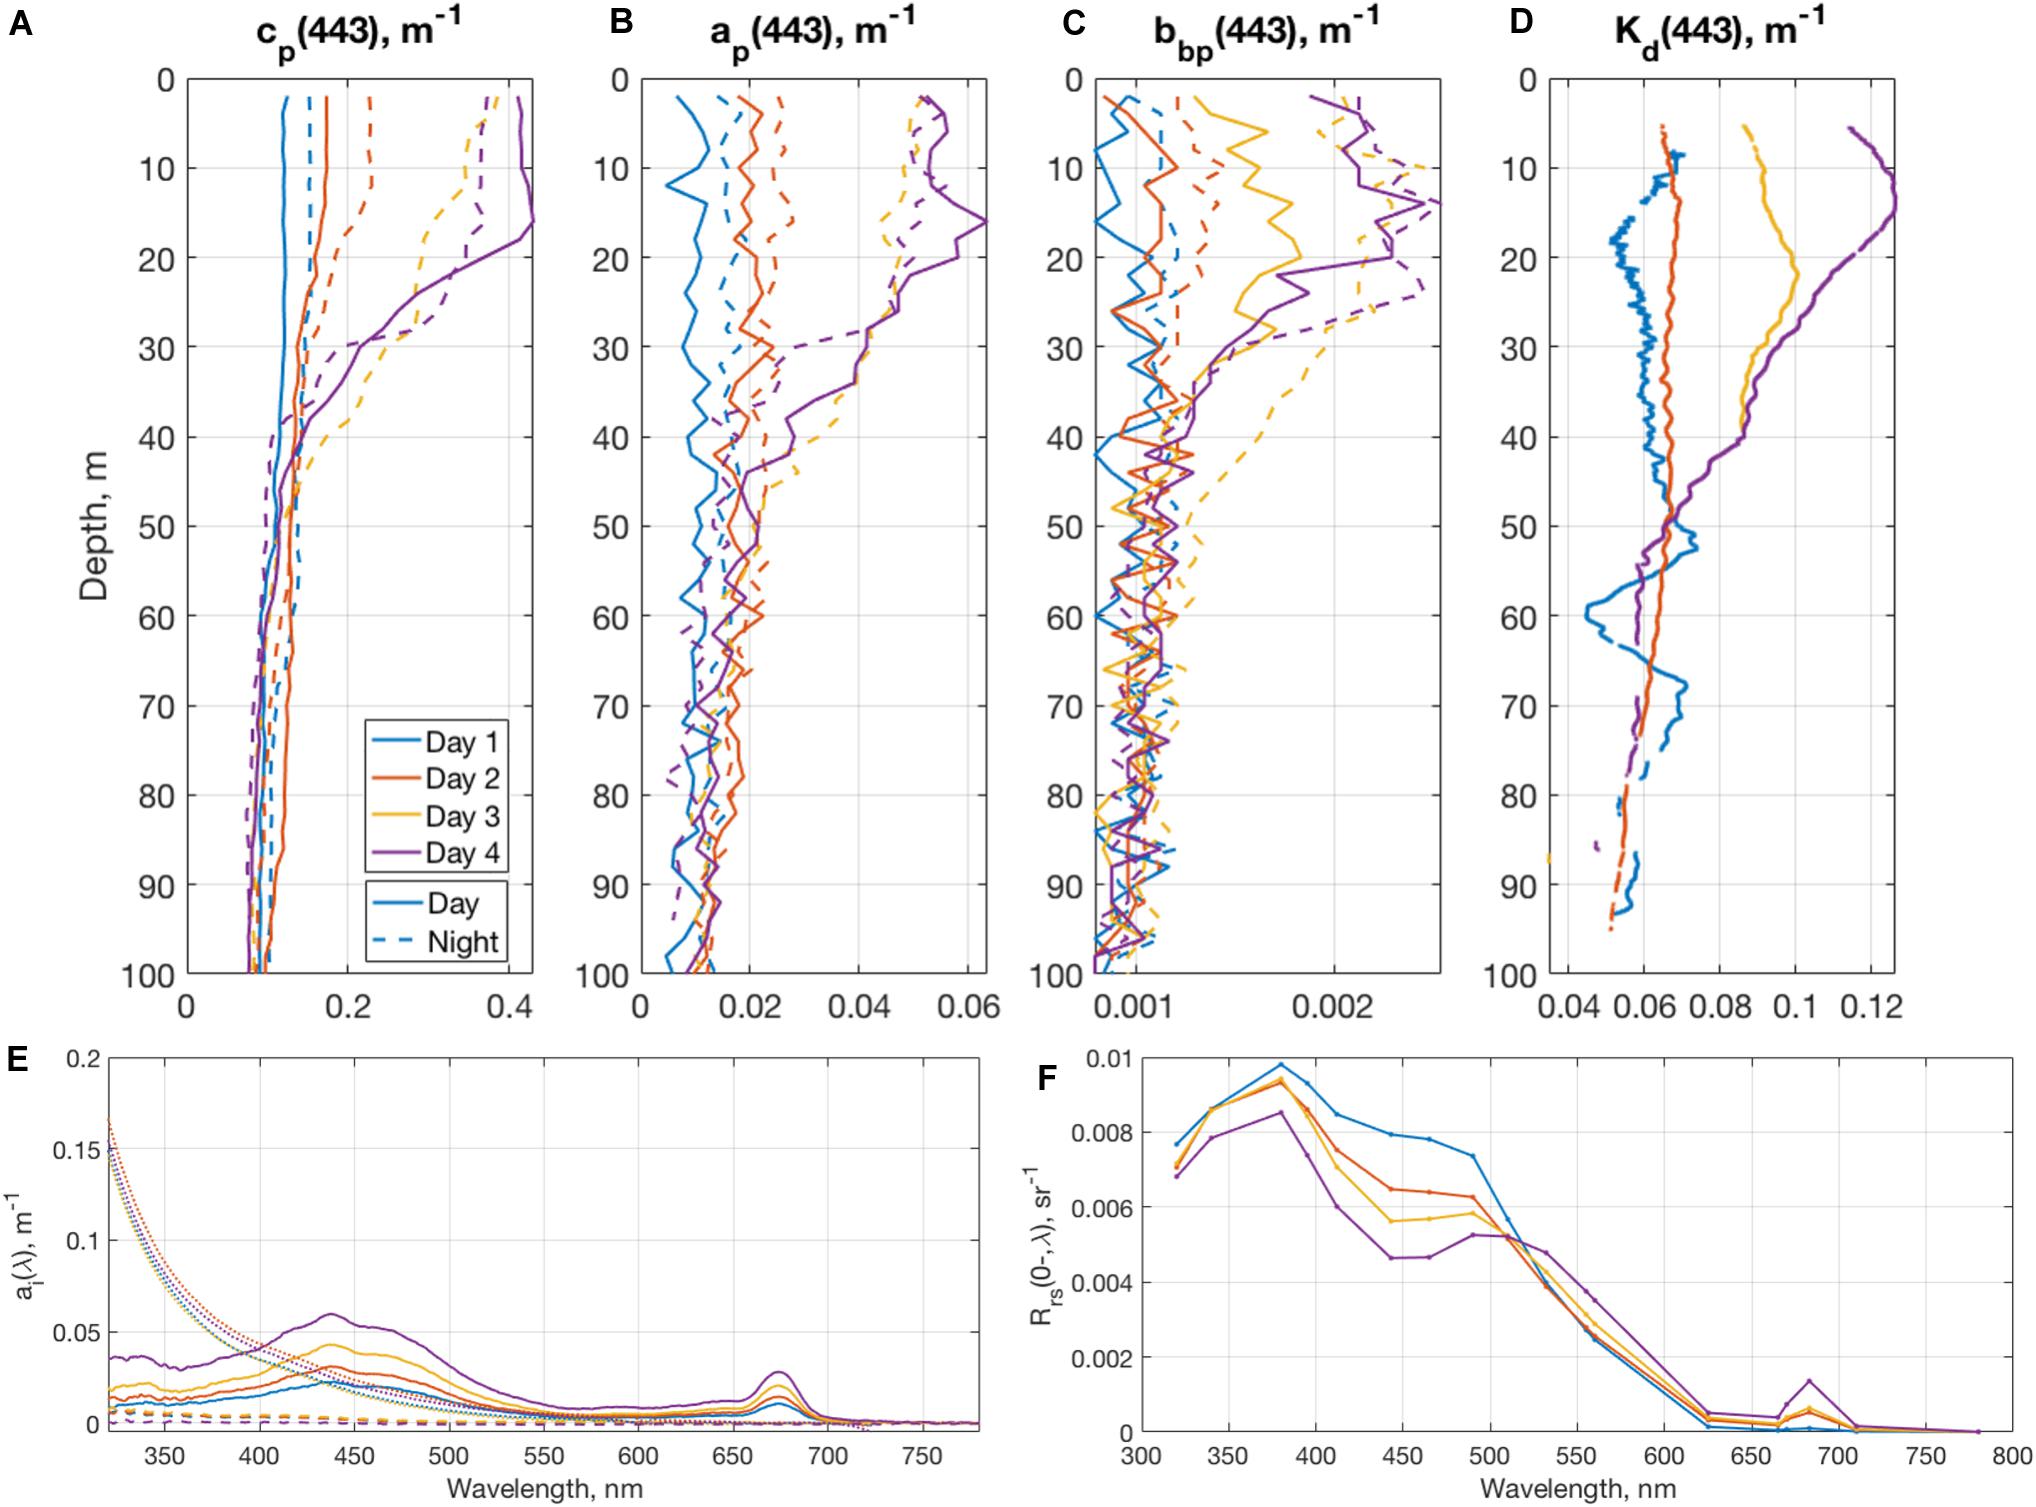
Figure 7. Profiles of (A) particulate beam attenuation, (B) particulate absorption, (C) particulate backscattering, and (D) diffuse attenuation coefficients, measured during the 4 days of occupation of Station 4 during NAAMES 2. Also shown are surface spectra of (E) absorption coefficients of CDOM (dotted line), phytoplankton (solid line), and detritus (dashed line) and (F) remote sensing reflectance spectra.
Sequential vertical profiles of selected IOP variables and Kd(443) (Figure 7) emphasize how different parts of the water column responded to the rapid increase in phytoplankton biomass. The first day was characterized by mixed layer depths approaching 200 m. where profiles of IOPs were homogenous over the top 100 m. IOP magnitudes revealed very blue waters, with low values of particulate beam attenuation and absorption at 443 nm at the surface (Figures 7A,B). Over the course of 4 days, the magnitude of particulate beam attenuation increased almost fourfold, beginning at values of 0.112 m–1 and peaking at 0.418 m–1 in the top 15 m. Similar trends were found in particulate absorption (Figure 7B), which increased from 0.0096 to 0.0554 m–1, and particulate backscattering (Figure 7C), which increased from 0.00089 to 0.0023 m–1. Diffuse attenuation profiles (Figure 7D), which reflect the summation of changes in total absorption and backscattering in the water column, also showed a marked increase, from 0.0607 to 0.121 m–1. Particulate backscattering slopes (not shown) also significantly changed from 1.01 to 0.73 nm–1, while slopes of particulate beam attenuation did not significantly change, suggesting that the bulk particle index of refraction may be decreasing at shorter wavelengths due to higher abundances of phytoplankton (e.g., Whitmire et al., 2007).
Component absorption spectra show that phytoplankton absorption coefficients are driving the changes observed during this short duration station (Figure 7E). Large increases in phytoplankton absorption are observed for wavelengths less than 500 nm, and, in particular, near the two chlorophyll peaks at 443 and 676 nm. However, only slight increases in CDOM and detrital absorption spectra are seen. These changes in aph() correspond to a large decrease in remote sensing reflectance in the blue to blue–green spectral region due to phytoplankton absorption and increases for the green wavelengths due to phytoplankton backscattering (Figure 7F). The characteristic chlorophyll fluorescence peak at 683 nm is also much more pronounced after 4 days. Overall, in terms of ocean color reflectance, this station transitioned from a blue color, indicative of oligotrophic open ocean, to blue-green, signifying a much more productive water column. This station highlights the importance of potential changes on short time scales, as optical conditions rapidly changed from values expected during the middle of the deep winter mixing phase of the bloom back to values characteristic of the peak of the bloom.
Assessing the Controls on Ocean Color Variability
Values of the correlation coefficient between environmental conditions, selected pigments, inherent optical properties, and apparent optical properties can be used to elucidate drivers of ocean color at different parts of the spectrum (Figure 8). Most data fields were log-transformed before statistical analysis (signified with ‘∗’ next to parameter names in Figure 8). To highlight how the magnitude of optical constituents correlate with other variables, 443 nm was used as the selected wavelength for all IOPs except for CDOM, where 380 nm was used. AOPs are given at three different wavelengths (380, 443, and 555 nm) to show how optical constituents contribute to AOP variability at different wavelengths. Supplementary Table S1 in the supplementary section includes the R-values for each comparison where high correlations, defined as absolute values greater than 0.707 (R2 > 0.5) are shown in bold, and statistically insignificant values with p < 0.05 are in italics with parentheses.
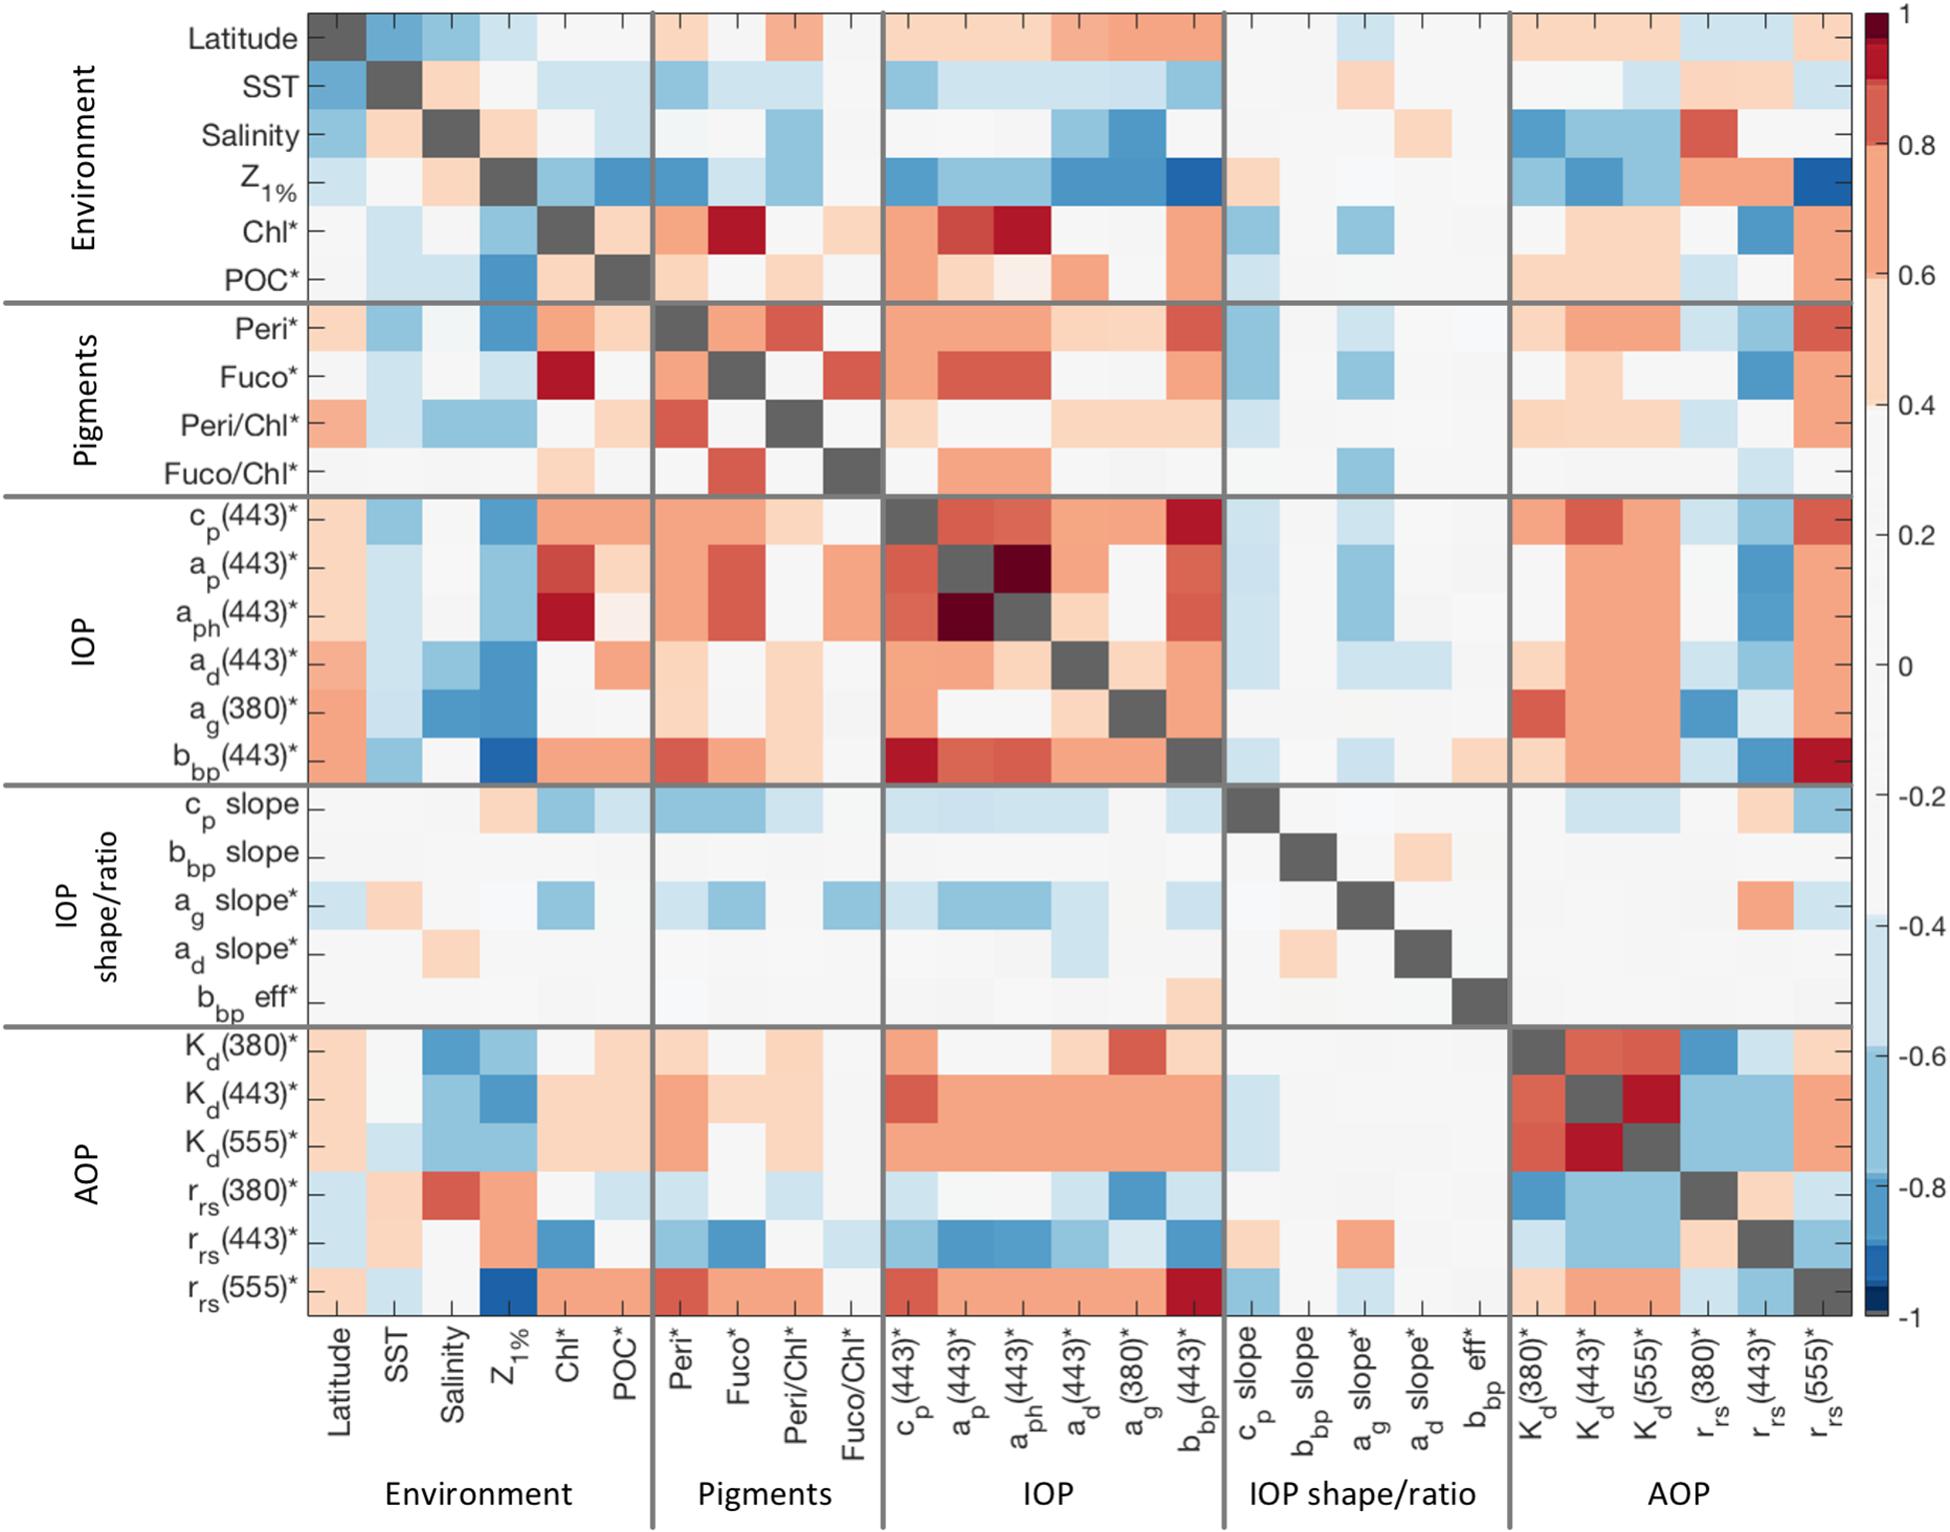
Figure 8. Correlation matrix (R-values) of environmental and optical variables from NAAMES. Variables are sorted by environmental data, selected pigments, inherent optical properties, inherent optical spectral slopes, and apparent optical properties. Starred variables indicate data were log-transformed prior to statistical analysis. Supplementary Table S1 shows the exact values of correlation coefficients.
Covariances in the environmental parameters help organize the variability of optical parameters within the context of the different phases of the North Atlantic Bloom (Figure 8). Colder, less saline waters were typically found in the northern stations. The higher latitude stations also showed higher contributions by particles and CDOM to inherent optical properties. The 1% light level has a strong negative correlation with particulate beam attenuation and backscattering (R = −0.88 and −0.91) as well as detrital and CDOM absorption (R = −0.79 and −0.80). Higher chlorophyll a concentration corresponds to the expected higher phytoplankton absorption as well as with particulate absorption and backscattering. However, insignificant correlations were found between chlorophyll concentrations and detrital or CDOM absorption coefficients. POC concentrations correlated strongly with particulate beam attenuation and backscattering (R = 0.73 and 0.74) as well as with detrital absorption (R = 0.73), but correlations were insignificant between POC and particulate or phytoplankton absorption.
Differences in phytoplankton pigment concentrations can be used to characterize changes in phytoplankton community structure (e.g., Kramer et al., 2020). For example, the peaks in the phytoplankton absorption spectra around 320 nm were significantly correlated with Peridinin concentrations (not shown, R = 0.70), which indicates strong influences by dinoflagellates in the high latitude regions during the peak of the bloom and the declining phase (NAAMES 2 and 3, respectively; see Figure 2C). Peridinin is also strongly correlated with particulate and phytoplankton absorption at 443 nm (R = 0.75 and 0.73) as well as with particulate backscattering at 443 nm (R = 0.81). Fucoxanthin concentrations are most strongly correlated with chlorophyll concentrations (R = 0.92), suggesting that diatoms are the dominant driver of changes in chlorophyll a concentration during the NAAMES study. Fucoxanthin concentrations are also strongly correlated with particulate and phytoplankton absorption at 443 nm (R = 0.84 and 0.86).
Correlations among the inherent optical properties give insight into the various relationships between optical constituents and the apparent optical properties. Particulate beam attenuation is strongly correlated with phytoplankton and detrital absorption (R = 0.80 and 0.79) and less correlated with CDOM absorption (R = 0.62). Phytoplankton absorption shows the highest correlation with particulate absorption at 443 nm (R = 0.99) and is strongly correlated with particulate backscattering at 443 nm (R = 0.88), which corresponds to the trend that phytoplankton are by far the dominant factor in particulate optics for this data set. Additionally, CDOM absorption is not significantly correlated with particulate or phytoplankton absorption, indicating that the processes regulating changes in CDOM are independent from processes regulating phytoplankton variations.
Spectral IOP slopes have much poorer correlations with other optical parameters or ocean constituents measured as part of the NAAMES project (Figure 8). Slopes for particulate backscattering show no strong correlations with any other parameter. As the beam attenuation slope has been found to correspond to slopes of the particle size distribution during NAAMES 3 (Boss et al., 2018), the negative correlations with total chlorophyll a concentration (R = −0.69; see also Figure 5A), POC (R = −0.42), particulate absorption (R = −0.58), and particulate backscattering (R = −0.47). This is consistent with the notion that as the particle load increases, larger particles become increasingly dominant in the total particle size distribution. Beam attenuation slopes also correlate with peridinin concentrations (R = −0.75), showing the influence of the larger dinoflagellate cells. The exponential slope of CDOM absorption shows lower values in regions with increased chlorophyll and particle loads, suggesting more recently created CDOM in the region (e.g., Swan et al., 2012). The exponential slope for detrital absorption and the particulate backscattering efficiency, the ratio of backscattering to total scattering at 443 nm, are not significantly correlated with any optical or environmental parameter.
The various shapes of the in-water constituent IOPs cause them each to affect different parts of the ocean color spectrum. CDOM absorption dominated the UV portion of the spectrum, with higher magnitudes significantly correlating with higher values of Kd(380) (R = 0.85) and lower values of rrs(380) (R = −0.87). Kd(443) and Kd(555) were positively correlated with all changes in IOPs, corresponded with higher latitude regions, and contributed to a decrease in the euphotic zone depth. Negative correlations between rrs(443) and particulate absorption, beam attenuation, and backscattering suggest that particle abundance controls remote sensing reflectance in the blue spectral region. The switch to positive correlations between rrs(555) and IOPs, especially with particulate backscattering (R = 0.94), suggest particle optics are the dominant influence in the green region.
The spectral slope of the relationship between rrs(λ) and optical constituents (Figure 9) as a function of wavelength illustrates the relative contributions of different in-water elements to the ocean color spectrum (e.g., Kostadinov et al., 2007). Negative slope spectra correspond to waters that become “darker” as the constituent increases due to more absorption in that part of the spectrum, while positive slopes correspond to a greater contribution to backscattering (Eq. 5). Increases in chlorophyll concentration and phytoplankton absorption contribute significantly to decreases in rrs(λ) in the blue wavelengths and to increases in rrs(λ) in the green wavelengths, while positive slopes at 683 nm corresponds to the chlorophyll fluorescence peak in rrs(λ) (Figures 9A,B). Detrital absorption (Figure 9C) follows a similar though weaker trend, suggesting a covariance with phytoplankton IOPs and POC concentrations as seen in Figure 8. However, there are more significant detrital contributions to rrs(λ) for the UV wavelengths where absorption by detrital particles is the strongest. Higher particulate backscattering magnitudes (Figure 9D) also results in lower rrs(λ) in the blue and higher rrs(λ) in the green due to the majority of the particulate optical signal coming from phytoplankton variability. Increased CDOM concentrations (Figure 9E) contributes strongly to absorption signals in the near-UV and blue wavelengths due to the strong exponential increase in absorption toward the shorter wavelengths, but increased reflectance in the green indicates a covariance with backscattering particles in the NAAMES dataset.
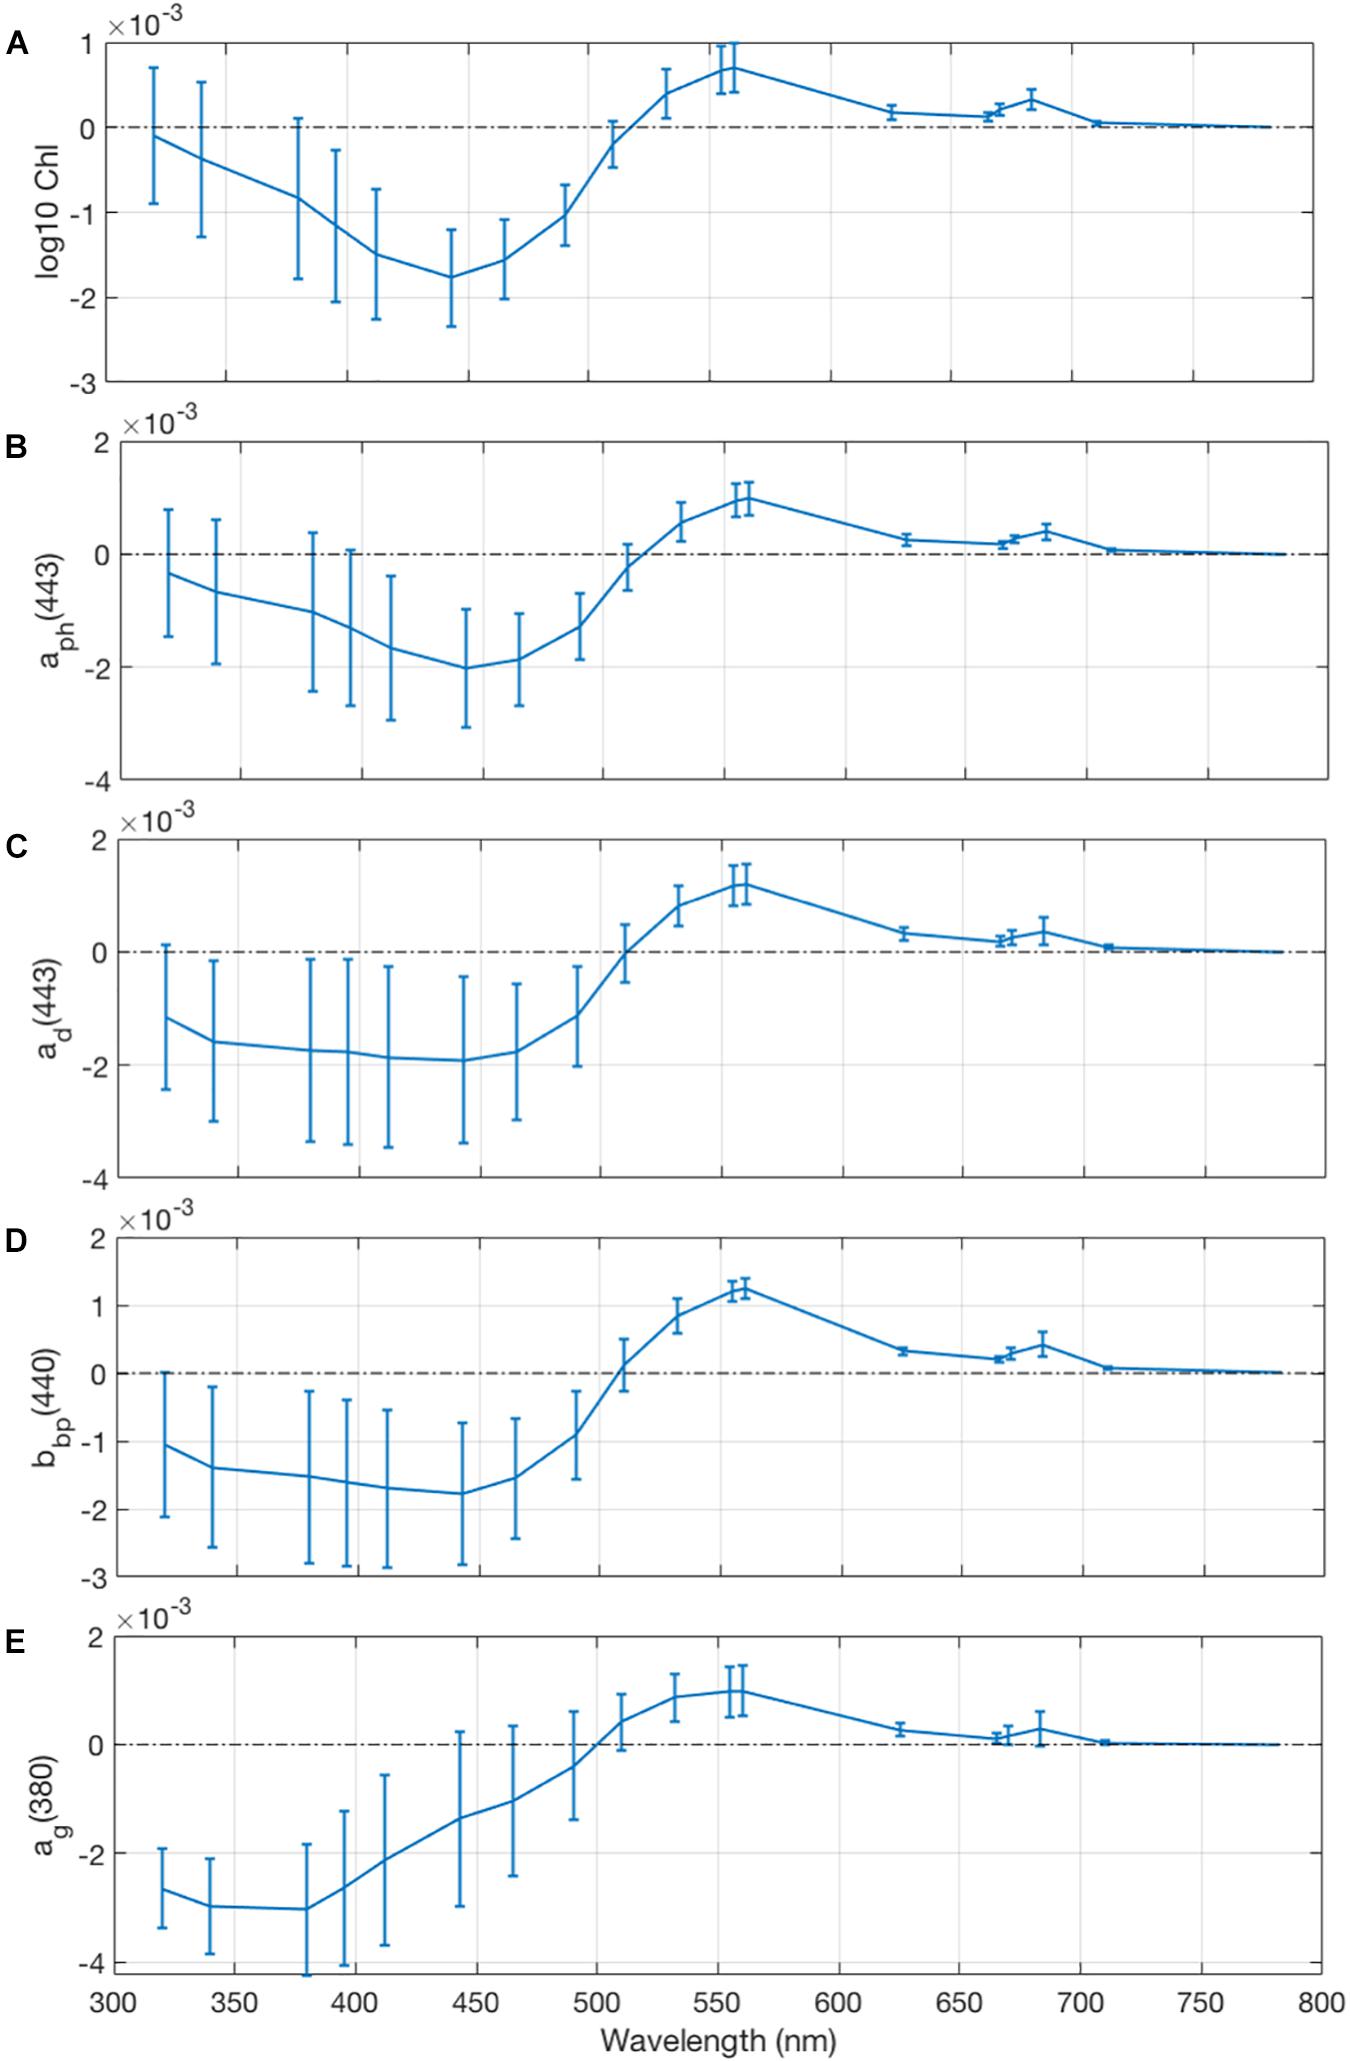
Figure 9. Linear slope regressions of remote sensing reflectance on (A) log10 HPLC Chl a concentration, (B) phytoplankton absorption at 443 nm, (C) detrital absorption at 443 nm, (D) particulate backscattering at 440 nm, and (E) CDOM absorption at 380 nm, all normalized by the interquartile range of the optical constituent. Magnitudes of the optical constituents are normalized by their interquartile ranges to directly intercompare the relative importance of the variation of each element, resulting in units of sr– 1 for each plot’s y-axis. Error bars are 95% confidence intervals on the normalized value of the slope.
Testing the Quasi-Inherency of Remote Sensing Reflectance
One of the main assumptions in satellite bio-optical inversion models is that variability in remote sensing reflectance is due to the inherent optical properties, and that influences from the characteristics of the light field and sea surface properties can either be neglected or modeled. Two approaches are typically employed for modeling the f/Q parameter in Eq. 5. First, radiative transfer modeling by Gordon et al. (1988) derived a spectrally fixed, quadratic equation to link rrs(λ) to the IOP ratio, or
The other method is spectrally varying and models the f/Q parameter as a function of solar geometry and chlorophyll a concentration (Morel et al., 2002). Here we investigate the quasi-inherency of remote sensing reflectance spectra by characterizing their relationships to IOPs in the context of the NAAMES dataset.
Generally, measurements of remote sensing reflectance vary as a function of the ratio of the backscattering coefficient to the sum of the absorption and backscattering coefficients (Eq. 5). Figure 10 shows the relationship between bb/(a + bb) and rrs(λ) at five wavelengths just below the surface. The slope of the Type 2 regression line with zero intercept (slope = 0.1078 sr–1, R2 = 0.77, p << 0.001) corresponds to the f/Q parameter (Eq. 5). The dashed reference line corresponds to the Gordon et al. (1988) set of constant f/Q parameters (G1 = 0.0949 and G2 = 0.0794, Eq. 11) made for open ocean conditions, while the dashed line corresponds to the Lee et al. (1999) parameters (G1 = 0.084 and G2 = 0.17) for higher scattering coastal waters. While most of the matchups fall near the modeled values, the significant outliers in rrs(λ) come from one cast in NAAMES 3 that had broken sky conditions which likely compromised the quality of that profile. Removal of this cast slightly improved the R2 value (0.78) but did not alter the regression slope and intercept. Nevertheless, there is a strong linear relationship between remote sensing reflectance and the IOPs of the water column across the many ecosystem states and sky conditions measured as part of NAAMES.
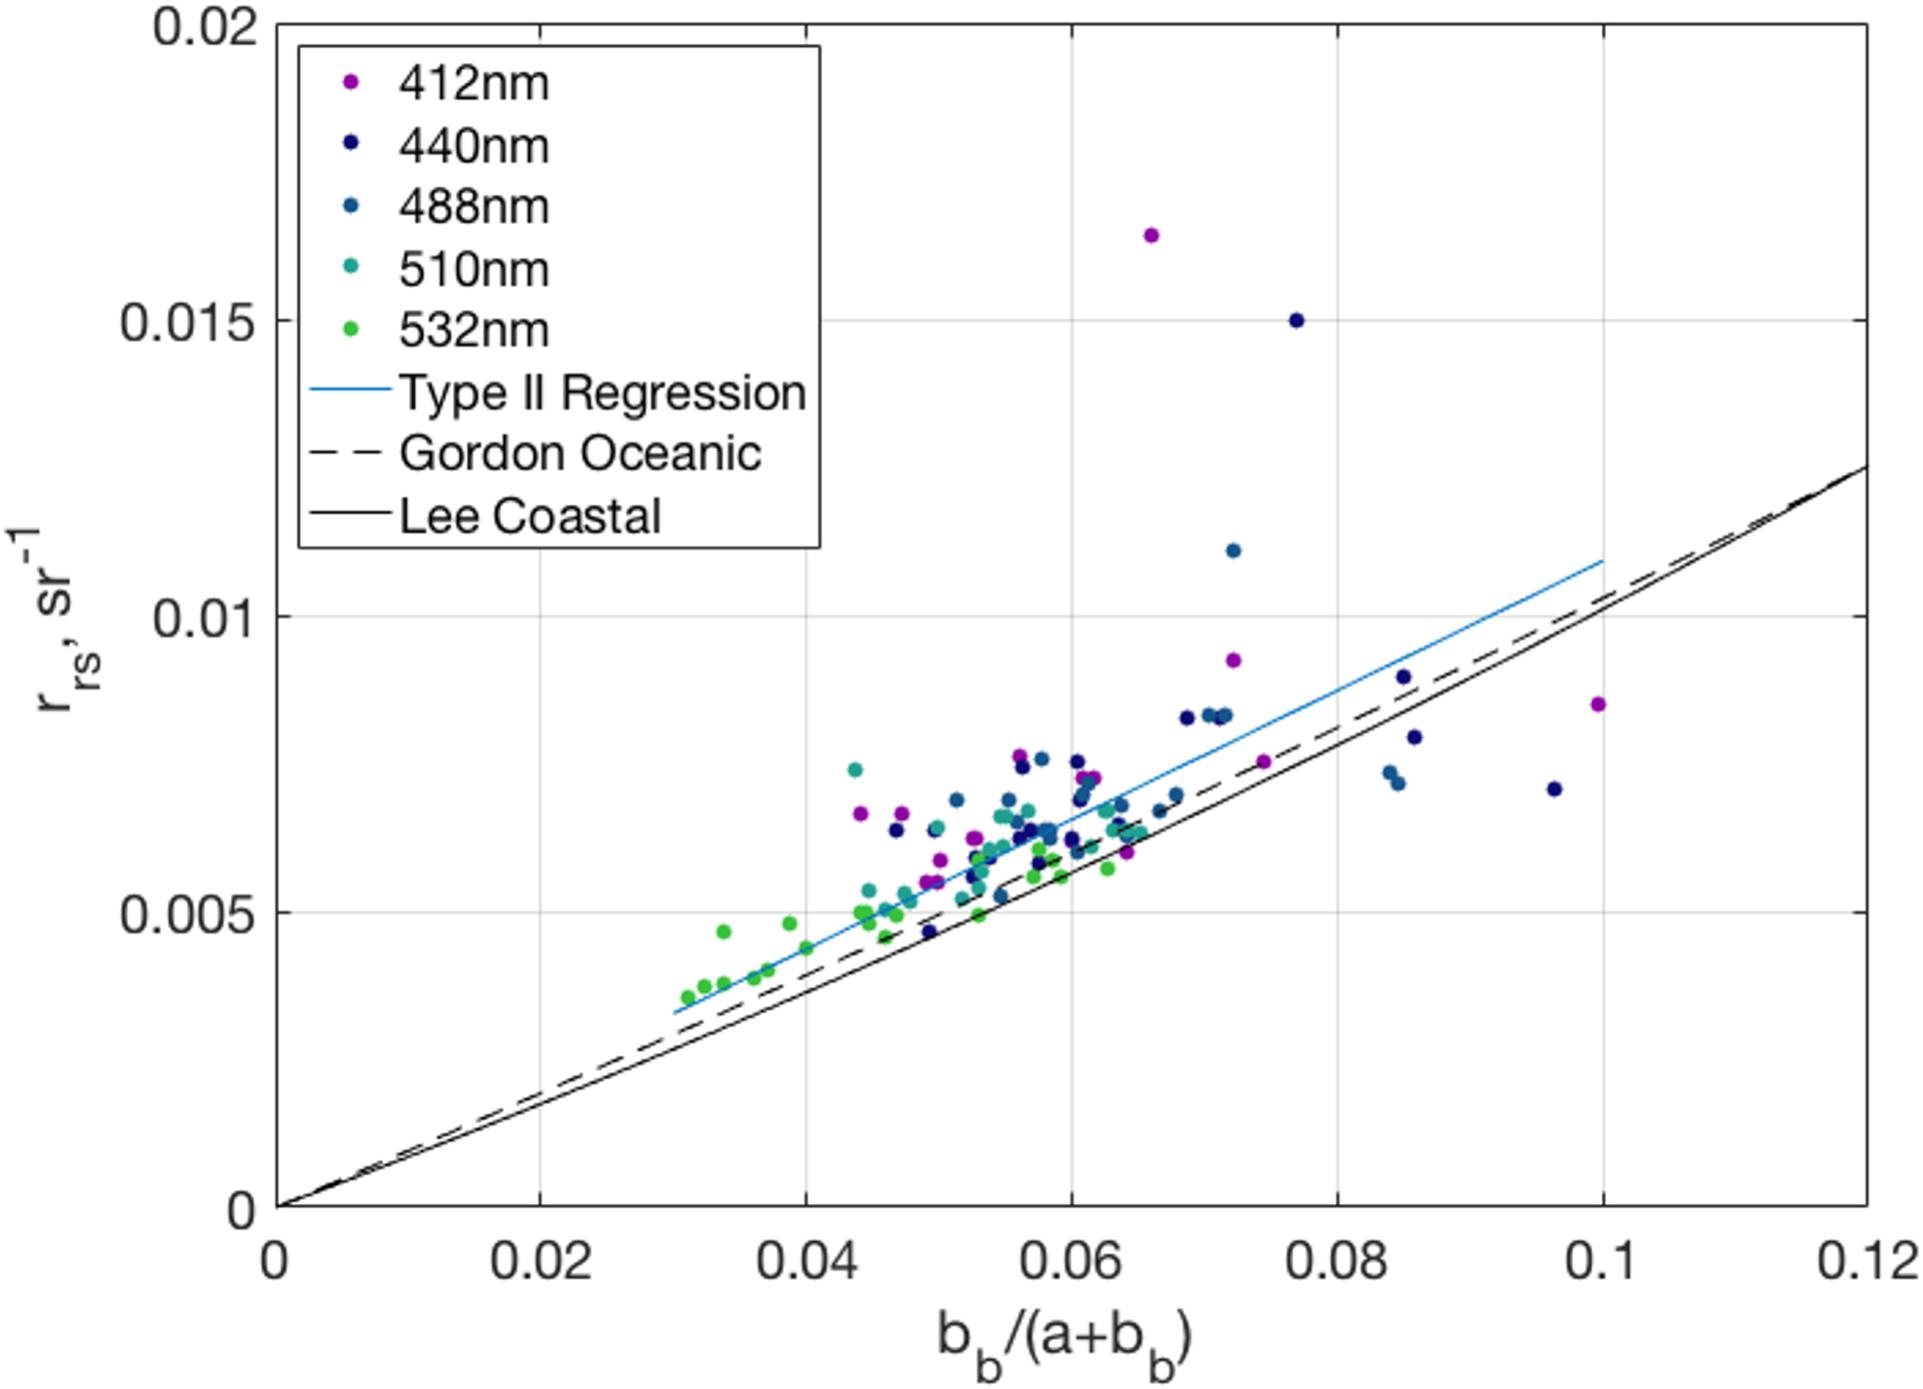
Figure 10. Relationship between observations of remote sensing reflectance and [bb/(a + bb)] at five different wavelengths and their Type II regression line forced through the origin (blue line). Trendlines for the remote sensing reflectance correspond to the Gordon et al. (1988) f/Q open ocean constants (G1 = 0.0949, G2 = 0.0794) from Eq. 11 (dashed line) and Lee et al. (1999) f/Q coastal ocean constants (G1 = 0.084, G2 = 0.17, solid line).
The f/Q parameter may vary with environmental conditions and potentially as a function of wavelength (e.g., Reynolds et al., 2001; Morel et al., 2002; Kostadinov et al., 2007). Figure 11 shows retrievals of f/Q as well as spectrally varying f/Q retrievals from Morel et al. (2002) for the range of conditions found during NAAMES. The magnitude of observed values of f/Q (Figure 11A) is slightly higher than the Morel et al. (2002) modeled values in the blue-green wavelengths and smaller in the red wavelengths, but most wavelengths fall within the modeled range. The larger variations in the longer wavelengths could be caused by higher noise levels for rrs(λ) determinations for these wavelengths as well as transpectral processes not considered here (i.e., chlorophyll fluorescence or Raman scattering, e.g., Westberry et al., 2013).
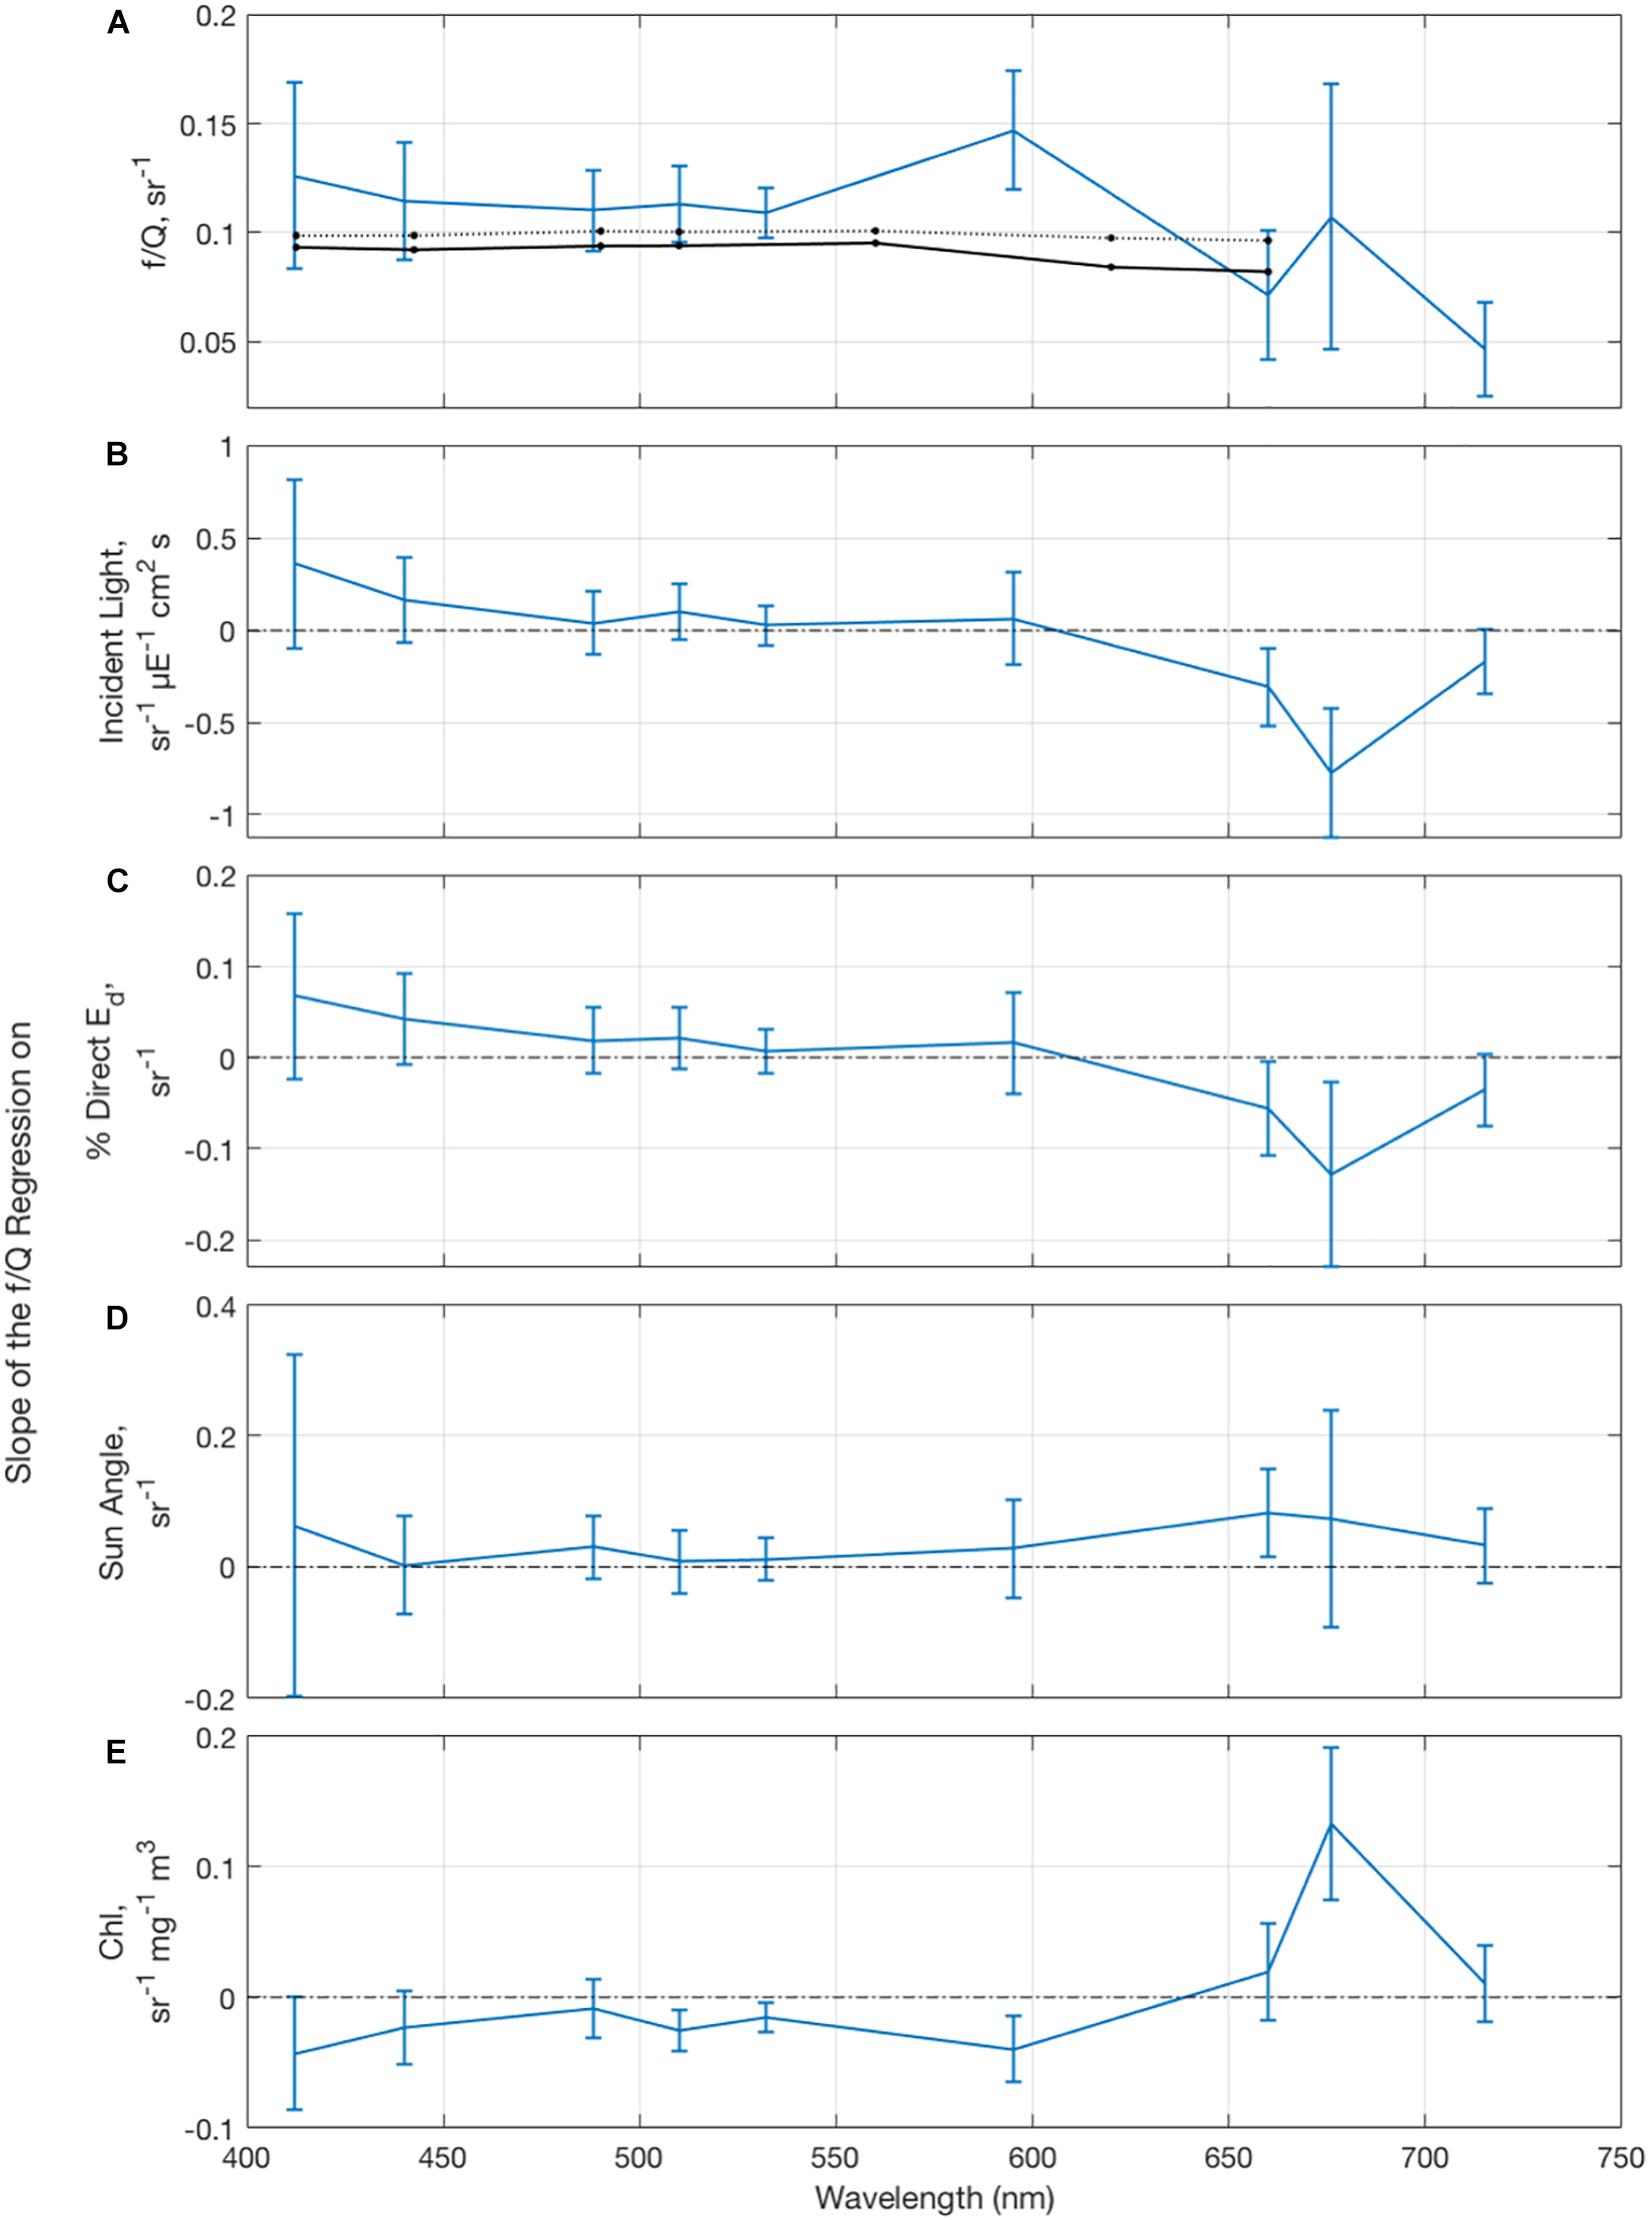
Figure 11. (A) Mean and standard deviation of the f/Q parameter with derived values of the Morel et al. (2002) f/Q as a function of the average Winter Transition and Climax Transition chlorophyll a concentration and solar zenith angles. The dashed and solid lines correspond to Chl = 0.3 and 3 mg m– 3 and sun zenith = 70 and 30°, respectively. Slope of regression of f/Q parameter on (B) incident light flux, (C) percent direct downwelling irradiance relative to total downwelling irradiance, (D) sun angle, measured as 1-cos(theta) on sunny days, defined as % Eddirect > 60%, and (E) chlorophyll concentration.
For the blue to green wavelengths, no significant relations were found between the f/Q parameter and metrics for illumination conditions such as incident light flux, the amount of direct downwelling irradiance relative to the total, or the solar zenith angle on sunny days (Figures 11B–D). Increased chlorophyll concentrations are associated with decreased f/Q in the green wavelengths, likely due to increased multiple scattering by particles (Morel et al., 2002). A positive relationship is found between the f/Q parameter near 683 nm and the chlorophyll concentration (Figure 11E), likely due to chlorophyll fluorescence. Since the f/Q parameter does not statistically depend on lighting conditions such as the fraction of direct to total incident irradiance or the solar zenith angle at shorter wavelengths, the use of a constant f/Q value, which is typical for bio-optical inversions, is valid for this data set.
Performance of Satellite Bio-Optical Algorithms Against the NAAMES Data Set
The performance of five bio-optical models that invert remote sensing reflectance spectra into optical constituents are tested using the NAAMES data set. The OC4v6 (O’Reilly et al., 1998; Werdell and Bailey, 2005) and OC6 (O’Reilly and Werdell, 2019) empirical algorithms use a 4th order polynomial and the maximum value of several blue-to-green band Rrs(λ) ratios to calculate surface chlorophyll concentrations. The Quasi-Analytical Algorithm (QAA Version 6; Lee et al., 2014) uses a combination of empirical, semianalytical, and analytical models in a step-by-step schema to that converts Rrs(λ) to the total absorption and backscattering coefficients, which are then decomposed into phytoplankton absorption, CDM (CDOM + Detrital) absorption, and particulate backscattering. The Garver–Siegel–Maritorena algorithm (GSM; Maritorena et al., 2002, 2010) relates Rrs(λ) to the IOPs just below the sea surface using Gordon et al. (1988), which are then decomposed into phytoplankton absorption, CDM absorption, and particulate backscattering assuming fixed spectral shapes to retrieve values of chlorophyll concentration, aCDM(443) and bbp(443). The GSM model parameters are optimized using a global data set. The Loisel and Stramski algorithm (L&S, Loisel and Stramski, 2000) empirically derives Kd(λ) from Rrs(λ) and inverts both to retrieve the total backscattering and absorption coefficients independently at each wavelength. The performance of the ocean color algorithms is shown in Table 2. Matchups are made between each in situ variable and a corresponding radiometry cast made within 6 h, so one inversion might map to multiple in situ products. Calculations of the bias, the mean absolute error, and the root mean square error were normalized to the interquartile range of each of the observations to more readily compare the different retrievals as errors relative to their respective distributions. Type II linear regressions are used for this analysis.
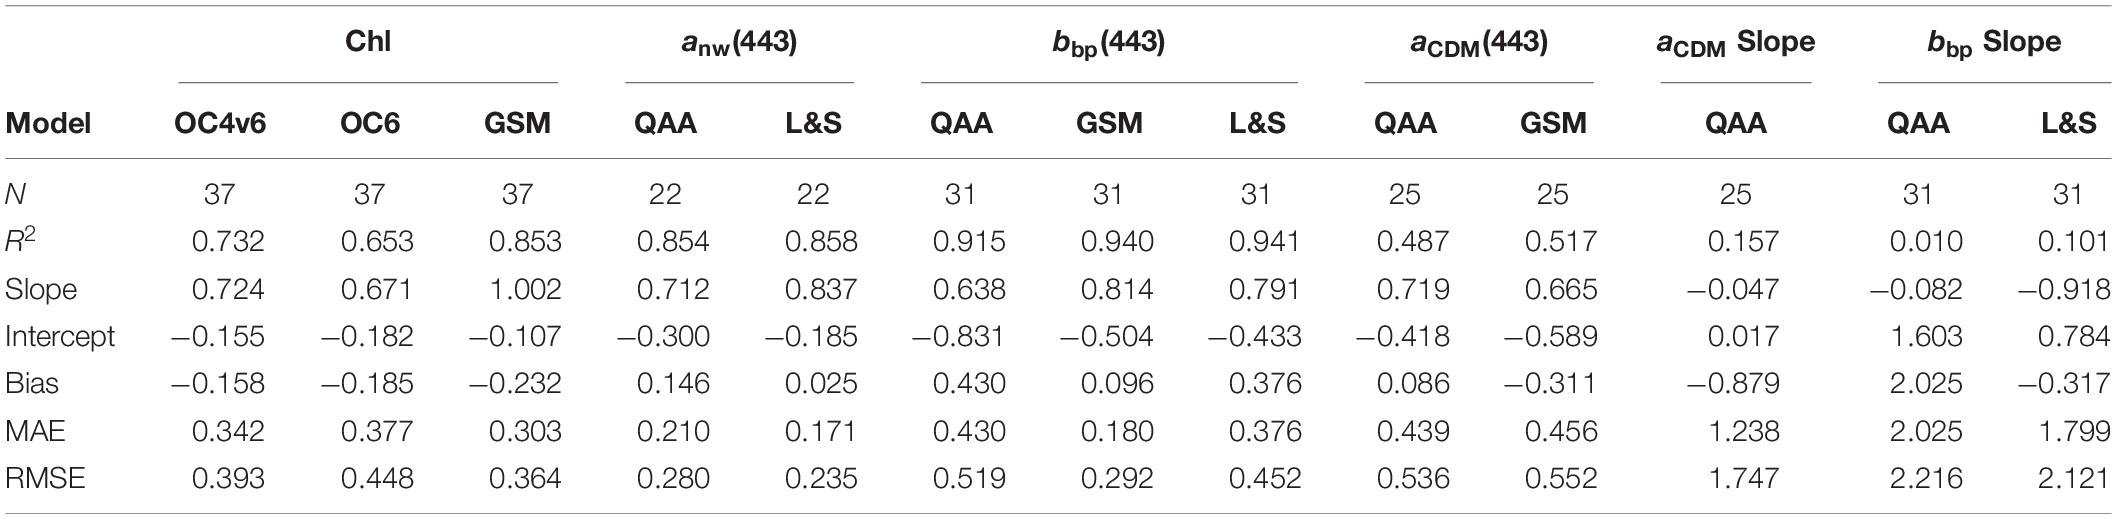
Table 2. Retrieval statistics for the bio-optical ocean color inversion algorithms, each normalized by the interquartile range of the retrieved parameter.
Retrievals of derived chlorophyll concentrations allow for the comparison of empirical and semianalytical algorithms. The OC4v6, OC6, and GSM perform well, with respective R2 values of 0.73, 0.65, and 0.85. Both OC chlorophyll algorithms show slopes considerably less than one, which could be caused by the relatively higher contributions of CDOM absorption to reflectance at lower chlorophyll concentrations. The OC6 shows a larger underestimate of chlorophyll retrievals with a more negative bias and a flatter slope than OC4v6, likely due to the addition of the 412 nm band, which suggests greater sensitivity to CDOM absorption at smaller wavelengths. Semianalytical algorithms such as the GSM account for the contributions of multiple ocean constituents, such as detritus and CDOM, and thus are capable of handling more optically complex environments. The GSM has a near unity slope for the chlorophyll retrievals and the lowest mean absolute and root mean square error values, showing that it is more capable of retrieving Chl across the entire range of NAAMES values, although it does have a larger negative bias than the other chlorophyll algorithms. Of these three algorithms, the GSM performs the best with this data set, signified by the highest R2 value and the smallest mean absolute errors.
Retrievals of the total non-water absorption coefficient at 443 nm, anw(443), are very good using the QAA and L&S algorithms with R2 values of 0.85 and 0.86, respectively. The L&S has a smaller normalized bias (−0.025) and mean absolute error (0.17), while the QAA has a bias of 0.15 and a mean absolute error of 0.21. The magnitude of particulate backscattering at 443 nm was very well retrieved by all three semianalytical algorithms, with R2 values of 0.92, 0.94, and 0.94 for the QAA, GSM, and L&S, respectively. The GSM on average showed the smallest errors, with a bias value of 0.096 and a mean absolute error value of 0.18. The L&S and QAA both overestimated the contribution of bbp(λ) to ocean color across all matchups, with mean absolute errors of 0.38 and 0.43, respectively. Retrieval performances of CDM absorption at 443 nm are considerably worse on average than for the other IOP quantities, with R2 values of 0.49 for the QAA and 0.52 for the GSM. This may be due to the small dynamic range in CDM absorption in this data set relative to the global (NOMAD) data set (Figure 3).
The performance of all of the algorithms for retrieving spectral IOP shapes is much worse than retrievals of their magnitudes (Table 2). Errors in the acdm slope measured by the QAA are heavily underestimated, with a bias of −0.88 and a mean absolute error of 1.24, which has implications for the relative importance of non-algal constituents to absorption in the UV and blue wavelengths. This could partly be caused by the use of the ratio of rrs(443) to rrs(555) in the denominator of its empirical calculation of the slope, which would predict a slope decrease in clearer waters (Lee et al., 2014). Variability in the retrievals could also come from parameterizing acdm slopes as an exponential function, which often does not accurately represent the spectral shape and is highly sensitive to the choice of wavelength ranges (Twardowski et al., 2004). The errors of retrievals of the particulate backscattering slope are also large, with normalized errors of 2.03 and 1.80 for the QAA and L&S, respectively.
The normalization of the bias, mean absolute error, and RMSE to the distribution of each parameter allows for their intercomparison across the different bio-optical products for the NAAMES dataset. Typically, the initial retrievals of bulk IOPs perform the best. Across all IOP magnitudes measured during the NAAMES project, non-water absorption and particulate backscattering were the most accurately retrieved. Bio-optical retrievals of the chlorophyll concentration also showed small errors, though the semi-analytical GSM algorithm performed better than the OC algorithms (as also noted in the global analysis of Siegel et al., 2013). CDM absorption showed the most variable retrievals of the IOP magnitudes, as it also involves the accurate retrievals of more optical constituents as sub-components of total absorption. The retrievals of the spectral shapes of the IOPs performed the worst, with relative errors between 3 and 10 times higher than the IOP magnitudes.
While the suite of current satellite ocean models performs reasonably well for the NAAMES dataset, there are still several sources of uncertainty that need to be considered. One potential source comes from instrument stability and calibration issues. Observations were separated on average by 6 months to a year between cruises, each focusing on a different phase of the bloom with a large dynamic range of optical conditions. Further, more optical casts were conducted in the second and third NAAMES cruises, which could lead to artificially inflated observations at the height and decline of the bloom as opposed to during the Winter deep mixing months. Additionally, weather conditions and equipment failure limited optical profiles to the Subtropical and Sargasso stations during the Accumulation Phase measured as part of NAAMES 4. As shown in Figure 7, small variations in time and space between observations can also contribute to significant variability between optical matchups, as radiometry measurements were made at solar noon at each station, while discrete observations of in-water constituents were made using the CTD Rosette at sunrise and in the early afternoon, often with a 4–6 h time difference.
The smaller dynamic range of observed values for the NAAMES dataset relative to global distributions may also have contributed to larger performance errors. Surface chlorophyll concentrations for NAAMES varied by 1.5 orders of magnitude, compared to the nearly 4 orders of magnitude found in global observations used bio-optical models (e.g., Werdell and Bailey, 2005; O’Reilly and Werdell, 2019). Global algorithms are optimized to capture first-order changes in ocean color, which often implies that changes in optical constituents are related to changes in chlorophyll concentrations. Regional studies show much more variation from marine biological processes, which may not be captured in global algorithms.
One last source for model performance variability involves comparisons of retrieved and observed spectral shapes. The algorithm-retrieved slopes of both CDM absorption and particulate backscattering are inconsistent with field observations in the NAAMES dataset. The GSM makes the a priori assumption of fixed IOP spectral slopes, while the QAA uses empirical relationships between reflectance ratios using global datasets. The L&S algorithm retrieves optical characteristics at each wavelength independently and therefore make no assumption about the spectral shapes. However, none of these methods accurately retrieved the slopes measured during the NAAMES project. Clearly future work is necessary to help improve performance of IOP spectral shape algorithms.
Conclusion
An analysis of the in-water constituents of the NAAMES project and their optical properties allows for the characterization of ocean color and its drivers over the course of the North Atlantic phytoplankton bloom cycle. Relating optical constituents to their inherent optical properties revealed that CDOM drives absorption signals in the UV, while phytoplankton drives absorption variability in the blue wavelengths. Correlations between inherent and apparent optical properties show that absorption signals drive changes in ocean color in the UV and blue wavelengths, while particulate backscattering drives ocean color variability in the green wavelengths. Analysis of a recently storm-mixed station during the peak of the spring bloom showed up to fourfold changes in the magnitude of phytoplankton IOPs in the top 30 m as well as subsequent decreases in the blue wavelengths of remote sensing reflectance and increases in the green wavelengths. Matchups between remote sensing reflectance and measurements of bb(λ)/[a(λ) + bb(λ)] demonstrate the quasi-inherency of reflectance in this study region within experimental uncertainties, which has implications for the improvement of bio-optical algorithms to retrieve the IOPs of optical constituents from satellite remote sensing. Although there is significant room for improving retrievals of spectral shapes, the performance of a variety of bio-optical algorithms show their relative capabilities of retrieving the magnitudes of optical constituents through IOP retrievals.
Data Availability Statement
The datasets generated in this study can be found in online repositories. The names of the repository/repositories and accession number(s) can be found below: https://seabass.gsfc.nasa.gov/naames.
Author Contributions
JA led the analysis and writing of this manuscript. DS, NN, and SH provided comments, data, edits, and support. All authors contributed to the article and approved the submitted version.
Funding
JA was supported by a NASA Earth and Space Science Fellowship (grant number NNX15AN87H S01). Support for this work came from the National Aeronautics and Space Administration (NASA) to DS, NN, and SH as part of the North Atlantic Aerosols and Marine Ecosystems Study (NAAMES, grant number NNX15AE72G) field campaign.
Conflict of Interest
The authors declare that the research was conducted in the absence of any commercial or financial relationships that could be construed as a potential conflict of interest.
Acknowledgments
We wish to thank Mike Behrenfeld for his work as Chief Scientist, the captains and crew of R/V Atlantis, and all scientists and technicians who helped with sample collection during the NAAMES cruises.
Supplementary Material
The Supplementary Material for this article can be found online at: https://www.frontiersin.org/articles/10.3389/fmars.2020.567007/full#supplementary-material
References
Barron, R. K., Siegel, D. A., and Guillocheau, N. (2014). Evaluating the importance of phytoplankton community structure to the optical properties of the Santa Barbara Channel, California. Limnol. Oceanogr. 59, 927–946. doi: 10.4319/lo.2014.59.3.0927
Behrenfeld, M. J., and Boss, E. S. (2018). Student’s tutorial on bloom hypotheses in the context of phytoplankton annual cycles. Glob. Change Biol. 24, 55–77. doi: 10.1111/gcb.13858
Behrenfeld, M. J., Boss, E. S., Siegel, D. A., and Shea, D. M. (2005). Carbon-based ocean productivity and phytoplankton physiology from space. Glob. Biogeochem. Cycles 19:GB1006. doi: 10.1029/2004GB002299
Behrenfeld, M. J., Doney, S. C., Lima, I., Boss, E. S., and Siegel, D. A. (2013). Annual cycles of ecological disturbance and recovery underlying the subarctic Atlantic spring plankton bloom. Glob. Biogeochem. Cycles 27, 526–540. doi: 10.1002/gbc.20050
Behrenfeld, M. J., Moore, R. H., Hostetler, C. A., Graff, J., Gaube, P., Russell, L. M., et al. (2019). The North Atlantic Aerosol and Marine Ecosystem Study (NAAMES): Science Motive and Mission Overview. Front. Mar. Sci. 6:122. doi: 10.3389/fmars.2019.00122
Behrenfeld, M. J., O’Malley, R. T., Siegel, D. A., McClain, C. R., Sarmiento, J. L., Feldman, G. C., et al. (2006). Climate-driven trends in contemporary ocean productivity. Nature 444, 752–755. doi: 10.1038/nature05317
Bidigare, R. R., Ondrusek, M. E., Morrow, J. H., and Kiefer, D. A., (1990). “In-vivo absorption properties of algal pigments,” Proceedings of the SPIE 1302, Ocean Optics X, eds R. W. Spinrad (Washington, DC: SPIE)290.
Boss, E. S., Haëntjens, N., Westberry, T. K., Karp-Boss, L., and Slade, W. H. (2018). Validation of the particle size distribution obtained with the laser in-situ scattering and transmission (LISST) meter in flow-through mode. Opt. Express 26, 11125. doi: 10.1364/oe.26.011125
Boss, E. S., and Pegau, W. S. (2001). Relationship of light scattering at an angle in the backward direction to the backscattering coefficient. Appl. Opt. 40:5503. doi: 10.1364/AO.40.005503
Boss, E. S., Twardowski, M. S., and Herring, S. (2001). Shape of the particulate beam attenuation spectrum and its inversion to obtain the shape of the particulate size distribution. Appl. Opt. 40:4885. doi: 10.1364/AO.40.004885
Bricaud, A., and Morel, A. (1986). Light attenuation and scattering by phytoplanktonic cells: a theoretical modeling. Appl. Opt. 25:571. doi: 10.1364/AO.25.000571
Bricaud, A., Morel, A., and Prieur, L. (1981). Absorption by dissolved organic matter of the sea (yellow substance) in the UV and visible domains1. Limnol. Oceanogr. 26, 43–53. doi: 10.4319/lo.1981.26.1.0043
Carder, K. L., Hawes, S. K., Baker, K. A., Smith, R. C., Steward, R. G., and Mitchell, B. G. (1991). Reflectance model for quantifying chlorophyll a in the presence of productivity degradation products. J. Geophys. Res. 96:20599. doi: 10.1029/91JC02117
Della Penna, A., and Gaube, P. (2019). Overview of (Sub)mesoscale Ocean Dynamics for the NAAMES Field Program. Front. Mar. Sci. 6:384. doi: 10.3389/fmars.2019.00384
Gordon, H. R. (1989). Can the Lambert-Beer law be applied to the diffuse attenuation coefficient of ocean water? Limnol. Oceanogr. 34, 1389–1409. doi: 10.4319/lo.1989.34.8.1389
Gordon, H. R., Brown, O. B., Evans, R. H., Brown, J. W., Smith, R. C., Baker, K. S., et al. (1988). A semianalytic radiance model of ocean color. J. Geophys. Res. 93:10909. doi: 10.1029/JD093iD09p10909
Graff, J. R., and Behrenfeld, M. J. (2018). Photoacclimation responses in subarctic atlantic phytoplankton following a natural mixing-restratification event. Front. Mar. Sci. 5:209. doi: 10.3389/fmars.2018.00209
Guillocheau, N. (2003). β-Correction Experiment Report. Santa Barbara, CA: University of California.
Hooker, S. B., Clementson, L., Thomas, C. S., Schlüter, L., Allerup, M., Ras, J., et al. (2012). The fifth SeaWiFS HPLC Analysis Round-Robin Experiment (SeaHARRE–5). Maryland: NASA.
IOCCG (2006). “Remote sensing of inherent optical properties: fundamentals, tests of algorithms, and applications,” in Reports of the International Ocean-Colour Coordinating Group, ed. Z.-P. Lee (Dartmouth: IOCCG).
Kirk, J. T. O. (1983). Light and Photosynthesis in Aquatic Ecosystems. New York, NY: Cambridge University Press.
Kostadinov, T. S., Siegel, D. A., and Maritorena, S. (2009). Retrieval of the particle size distribution from satellite ocean color observations. J. Geophys. Res. 114:C09015. doi: 10.1029/2009JC005303
Kostadinov, T. S., Siegel, D. A., Maritorena, S., and Guillocheau, N. (2007). Ocean color observations and modeling for an optically complex site: Santa Barbara Channel, California, USA. J. Geophys. Res. 112:C07011. doi: 10.1029/2006JC003526
Kramer, S. J., Siegel, D. A., and Graff, J. R. (2020). Phytoplankton community composition determined from co-variability among phytoplankton pigments from the NAAMES field campaign. Front. Mar. Sci. 7. doi: 10.3389/fmars.2020.00215
Lee, Z., Carder, K. L., Mobley, C. D., Steward, R. G., and Patch, J. S. (1999). Hyperspectral remote sensing for shallow waters. 2. Deriving bottom depths and water properties by optimization. Appl. Opt. 38, 3831–3843. doi: 10.1364/AO.38.003831
Lee, Z., Wei, J., Voss, K., Lewis, M., Bricaud, A., and Huot, Y. (2015). Hyperspectral absorption coefficient of “pure” seawater in the range of 350–550 nm inverted from remote sensing reflectance. Appl. Opt. 54:546. doi: 10.1364/ao.54.000546
Lee, Z. P., Lubac, B., Werdell, P. J., and Arnone, R. (2014). An Update of the Quasi-Analytical Algorithm (QAA_v6). Technical report: International Ocean Colour Coordinating Group (IOCCG). Dartmouth: IOCCG.
Loisel, H., and Stramski, D. (2000). Estimation of the inherent optical properties of natural waters from the irradiance attenuation coefficient and reflectance in the presence of Raman scattering. Appl. Opt. 39, 3001–3011. doi: 10.1364/ao.39.003001
Loisel, H., Stramski, D., Mitchell, B. G., Fell, F., Fournier-Sicre, V., Lemasle, B., et al. (2001). Comparison of the ocean inherent optical properties obtained from measurements and inverse modeling. Appl. Opt. 40:2384. doi: 10.1364/AO.40.002384
Mannino, A., Novak, M. G., Nelson, N. B., Belz, M., Berthon, J.-F., Blough, N. V., et al. (2019). “Measurement protocol of absorption by chromophoric dissolved organic matter (CDOM) and other dissolved materials, In inherent optical property measurements and protocols: absorption coefficient,” in IOCCG Ocean Optics and Biogeochemistry Protocols for Satellite Ocean Colour Sensor Validation, eds A. Mannino and M. G. Novak (Dartmouth: IOCCG).
Maritorena, S., d’Andon, O. H. F., Mangin, A., and Siegel, D. A. (2010). Merged satellite ocean color data products using a bio-optical model: Characteristics, benefits and issues. Remote Sens. Environ. 114, 1791–1804. doi: 10.1016/j.rse.2010.04.002
Maritorena, S., Siegel, D. A., and Peterson, A. R. (2002). Optimization of a semianalytical ocean color model for global-scale applications. Appl. Opt. 41:2705. doi: 10.1364/AO.41.002705
McClain, C. R., Feldman, G. C., and Hooker, S. B. (2004). An overview of the SeaWiFS project and strategies for producing a climate research quality global ocean bio-optical time series. Deep Sea Res. Part II Top. Stud. Oceanogr. 51, 5–42. doi: 10.1016/j.dsr2.2003.11.001
Mitchell, B. G., Kahru, M., Wieland, J., and Stramska, M. (2000). “Determination of spectral absorption coefficients of particles, dissolved material, and phytoplankton for discrete water samples,” in Ocean optics protocols for satellite ocean color sensor validation, revision 2, NASA Technical Memorandum 2000- 209966, eds F. Fargion and J. L. Mueller (Maryland: NASA Goddard Space Flight Center).
Mobley, C. D. (1994). Light and Water: Radiative Transfer in Natural Waters. New York, NY: Academic.
Moore, C. C., Zaneveld, J. R. V., and Kitchen, J. C. (1992). Preliminary results from an in-situ spectral absorption meter. Proc. SPIE 1750, Ocean Optics XI. doi: 10.1117/12.140660
Moran, S., Charette, M., Pike, S., and Wicklund, C. (1999). Differences in seawater particulate organic carbon concentration in samples collected using small- and large-volume methods: the importance of DOC adsorption to the filter blank. Mar. Chem. 67, 33–42. doi: 10.1016/S0304-4203(99)00047-X
Morel, A., Antoine, D., and Gentili, B. (2002). Bidirectional reflectance of oceanic waters: accounting for Raman emission and varying particle scattering phase function. Appl. Opt. 41, 6289. doi: 10.1364/AO.41.006289
Morel, A., and Maritorena, S. (2001). Bio-optical properties of oceanic waters: a reappraisal. J. Geophys. Res. 106, 7163–7180. doi: 10.1029/2000JC000319
Morison, F., Harvey, E., Franzè, G., and Menden-Deuer, S. (2019). Storm-induced predator-prey decoupling promotes springtime accumulation of north atlantic phytoplankton. Front. Mar. Sci. 6:608. doi: 10.3389/fmars.2019.00608
Morrison, J. R., and Nelson, N. B. (2004). Seasonal cycle of phytoplankton UV absorption at the Bermuda Atlantic Time-series Study (BATS) site. Limnol. Oceanogr. 49, 215–224. doi: 10.4319/lo.2004.49.1.0215
Morrow, J. H., Booth, C. R., Lind, R. N., and Hooker, S. B. (2010). “The compact optical profiling system (C-OPS),” in Advances in Measuring the Apparent Optical Properties (AOPs) of Optically Complex Waters, eds H. J. Morrow, S. B. Hooker, C.R. Booth, G. Bernhard, R. N. Lind, and J. W. Brown (Memo: NASA Tech).
Nelson, N. B., and Siegel, D. A. (2013). The global distribution and dynamics of chromophoric dissolved organic matter. Annu. Rev. Mar. Sci. 5, 447–476. doi: 10.1146/annurev-marine-120710-100751
Nelson, N. B., Siegel, D. A., Carlson, C. A., Swan, C., Smethie, W. M., and Khatiwala, S. (2007). Hydrography of chromophoric dissolved organic matter in the North Atlantic. Deep Sea Res. Part I Oceanogr. Res. Papers 54, 710–731. doi: 10.1016/j.dsr.2007.02.006
Nelson, N. B., Siegel, D. A., and Michaels, A. F. (1998). Seasonal dynamics of colored dissolved material in the Sargasso Sea. Deep Sea Res. Part I Oceanogr. Res. Papers 45, 931–957. doi: 10.1016/S0967-0637(97)00106-104
O’Reilly, J. E., Maritorena, S., Mitchell, B. G., Siegel, D. A., Carder, K. L., Garver, S. A., et al. (1998). Ocean color chlorophyll algorithms for SeaWiFS. J. Geophys. Res. 103, 24937–24953. doi: 10.1029/98JC02160
O’Reilly, J. E., and Werdell, P. J. (2019). Chlorophyll algorithms for ocean color sensors - OC4, OC5 & OC6. Remote Sens. Environ. 229, 32–47. doi: 10.1016/j.rse.2019.04.021
Petzold, T. J. (1972). Volume scattering functions for selected ocean waters, Tech. rep. SIO 72-78 San Diego, CA: Scripps Institution of Oceanography.
Pope, R. M., and Fry, E. S. (1997). Absorption spectrum (380-700 nm) of pure water. IIntegrating, I., cavity measurements. Appl. Opt. 36, 8710–8723. doi: 10.1364/AO.36.008710
Reynolds, R. A., Stramski, D., and Mitchell, B. G. (2001). A chlorophyll-dependent semianalytical reflectance model derived from field measurements of absorption and backscattering coefficients within the Southern Ocean. J. Geophys. Res. 106, 7125–7138. doi: 10.1029/1999JC000311
Roesler, C. S., Perry, M. J., and Carder, K. L. (1989). Modeling in situ phytoplankton absorption from total absorption spectra in productive inland marine waters. Limnol. Oceanogr. 34, 1510–1523. doi: 10.4319/lo.1989.34.8.1510
Siegel, D. A., Behrenfeld, M. J., Maritorena, S., McClain, C. R., Antoine, D., Bailey, S. W., et al. (2013). Regional to global assessments of phytoplankton dynamics from the SeaWiFS mission. Remote Sensing of Environment 135, 77–91. doi: 10.1016/j.rse.2013.03.025
Siegel, D. A., Doney, S. C., and Yoder, J. A. (2002). The north atlantic spring phytoplankton bloom and sverdrup’s critical depth hypothesis. Science 296, 730–733. doi: 10.1126/science.1069174
Siegel, D. A., Maritorena, S., Nelson, N. B., and Behrenfeld, M. J. (2005). Independence and interdependencies among global ocean color properties; reassessing the bio-optical assumption. J. Geophys. Res. 110, C07011. doi: 10.1029/2004JC002527
Siegel, D. A., Michaels, A. F., Sorensen, J. C., O’Brien, M. C., and Hammer, M. A. (1995). Seasonal variability of light availability and utilization in the Sargasso Sea. J. Geophys. Res. 100, 8695–8713. doi: 10.1029/95JC00447
Slade, W. H., and Boss, E. S. (2015). Spectral attenuation and backscattering as indicators of average particle size. Appl. Opt. 54, 7264. doi: 10.1364/AO.54.007264
Slade, W. H., Boss, E. S., Dall’olmo, G., Langner, M. R., Loftin, J., Behrenfeld, M. J., et al. (2010). Underway and moored methods for improving accuracy in measurement of spectral particulate absorption and attenuation. J. Atmos. Ocean. Technol. 27, 1733–1746. doi: 10.1175/2010JTECHO755.1
Smith, R. C., and Baker, K. S. (1978). The bio-optical state of ocean waters and remote sensing. Limnol. Oceanogr. 23, 247–259. doi: 10.4319/lo.1978.23.2.0247
Sverdrup, H. U. (1953). On conditions for the vernal blooming of phytoplankton. ICES J. Mar. Sci. 18, 287–295. doi: 10.1093/icesjms/18.3.287
Swan, C. M., Nelson, N. B., Siegel, D. A., and Kostadinov, T. S. (2012). The effect of surface irradiance on the absorption spectrum of chromophoric dissolved organic matter in the global ocean. Deep Sea Res. Part I Oceanogr. Res. Papers 63, 52–64. doi: 10.1016/j.dsr.2012.01.008
Twardowski, M. S., Boss, E., Sullivan, J. M., and Donaghay, P. L. (2004). Modeling the spectral shape of absorption by chromophoric dissolved organic matter. Mar. Chem. 89, 69–88. doi: 10.1016/j.marchem.2004.02.008
Twardowski, M. S., Boss, E. S., Macdonald, J. B., Pegau, W. S., Barnard, A. H., and Zaneveld, J. R. V. (2001). A model for estimating bulk refractive index from the optical backscattering ratio and the implications for understanding particle composition in case I and case II waters. J. Geophys. Res. 106, 14129. doi: 10.1029/2000JC000404
Van Heukelem, L., and Hooker, S. B. (2011). “The importance of a quality assurance plan for method validation and minimizing uncertainties in the HPLC analysis of phytoplankton pigments,” in Phytoplankton Pigments: Characterization, Chemotaxonomy, and Applications in Oceanography (Cambridge: Cambridge University Press), 195–242. doi: 10.1017/cbo9780511732263.009
Werdell, P. J., and Bailey, S. W. (2005). An improved bio-optical data set for ocean color algorithm development and satellite data product validation. Remote Sens. Environ. 98, 122–140. doi: 10.1016/j.rse.2005.07.001
Werdell, P. J., Behrenfeld, M. J., Bontempi, P. S., Boss, E., Cairns, B., Davis, G. T., et al. (2019). The plankton, aerosol, cloud, ocean ecosystem mission: status, science, advances. Bull. Am. Meteorol. Soc. 100, 1775–1794. doi: 10.1175/BAMS-D-18-0056.1
Werdell, P. J., McKinna, L. I. W., Boss, E., Ackleson, S. G., Craig, S. E., Gregg, W. W., et al. (2018). An overview of approaches and challenges for retrieving marine inherent optical properties from ocean color remote sensing. Prog. Oceanogr. 160, 186–212. doi: 10.1016/j.pocean.2018.01.001
Westberry, T. K., Behrenfeld, M. J., Siegel, D. A., and Boss, E. S. (2008). Carbon-based primary productivity modeling with vertically resolved photoacclimation. Glob. Biogeochem. Cycles 22:GB2024. doi: 10.1029/2007GB003078
Westberry, T. K., Boss, E., and Lee, Z. (2013). Influence of Raman scattering on ocean color inversion models. Appl. Opt. 52:5552. doi: 10.1364/AO.52.005552
Westberry, T. K., Schultz, P., Behrenfeld, M. J., Dunne, J. P., Hiscock, M. R., Maritorena, S., et al. (2016). Annual cycles of phytoplankton biomass in the subarctic Atlantic and Pacific Ocean. Glob. Biogeochem. Cycles 30, 175–190. doi: 10.1002/2015GB005276
Whitmire, A. L., Boss, E. S., Cowles, T. J., and Pegau, W. S. (2007). Spectral variability of the particulate backscattering ratio. Opt. Express 15, 7019–7031. doi: 10.1364/oe.15.007019
Keywords: North Atlantic Aerosols and Marine Ecosystems Study, ocean color, ocean optics, profiles, field campaign
Citation: Allen JG, Siegel DA, Nelson NB and Halewood S (2020) Controls on Ocean Color Spectra Observed During the North Atlantic Aerosols and Marine Ecosystems Study (NAAMES). Front. Mar. Sci. 7:567007. doi: 10.3389/fmars.2020.567007
Received: 29 May 2020; Accepted: 20 August 2020;
Published: 10 September 2020.
Edited by:
Sarah D. Brooks, Texas A&M University, United StatesReviewed by:
Oscar Schofield, Rutgers, The State University of New Jersey, United StatesDavid McKee, University of Strathclyde, United Kingdom
Copyright © 2020 Allen, Siegel, Nelson and Halewood. This is an open-access article distributed under the terms of the Creative Commons Attribution License (CC BY). The use, distribution or reproduction in other forums is permitted, provided the original author(s) and the copyright owner(s) are credited and that the original publication in this journal is cited, in accordance with accepted academic practice. No use, distribution or reproduction is permitted which does not comply with these terms.
*Correspondence: James G. Allen, jgallen@hawaii.edu