Effects of Direct Contact Condensation on Flow Characteristics of Natural Circulation System at Low Pressure
 Jianchuang Sun
 Xu Ran2
 - 1Fundamental Science on Nuclear Safety and Simulation Technology Laboratory, Harbin Engineering University, Harbin, China
- 2Science and Technology on Reactor System Design Technology Laboratory, Nuclear Power Institute of China, Chengdu, China
Direct contact condensation (DCC) as a complex thermal-hydraulic phenomenon has been the subject of a great deal of research under forced flow conditions. It is an interesting challenge to study the phenomenon in a natural circulation system (NCS). In this paper, the flow behaviors along with DCC phenomena were experimentally investigated by a visualization method in an NCS at low pressure. Moreover, the influence of initial parameters including heat flux, inlet temperature and resistance of the heated section on the NCS was analyzed in detail. The experimental results revealed that two types of DCC phenomena were found in the NCS. When Type I DCC occurs, the interface wave will be formed due to the hydraulic jump caused by the reverse flow of subcooled water. The interface wave easily contributes to the occurrence of Type II DCC due to the Kelvin-Helmholtz instability. In addition, the NCS tends to be more unstable with the increase in the heat flux or the inlet resistance. The influence of inlet temperature on the flow rate should comprehensively consider the changes of outlet parameters and subcooled degree of the steam and the subcooled water.
Introduction
Direct contact condensation (DCC) is a common and important thermal-hydraulic phenomenon where the saturated steam is condensed on a subcooled water interface. It can appear in Light Water Rectors (LWRs) during a postulated Loss of Coolant Accident (LOCA) (Park et al., 2009) or some passive natural circulation safety systems in Floating Nuclear Power Plants (FNPPs) (Sun et al., 2020). As DCC phenomena occur, the steam-water interface is extremely unstable because of the violent condensation. Once the steam is entrapped by the subcooled water and forms a steam slug, the condensation induced water hammer (CIWH) may occur due to rapid condensation of the steam (Urban and Schlüter, 2014; Datta et al., 2016). The pressure surge caused by CIWH can damage the pipelines and related components. In addition, flow instability may additionally occur if the DCC phenomenon occurs in an NCS (Sun et al., 2020).
A great deal of theoretical and experimental research on these DCC problems has been undertaken by scholars. Research on DCC focuses on the co-current or counter-current of steam and subcooled water under forced flow conditions. Chu et al. (2000) obtained the interface condensation heat transfer coefficient (HTC) for countercurrent stratified smooth flow. Lee et al. (2006) experimentally studied the interface condensation for stratified wavy flow by analyzing 105 local interface condensation HTCs. Štrubelj et al. (2010) numerically modeled with three-dimensional two-fluid models based on the condensation-induced water hammer experiments performed on the PMK-2 device. Datta et al. (2018) used the volume of fluid method to directly simulate the DCC at the phase interface. The simulation results showed that the interface condensation rate increased by the increase in the degree of water subcooled. The similar result was also obtained by Li et al. (2017) in a tee junction. Based on a stratified co-current two-phase flow, Ceuca and Laurinavicius (2016) found that even for phase inlet velocities corresponding to a laminar flow the liquid flow becomes turbulent because of an eddy-like structure.
After the Fukushima nuclear accident, the passive safety design principles are required and indispensable for new-generation advanced reactors. Natural circulation systems, as a remarkable component of passive safety systems, have been widely applied in nuclear power plants (NPPs) as a result of their simplicity and inherent safety (Wu et al., 2015). With the development of NPPs tending to integration and miniaturization, the structural arrangement of NCS may be different to adapt to different application environments.
The performance of NCSs has been extensively studied by many scholars across the world. In general, the heat source of a NCS is placed vertically, which is conducive to the stable startup of natural circulation (Vijayan et al., 2007). The riser, connecting the outlet of the heater and the inlet of cooler, is adopted to improve the flow rate under two-phase conditions. Such NCSs are commonly adopted in the NPPs, such as Novel Modular Reactors (NMRs) (Singh et al., 2017), Passive Containment Cooling Systems (PCCSs) (Guo et al., 2017; Hou et al., 2017), and others (Park et al., 2007; Chen et al., 2013; Jiang et al., 2018). Sometimes the heat source is horizontally placed. This type of NCS is common in the thermosyphon loops for solar energy application (Gima et al., 2005; Tecchio et al., 2017). For a two-phase NCS, flow stability as a focus issue attracted sufficient attention from scholars for engineering applications, especially at low pressure. The research on flow instability of NCS mainly includes density wave oscillation (Su et al., 2002; Furuya et al., 2005), flashing induced instability (Shi and Ishii, 2017), geysering (Tong et al., 2014), etc.
However, for some passive natural circulation safety systems in FNPPs, to further simplify the system structure, the ocean is used as the heat sink of NCSs. The heat source of an NCS is connected to the heat sink by a horizontal pipe rather than a riser. In addition, when the NCS is operating under two-phase conditions, the steam generated in the heat source will inevitably contact the subcooled seawater, which results in the DCC phenomenon in the NCS. When the steam is entrapped by the subcooled water, it may cause CIWH in the pipe. The occurrence of a CIWH event can result in flow instability by causing the reverse flow of the subcooled water, which is reported in our previous studies (Sun et al., 2020). More importantly, the outlet parameters of the heated section, e.g., void fraction and velocity for each phase, are variable in the NCS because of the flow oscillation, which can affect the boundary conditions for the occurrence of DCC in turn.
Therefore, it will be an interesting challenge to research the flow characteristics of NCS along with the DCC phenomenon. Nevertheless, research on the influence of DCC phenomena on the NCS is still insufficient. The parametric effect on NCS along with the DCC phenomenon is not clear. The main aim of this work is to experimentally study flow characteristics along with DCC phenomena in an NCS, and analyze the formation mechanism of DCC phenomena. On this basis, the influences of heat flux, inlet temperature and resistance on NCS are particularly discussed. This work is helpful to comprehensively understand the flow characteristics of NCS along with DCC phenomena, which contributes to building analysis models for this issue.
Materials and Methods
Experimental System
To experimentally investigate the influence of DCC on NCS at low pressure, an experimental facility was designed, as shown in Figure 1A. Within this, the heated section is an electric heater with nine heating metal rods. These heating metal rods are arranged in a square arrangement of 3 × 3. The heating power of the heater is adjusted by the control system. In order to conveniently observe and record the two-phase flow characteristics, a visual pipe is used as the horizontal hot pipe. Five sheath thermocouples (TCs) named T1∼T5 are successively set in the pipe. To measure the radial fluid temperature distribution in the hot pipe, these thermocouples, T1∼T5, have three measurement points in the same cross-section. Take T5 for an example, their structure and installation is shown in Figure 1B.
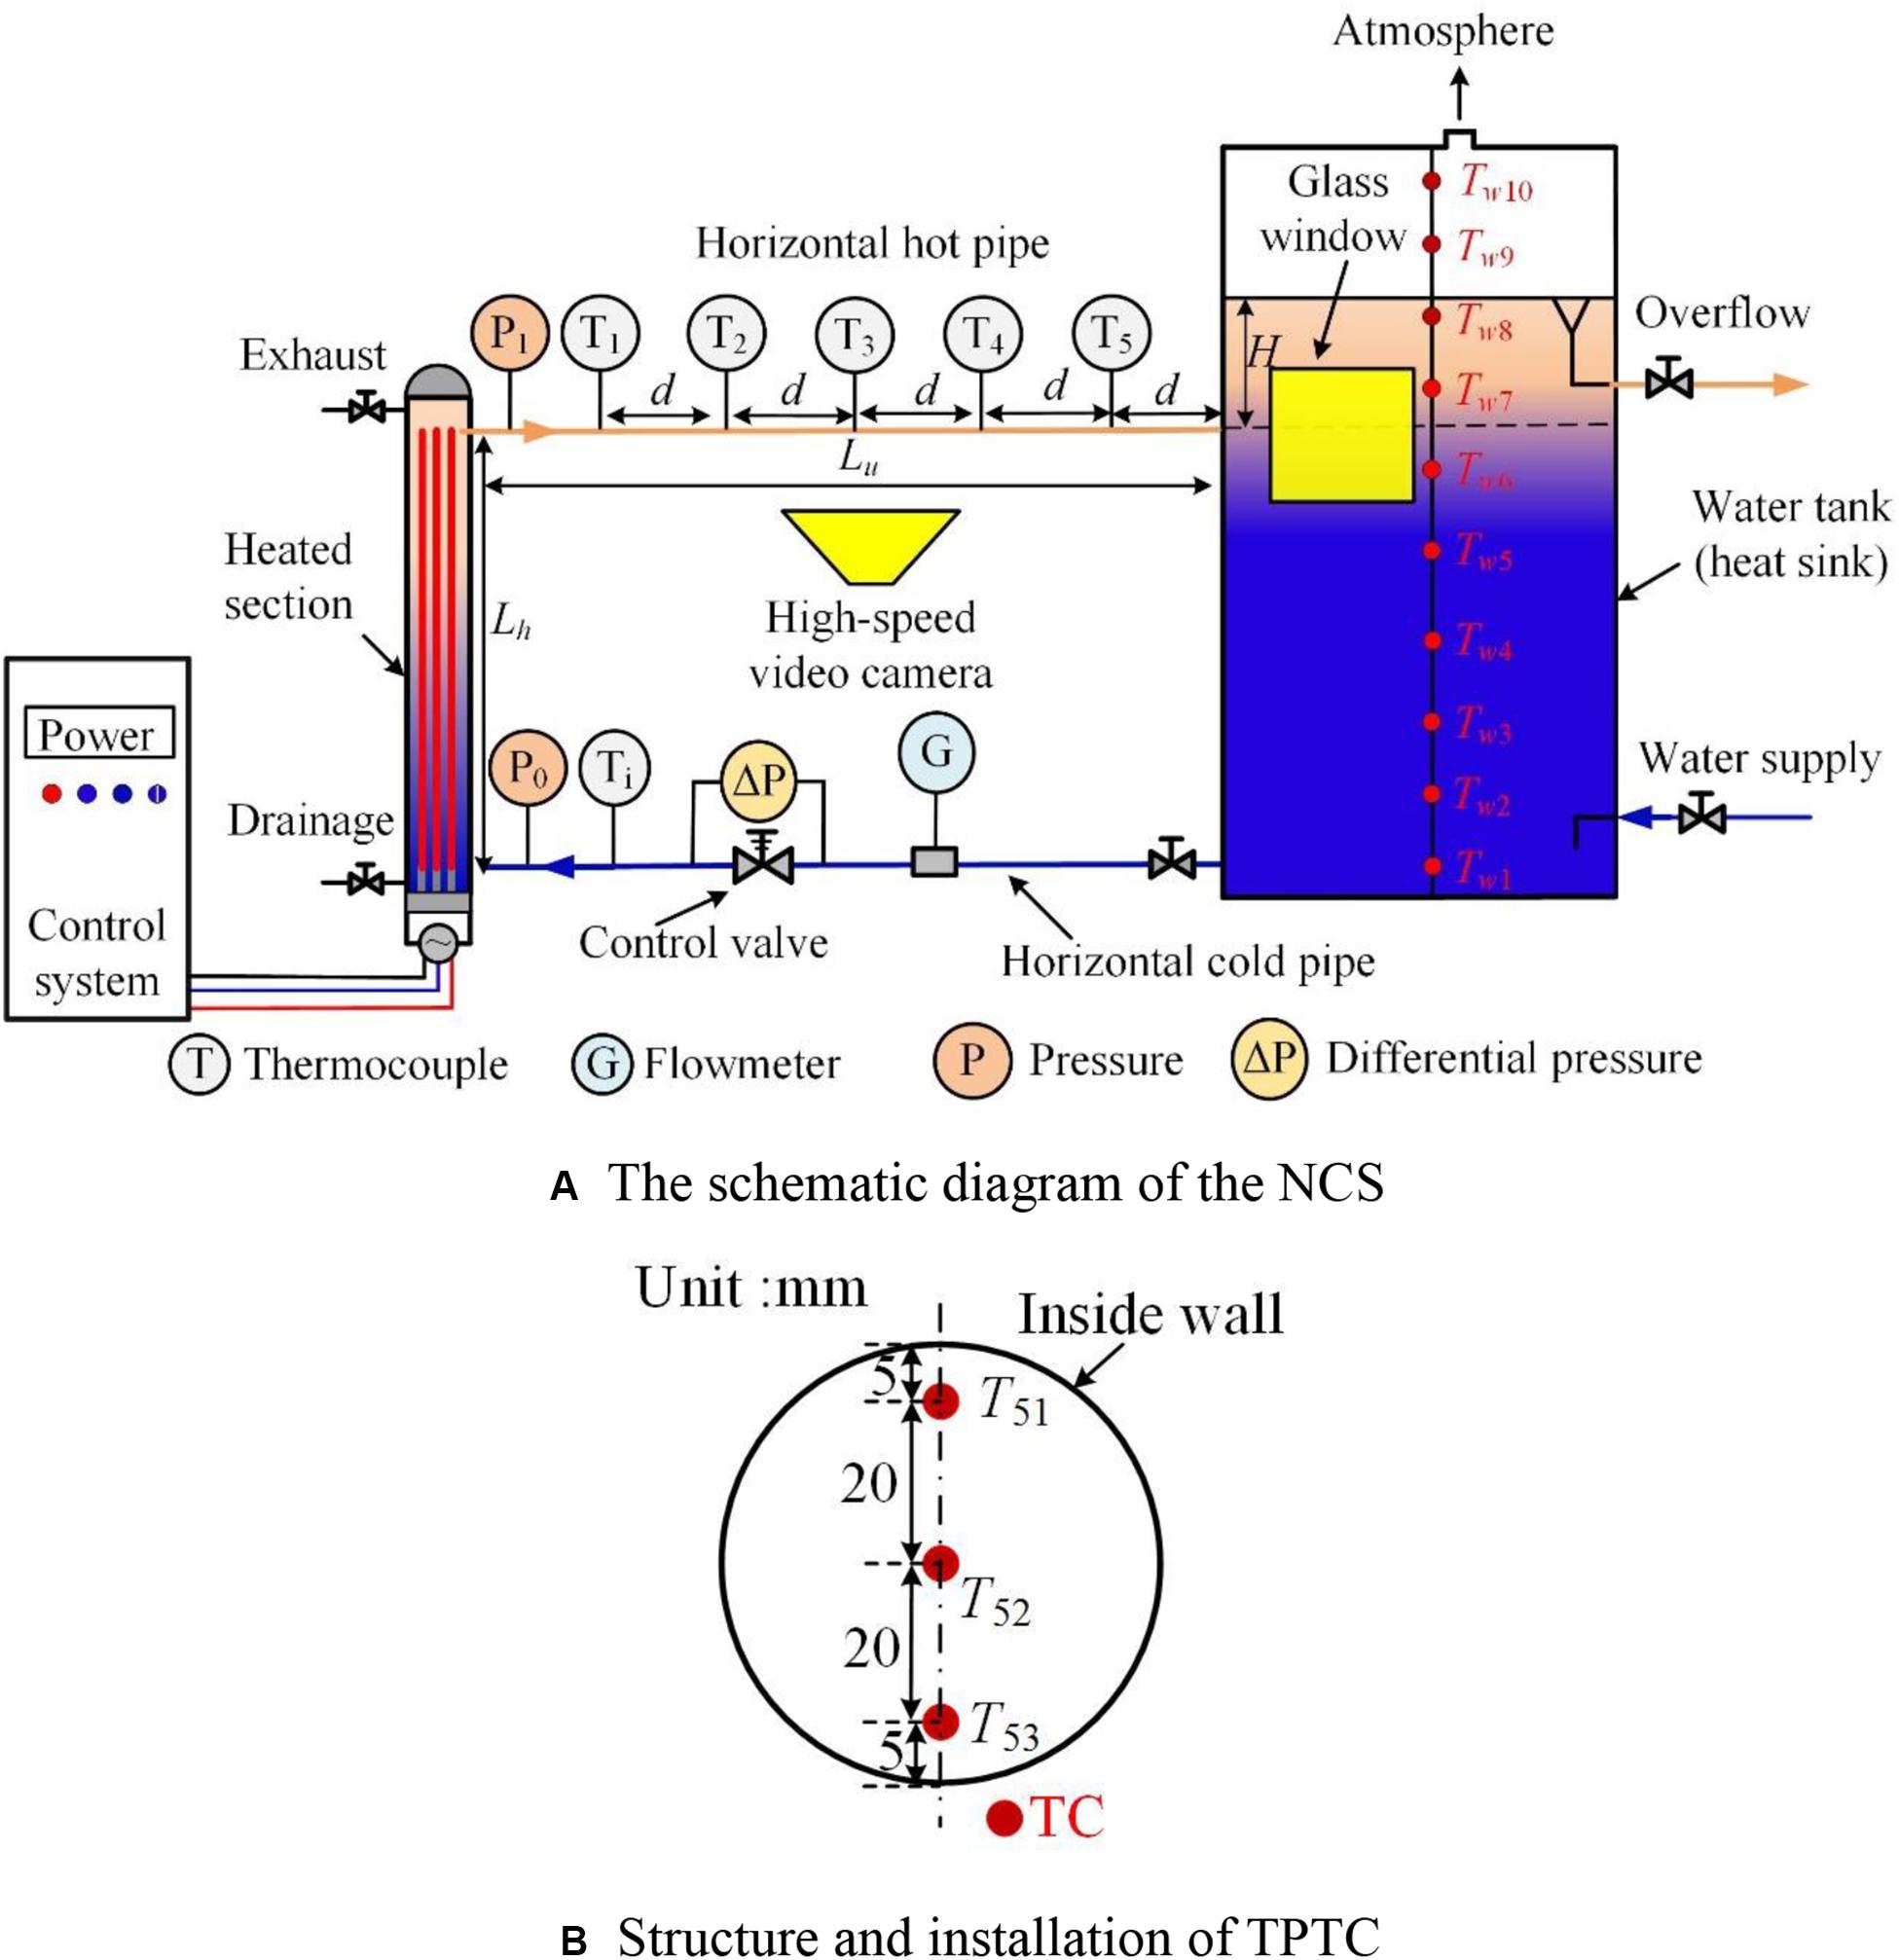
Figure 1. Experimental facility of the NCS. (A) The schematic diagram of the NCS. (B) Structure and installation of TPTC.
A water tank is used as the heat sink to simulate the ocean. To obtain the temperature distribution in the water tank, 10 TCs are installed in the water tank at an interval of 300 mm in the vertical direction. The experimental medium is tap water. A control valve, used to adjust resistance coefficient, is installed in the horizontal cold pipe. Moreover, the dimensionless geometric dimensions of experimental equipment are given in reference (Sun et al., 2020).
For the NCS, when the hot water flows into the water tank through the horizontal hot pipe, the high temperature water will float above the water tank because of the thermal stratification effect. To simulate the constant temperature condition of the ocean, the cold water is injected into the water tank via the water supply pipeline. Then, the high temperature water is drained to the environment via the overflow pipeline. In addition, the heating power is measured by the power meter. The inlet resistance coefficient is obtained based on the differential pressure of the control valve. All digital signals are dynamically recorded by the NI data acquisition system. The instrument parameters and uncertainty are specified in Table 1.
Table 1. Instrument parameters and uncertainty.
Experimental Methods
To perform the experiments, the subcooled water with a specified temperature is firstly injected into the water tank. The experiment starts when subcooled water overflows through overflow pipeline. The control valve opening is adjusted to a fixed value. Then the heating power gradually increases. As a result, a series of experimental cases with different heat flux are obtained. In the meantime, the experimental phenomena are recorded by high-speed video, and all measuring signals are recorded by the NI data acquisition system in real-time. In this way, all experiments are performed under different inlet resistance coefficient and temperature.
This work focuses on the influence of DCC phenomena on the NCS. The DCC behaviors are greatly influenced by outlet parameters of the heater. Therefore, the outlet parameters, including equilibrium quality xeq, quality xout, and void fraction α, are crucial to be confirmed for subsequent analysis.
The equilibrium quality xeq, as an important physical quantity, is used to determine the current state of thermal balance. It is expressed as follows at the heater outlet.
Where, Q is heating power, kW; G is the volume flow rate, m3/s; ho,fg is the latent heat at the heater outlet, kJ/kg; ho,sat is saturated water enthalpy, kJ/kg; hi is the enthalpy at the heater inlet. If xeq < 0, the mode of convective heat transfer is single-phase convection or subcooled; If xeq ≥ 0, the mode of convective heat transfer is saturated boiling. This paper focuses on the case of xeq ≥ 0. In this case, the equilibrium quality xeq is equal to the quality xout.
Void fraction α is calculated by the drift flux model (Yan et al., 2017) at the heater outlet, and its expression is as follows.
Where, xT is true quality, when the mode of convective heat transfer is saturated boiling, the xT is approximately equal to the quality xout; Gm is mass flow rate, kg/(ms); ρ’ and ρ? are the density of water and steam, respectively. is weighted drift flux, m/s, C0 is the distribution parameter, C0 and are expressed as follows:
Where g is gravitational acceleration, m/s2; σ is surface tension of saturated water, N/m2. The is 0.124 m/s for all experimental cases, which satisfies the applicable condition of m/s.
For a two-phase flow system, the flow pattern is helpful to analyze flow instability and build the flow model. The flow pattern map obtained by Mandhane is usually adopted to determine the flow pattern in a horizontal pipe (Mandhane et al., 1974). Thereinto, the superficial water velocity jf and superficial steam velocity jg are calculated by Eqs. (5) and (6).
Where M is mass flow rate of steam-water mixtures, kg/s; Ah is the flow area of the horizontal hot pipe, m2. In order to verify the rationality by using Mandehan’s flow pattern map as the standard. Figure 2 displays the experimental data plotted in the Mandehan’s flow pattern map. It is clear that the flow patterns of all experimental cases are the stratified flow.
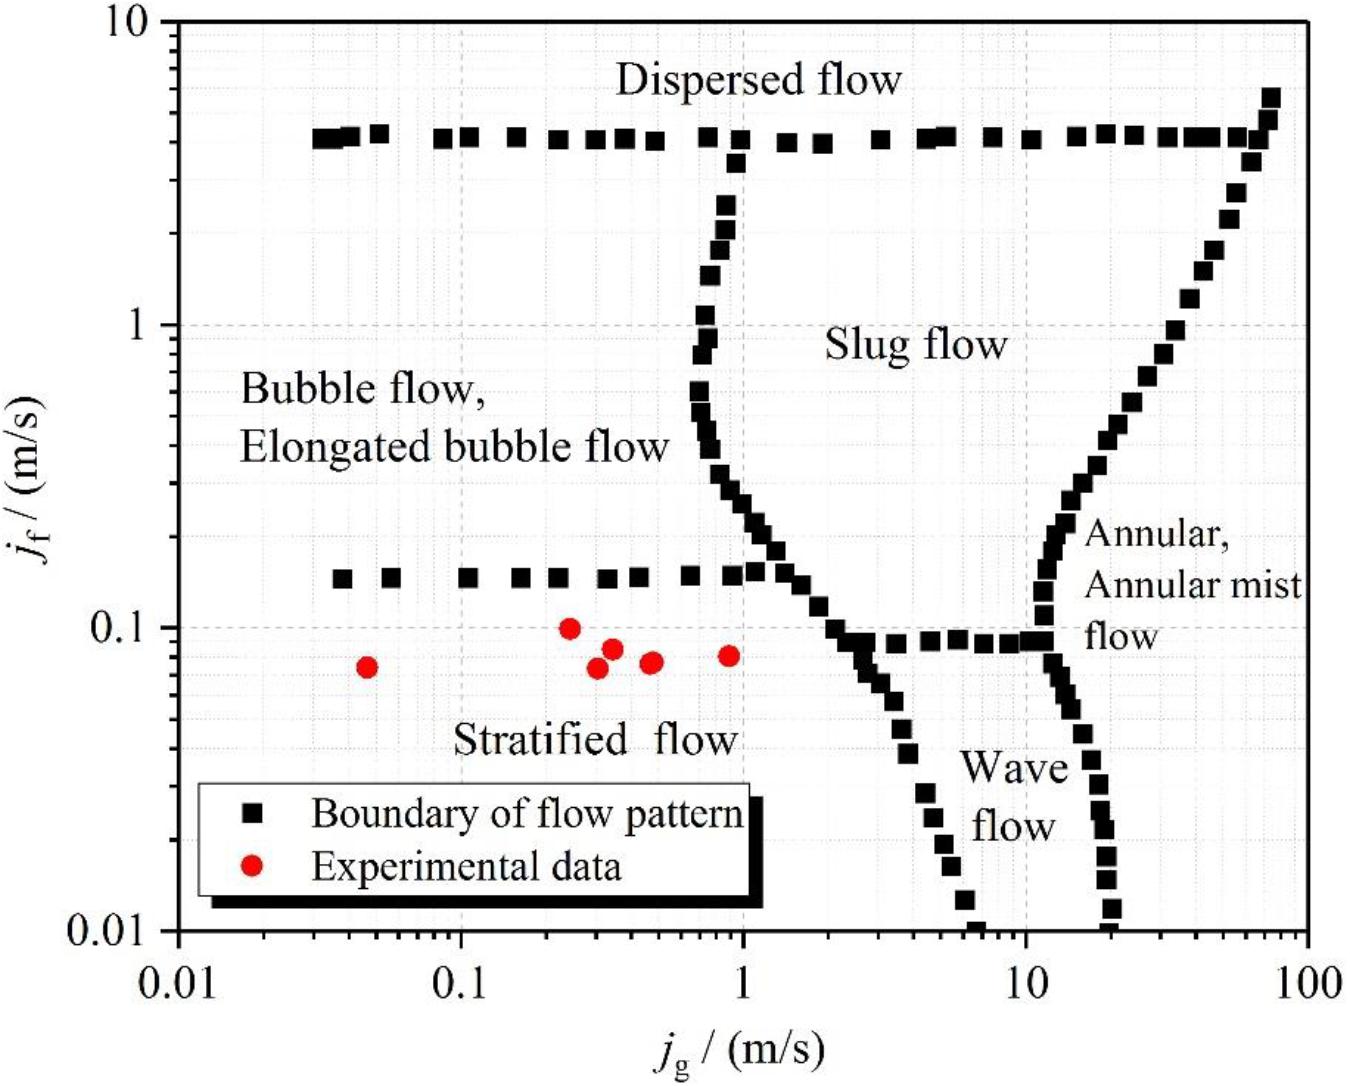
Figure 2. Mandhane flow pattern map and experimental results.
Experimental Results and Analysis
Basic Two-Phase Flow Characteristics of NCS
When the inlet resistance coefficient ξi is 85, the inlet temperature Ti is 15°C, and the heat flux q is 111.7 kW/m2, the average void fraction αave,o of heater outlet is 0.3. According to the visualization results of DCC phenomena in the horizontal hot pipe, two types of DCC behaviors were observed based on different flow patterns.
Type I DCC Phenomenon
Figure 3 exhibits the visualization results of Type I DCC in the horizontal hot pipe. As can be seen from Figure 3, the flow pattern is stratified flow. When the steam flows into the water tank, it will directly contact the subcooled water in the water tank. In this case, due to the rapid condensation of saturated steam at 0.083 s, the subcooled water reversely flows into the horizontal hot pipe, as shown in Figure 3A from 0.083 to 0.242 s. In addition, the fluctuation amplitude of interface between saturated steam and water has significant increase due to the reverse flow of the subcooled water downstream.
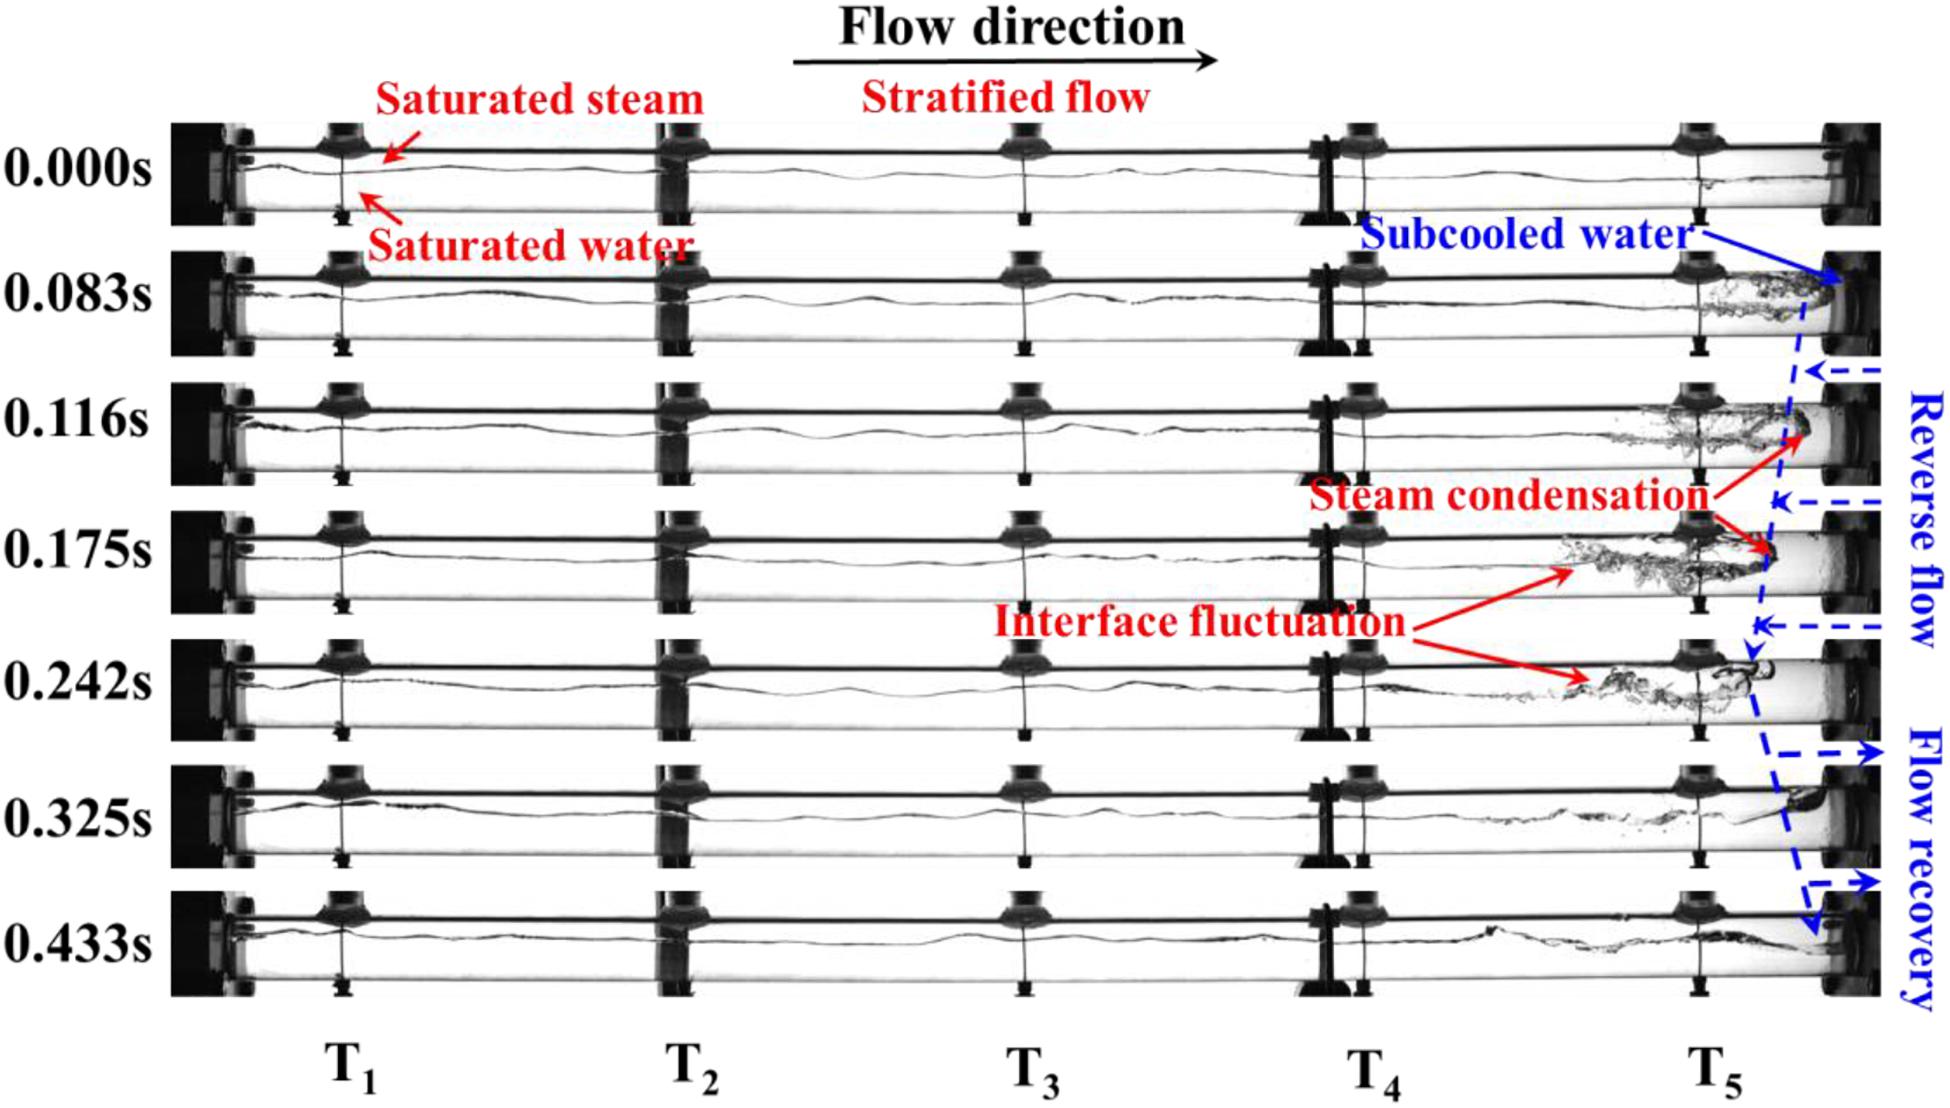
Figure 3. Visualization results of Type I DCC.
The subcooled water, at the condensation interface, is gradually heated by the steam during this process. The condensation rate decreases accordingly because of the decrease in subcooled degree of the subcooled water. Then the subcooled water is pushed out of the pipe by the saturated steam-water mixtures from 0.242 to 0.433 s. A new Type I DCC starts at 0.433 s while the steam directly contacts the subcooled water once again. Moreover, it is seen that the flow pattern is stratified flow during the whole process. In general, depending on the visual observation for Type I DCC, the positions where the subcooled water reversely flows are in the region between T5 and the water tank.
Type II DCC Phenomenon
Depending upon the results in Figure 3, the interface of saturated steam and water displays intense fluctuation because of the reverse flow of subcooled water. As the saturated water contacts the upper pipe wall and the steam slug is formed, Type II DCC phenomenon will appear in the horizontal hot pipe. Figure 4 exhibits the visualization results of Type II DCC in the NCS.
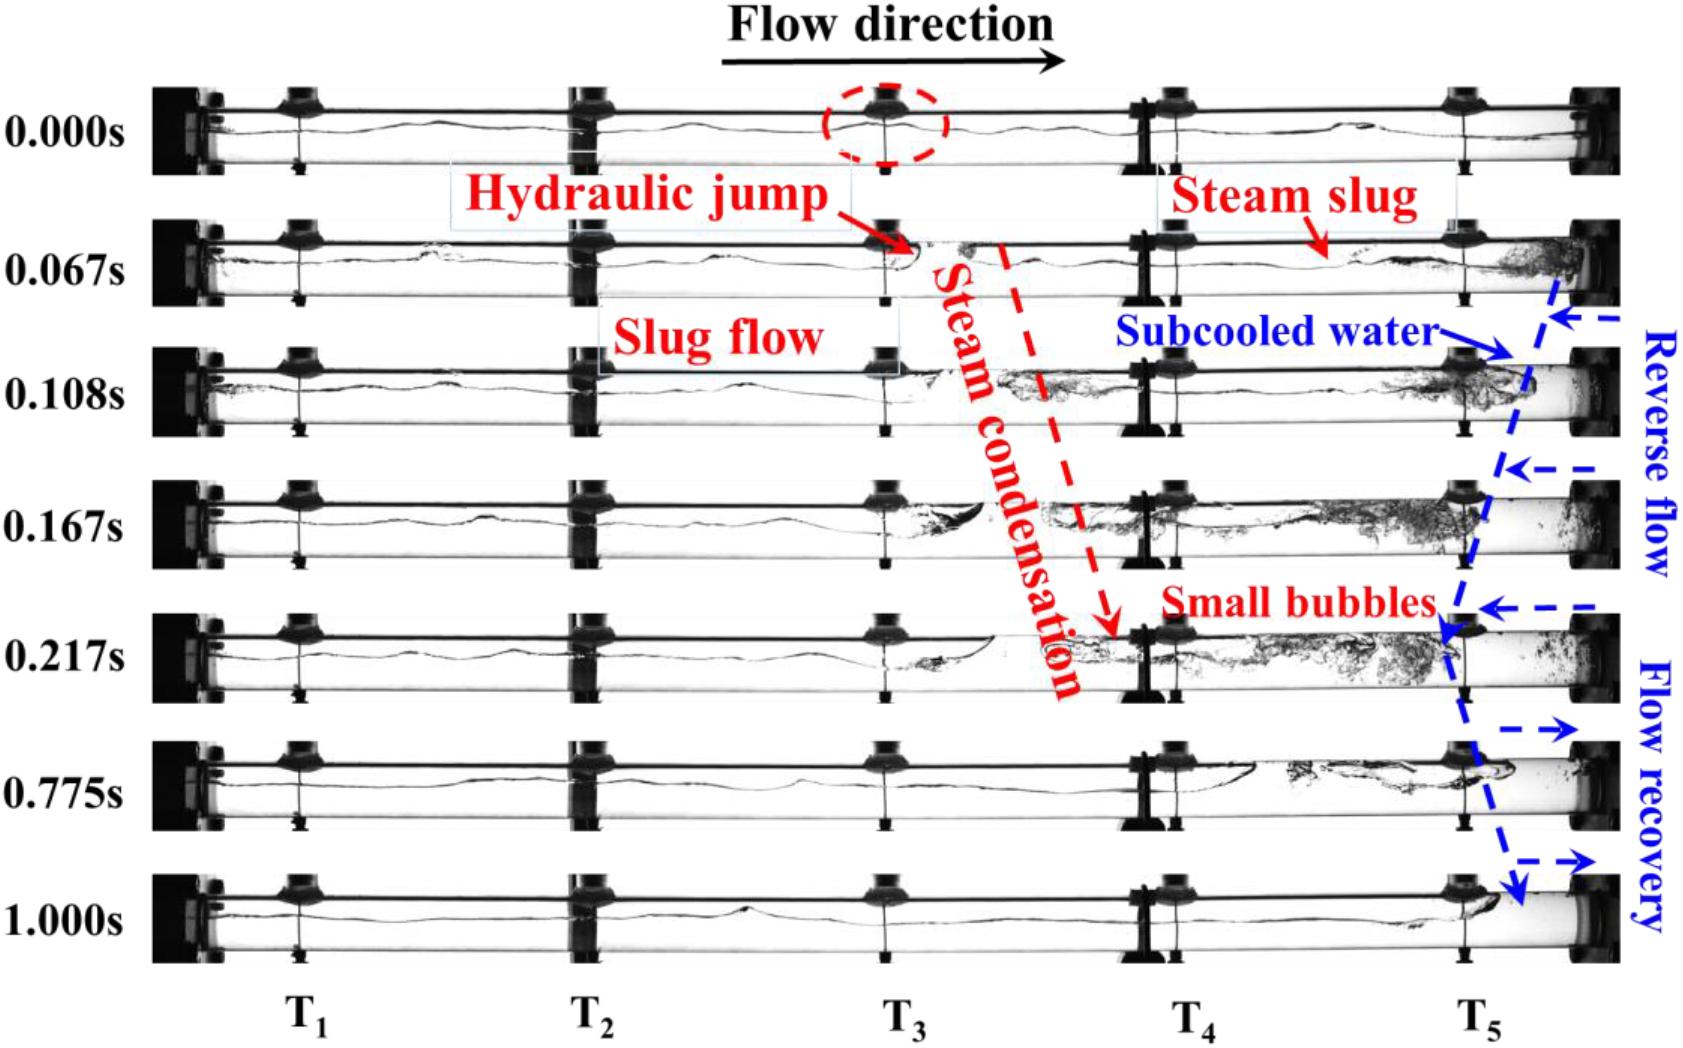
Figure 4. Visualization results of Type II DCC.
It is seen that the flow pattern is stratified flow at 0 s. The saturated water contacts the pipe wall as the saturated steam flows into the water tank. Then, a steam slug is formed in the vicinity of the water tank at 0.067 s. The water column at one end (water tank side) of the steam slug is subcooled water. As a consequence, the steam slug is condensed by the subcooled water from 0.067 to 0.217 s. Meanwhile, the pressure in the slug gradually decreases owing to rapid condensation of the steam slug. The subcooled water reversely flows into the horizontal hot pipe under the pressure difference between the pressure in steam slug and the system pressure.
As for the follow-up process, two typical cases were observed in the experiments. The first case is illustrated in Figure 3. The steam slug is not completely condensed by the subcooled water. The steam slug finally collapses into small bubbles at 0.217 s because of unbalanced forces in Figure 4. The other case occurs when the steam slug is completely condensed by the subcooled water. The water columns at both ends of the steam slug finally collide with each other. This phenomenon which is so-called condensation induced water hammer (CIWH) is reported in our previous research (Sun et al., 2020).
However, the results in the Figure 3 show that the flow pattern is slug flow while Type II DCC occurs. Moreover, due to the additional driving force of the pressure difference between the pressure in the steam slug and the system pressure, the position where the subcooled water reversely flows can reach in the region between T4 and T5. That is to say, the reverse flow length of the subcooled water is larger than that caused by Type I DCC.
Influences of DCC on the Characteristics of NCS
In order to study the influence of two types of DCC phenomena on the flow characteristic of the NCS, Figure 5 shows the variations of the flow rate and subcooled degree of fluid at the position of T5. Thereinto, the subcooled degree is the difference of the saturated temperature and the local fluid temperature. According to the visualization results, the two types of DCC phenomena take place toward the end of the outlet of the horizontal hot pipe. Hence, the fluid temperature at the position of T5 is studied in particular. Since the position of TCs is unchanged, the subcooled degree measured by TC will increase when the subcooled water gradually approaches the position of T5. Hence, the magnitude of subcooled degree can qualitatively represent the reverse flow length of the subcooled water.
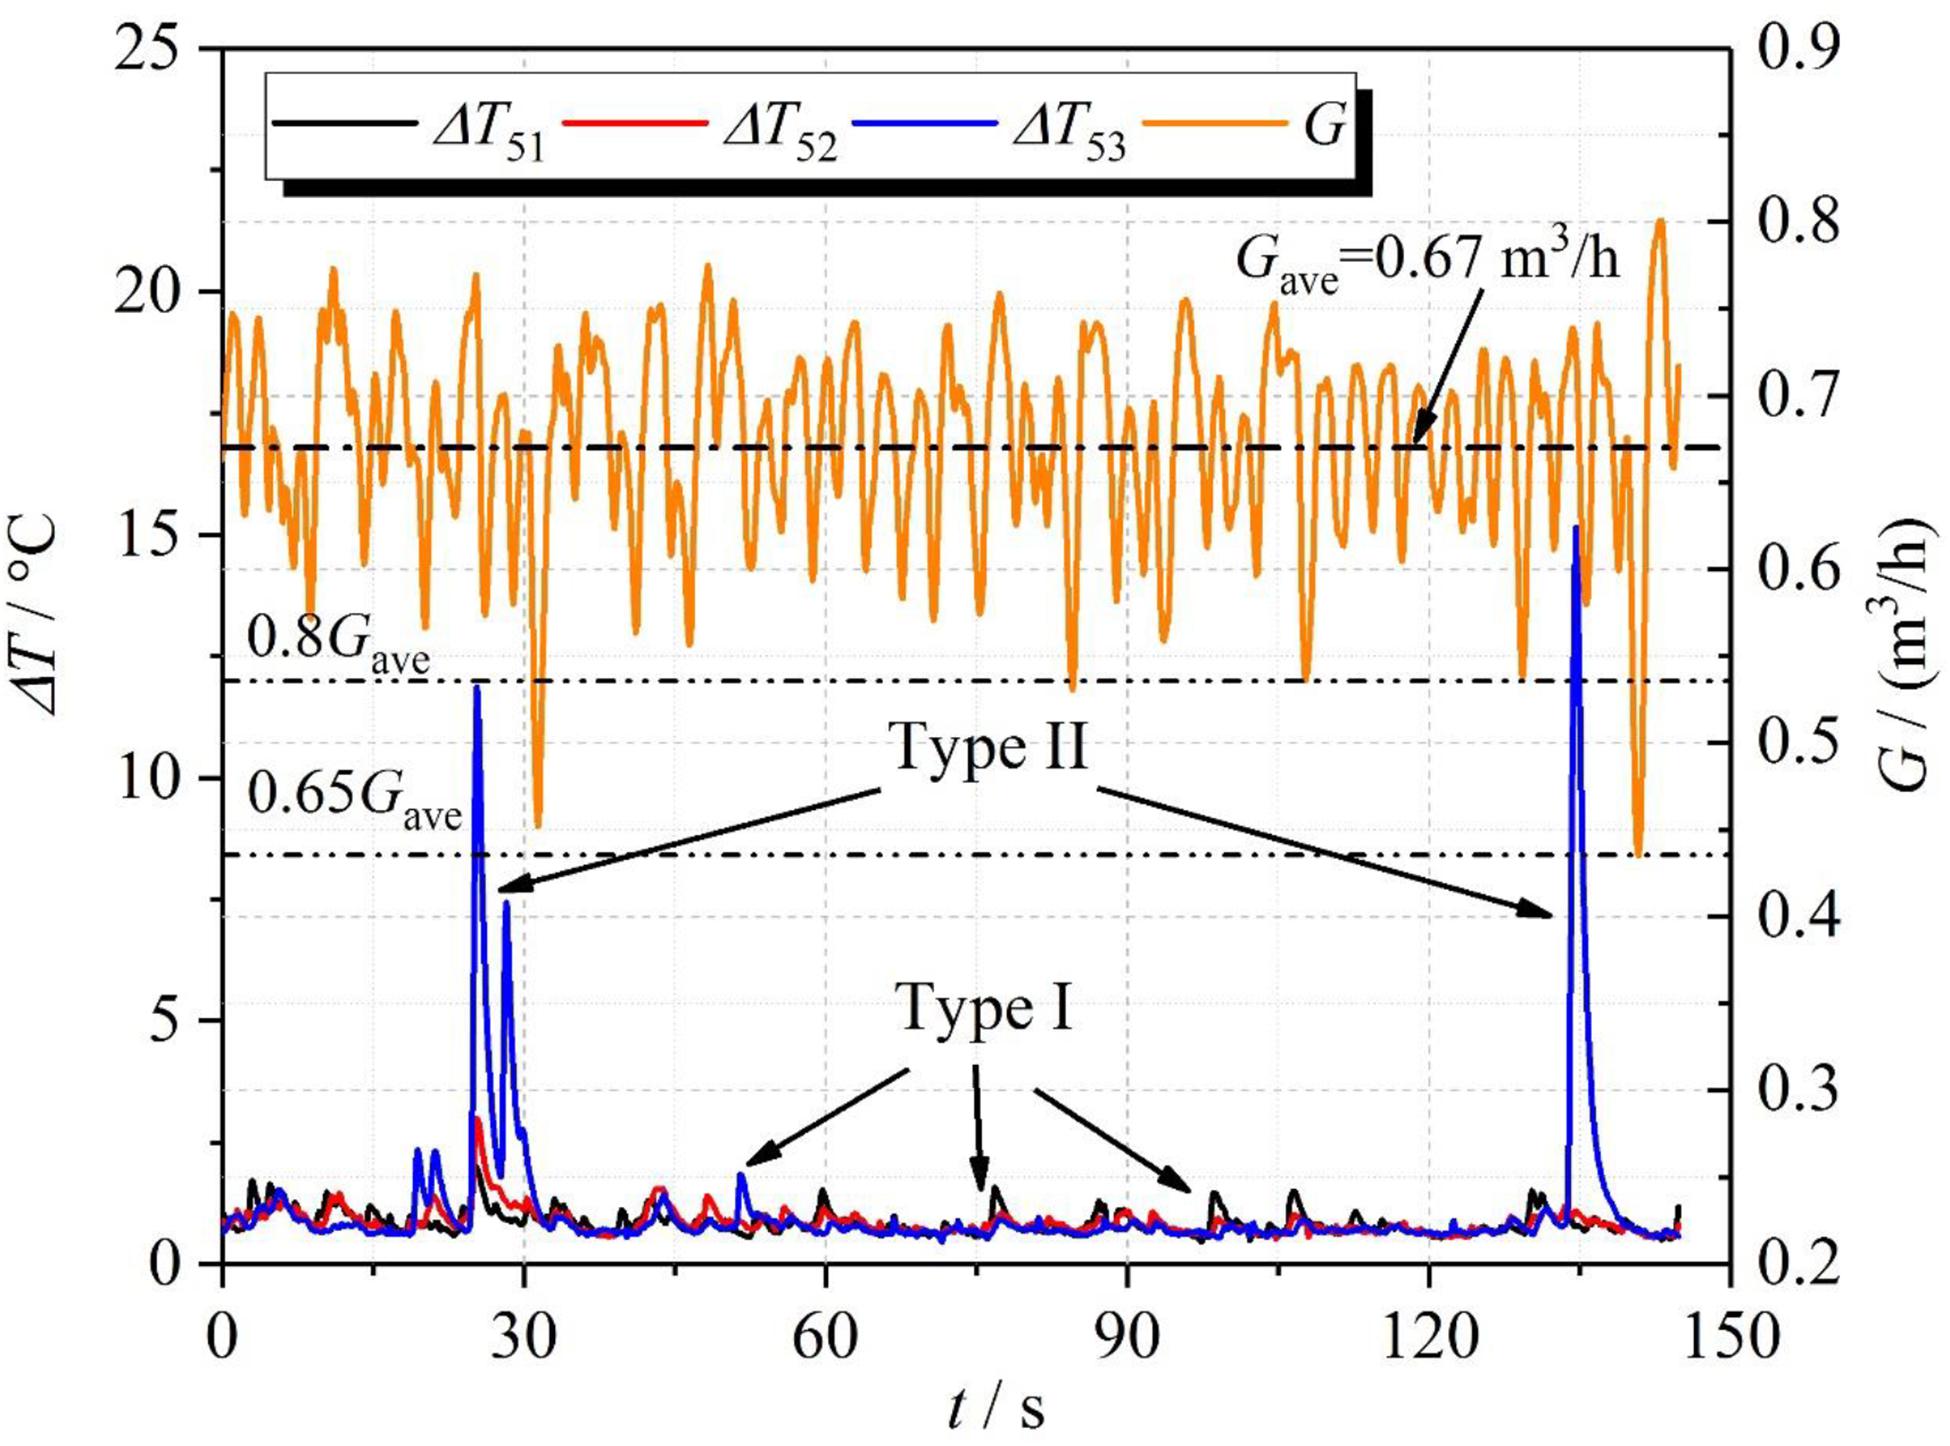
Figure 5. Variations of flow rate and subcooled degree of fluid at T5 with time.
From Figure 5, it can be seen that when the I-type DCC occurs, the subcooled degrees of T51, T52, and T53 have a small fluctuation amplitude which is less than 2.5°C. When DCC phenomena occur, the flow resistance of the horizontal hot pipe will increase because the saturated steam-water mixtures must overcome the opposite momentum of subcooled water (Sun et al., 2020). For an NCS, when the flow resistance increases, the flow rate will decrease due to adaptive feedback mechanism. Subsequently, the average void fraction of the heater increases, which impels the increase in the driving force. After that, the flow rate will recover. Since the DCC phenomena inevitably occur in the NCS, the flow rate displays continuous oscillation. Moreover, the oscillation amplitude of the flow rate is less than 20% of the average value as Type I DCC occurs in this case.
Compared with the results caused by Type I DCC, the subcooled degrees of T51, T52, and T53 show a significant increase, especially T53 as the Type II DCC occurs. This result indicates that the reverse flow length of the subcooled water is larger than that caused by Type I DCC, which is consistent with visualization results. The increment in the flow resistance further increases due to the increase in the reverse flow length of the subcooled water. Therefore, the flow rate will further decrease. As presented in Figure 5, the fluctuation amplitude of flow rate is about 35 % of the average value. Thus, the flow oscillation is enhanced when Type II DCC occurs in the NCS. It is known that the fluctuation in the flow rate is assigned to the reverse flow of the subcooled water. From the time axis’ point of view, the time of flow fluctuation is later than that of temperature fluctuation, which is also clearly exhibited in Figure 5.
Formation Mechanism of DCC Phenomena in NCS
According to the results in Figure 5, when Type II DCC phenomenon occurs, the subcooled degree of T53 shows an obvious increase, and its oscillation amplitude is larger than that of T52 and T51. This means that the subcooled water fills the pipe and flows into the pipe as DCC phenomenon occurs. Besides, the subcooled water in the lower part of the pipe has a larger reverse flow length. This result is experimentally observed by adding strain (Sun et al., 2020). In order to further understand the formation mechanism of the Type II DCC phenomenon, the diagram of Type II DCC and experimental results are given in Figure 6.
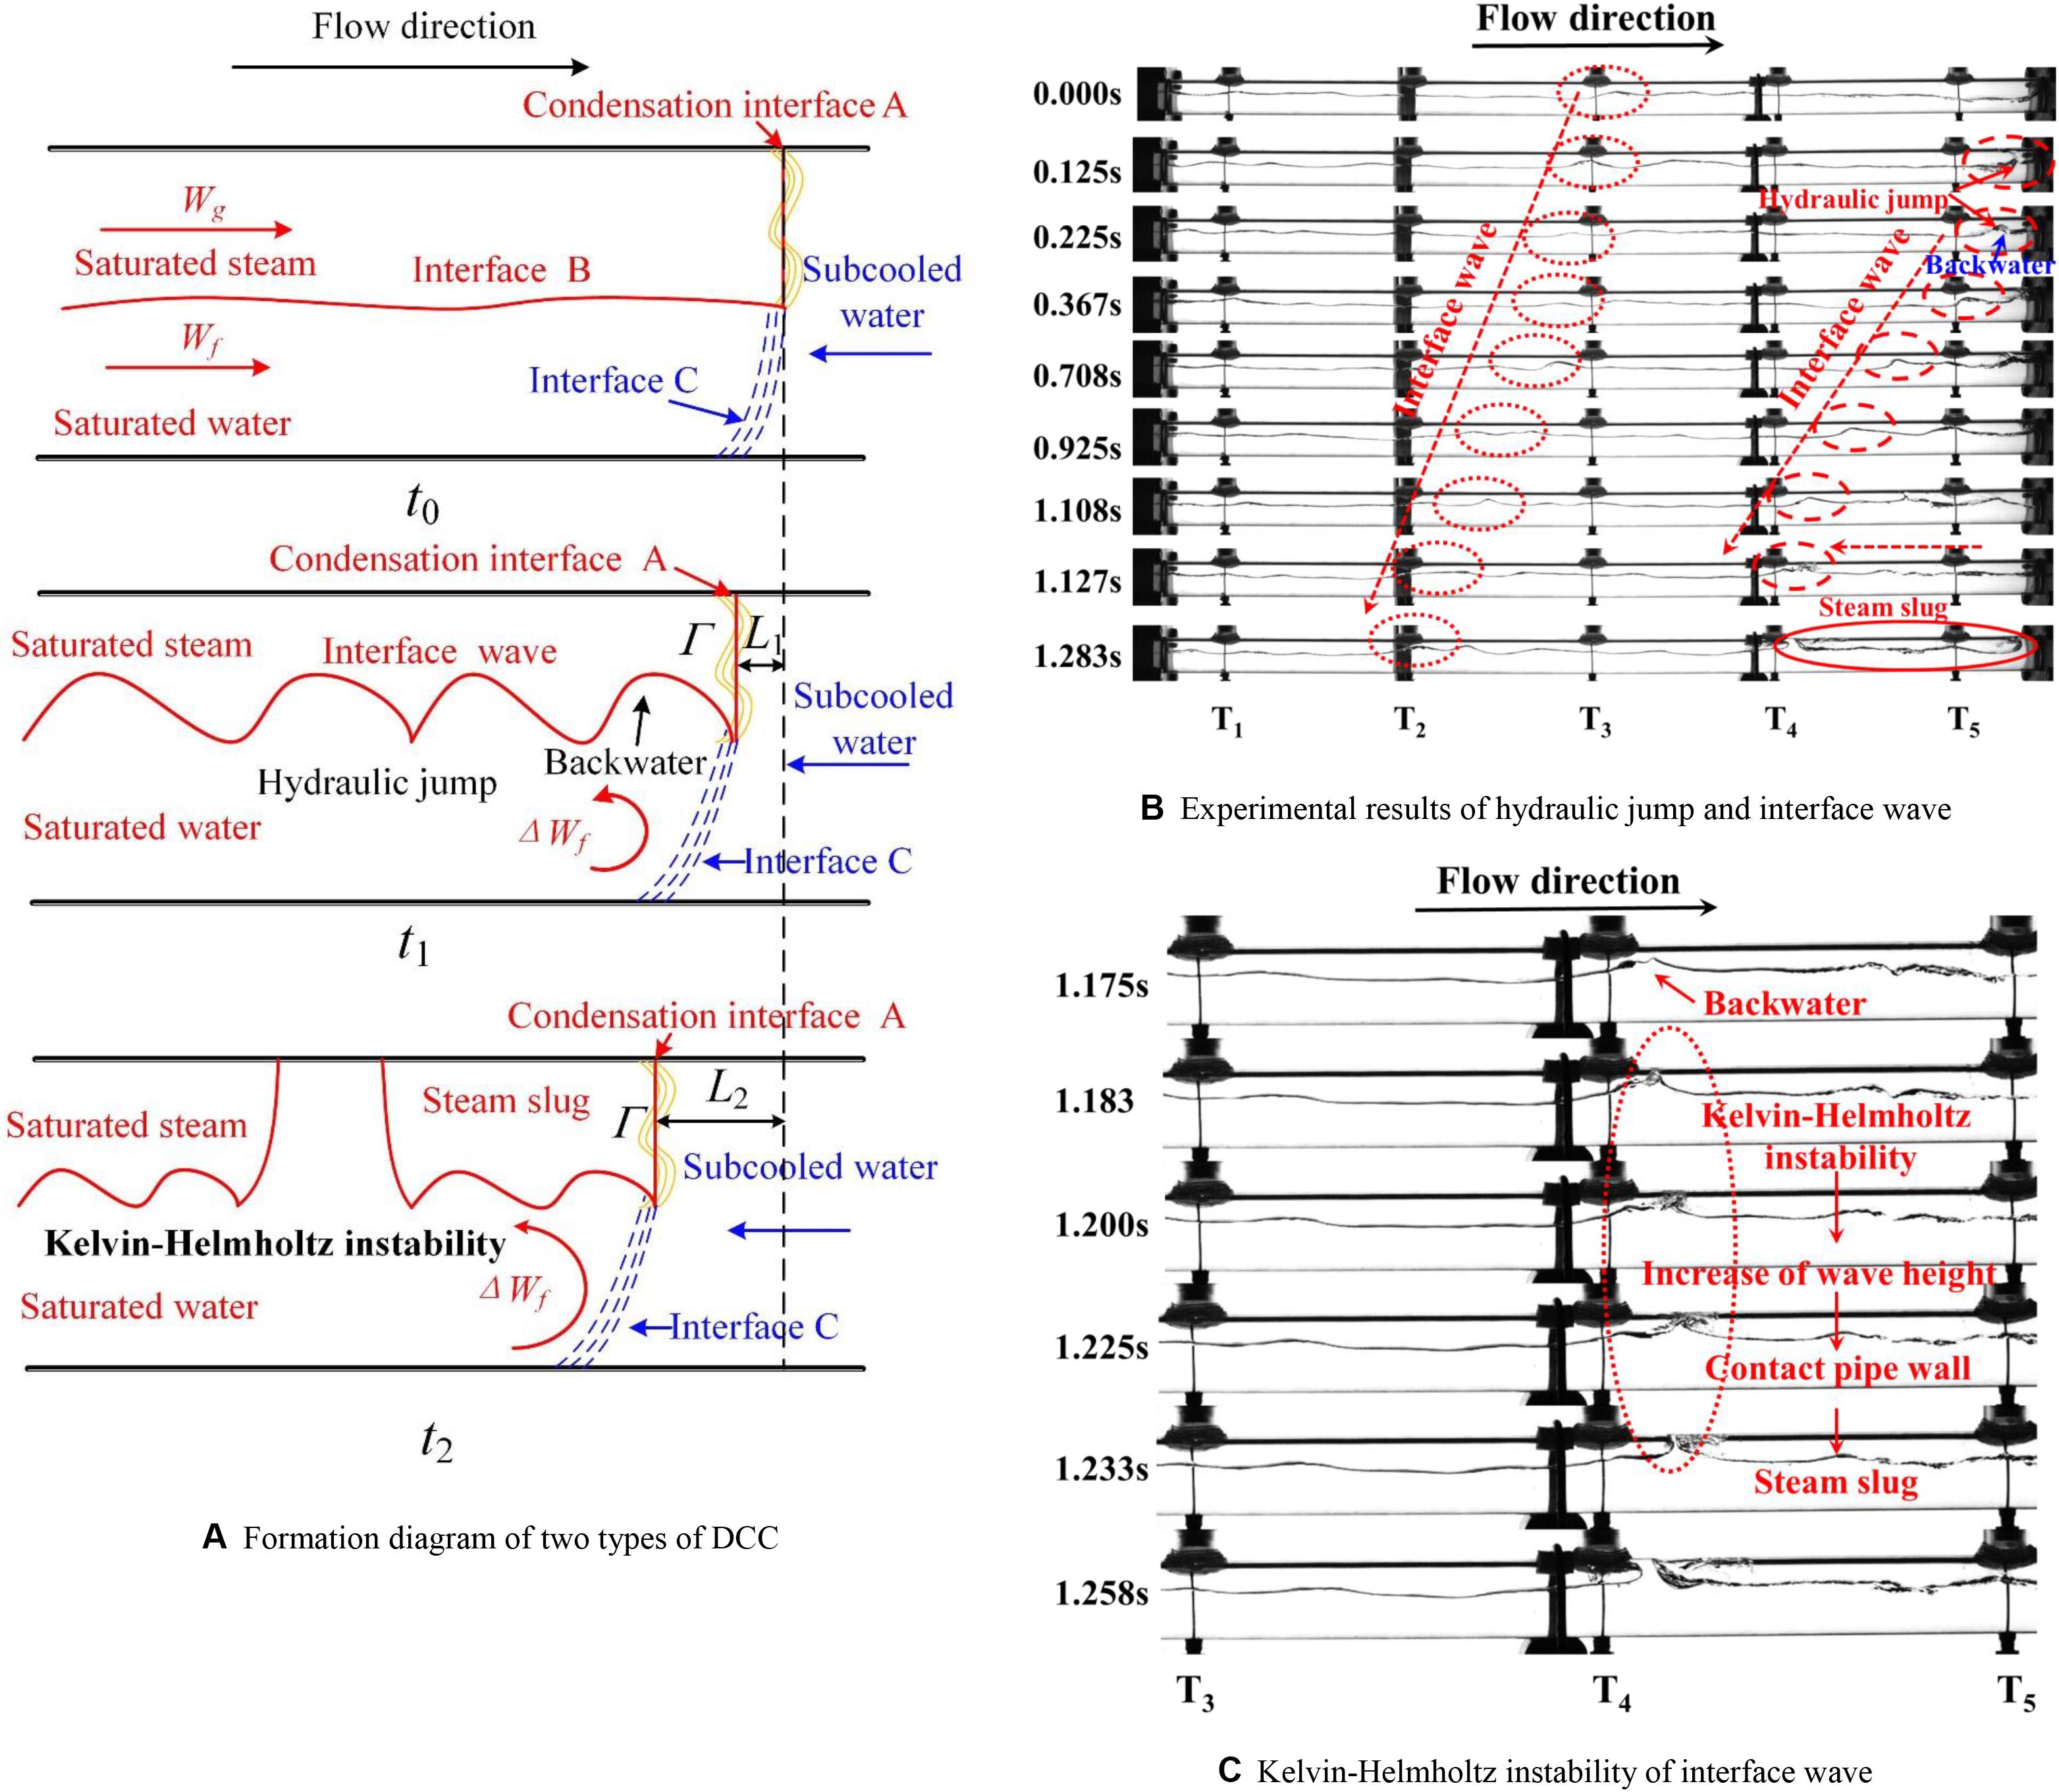
Figure 6. Formation mechanism of two types of DCC in the NCS. (A) Formation diagram of two types of DCC. (B) Experimental results of hydraulic jump and interface wave. (C) Kelvin-Helmholtz instability of interface wave.
Formation mechanism of Type I DCC
As Figure 6A illustrated, the initial velocities of saturated steam and water are Wg and Wf, respectively. The flow pattern is stratified flow before DCC starts at t0. The interface of saturated steam and water, namely interface B, has basically no fluctuation. When saturated steam is condensed by subcooled water with the condensation rate Γ at condensation interface A at t1, the subcooled water starts flowing into the pipe since the condensation rate is larger than the mass flow rate of saturated steam. As a result of the reverse flow of subcooled water, the velocity of saturated water at the interface of saturated water and subcooled water, namely interface C, has a sudden decrease of ΔWf. The kinetic energy of saturated water changes into potential energy. The height of the liquid layer will increase, which results in the backwater. This phenomenon is so-called hydraulic jump (Yih and Guha, 1955; Mignot and Rivière, 2010). The backwater pushes toward the upstream, which forms the interface wave. This is the formation mechanism of Type I DCC.
The phenomena of hydraulic jump and interface wave are also observed in the horizontal hot pipe, as shown in Figure 6B. It is seen that the height of water layer significantly increases as saturated steam directly contacts the subcooled water at 0.125 s. Meanwhile, the backwater is formed after the occurrence of hydraulic jump at 0.225 s. Clearly, the backwater moves toward the upstream from 0.225 to 1.127 s. Then the interface wave is formed, which is consistent with the analysis in Figure 6A.
Formation mechanism of Type II DCC
With the further development of the interface wave, it is seen that the interface wave, in the vicinity of T4, contacts the pipe wall at 1.283 s. Then the slug flow is finally formed, which directly results in the Type II DCC phenomenon.
In order to further investigate the formation mechanism of Type II DCC, the specific process, from 1.127 to 1.283 s in Figure 6B, is analyzed in depth. When the wave height increases, the slip velocity between backwater and saturated steam increases because of the decrease in the flow area. When the slip velocity is high enough to overcome the stabilizing effect of gravity, the slip velocity is contributed to the increase in the wave height. This phenomenon is named Kelvin-Helmholtz instability of interface wave (Fabre and Line, 1992; Chavaraddi et al., 2016). The initiation of slug flow is associated with a sudden increase of the wave height owing to the slip velocity. Once the saturated water, at the wave crest, contacts the upper inside wall of the pipe, the flow pattern will transit from stratified flow to slug flow at t2 in Figure 6A. Then Type II DCC phenomenon finally occurs.
The Kelvin-Helmholtz instability of interface wave is also experimentally observed, as shown in Figure 6C. What can be clearly seen in this figure is the formation process of slug flow. The Kelvin-Helmholtz instability of interface wave occurs as the back water closes to the pipe wall at the wave crest from 1.183 to 1.225 s. In the process, it can be distinctly seen that the wave height has a more obvious increase. Moreover, the backwater contacts the pipe wall, which finally forms the steam slug at 1.233 s. A full view of the steam slug is displayed at 1.283 s in Figure 6B. Hence, the existence of the interface wave provides a precondition for the occurrence of Type II DDC phenomenon.
Influence of Heat Flux on the Flow Characteristics
To further the influence of heat flux on the flow characteristics, four experiments were performed at different heat fluxes as the inlet temperature and resistance coefficient are set as 26°C and 138, respectively. According to the results in section “Basic Two-Phase Flow Characteristics of NCS,” the DCC phenomena can result in the oscillation in the flow rate and the fluid temperature. Thus, the influences of heat flux on fluid temperature and the flow rate were discussed in this section.
Influence of Heat Flux on Fluid Temperature
Figure 7 gives the fluid temperature distribution at a different heat flux at the position of T5. Similar to the results in Figure 5, the fluctuation amplitude of ΔT53 is always larger than that of ΔT52 and ΔT51 at different heat fluxes. Moreover, the fluctuation frequency and amplitude of subcooled degree have obvious increase with the increase of heat flux. It means that both the reverse flow length and occurrence frequency of subcooled water increase as the heat flux is increased.
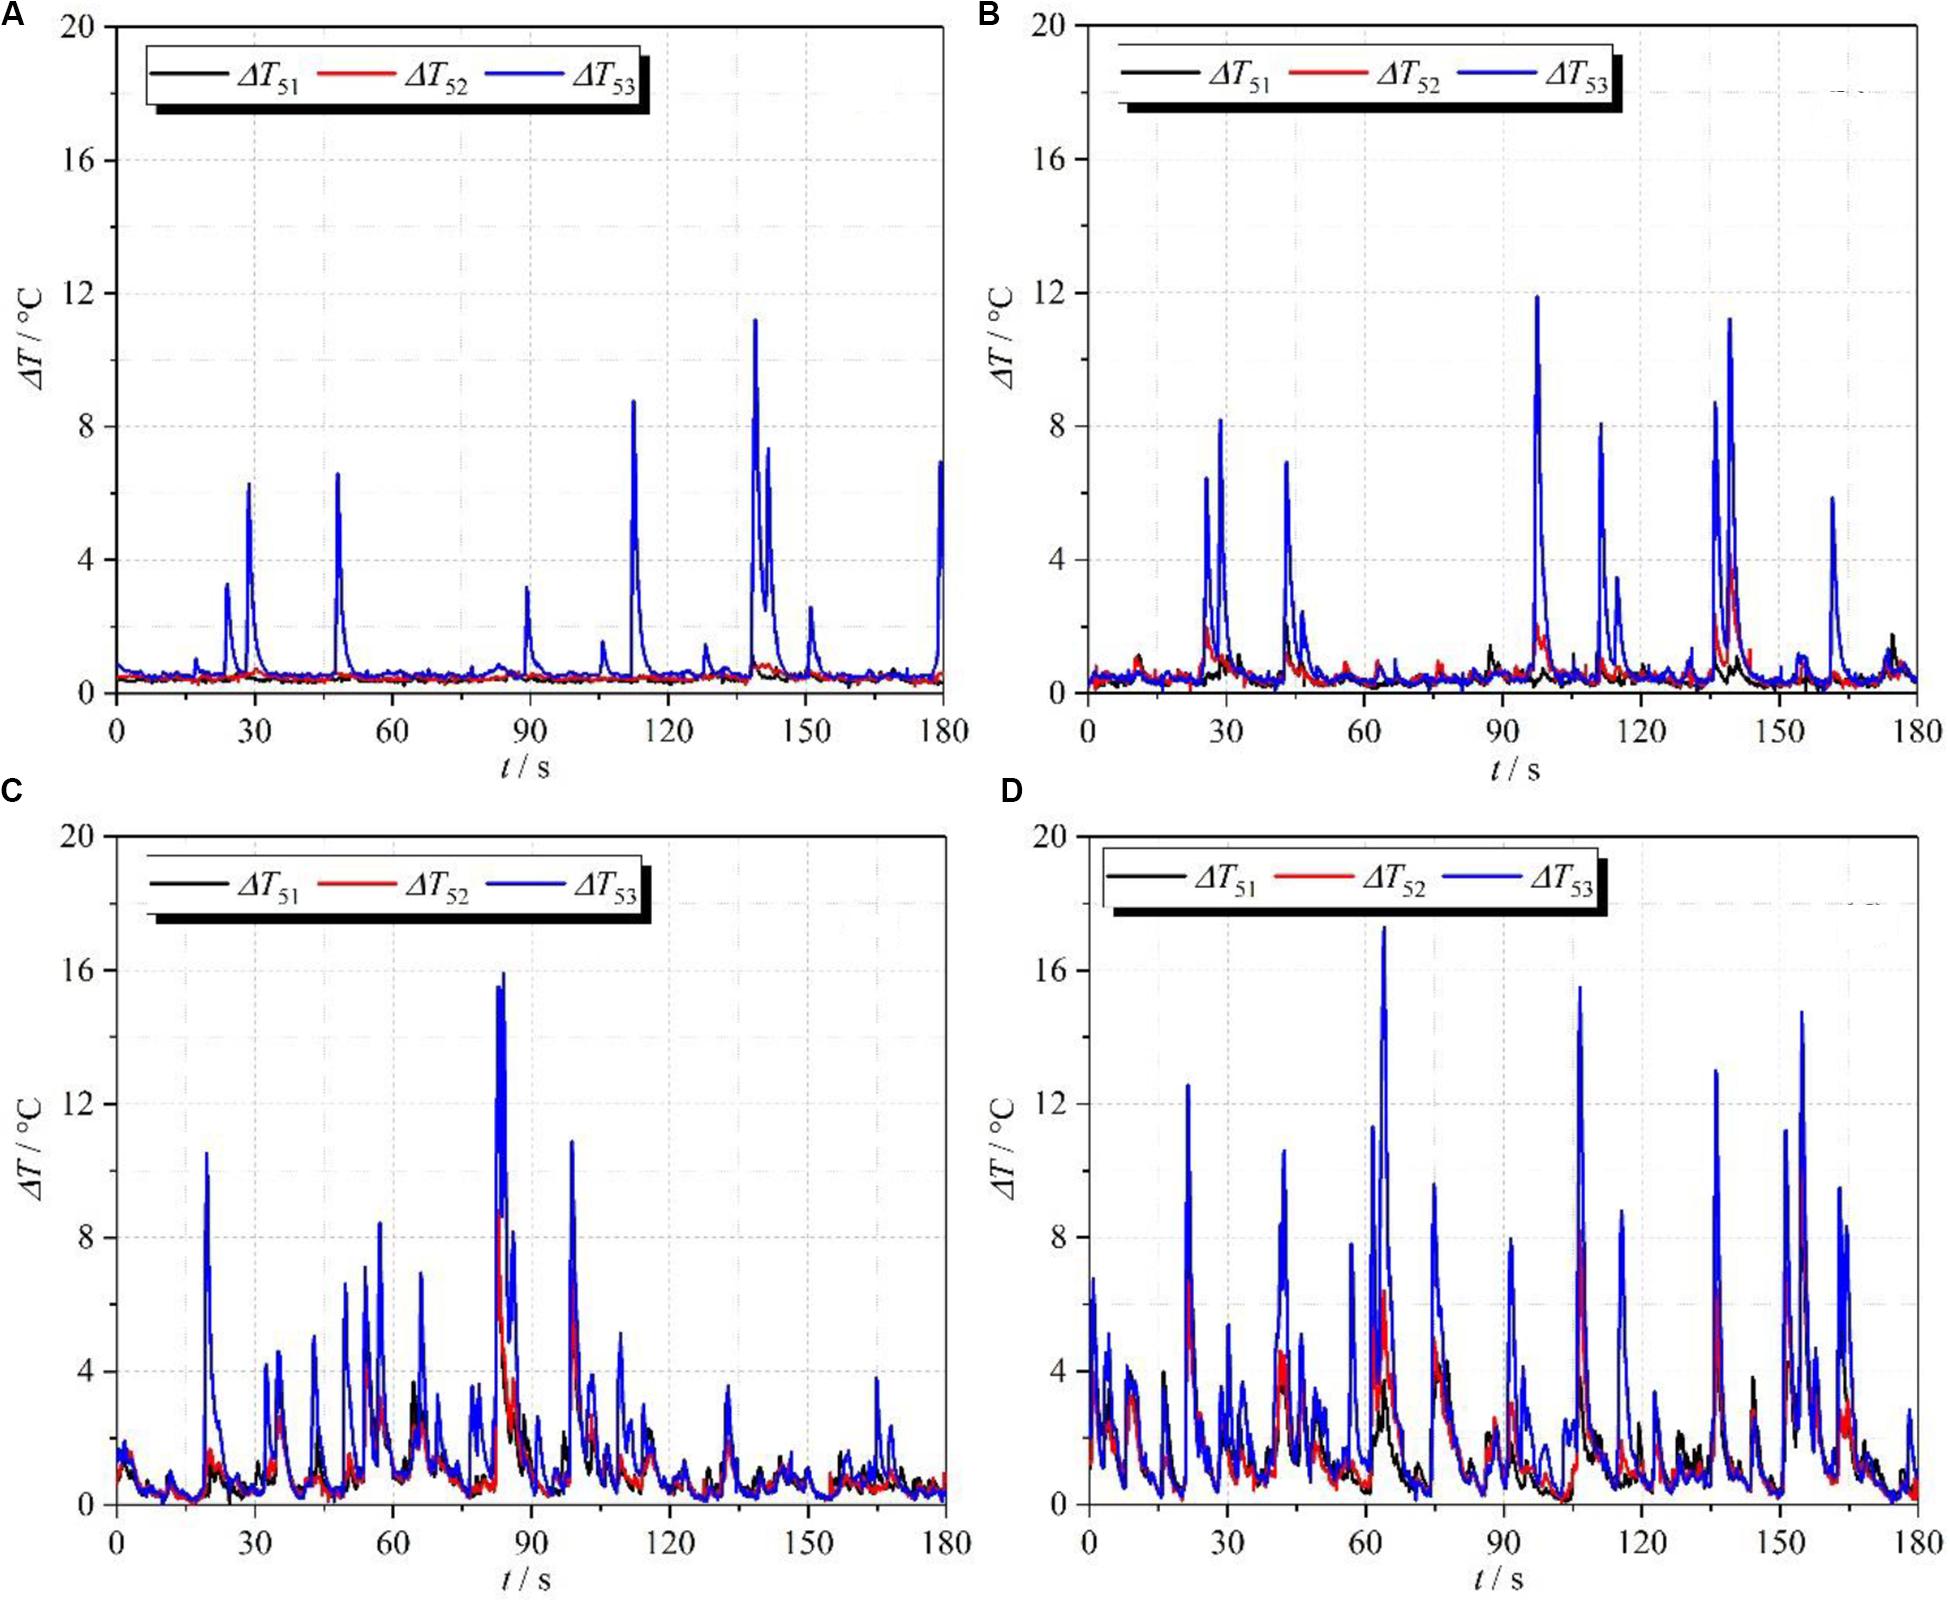
Figure 7. Distributions of subcooled degree with time at different heat flux: (A) 74 kW/m2; (B) 77 kW/m2; (C) 80 kW/m2; (D) 84 kW/m2.
To further investigate the essential causes of the above results, Figure 8A displays the distribution of steam quality and average void fraction with heat flux at the outlet of the heater. It is seen that the steam quality and average void fraction increase with the increase of the heat flux. Based on the average void fraction, the real velocity of each phase can be obtained by Eqs. (7) and (8).
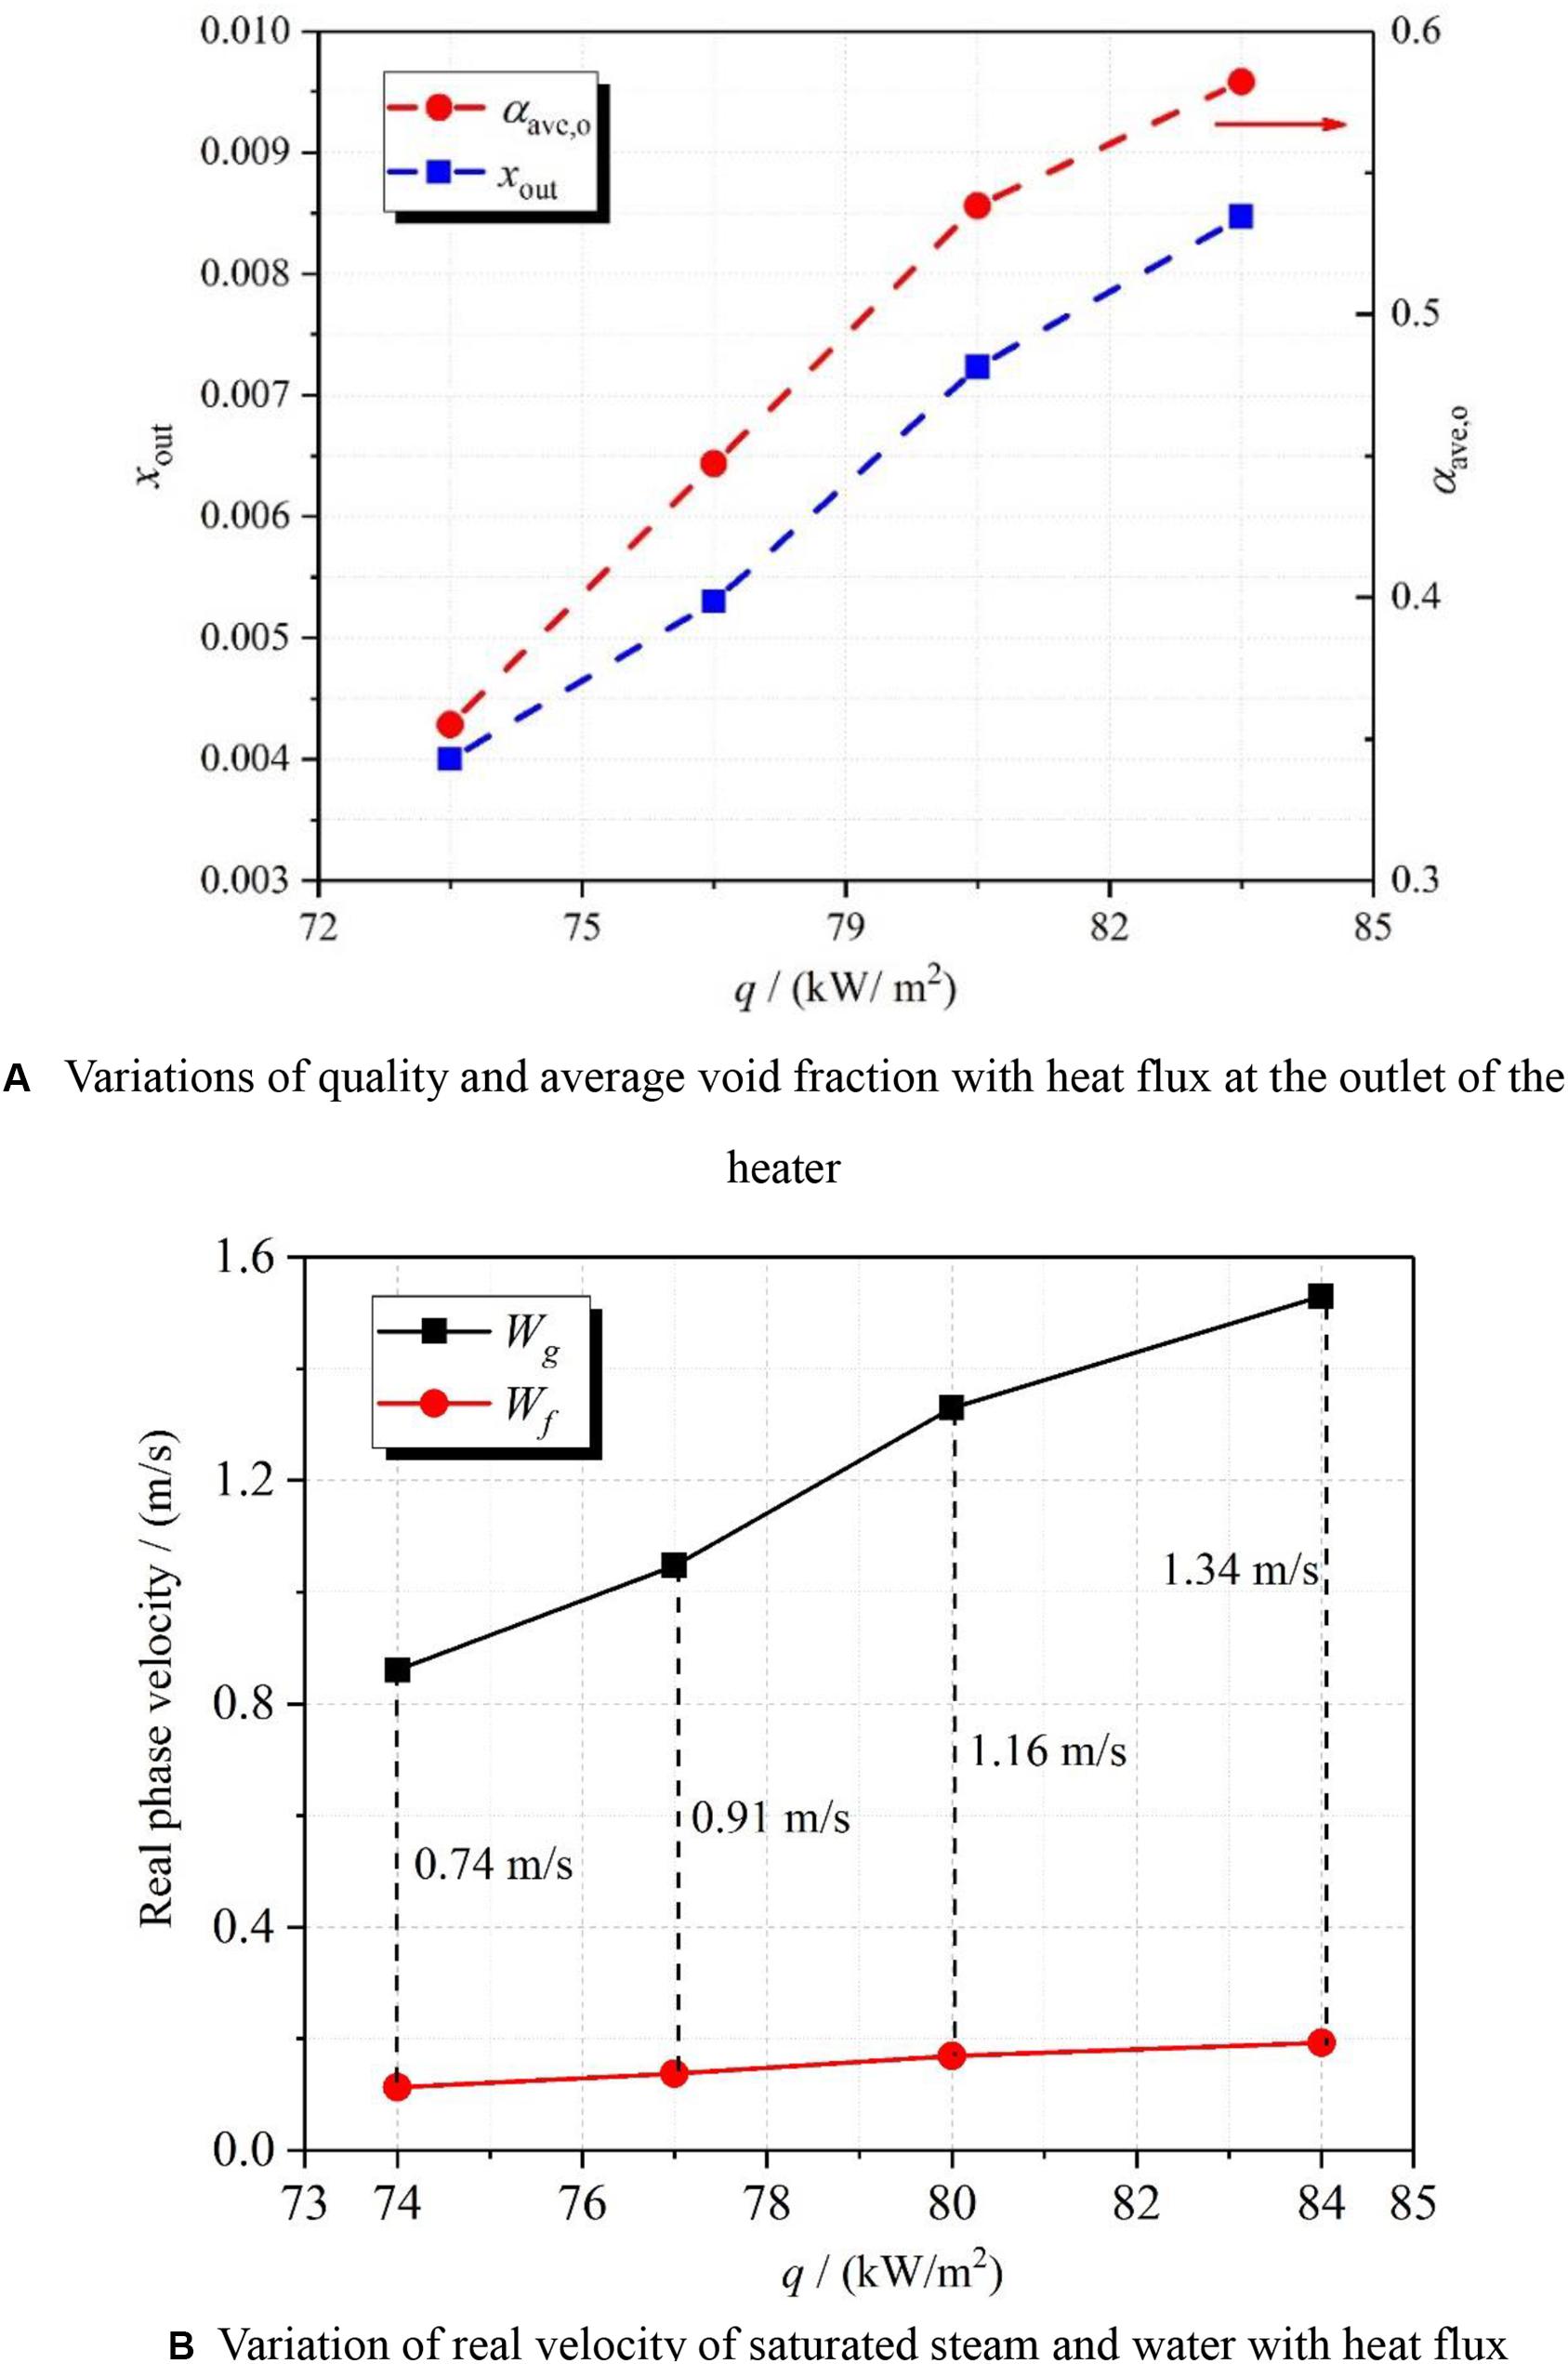
Figure 8. Variations of outlet parameters with heat flux. (A) Variations of quality and average void fraction with heat flux at the outlet of the heater. (B) Variation of real velocity of saturated steam and water with heat flux.
Figure 8B presents the variations of real velocity of each phase with the heat flux. It is seen that both real velocities of saturated steam and saturated water increase with the heat flux. Nevertheless, the increment in the real velocity of saturated steam is far greater than that of saturated water. Namely, the slip velocity of saturated steam and water increases with the increase of heat flux.
The influence of heat flux on DCC can be concluded as having two aspects. One is the increase in the real velocity of saturated water. This means that the kinetic energy of saturated water is larger at a higher heat flux. The wave height of backwater increases while the hydraulic jump happens. The other is the increase in the slip velocity. It will further increase the wave height, which contributes to forming the slug steam in the horizontal hot pipe. Therefore, occurrence frequency of Type II DCC is larger at a higher heat flux. Moreover, the average void fraction increases by increasing the heat flux, as depicted in Figure 8A. It is suggested that the condensation area A (see Figure 6A) is larger at a higher void fraction for the stratified flow. When Type II DCC occurs at a higher heat flux, the difference between the pressure in steam slug and system pressure is larger because of the increase in the condensation capacity at the condensation area A. The pressure difference promotes the increase in reverse flow length based on the analysis in section “Type II DCC Phenomenon.” Thus, the reverse flow length will increase with the increase in the heat flux.
Influence of Heat Flux on Flow Rate
According to the results in section “Influence of Heat Flux on Fluid Temperature,” the reverse flow length of the subcooled water tends to increase because of Type II DCC. In order to further study the influence of heat flux on the flow rate, Figure 9 shows the scope map of the flow rate at a different heat flux.
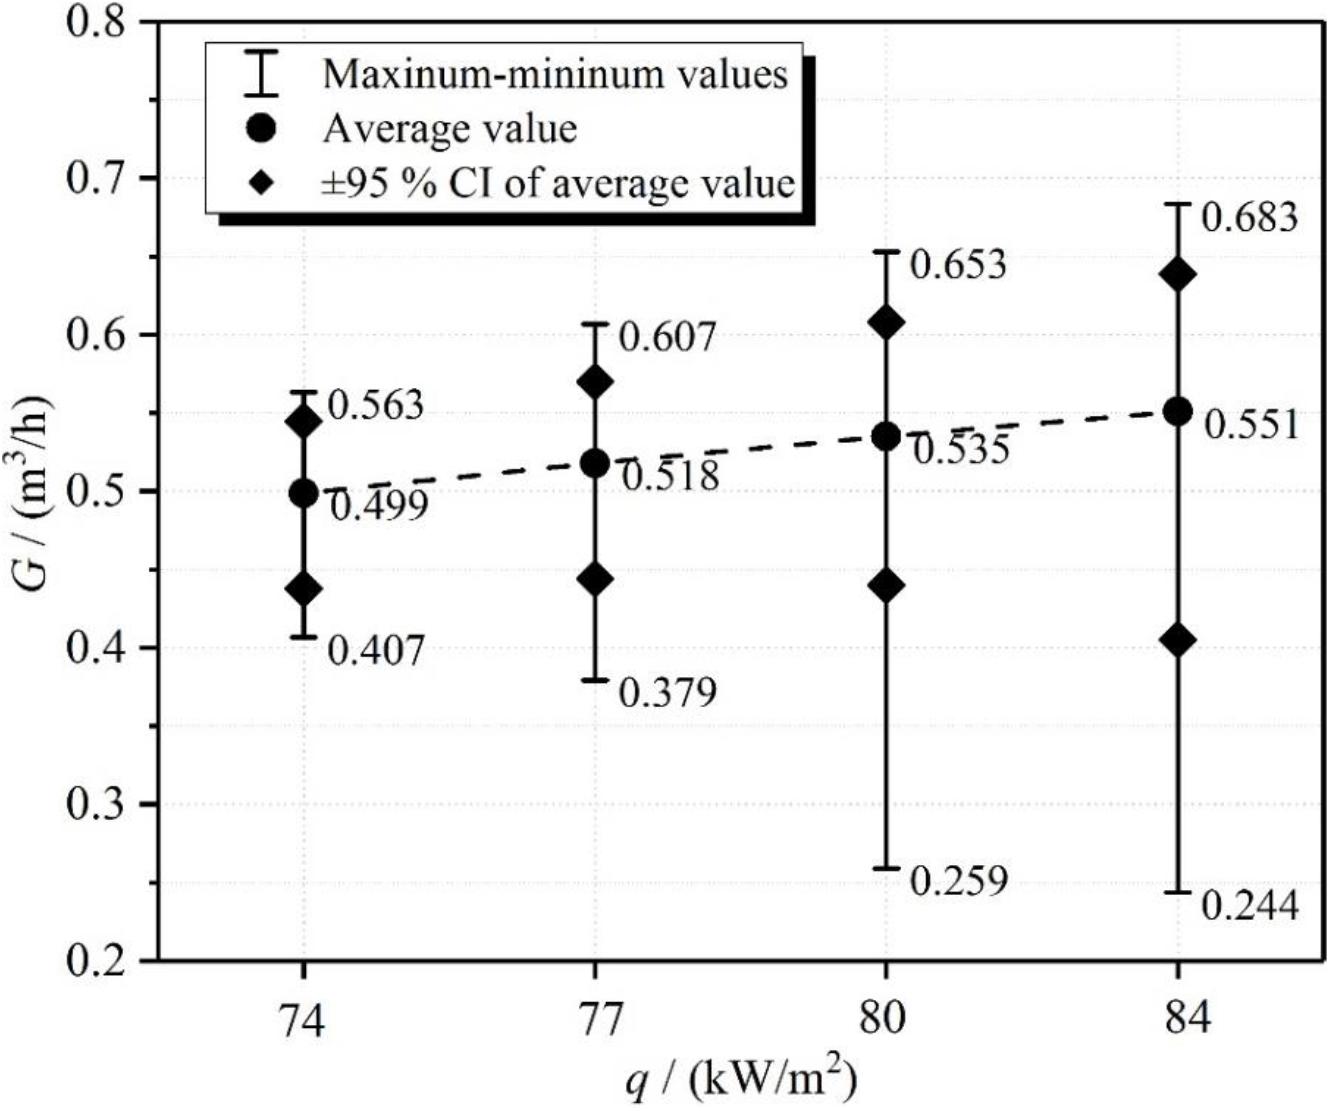
Figure 9. Variations of flow rate with heat flux.
From Figure 9, it is seen that the average flow rate has a slight increase with the increase of heat flux. Owing to the increase of heat flux, the average void fraction has a significant increase at the outlet of the heated section. It means that the average void fraction of the heater is larger at higher heat flux. However, since the NCS does not have the adiabatic riser, the driving force is only formed by the density difference between the heater and the water tank. Thus, the average flow rate has no significant increase, even though the average void fraction increases significantly. This is the result of the structural arrangement of the NCS.
However, it is clear that the fluctuation range of flow rate appreciably enlarges with the increase of the heat flux through the distribution of maximum and minimum values. A similar result can be obtained from the 95% confidence interval (CI) of the average flow rate. It adequately indicates that the flow rate is more unstable at a higher heat flux.
According to the results in Figures 7, 8, it is shown that the reverse flow length of subcooled water is larger at a higher heat flux due to the occurrence of Type II DCC. The increase in the reverse flow length of the subcooled water means the increase in the increment of flow resistance, which results in further reduction of the flow rate. In contrast, the average void fraction of the heater further increases. In that way, when the flow rate picks up, it can reach an instantaneous higher level. Therefore, the fluctuation range of flow rate gradually increases. This is the result of the effect of Type II DCC on the NCS. In conclusion, with the increase of heat flux, the natural circulation flow system tends to enhance flow instability.
Influence of Inlet Temperature and Resistance on NCS
To investigate the influence of initial parameters including inlet temperature and resistance on the flow characteristic, three comparative experiments were undertaken. The initial parameters of these experiments are shown in Table 2. Thereinto, the influence of inlet temperature is emphatically discussed by cases 1 and 2. The influence of inlet resistance coefficient is analyzed in depth through experimental cases 2 and 3.
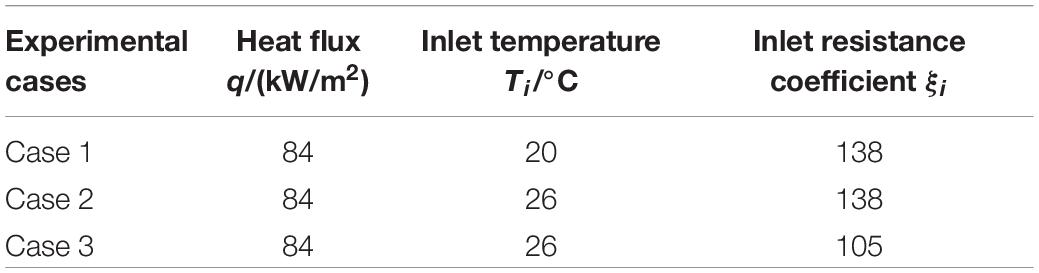
Table 2. Initial parameters of experimental cases.
Temperature Characteristics at Different Cases
Figure 10 gives the changes of temperature with time at the position of T5 under different experimental cases. From Figures 10A,B, it is found that a lower inlet temperature (Ti = 20°C) has a larger fluctuation amplitude, which indicates that the reverse flow length of the subcooled water has a larger instantaneous maximum as a Type II DCC phenomenon occurs. Different from this result, when the inlet resistance decreases to 105, the fluid temperature is equal to the saturated temperature and has no obvious fluctuation, as illustrated in Figure 10C. It indicates that the reverse flow length of the subcooled water further decreases to the region of T5 and the water tank. Consequently, the fluid temperature, at the position of T5, is not affected by the reverse flow of the subcooled water.
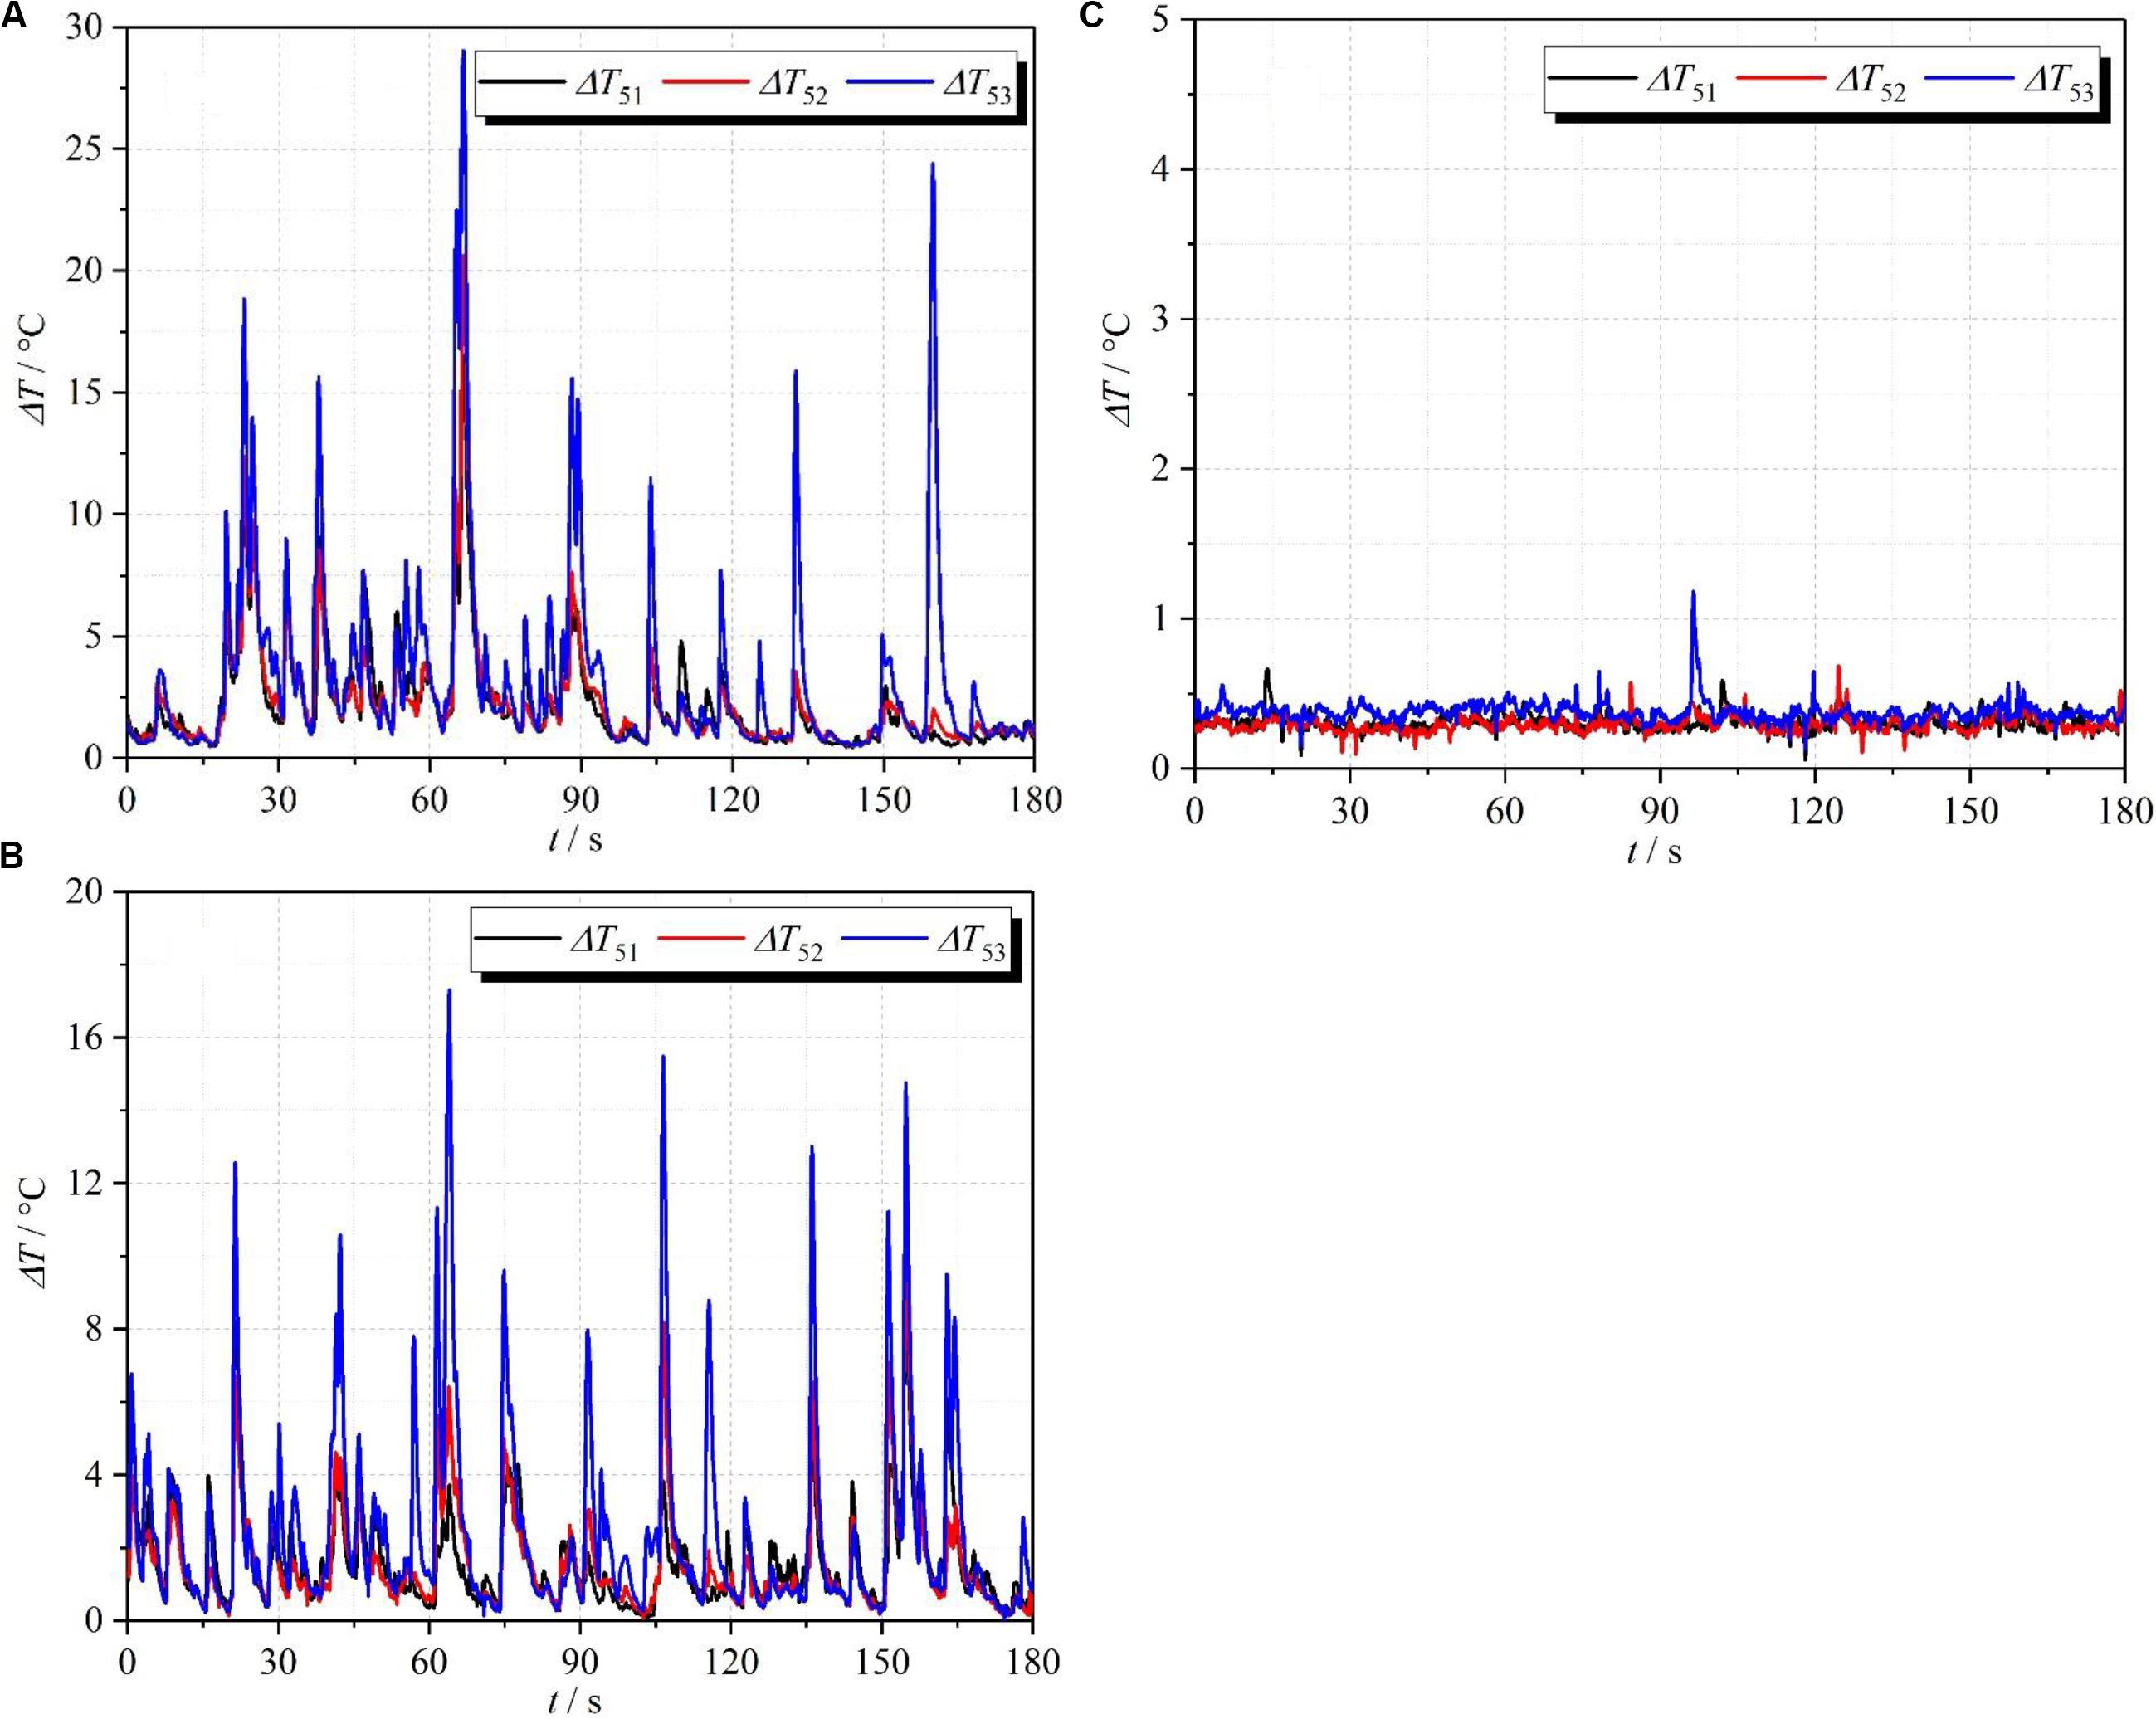
Figure 10. Variations of subcooled degree with time under different inlet resistance and temperature: (A) Case 1; (B) Case 2; (C) Case 3.
Flow Rate Characteristics at Different Cases
According to the analysis above, the fluctuation in flow rate is directly related to the reverse flow caused by the Type II DCC. The fluctuation range of fluid temperature is positively related to that of flow rate. As a consequence, when the inlet resistance coefficient is unchanged, the range of flow rate is larger at lower inlet temperatures (Ti = 20°C), as illustrated in Figure 11 (see cases 1 and 2). It indicates that the NCS is more unstable at lower inlet temperatures. Moreover, when the inlet temperature is same, the reverse flow length has a significant decrease as the inlet resistance coefficient decreases to 105. Thus, the range of flow rate has an obvious reduction, as shown in Figure 11 (see cases 2 and 3). It means that the NCS tends to be made more unstable by increasing the inlet resistance.
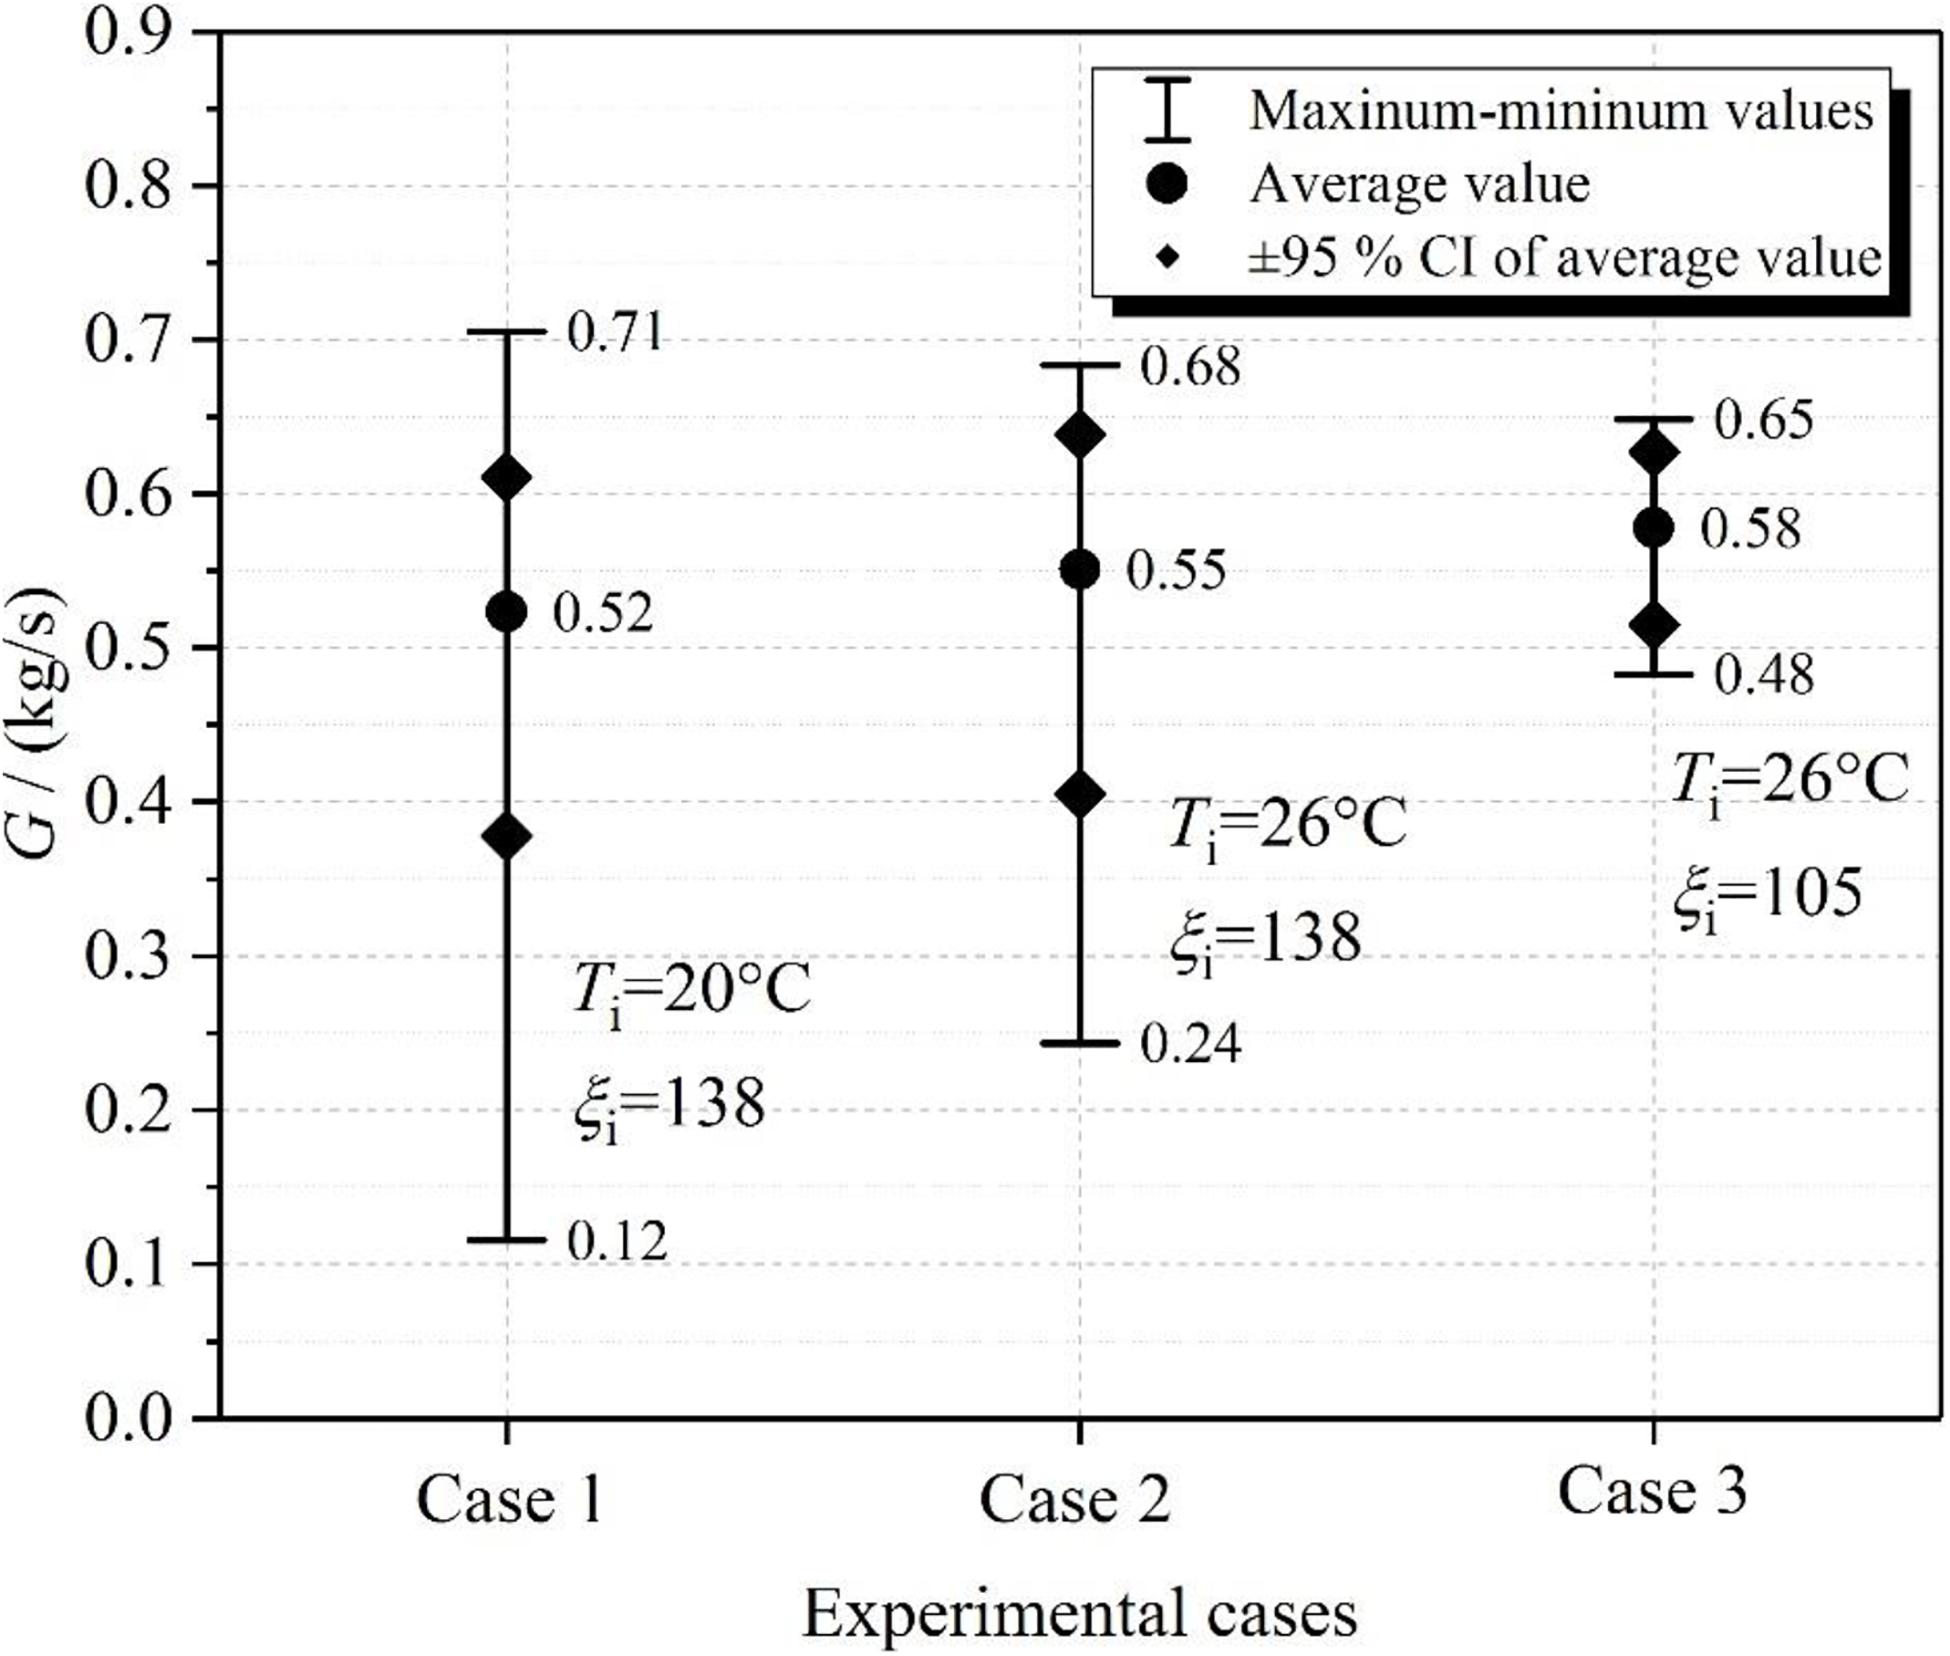
Figure 11. Distribution of flow rate with different experimental cases.
Further Analysis of the Influence of Inlet Resistance
To further analyze the influence of the inlet resistance on the fluid temperature and flow rate, Figure 12 illustrates the distribution of average void fraction and real velocity of each phase at the outlet of the heater. Firstly, for the NCS, when the inlet temperature and heat flux are unchanged, the increase in the inlet resistance will cause the decrease in the flow rate and then result in the increase in the average void fraction at the outlet of the heater. This is the result of the adaptive mechanism of the natural circulation system in response to the increase in the inlet resistance.
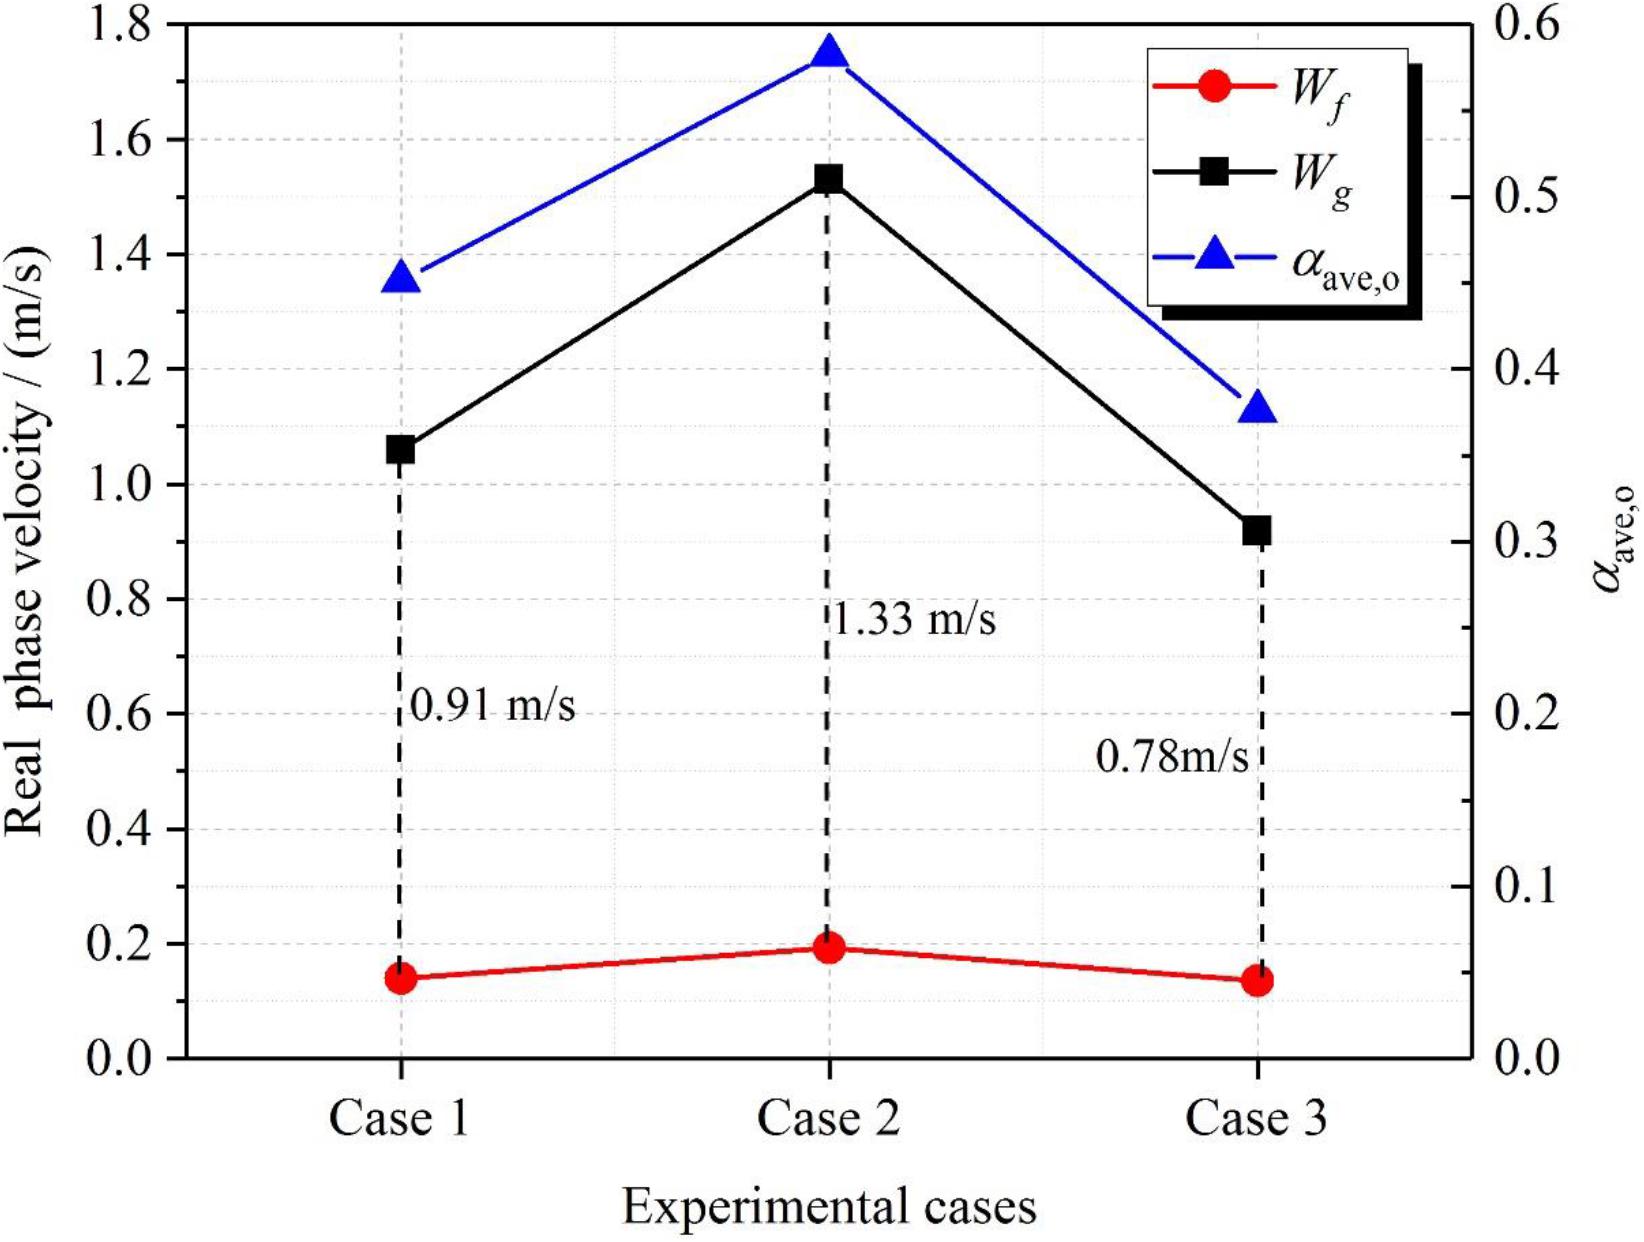
Figure 12. Distribution of average void fraction with different experimental cases.
Secondly, both real velocity of saturated water and two-phase slip velocity increase with the increase in the inlet resistance, as shown in Figure 12 (see cases 2 and 3). According to the results in section “Influence of Heat Flux on the Flow Characteristics,” the increase in the real velocity of saturated water contributes to the increase in wave height. The increase of the slip velocity is more likely to lead to Kelvin-Helmholtz instability, which can further increase wave height. Thus, Type II DCC more easily occurs at higher inlet resistance. Thirdly, similar to the results section “Influence of Heat Flux on Fluid Temperature,” a higher void fraction results in a larger condensation capacity at the condensation area. Then reverse flow length of the subcooled water will increase accordingly when Type II DCC occurs. As a consequence, the increasing resistance coefficient enhances the fluctuation amplitude of fluid temperature and flow rate. That is to say, for the same heating power and inlet temperature, the natural circulation system tends to be more unstable as the inlet resistance is increased.
Further Analysis of the Influence of Inlet Temperature
When the inlet resistance and heat flux are unchanged, the average void fraction, velocity of saturated water and two-phase slip velocity increase by increasing the inlet temperature, as indicated in Figure 12 (see cases 1 and 2). Whereas, both fluctuation amplitude of the fluid temperature and the fluctuation range of the flow rate increase at lower inlet temperature. Depending on the results in section “Further Analysis of the Influence of Inlet Resistance,” this result seems to contradict the conclusion obtained by preliminary analysis.
Actually, since the water tank is utilized to simulate the ocean, the water temperature in the water tank is uniform. Figure 13 shows the distribution of the water temperature in the water tank at different inlet temperatures. As can be seen, the water temperature is basically the same at the inlet of the heater and the outlet of the horizontal hot pipe for each case. In other words, when the inlet temperature increases, it indicates that the subcooled degree of subcooled water synchronously decreases when the DCC phenomena occur in the horizontal hot pipe.
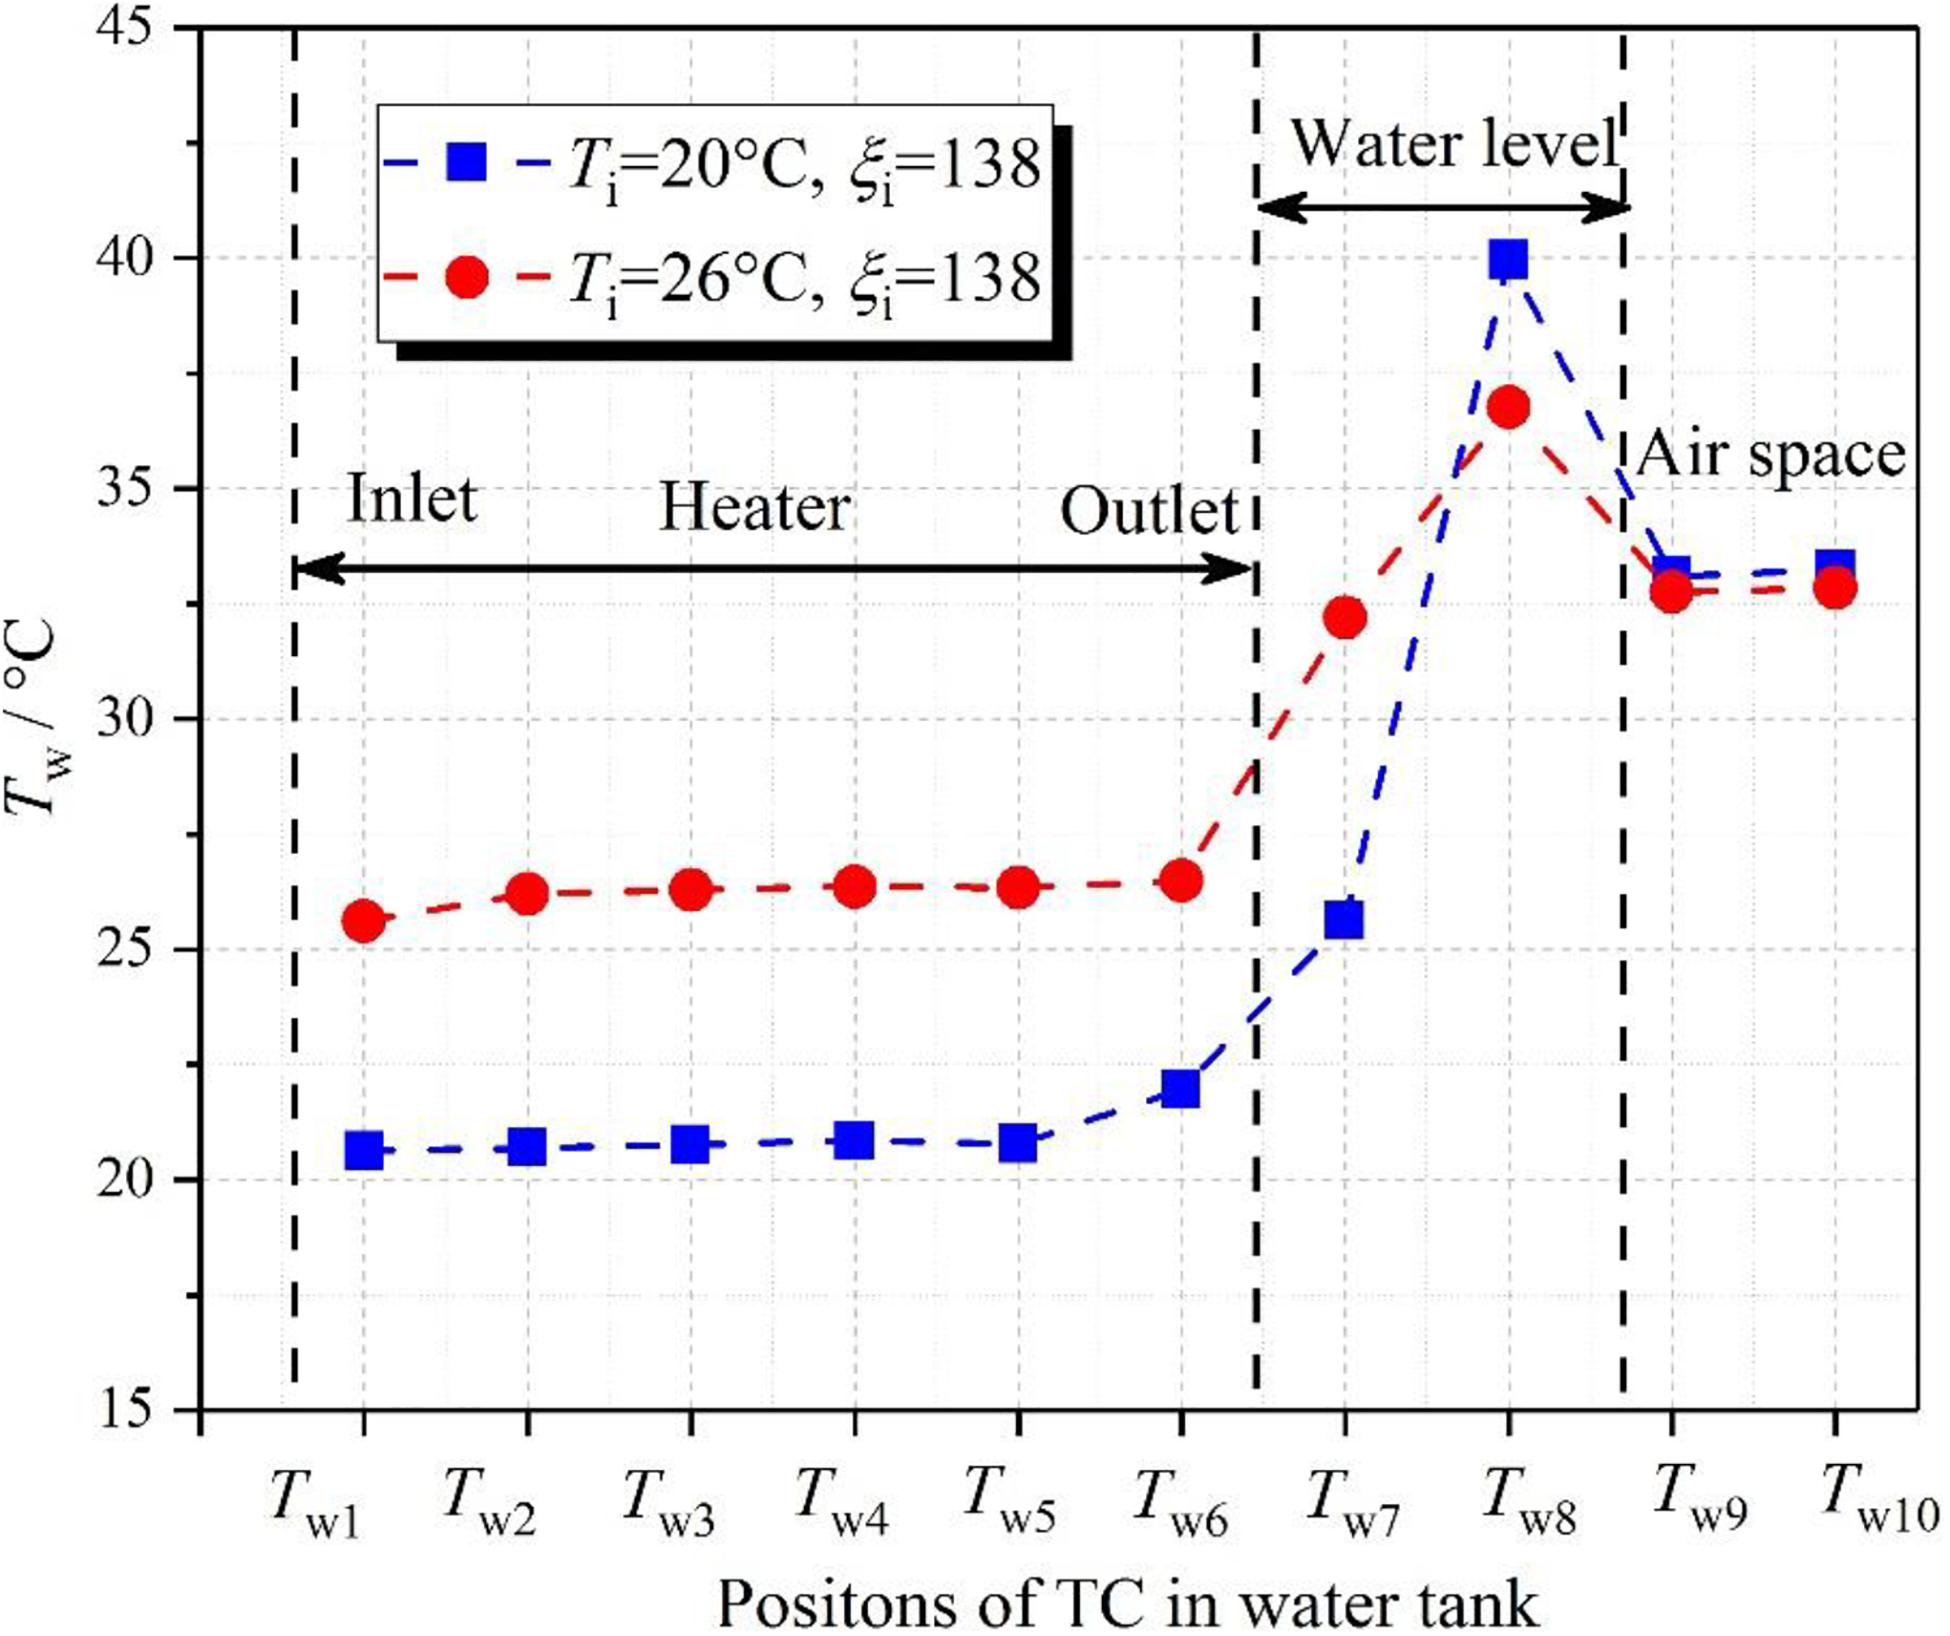
Figure 13. Distributions of water temperature in the water tank.
Consequently, the influence of inlet temperature on the flow rate and fluid temperature can be concluded as having two contrary aspects: one is the increase in void fraction, velocity of saturated water and slip velocity in case of a higher inlet temperature (Ti = 26°C). The changes of these outlet parameters can result in the increase in the reverse flow length caused by Type II DCC as has been noted in section “Influence of Heat Flux on Fluid Temperature,” which will enhance the flow instability of the NCS. The other is the decrease of subcooled degree of the subcooled water. Relevant studies have showed that the condensation rate of DCC increases with the increase in the subcooled degree of subcooled water (Datta et al., 2018). For the NCS, the increase in the inlet temperature means that the subcooled degree of subcooled water, where it condenses, the saturated steam decreases. It results in the decrease of the interface condensation rate Γ in Figure 6, which will inhibit the reverse flow caused by DCC phenomena. In conclusion, when DCC phenomena occur, the influence of the inlet temperature on flow characteristics of the NCS should comprehensively consider the effect of the outlet parameters and the change in the subcooled degree of subcooled water.
Conclusion
The DCC phenomenon appearing in an NCS was experimentally studied. The flow behaviors of NCS were observed and analyzed along with DCC phenomena in this paper. On the basis of this, a series of experiments were performed to analyze the parametric effects on the NCS for in-depth. The main conclusions that can be drawn are:
(1) The behaviors of two types of DCC phenomena are observed in the NCS under two-phase flow. Type I DCC occurs in stratified flow, while Type II DCC occurs in slug flow. Moreover, the CIWH phenomenon may appear when Type II DCC occurs.
(2) The reverse flow length of subcooled water, causing by Type II DCC, is larger than that of Type I DCC due to the additional driving force producing by the pressure difference between the pressure in the steam slug and the system pressure. Moreover, the oscillation amplitude of flow rate, causing by Type II DCC, is larger at the same case.
(3) With the increase in the heat flux, both saturated water velocity and two-phase slip velocity increase, which contribute to forming the interface wave and increasing the wave height, respectively. Type II DCC is more likely to occur. The reverse flow length of subcooled water increases because of the increase in the void fraction. The NCS is more unstable because of the increase in the heat flux.
(4) When the inlet resistance increases, the void fraction and two-phase slip velocity have a significant increase. The reverse flow length significantly increases as Type II DCC occurs, the NCS is generally more unstable at higher inlet resistance.
(5) The influence of inlet temperature on the flow rate includes two aspects: one is that the increase in the inlet temperature results in the increase of the slip velocity and void fraction, which enhances the flow instability. The other is that the decrease in subcooled degree causes the decrease in the condensation rate of DCC, which is conducive to the stable operation of the NCS.
Data Availability Statement
The raw data supporting the conclusions of this article will be made available by the authors, without undue reservation, to any qualified researcher.
Author Contributions
JS designed the experiments and wrote the manuscript. XR designed and carried out the experiments. ZZ carried out experiments. XC processed the experimental data. GF reviewed the literature. MD analyzed the experimental results. All authors contributed to the article and approved the submitted version.
Funding
The authors are profoundly grateful to the financial supports of the National Natural Science Foundation Projects of China (Nos. 11605033 and 11875117).
Conflict of Interest
The authors declare that the research was conducted in the absence of any commercial or financial relationships that could be construed as a potential conflict of interest.
Abbreviations
CIWH, condensation induced water hammer; DCC, direct contact condensation; FNPP, floating nuclear power plant; HTC, heat transfer coefficient; LOCA, loss of coolant accident; LWR, light water reactor; NCS, natural circulation system; NMR, novel modular reactor; NPP, nuclear power plants; PCCS, passive containment cooling system; TC, thermocouple.
References
Ceuca, S. C., and Laurinavicius, D. (2016). Experimental and numerical investigations on the direct contact condensation phenomenon in horizontal flow channels and its implications in nuclear safety. Kerntechnik 81, 504–511. doi: 10.3139/124.110729
Chavaraddi, K. B., Awati, V. B., Katagi, N. N., and Gouder, P. M. (2016). Effect of magnetic field on Kelvin-Helmholtz instability in a couple-stress fluid layer bounded above by a porous layer and below by a rigid surface. Appl. Math. 07, 2021–2032.
Chen, L., Deng, B. L., and Zhang, X. R. (2013). Experimental study of trans-critical and supercritical CO2 natural circulation flow in a closed loop. Appl. Ther. Eng. 59, 1–13. doi: 10.1016/j.applthermaleng.2013.05.017
Chu, I. C., Chung, M.K., Yu, S. O., and Chun, M. H. (2000). Interfacial condensation heat transfer for countercurrent steam-water stratified flow in a circular pipe. Nuclear Eng. Technol. 32, 142–156.
Datta, P., Chakravarty, A., Ghosh, K., Mukhopadhyay, A., and Sen, S. (2018). Modeling of steam–water direct contact condensation using volume of fluid approach. Num. Heat Transfer Part A Appl. 73, 17–33. doi: 10.1080/10407782.2017.1420308
Datta, P., Chakravarty, A., Ghosh, K., Mukhopadhyay, A., Sen, S., Dutta, A., et al. (2016). A numerical analysis on the effect of inlet parameters for condensation induced water hammer. Nuclear Eng. Des. 304, 50–62. doi: 10.1016/j.nucengdes.2016.04.035
Furuya, M., Inada, F., and van der Hagen, T. H. J. J. (2005). Flashing-induced density wave oscillations in a natural circulation BWR—mechanism of instability and stability map. Nuclear Eng. Des. 235, 1557–1569. doi: 10.1016/j.nucengdes.2005.01.006
Gima, S., Nagata, T., Zhang, X., and Fujii, M. (2005). Experimental study on CPU cooling system of closed-loop two-phase thermosyphon. Heat Transfer Asian Res. 34, 147–159. doi: 10.1002/htj.20057
Guo, X., Sun, Z., Wang, J., and Yu, S. (2017). Scaling analyses for the open flashing-driven natural circulation system. Nuclear Eng. Des. 324, 111–121. doi: 10.1016/j.nucengdes.2017.08.024
Hou, X., Sun, Z., and Lei, W. (2017). Capability of RELAP5 code to simulate the thermal-hydraulic characteristics of open natural circulation. Ann. Nuclear Energy 109, 612–625. doi: 10.1016/j.anucene.2017.06.010
Jiang, N., Peng, M., and Cong, T. (2018). Simulation analysis of an open natural circulation for the passive residual heat removal in IPWR. Ann. Nuclear Energy 117, 223–233. doi: 10.1016/j.anucene.2018.03.037
Lee, K.-W., Chu, I.-C., Yu, S.-O., and No, H. C. (2006). Interfacial condensation for countercurrent steam–water stratified wavy flow in a horizontal circular pipe. Int. J. Heat Mass Transfer 49, 3121–3129. doi: 10.1016/j.ijheatmasstransfer.2006.02.017
Li, S. Q., Lu, T., Wang, L., and Chen, H. S. (2017). Experiment study on steam-water direct contact condensation in water flow in a Tee junction. Appl. Therm. Eng. 120, 99–106. doi: 10.1016/j.applthermaleng.2017.03.127
Mandhane, J. M., Gregory, G. A., and Aziz, K. (1974). A flow pattern map for gas—liquid flow in horizontal pipes. Int. J. Multiph. Flow 1, 537–553.
Mignot, E., and Rivière, N. (2010). Bow-wave-like hydraulic jump and horseshoe vortex around an obstacle in a supercritical open channel flow. Phys. Fluids 22:117105.
Park, H.-S., Choi, K.-Y., Cho, S., Park, C.-K., Yi, S.-J., Song, C.-H., et al. (2007). Experiments on the heat transfer and natural circulation characteristics of the passive residual heat removal system for an advanced integral type reactor. J. Nuclear Sci. Technol. 44, 703–713. doi: 10.1080/18811248.2007.9711859
Park, H.-S., Choi, S.-W., and No, H. C. (2009). Direct-contact condensation of pure steam on co-current and counter-current stratified liquid flow in a circular pipe. Int. J. Heat Mass Transfer 52, 1112–1122. doi: 10.1016/j.ijheatmasstransfer.2008.08.033
Shi, S., and Ishii, M. (2017). Modeling of flashing-induced flow instabilities for a natural circulation driven novel modular reactor. Ann. Nuclear Energy 101, 215–225. doi: 10.1016/j.anucene.2016.11.005
Singh, S., Singal, G., and Nayak, A. K. (2017). Numerical investigation on the natural circulation thermal hydraulic characteristics of a pressure tube type boiling water reactor. Nuclear Sci. Eng. 187, 185–201. doi: 10.1080/00295639.2017.1307048
Štrubelj, L., Ézsöl, G., and Tiselj, I. (2010). Direct contact condensation induced transition from stratified to slug flow. Nuclear Eng. Des. 240, 266–274. doi: 10.1016/j.nucengdes.2008.12.004
Su, G., Jia, D., and Fukuda, K. (2002). Theoretical and experimental study on density wave oscillation of two-phase natural circulation of low equilibrium quality. Nuclear Eng. Des. 215, 187–198.
Sun, J., Lu, C., Mi, Z., Cao, X., and Ding, M. (2020). Experimental research on characteristics of condensation induced water hammer in natural circulation systems. Int. Commun. Heat Mass Transfer 114:104559. doi: 10.1016/j.icheatmasstransfer.2020.104559
Tecchio, C., Oliveira, J. L. G., Paiva, K. V., Mantelli, M. B. H., Galdolfi, R., and Ribeiro, L. G. S. (2017). Geyser boiling phenomenon in two-phase closed loop-thermosyphons. Int. J. Heat Mass Transfer 111, 29–40. doi: 10.1016/j.ijheatmasstransfer.2017.03.092
Tong, L. L., Shao, G., Yuan, K., and Cao, X. W. (2014). An experimental study on geysering phenomena induced by buoyancy in a heating system. Ann. Nuclear Energy 63, 129–137. doi: 10.1016/j.anucene.2013.07.011
Urban, C., and Schlüter, M. (2014). Investigations on the stochastic nature of condensation induced water hammer. Int. J. Multiph. Flow 67, 1–9. doi: 10.1016/j.ijmultiphaseflow.2014.08.001
Vijayan, P. K., Sharma, M., and Saha, D. (2007). Steady state and stability characteristics of single-phase natural circulation in a rectangular loop with different heater and cooler orientations. J. Exp. Therm. Fluid Sci. 31, 925–945.
Wu, J., Bi, Q., and Zhou, C. (2015). Experimental study on circulation characteristics of secondary passive heat removal system for Chinese pressurized water reactor. Appl. Therm. Eng. 77, 106–112. doi: 10.1016/j.applthermaleng.2014.12.014
Yan, X., Fan, G., and Sun, Z. (2017). Study on flow characteristics in an open two-phase natural circulation loop. Ann. Nuclear Energy 104, 291–300. doi: 10.1016/j.anucene.2016.12.038
Yih, C.-S., and Guha, C. R. (1955). Hydraulic jump in a fluid system of two layers. Tellus 7, 358–366.
Nomenclature
| Ah | Flow area of the horizontal hot pipe, m2 |
| G | Flow rate, m3/h |
| H | Water level, m |
| h | Enthalpy, kJ/kg |
| j | Superficial velocity, m/s |
| M | Mass flow, kg/s |
| Q | Heating power, kW |
| q | Heat flux, kW/m2 |
| T | Temperature, °C |
| ΔT51, ΔT52, ΔT53 | Subcooled degree of fluid at the position of T5, °C |
| W | Flow velocity, m/s |
| xeq | Equilibrium quality |
| xT | True quality |
| xout | Steam quality |
Greek symbols
| α | Void fraction |
| ξ | Resistance coefficient |
| ρ | Density, kg/m3 |
| σ | Surface tension, N/m2 |
| Γ | Condensation rate, kg/(m2s) |
Subscripts
| ave | average value |
| f | liquid phase |
| fg | potential from liquid phase to steam phase |
| g | steam phase |
| i | inlet of the heater |
| o | outlet of the heater |
| sat | saturation |
| w | water tank |
Keywords: direct contact condensation, two-phase flow, natural circulation system, interface wave, low pressure
Citation: Sun J, Ran X, Zhang Z, Cao X, Fan G and Ding M (2020) Effects of Direct Contact Condensation on Flow Characteristics of Natural Circulation System at Low Pressure. Front. Energy Res. 8:173. doi: 10.3389/fenrg.2020.00173
Received: 15 May 2020; Accepted: 06 July 2020;
Published: 10 September 2020.
Edited by:
Xiaojing Liu, Shanghai Jiao Tong University, ChinaReviewed by:
Luteng Zhang, Chongqing University, ChinaKeyou S. Mao, Oak Ridge National Laboratory (DOE), United States
Copyright © 2020 Sun, Ran, Zhang, Cao, Fan and Ding. This is an open-access article distributed under the terms of the Creative Commons Attribution License (CC BY). The use, distribution or reproduction in other forums is permitted, provided the original author(s) and the copyright owner(s) are credited and that the original publication in this journal is cited, in accordance with accepted academic practice. No use, distribution or reproduction is permitted which does not comply with these terms.
*Correspondence: Jianchuang Sun, sunjianchuang@hrbeu.edu.cn; Ming Ding, dingm2005@gmail.com