Littoral Sediment From Rivers: Patterns, Rates and Processes of River Mouth Morphodynamics
 Jonathan A. Warrick
- U.S. Geological Survey, Pacific Coastal and Marine Science Center, Santa Cruz, CA, United States
Rivers provide important sediment inputs to many littoral cells, thereby replenishing sand and gravel of beaches around the world. However, there is limited information about the patterns and processes of littoral-grade sediment transfer from rivers into coastal systems. Here I address these information gaps by examining topographic and bathymetric data of river mouths and constructing sediment budgets to characterize time-dependent patterns of onshore, offshore, and alongshore transport. Two river deltas, which differ in their morphology, were used in this study: the Elwha River, Washington, which builds a mixed sediment Gilbert-style delta, and the Santa Clara River, California, which builds a cross-shore dispersed sand delta from hyperpycnal flows. During and after sediment discharge events, both systems exhibited a similar evolution composed of three phases: (i) submarine delta growth during offshore transport of river sediment, (ii) onshore-dominated transport from the submarine delta to a subaerial river mouth berm, and (iii) longshore-dominated transport away from the river mouth following subaerial berm development. Although stage (ii) occurred within days to weeks for the systems studied and was associated with the greatest rates of net erosion and deposition, onshore transport of sediment from submarine deposit to the beach persisted for years following the river discharge event. These morphodynamics were similar to simple equilibrium profile concepts that were modified with an onshore-dominated cross-shore transport rule. Additionally, both study sites revealed that littoral-grade sediment was initially exported to depths beyond the active littoral cell (i.e., below the depth of closure) during the stage (i). Following several years of reworking by coastal processes, bathymetric surveys suggested that 14 and 46% of the original volume of littoral-grade sediment discharged by the Santa Clara and Elwha Rivers, respectively, continued to be below the depth of closure. Combined, this suggests that integration of river sediment into a littoral cell can be a multi-year process and that the full volume of littoral-grade sediment discharged by small rivers may not be integrated into littoral cells because of sand and gravel “losses” to the continental shelf.
“The river to the ocean goes, a fortune for the undertow.”
–Michael Stipe
Introduction
Beaches are dynamic landforms that provide valuable functions as habitats, recreation sites, and storm protection along the world’s coasts (Inman and Brush, 1973; Komar, 1998). As low-lying coastal landforms, beaches will be highly vulnerable to erosion and flooding during future sea-level rise resulting from climate change (FitzGerald et al., 2008; Vitousek et al., 2017). Beaches also respond to supplies, losses and exchanges of sediment, a mass balance that is commonly referred to as the littoral cell “sediment budget,” and modifications to sediment budgets can have large effects on shoreline position and morphology (Komar, 1998; Willis and Griggs, 2003; Falqués, 2006; Limber et al., 2008; Anthony et al., 2014, 2015).
For many coasts, especially those on active tectonic settings, important sources of littoral sediment come from rivers and streams (Milliman and Farnsworth, 2013). For example, rivers sustain sediment budgets of littoral cells around the Pacific Ocean rim, the Mediterranean Sea, Africa, high-standing islands throughout the world, and other inland sea and coastal settings (Inman and Nordstrom, 1971; Komar, 1998, 2010; Anthony and Blivi, 1999; Willis and Griggs, 2003; Giosan et al., 2005; Barnard and Warrick, 2010; Boateng et al., 2012; Anthony et al., 2014). Many active tectonic margin settings are fed by relatively small rivers (watershed areas less than 100,000 km2), which combine to contribute the majority of sediment to the world’s oceans (Milliman and Syvitski, 1992). Additionally, these small watersheds commonly discharge most of their sediment during infrequent events, generally triggered by heavy downpours of rainfall (Hicks and Inman, 1987; Fan et al., 2004; Hicks et al., 2004; Barnard and Warrick, 2010; Carter et al., 2012; Milliman and Farnsworth, 2013; East et al., 2018).
The transfer of river sediment to the sea and the incorporation of this sediment into littoral cells are, therefore, important and dynamic geomorphic processes. Evidence of the links between river supply and coastal sediment budgets abound, and the simple presence of river deltas and many littoral cells are direct results of river sediment (Giosan and Bhattacharya, 2005; Anthony, 2015; Nienhuis et al., 2020). For this reason, alterations of river sediment supplies can change the trajectory of deltas and littoral cells as shown by both reductions of sediment discharge (Anthony et al., 2014, 2015; Pratellesi et al., 2018) and increases of sediment discharge (Kuenzi et al., 1979; Warrick et al., 2019; Nienhuis et al., 2020). Because river sediment is discharged infrequently and the movement of sediment in littoral cells is commonly more constant and driven by ocean waves, distinct stages arise in the evolution of river mouth sediment deposits (Kuenzi et al., 1979; Hicks and Inman, 1987; Cooper, 1993; Giosan and Bhattacharya, 2005; Barnard and Warrick, 2010; East et al., 2018; Measures et al., 2020). An example of these morphodynamics can be observed in aerial imagery of the mouth of Santa Clara River, California, from before and after a large sediment discharge event (Figure 1; cf. Barnard and Warrick, 2010). River sediment was initially deposited in a submarine deltaic bar that is identifiable only by the location of breaking waves (Figure 1b). This sediment was reworked subsequently into subaerial bars that welded to the shoreline, thereby delivering sediment into the littoral cell (Figures 1c,d).
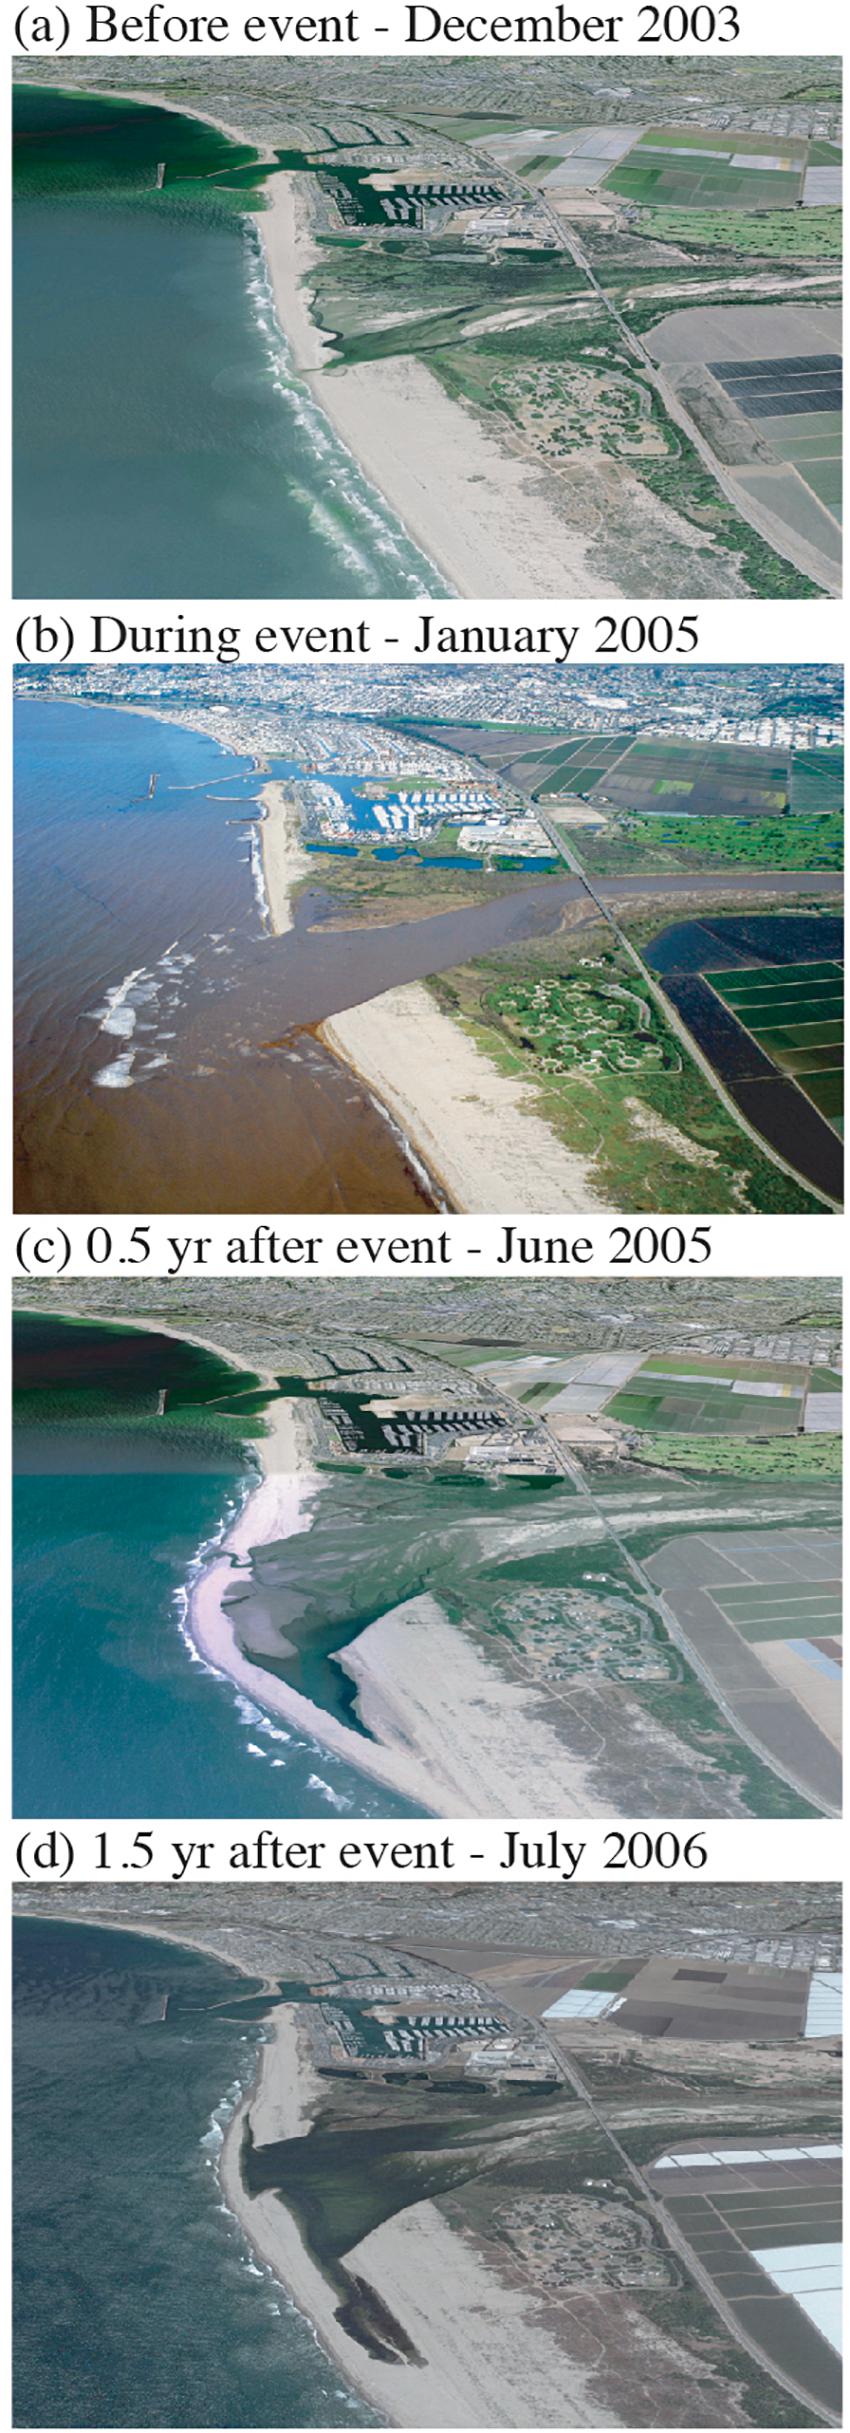
Figure 1. Sediment discharge from the Santa Clara River and reworking of this sediment into river mouth bars as observed from oblique imagery. High flows on the river occurred in January 2005, which deposited sediment at least 500 m offshore of the river mouth as evidenced by breaking waves in panel (b). This sediment was reworked toward the shore as shown during the following 1.5 years (c,d). Imagery sources: (b) aerial photography by California Coastal Conservancy, (a,c,d), Google Earth imagery rotated to the same orientation as the aerial photograph in panel (b).
Although there is an appreciation for the importance of river sediment supplies to littoral sediment budgets, there are relatively few measurements of the sediment transport processes or the morphodynamics from which a generalizable synthesis can be built. Without this understanding of river mouth morphodynamics, most assessments of river sediment supplies utilize simple sediment budget assumptions, whereby all littoral-grade sediment discharged by rivers is assumed to integrate into the littoral cell at the time of discharge (Komar, 1973; Inman and Jenkins, 1999; Willis and Griggs, 2003; Ashton and Giosan, 2011; Ashton et al., 2013; Nienhuis et al., 2016a; Ratliff et al., 2018). Although these assumptions may be reasonable for many rivers and littoral cells, they exclude lags between the discharge of sediment and the incorporation of this sediment to the littoral cell which may occur over seasons to several year intervals (cf. Figure 1; Hicks and Inman, 1987; Giosan et al., 2005; Barnard and Warrick, 2010). Additionally, they exclude the potential for sand and gravel from the river to deposit on the continental shelf or other deep sea areas from plunging hyperpyncal plumes or other cross-shore sediment exchanges (Wright et al., 2002; Mulder et al., 2003; Warrick and Milliman, 2003; Hicks et al., 2004; Khripounoff et al., 2009; Lamb et al., 2010; Casalbore et al., 2011; Liu et al., 2012; Warrick et al., 2013; Steel et al., 2016). These littoral-grade sediments may be considered “lost” from the beach system if they are initially deposited at depths beyond the active littoral cell. For these reasons, it is opportune to explore river-mouth morphodynamics with the goal of developing a better understanding of the transfer of river sediment from river to deltaic deposits to littoral cells.
The goal of this paper is to use recent measurements of the topography and bathymetry of river mouths to develop a more thorough understanding of the patterns, timing and processes of sediment transfer between small rivers and littoral cells. This work is focused primarily on smaller rivers systems of the world (less than ∼100,000 km2 watershed area), which are a major sediment supply to the world’s oceans and shorelines but have received considerably less attention than the larger rivers of the world (Inman and Nordstrom, 1971; Milliman and Syvitski, 1992; Milliman and Farnsworth, 2013). Several fundamental questions are examined: How do coastal profiles at river mouths respond to new contributions of river sediment? How are longshore and cross-shore transport processes related to river mouth morphodynamics and how do they vary with time? Under what conditions will littoral-grade sediments get exported offshore and become “lost” from the littoral cell? What processes should be included in future investigations of river mouth and littoral cell morphodynamics?
To address these questions, this paper will examine the mouths of the Elwha River, Washington and the Santa Clara River, California (Barnard and Warrick, 2010; Warrick and Barnard, 2012; Warrick et al., 2019). Observations of both systems include large sediment discharge events, but they differ in the depositional forms and beach morphology at each site. Results from these systems are compared and used to develop conceptual models that form the basis of simple rules-based geometric models and generalized hypotheses about river mouth morphodynamics.
Materials and Methods
Study Sites
Two river mouths are examined, and each have detailed topographic and bathymetric (“topo-bathy”) surveys both before and after river sediment discharge events. Although both study sites have steep, small watersheds that discharge measurable volumes of sediment to the coast during hydrologic events, they differ in their morphologic, climatic and oceanographic settings.
The first study site is the Elwha River mouth of Washington (48.148° N, 123.567° W), which is located in the Strait of Juan de Fuca west of Ediz Hook (Figure 2). The Elwha River has a 833 km2 watershed draining the interior of the Olympic Mountains, which is a steep, uplifting landscape derived mostly from marine sedimentary, metasedimentary and volcanic rocks (Tabor, 1988; Brandon et al., 1998; Warrick et al., 2011a). Extensive glaciation of this area occurred during the Quaternary, and these glacial processes resulted in an abundance of glacially derived sediment, much of it coarse-grained, throughout the watershed.
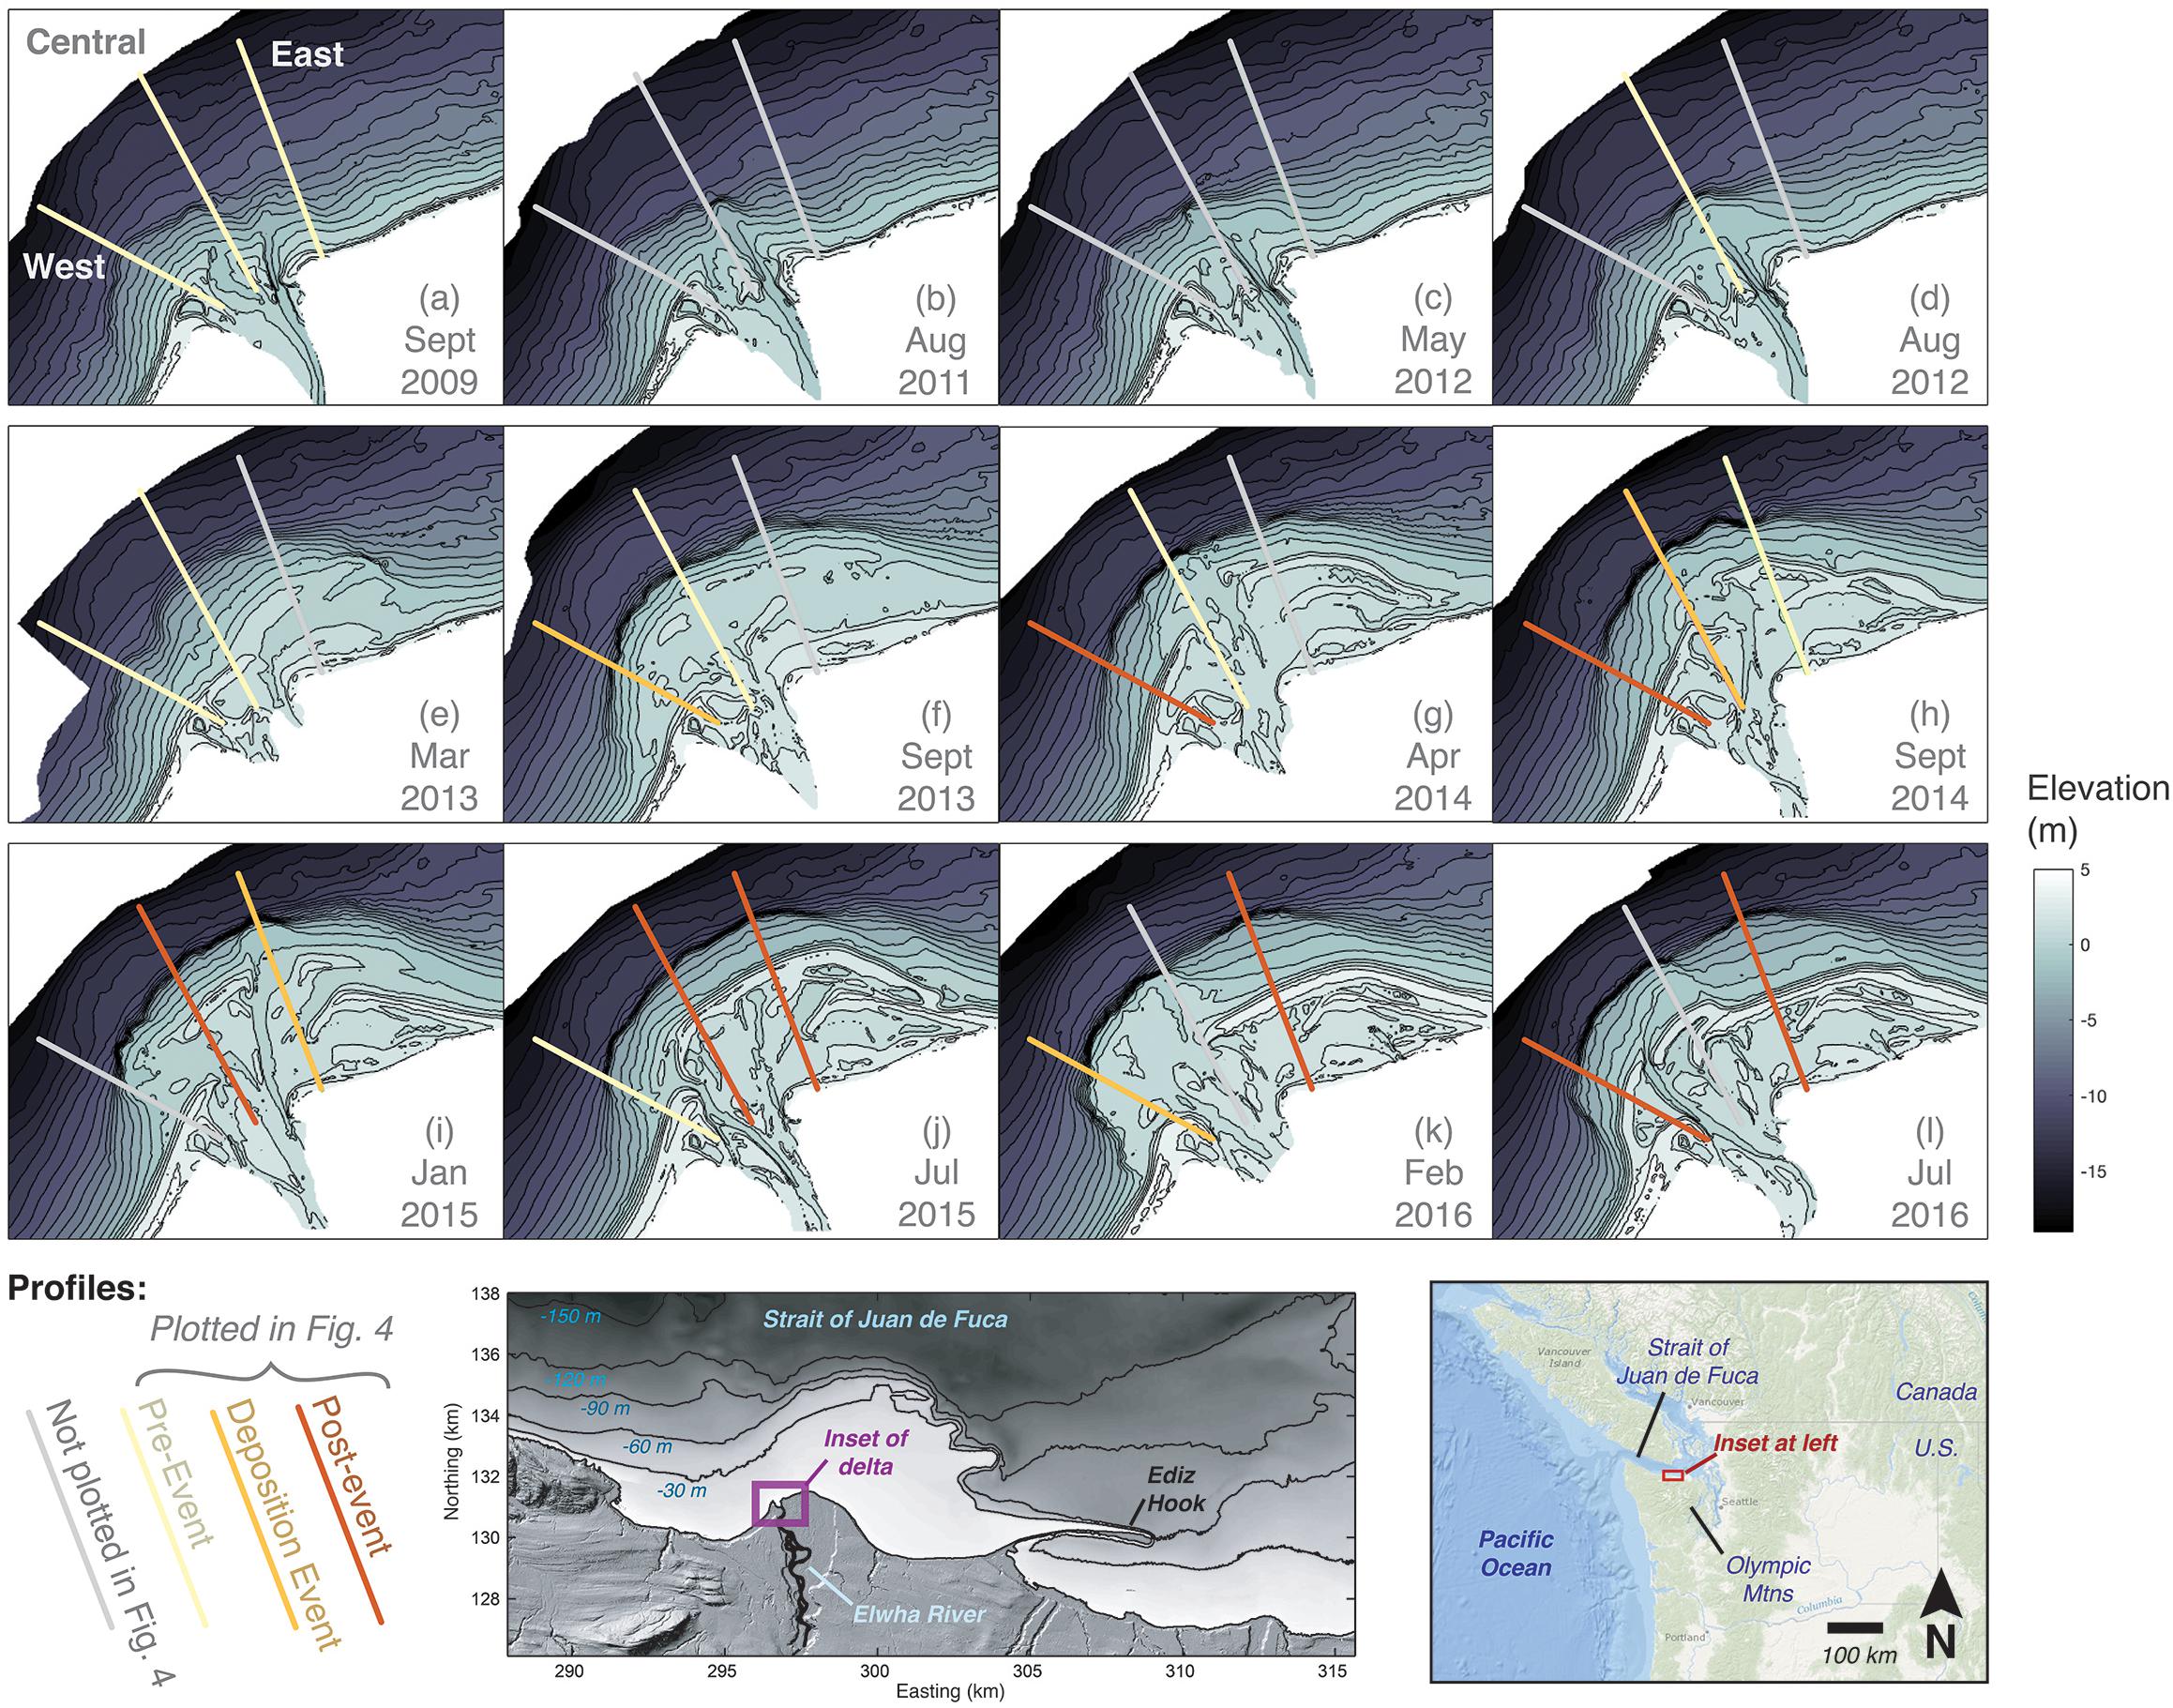
Figure 2. (a–l) Topographic and bathymetric data of the Elwha River mouth of Washington (48.148° N, 123.567° W) collected between 2009 and 2016 that were used for analyses. These data were collected before and after a dam removal project that caused ∼5 million cubic meters of deposition in and around the delta. Three cross-shore profiles (West, Central and East) were chosen for morphodynamic analyses. These profiles were defined as perpendicular to offshore bathymetry and bisecting the new lobes of sediment. The location of the new sediment lobes changed with time as the river course changed. Profiles are coded with colors according to the presentation in Figure 4.
Removal of two dams on the Elwha River between 2011 and 2014 resulted in the exposure, erosion and transfer of tens of millions of cubic meters of sediment, roughly half of which was sand and gravel, from the reservoirs to the downstream river (Ritchie et al., 2018; Warrick et al., 2019). This resulted in sediment discharge to the coast that was one to two orders-of-magnitude greater than pre-dammed rates for several years during and following the dam removals, 5.4 Mt (or, 3.6 million m3) of which was deposited in a newly expanding delta (Ritchie et al., 2018). Although this unnaturally high sediment loading was unique, it is similar in magnitude and scale to increased sediment discharge caused from other natural and human-caused watershed disturbances such as volcanic activity, wildfire, and industrial logging (Gran and Montgomery, 2005; Ritchie et al., 2018).
The coastal setting of the Elwha River within the Strait of Juan de Fuca subjects it to small-to-moderate wave heights (Warrick et al., 2011a, b). Ocean swell is derived from the northern Pacific Ocean and passes through the narrow Strait of Juan de Fuca (Figure 2). Significant wave heights at the river mouth are commonly less than 0.5 m, and wave events occasionally reach 1–2 m (Warrick et al., 2011b). Although the waves heights are generally small, the persistent northwest direction of the waves results in distinct patterns of longshore sediment transport, including transport divergence near the river mouth and strong eastward transport along the shoreline east of the river mouth (Miller et al., 2011; Warrick et al., 2011b, 2019; Miller and Warrick, 2012).
The second study site is the mouth of the Santa Clara River, California (34.232° N, 119.264° W), which discharges into the Pacific Ocean in the eastern Santa Barbara Channel near Ventura (Figure 3). The Santa Clara River drains a 4200 km2 watershed consisting of steep, semi-arid landscape (Warrick and Mertes, 2009). Sediment discharge from the river can be high following heavy rainfall owing to the actively uplifting landscape and weak siltstone, shale and sandstone rocks of the watershed. These conditions produce sediment loading that is ∼80% fine-grained sediment (silt and clay) by weight, the remaining portion being sand and gravel (Warrick and Mertes, 2009). During high flow, the Santa Clara River has suspended-sediment concentrations that exceed 10 s of g/l, which are adequately high to form hyperpycnal (dense, plunging) river discharge conditions from the river mouth to the continental shelf (Warrick and Milliman, 2003; Warrick et al., 2008).
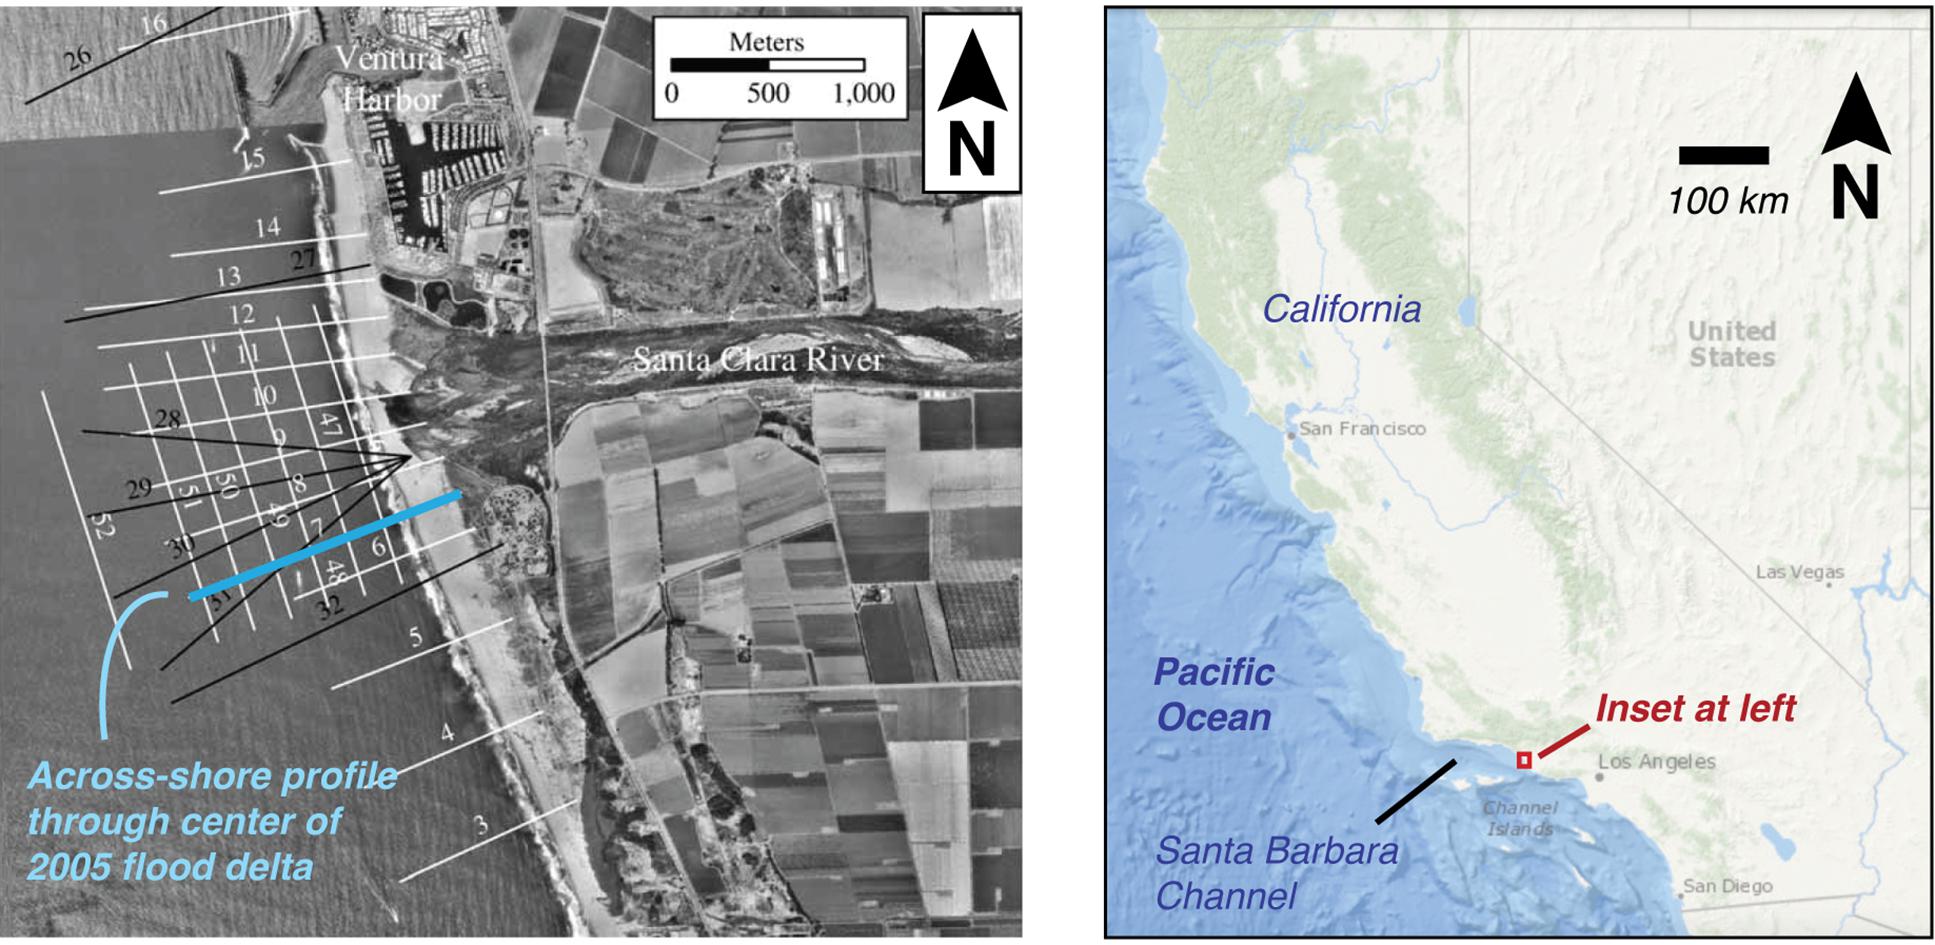
Figure 3. Topographic and bathymetric profile surveys lines for the Santa Clara River mouth of California (34.232° N, 119.264° W) collected between 2003 and 2010 and used for analyses. The highlighted profile (number 7) is located down the axis of the deltaic lobe of sediment deposited in January 2005 (cf. Figure 1), and data from it was used for analyses.
Although the Santa Clara River site is somewhat sheltered by offshore islands, it experiences significant wave heights of 5–8 m during winter storms (Warrick et al., 2008; Elias et al., 2009; Kniskern et al., 2011). These large waves often coincide with high river discharge, which will enhance offshore transport in offshore-directed wave-supported hyperpycnal gravity currents (Warrick et al., 2008). The high rate of sediment input and the hyperpycnal transport has resulted in a broad continental shelf offshore of the Santa Clara River with 40–60 m of Holocene sediment deposition and a shape consistent with formation by wave-supported sediment gravity currents (Warrick and Farnsworth, 2009). The Santa Clara River is also the dominant source of sand to region’s littoral cell, which initiates near Point Conception in the northwest and terminates at Mugu Canyon in the southeast (Patsch and Griggs, 2008; Barnard et al., 2009; Elias et al., 2009). Littoral transport updrift of the Santa Clara River mouth is documented by dredging operations at Ventura Harbor, which requires sand bypassing of approximately 450,000 m3/year. The Santa Clara River contributes an additional 900,000 m3/year on average to the southerly drift of this littoral cell (Patsch and Griggs, 2008).
River Mouth Surveys
The primary data to explore sediment transport patterns, rates and processes at the two river mouths were from topo-bathy surveys. Topo-bathy surveys allow for detailed analyses of the locations, patterns and rates of landform change, which can be used to assess sediment transport patterns and rates (Zăinescu et al., 2019). For each river mouth, topographic measurements were taken at low tide with survey-grade global navigation satellite system (GNSS) receivers, and bathymetric measurements were collected with similar GNSS receivers combined with single-beam echo sounders operated from small-motorized watercraft.
Coastal topo-bathy surveying of the Elwha River mouth was initiated by the U.S. Geological Survey (USGS) in 2005 and continued through dam removal (2011–2014) and post-removal stages (2014–present day). This mapping has been conducted along cross-shore profiles with 25-m spacing, although considerable inter-profile data collection has been included to develop digital elevation models (DEM) for the river mouth region (Figure 2). Data description and access are provided in USGS ScienceBase (Stevens et al., 2017). Analyses of the Elwha River topo-bathy data focus on September 2009 to July 2016, an interval of time that river sediment discharge to the coast peaked (Ritchie et al., 2018). During this time, topo-bathy surveys were generally conducted twice per year during both winter (January–April) and summer (July–September) to capture time-dependent changes from the influx of sediment (Figure 2).
Topo-bathy surveys of the Santa Clara River are part of regional coastal surveys that have been used to characterize Santa Barbara littoral cell response to storms and climatic conditions (Barnard et al., 2009, 2012, 2015, 2017) and the ephemeral sediment discharge from the river (Barnard and Warrick, 2010; Warrick and Barnard, 2012). Survey line spacing for the river mouth ranges between 200 and 1000 m and includes several cross-shore and alongshore transects (Figure 3). Data for the Santa Clara River were obtained from October 2003 to October 2010, which includes the large river discharge events of January 2005. Because the first post-event survey occurred in October 2005, ten months after the January high flows, an hypothetical post-event profile for January 2005 was constructed using a combination of aerial photos of wave breaking and the October 2005 bathymetry (cf. Figure 1b) and assumptions of persistent downward sloping in the submarine, which results in a slightly different submarine bar shape than assumed by Warrick and Barnard (2012).
Uncertainties in the GNSS methods are a function of survey platforms, satellite constellations, system communications, and user errors. An assessment of the Elwha River bathymetric measurements reported a mean systematic bias of 0.026 m and mean random uncertainty of 0.036 m (Gelfenbaum et al., 2015). Over long distances, such as profiles, random errors generally cancel such that uncertainty is primarily a function of the systematic bias (Anderson, 2019). This suggests that change uncertainty along a surveyed profile is ∼0.03 m. Thus, for the ∼600 m profiles of the Elwha and 1200 m profile of the Santa Clara, the uncertainties of change are 20and 40 m3/m, respectively.
Morphodynamic Analyses
Examination of the topo-bathy data sets revealed that five depositional events were captured, four for the Elwha River and one for the Santa Clara River (Figures 2, 3). Depositional events were defined by increases in sediment volumes immediately offshore of the active river channel. For the Elwha River, different depositional events were related to avulsions and other planform changes to the river channel, which altered the location of deposition, resulting in several distinct lobes of sediment (Figure 2). Dates of the depositional events were assumed to lie between the surveys and coincide with intervals of daily river sediment discharge that exceeded mean daily values (Table 1). Sediment discharge data were obtained from Ritchie et al. (2018) for the Elwha River and from Barnard and Warrick (2010) for the Santa Clara River, both of which were derived from stream gaging data from the USGS’s National Water Information System.
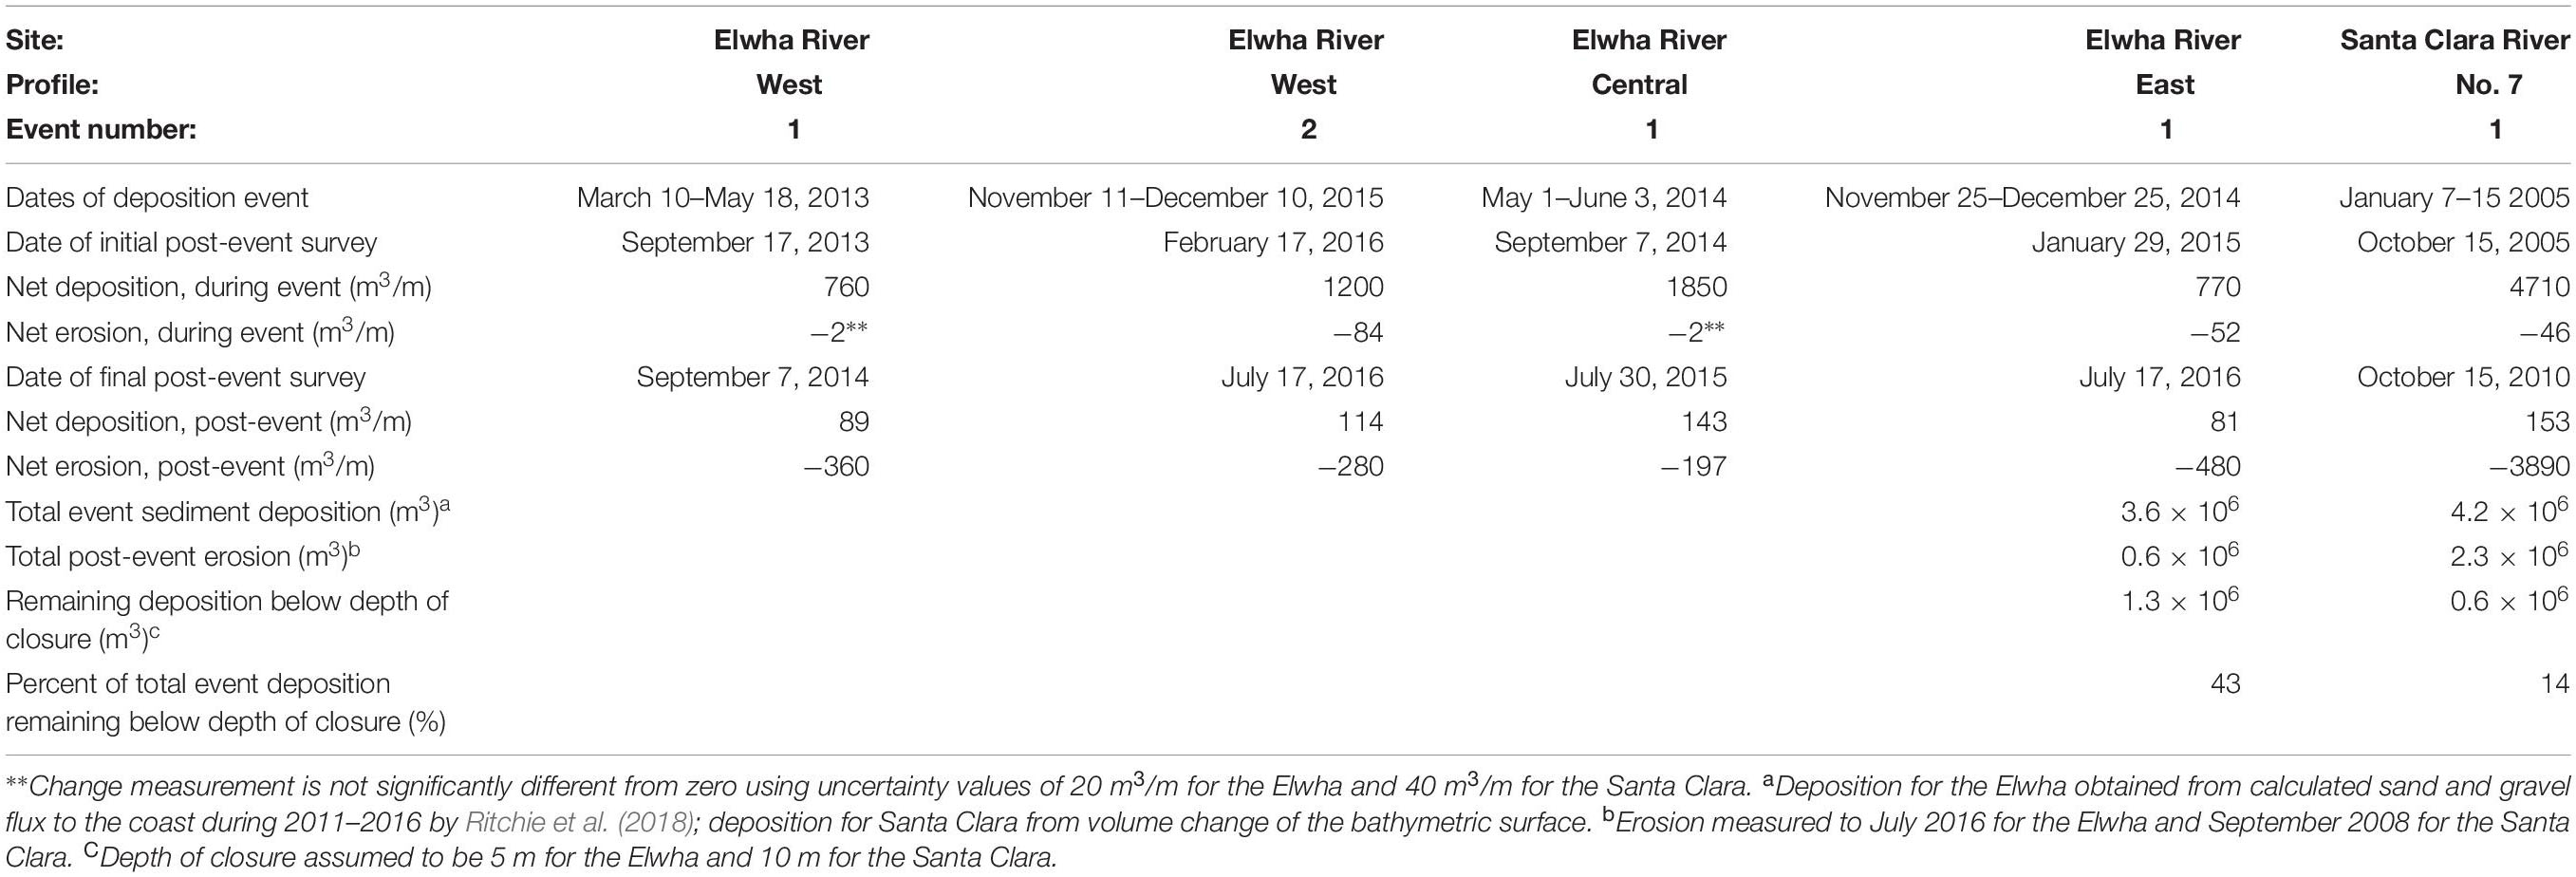
Table 1. Summary of the five events used to evaluate river mouth profile morphodynamics.
Primary goals of the data analyses were to characterize geomorphic changes and onshore, offshore and longshore transport patterns during and after depositional events. A common observation from river mouths is that newly deposited sediment is reworked and transported, or spread, along the adjacent coast over time (cf. Figure 1). For these reasons, profiles through the central-most portion, or apex, of the river mouth deposit can be exploited to calculate sediment flux values if simple assumptions are made. The primary assumption is that sediment will be redistributed either across the profile (i.e., onshore or offshore transport) or away from the profile (i.e., longshore transport). Longshore sediment transport is initially assumed to diverge from each side of the delta apex owing to wave breaking around the delta that generates divergent longshore currents about this topographic bulge (Komar, 1973). However, it is possible that some littoral drift will enter into the apex profile from one of the adjacent beaches, especially as the shoreline straightens with time. As such, the longshore transport calculations described below cannot be assumed to be total longshore transport, but rather net longshore transport introduced by the depositional lobe.
The first step of using these techniques is calculating the profile’s net deposition and net erosion for each interval of time in the survey record and also for the complete length of time. These volumetric values are calculated by independently summing all elevation gains and losses along the profile, respectively. As noted above, the uncertainty of these measurements was 20 and 40 m3/m for the Elwha and Santa Clara, respectively. Additionally, net deposition is separated into onshore and offshore components using the mean lower low water (MLLW) elevation for each site. The study sites were also separated into sub-aerial, intertidal and subtidal regions using the mean higher high water (MHHW) and MLLW elevations defined by the closest National Oceanic and Atmospheric Administration (NOAA) tidal datum data (Barnard and Warrick, 2010; Warrick et al., 2019). An overall volume balance along the profiles is also calculated by comparing the first and last post-event profiles.
Onshore transport is defined to be the net deposition above the MLLW, and offshore transport is defined to be the net deposition below MLLW. Longshore transport away from the deltaic lobe is calculated from the loss in the net volume for each profile, which is calculated by the difference between net erosion and net deposition. Because the change terms (onshore, offshore, and longshore) are measured along profile data, the results are reported in units of volume change per unit profile width (m3/m). Each of the three transport terms is also normalized by the total net erosion during each survey interval to produce scale-independent results for comparisons across systems and among events.
For the Elwha River, apex profiles were extracted along cross-shore transects from the 5-m DEM (Figure 2). Four depositional events were observed for the Elwha River, two of which occurred along a western profile and one each on a central and an eastern profile (Figure 2). Because of the lower data density in the Santa Clara River surveys, profile data were taken directly from the raw topo-bathy data for a profile that best bisected the January 2005 depositional lobe. Because this river discharge event occurred on the southern end of the river mouth (cf. Figure 1), a profile was chosen that extended through the center of this lobe (Figure 3). The Santa Clara River surveys did not commonly achieve overlap between the topographic and bathymetric portions of the surveys, so gaps were filled with linear interpolations.
To provide additional information from a source-to-sink context, total volume changes (in m3) were computed for each study site using DEM generated by Stevens et al. (2017) and Barnard and Warrick (2010). For the Elwha River, volumetric change was assessed for the interval Aug 2011 to Jul 2016 using 5-m grid size topo-bathy DEMs. For the Santa Clara River, DEMs were generated only for the bathymetric portion of the surveys for 2003–2008 at 25-m grid size. For both sites, the net changes were measured over areas in common in all DEMs. Additionally, the total sedimentation below the depths of closure, which were assumed to be -5 and -10 NAVD88 for the Elwha and Santa Clara Rivers, respectively, were computed. Total uncertainty in these volumetric measurements was assessed with the principles of Anderson (2019), for which the systematic bias across DEM was assumed to be 0.05 cm after Gelfenbaum et al. (2015). Thus, the total volumetric uncertainties for surveyed areas were 36,000 and 150,000 m3 for the Elwha and Santa Clara Rivers, respectively.
Development of Conceptual Models
From the combination of the sediment volume balances and the evolution of the profile shapes, generalized conceptual models of the river mouth morphodynamics were developed for each site. Because these models compared favorably with equilibrium profile concepts (e.g., Dean, 1991), a rules-based equilibrium model was developed and compared to observations. This model was run along a profile following a river sediment discharge event and subsequently allowed to change according to simple geomorphic rules of onshore, offshore, and longshore transport that are presented in detail in the “Discussion” section.
Results
Both river systems revealed measurable deposition over the interval of study. The growth of the Elwha River delta was related to multiple years of sedimentation occurring during discrete events, which resulted in several sediment lobes that were reworked over time (Figure 2). The January 2005 event in the Santa Clara River caused seaward translation of the surfzone followed by accretion of the beach (Figure 1). Overall these events were caused by approximately 3.6 and 4.2 million m3 of sand and gravel discharge from the Elwha and Santa Clara Rivers, respectively (Table 1).
The five depositional events at the two study sites were evaluated in detail by examining the apex profiles from the topo-bathy surveys (Figures 4, 5). For each individual event, accretion in excess of several meters was measured along hundreds of meters of each profile (Figures 4a, 5a). The net deposition along these profiles for the events ranged between approximately 750 and 1850 ± 20 m3/m for the Elwha River to 4710 ± 40 m3/m for the Santa Clara River (Table 1). Deposition occurred largely in the submarine portion of the profiles (i.e., below the MLLW elevation), although the shape of the depositional profiles differed markedly. For the Elwha River, post-event profiles consistently had steep (20°–40°) foresets that began at water depths deeper than −2 m NAVD88 and extended to over −10 m NAVD88 in most cases (Figure 4b). The Santa Clara River, in contrast, had a much lower gradient depositional profile that had a maximum slope of approximately 3°, which extended over a kilometer offshore of the river mouth (Figure 5a). For the Elwha River, surveys were conducted weeks following the end of the river discharge event (Table 1). This suggests that the shape of the profiles may have been modified during this interval from Gilbert-like to one in which an intertidal bar was developing. An example of this is shown in the September 2014 profile of the Central Profile of the Elwha River (Figure 4a), where multiple bars had formed during the three months between river sediment discharge and the topo-bathy survey.
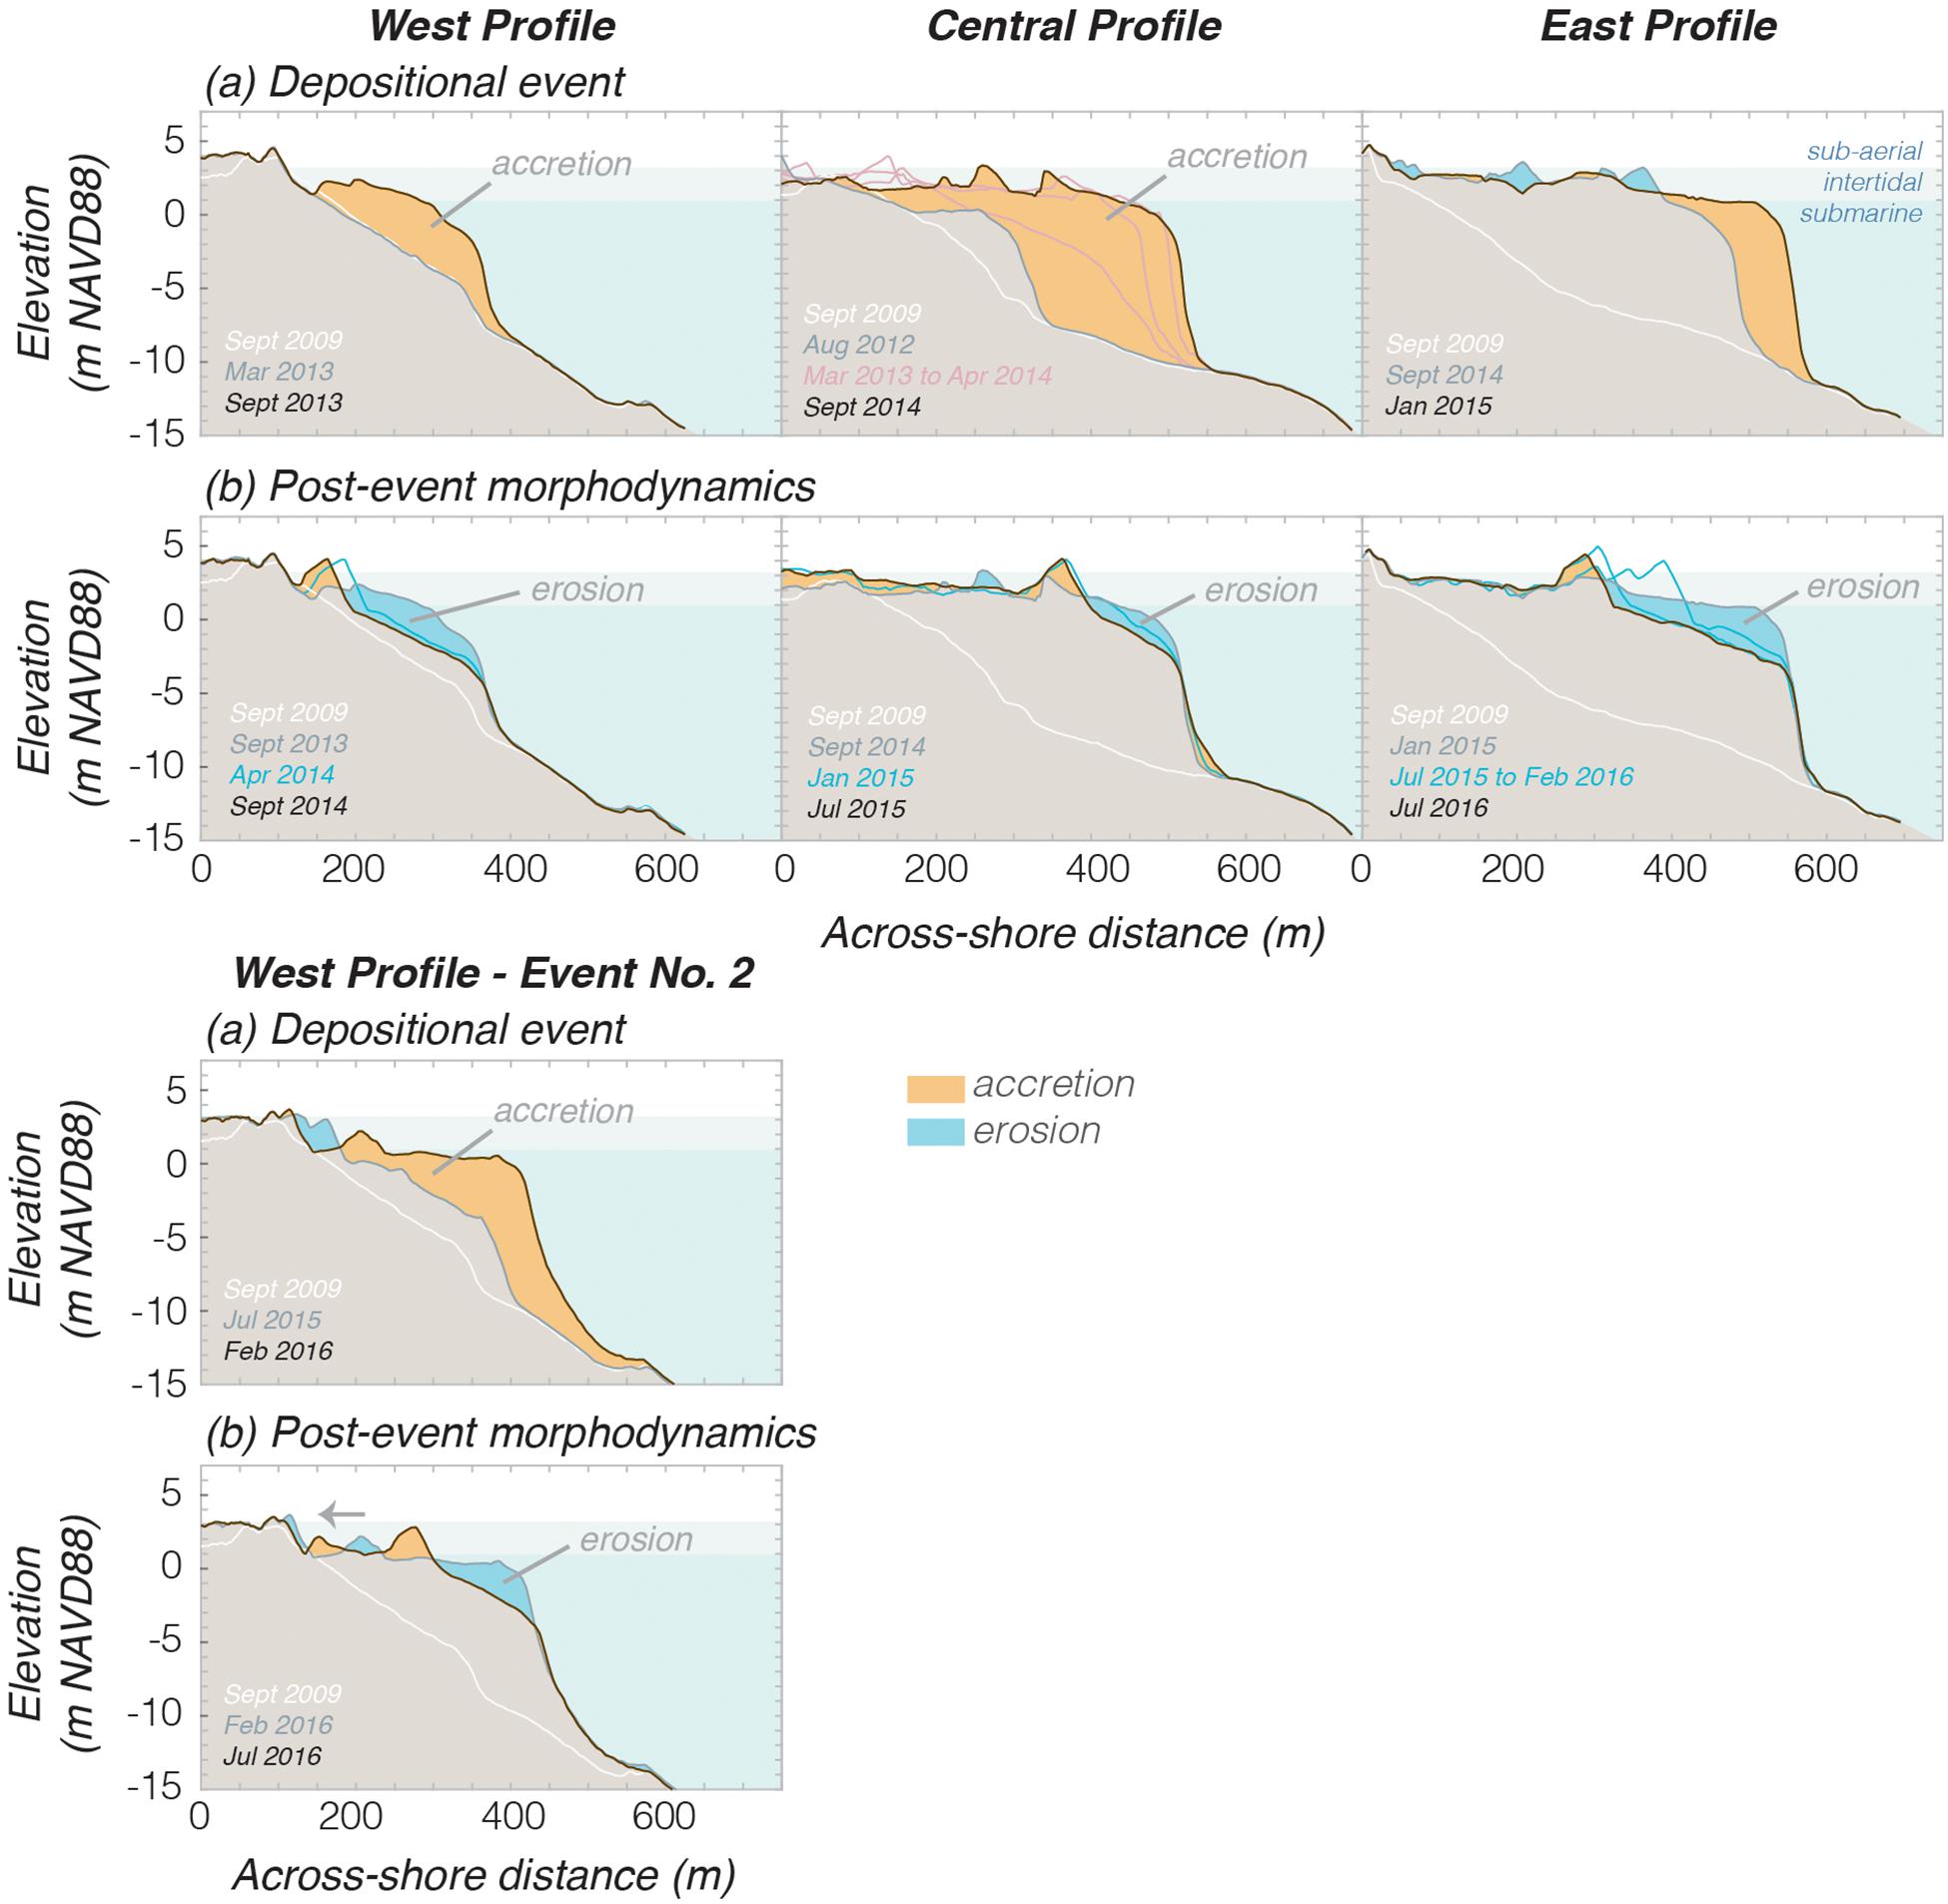
Figure 4. Topographic and bathymetric profiles through the axis of several depositional events at the mouth of the Elwha River, Washington. Four distinct events were observed with time as the river location changed and the river sediment discharge rates varied with time. This resulted in coincidental morphologic evolution for many of these profiles. Profiles highlight (a) before and immediately after deposition events, and (b) the post-deposition changes for the three cross-shore profiles shown in Figure 2. Areas of accretion and erosion are highlighted with shading colors.
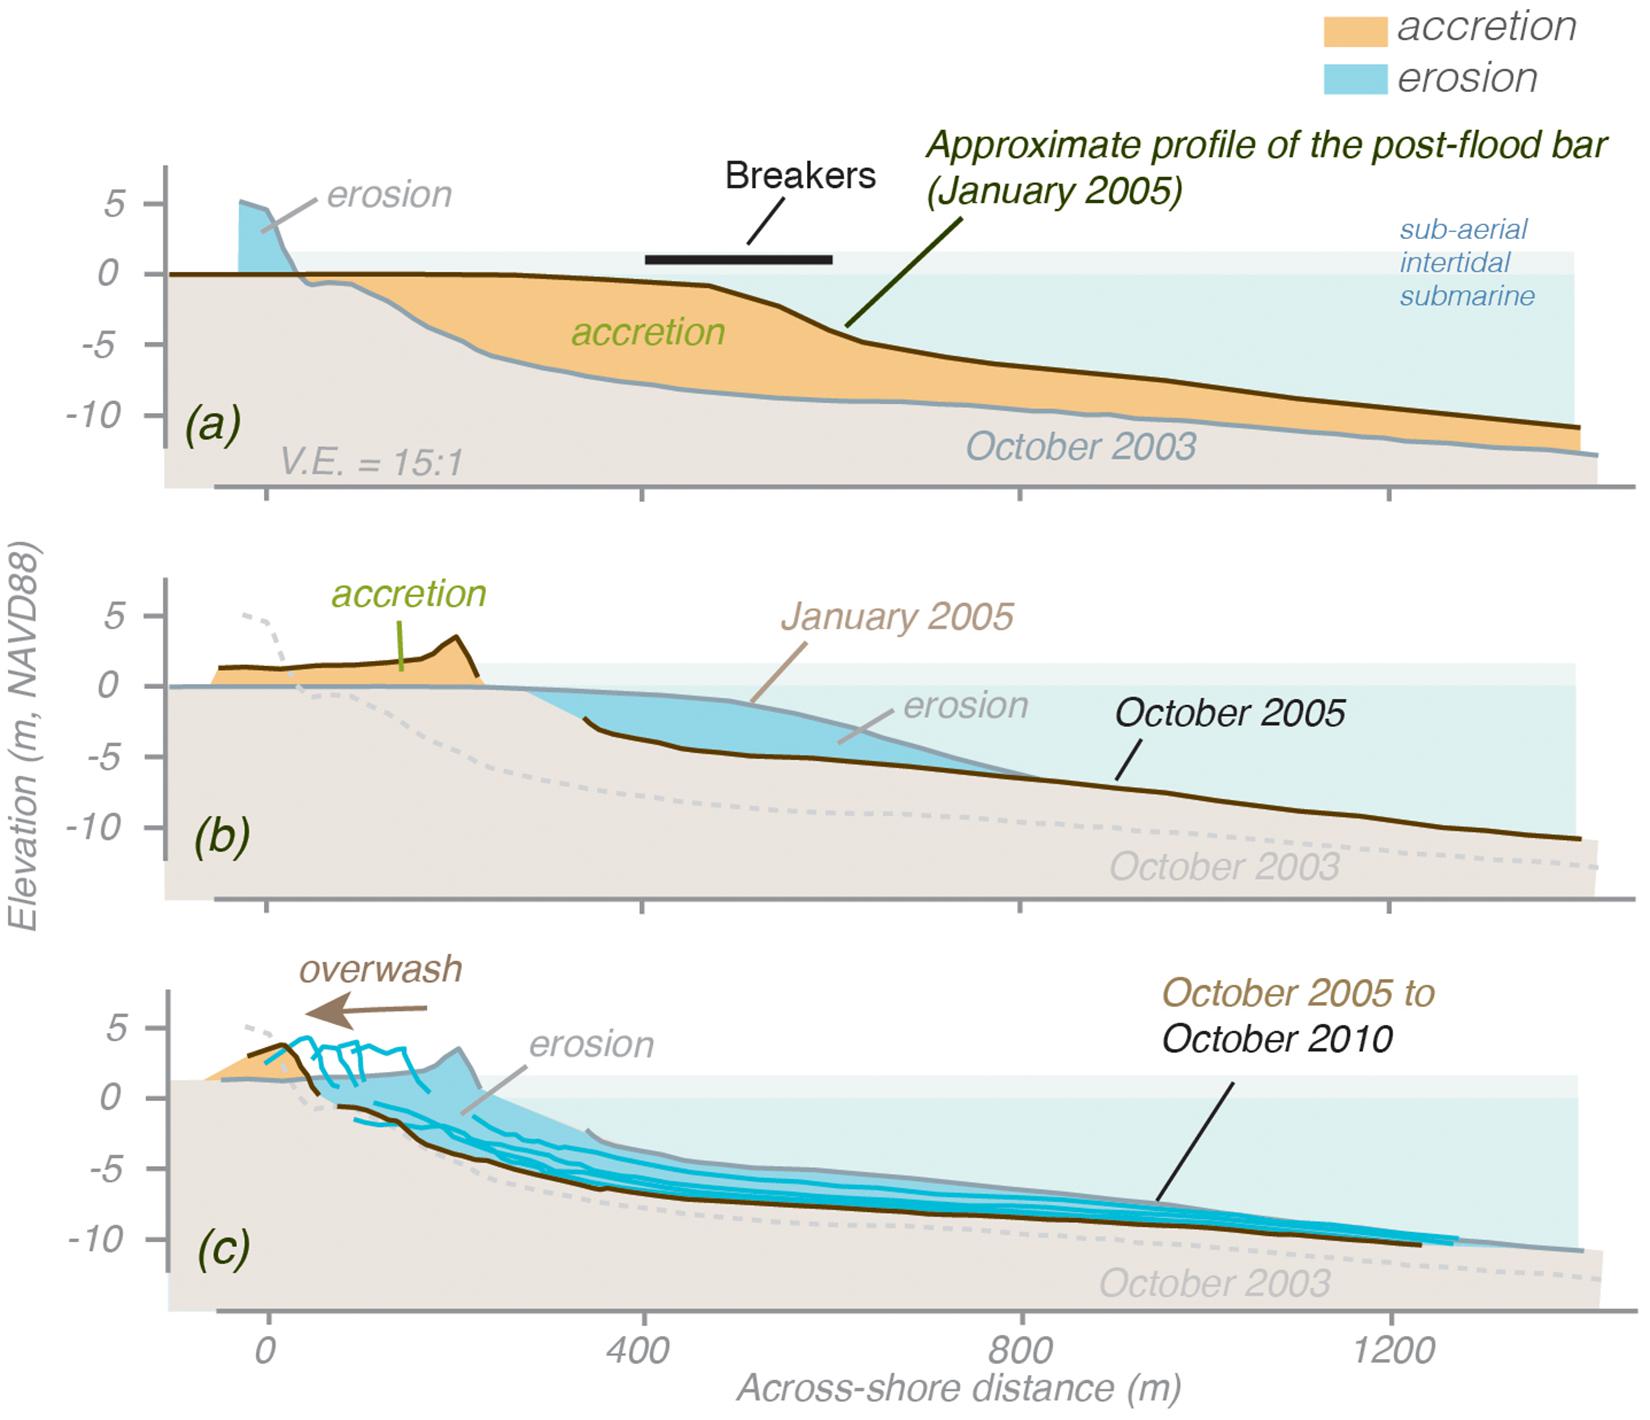
Figure 5. Topographic and bathymetric profiles through the apex of the depositional sediment lobe offshore of the Santa Clara River, California for the January 2005 event shown in Figure 1. (a) Before and immediately after profiles, where the January 2005 profile was approximated using the location of wave breaking and offshore bathymetric data as described by Warrick and Barnard (2012). (b) Post-deposition changes to the profile during the first year, and (c) changes for the following five years. Profile location is shown in Figure 2.
Although the extent of deposition was well constrained for the four Elwha River events, the bathymetric surveys of the Santa Clara River did not extend far enough to fully constrain the limits of deposition (Figure 5a). Thus, the actual net deposition and the total volume change for the Santa Clara River were likely greater than the computed values of 4710 ± 20 m3/m and 4.2 million m3 (Table 1). Net erosion along all profiles during the river events was considerably lower (2–84 m3/m) than net deposition (Table 1), and the location of this erosion generally occurred on the intertidal and sub-aerial beach, presumably from river erosion of these beach features during high-river flow (Figures 4a, 5a).
Following the depositional events, all profiles revealed patterns of intertidal-to-submarine erosion and subaerial-to-intertidal accretion (Figures 4b, 5b,c). Onshore accretion resulted in the formation of river mouth berms, which were observed to migrate inland with time if multiple post-event surveys were conducted (Figures 1, 4b, 5c). The net erosion was consistently greater than the net deposition during the post-event intervals, however, suggesting an overall loss of sediment volume from the apex profiles (Table 1). Some of the newly deposited river sediment was observed to persist at each site throughout all surveys (Figures 4b,d, 5c). Further evidence for this persistence is provided by the net deposition values during the river discharge events, which consistently exceeded the post-event net erosion values (Table 1).
Survey-to-survey changes along the profiles provide more information about the morphodynamics and the patterns of net deposition and erosion. Using sediment volume balances for the post-event survey profiles, the magnitude of net erosion exceeded net deposition for all time intervals (Figures 6, 7). Net deposition was dominantly onshore for all profiles, except for the Central profile of the Elwha River, which had relatively equivalent rates of onshore and offshore deposition over time (Figure 6c). Offshore deposition for this profile occurred at the toe of the event-derived foreset, where several meters of deposition were observed (Figure 4b; center panel). Six separate intervals of time were surveyed for the Santa Clara River, and these annual surveys revealed that the magnitude of net erosion consistently exceeded net deposition and that both net erosion and deposition decreased by several fold over time (Figure 7). These volumetric changes of the Santa Clara River were caused by progressive retreat of the river mouth berm and a gradual lowering of the submarine profile (Figure 5c).
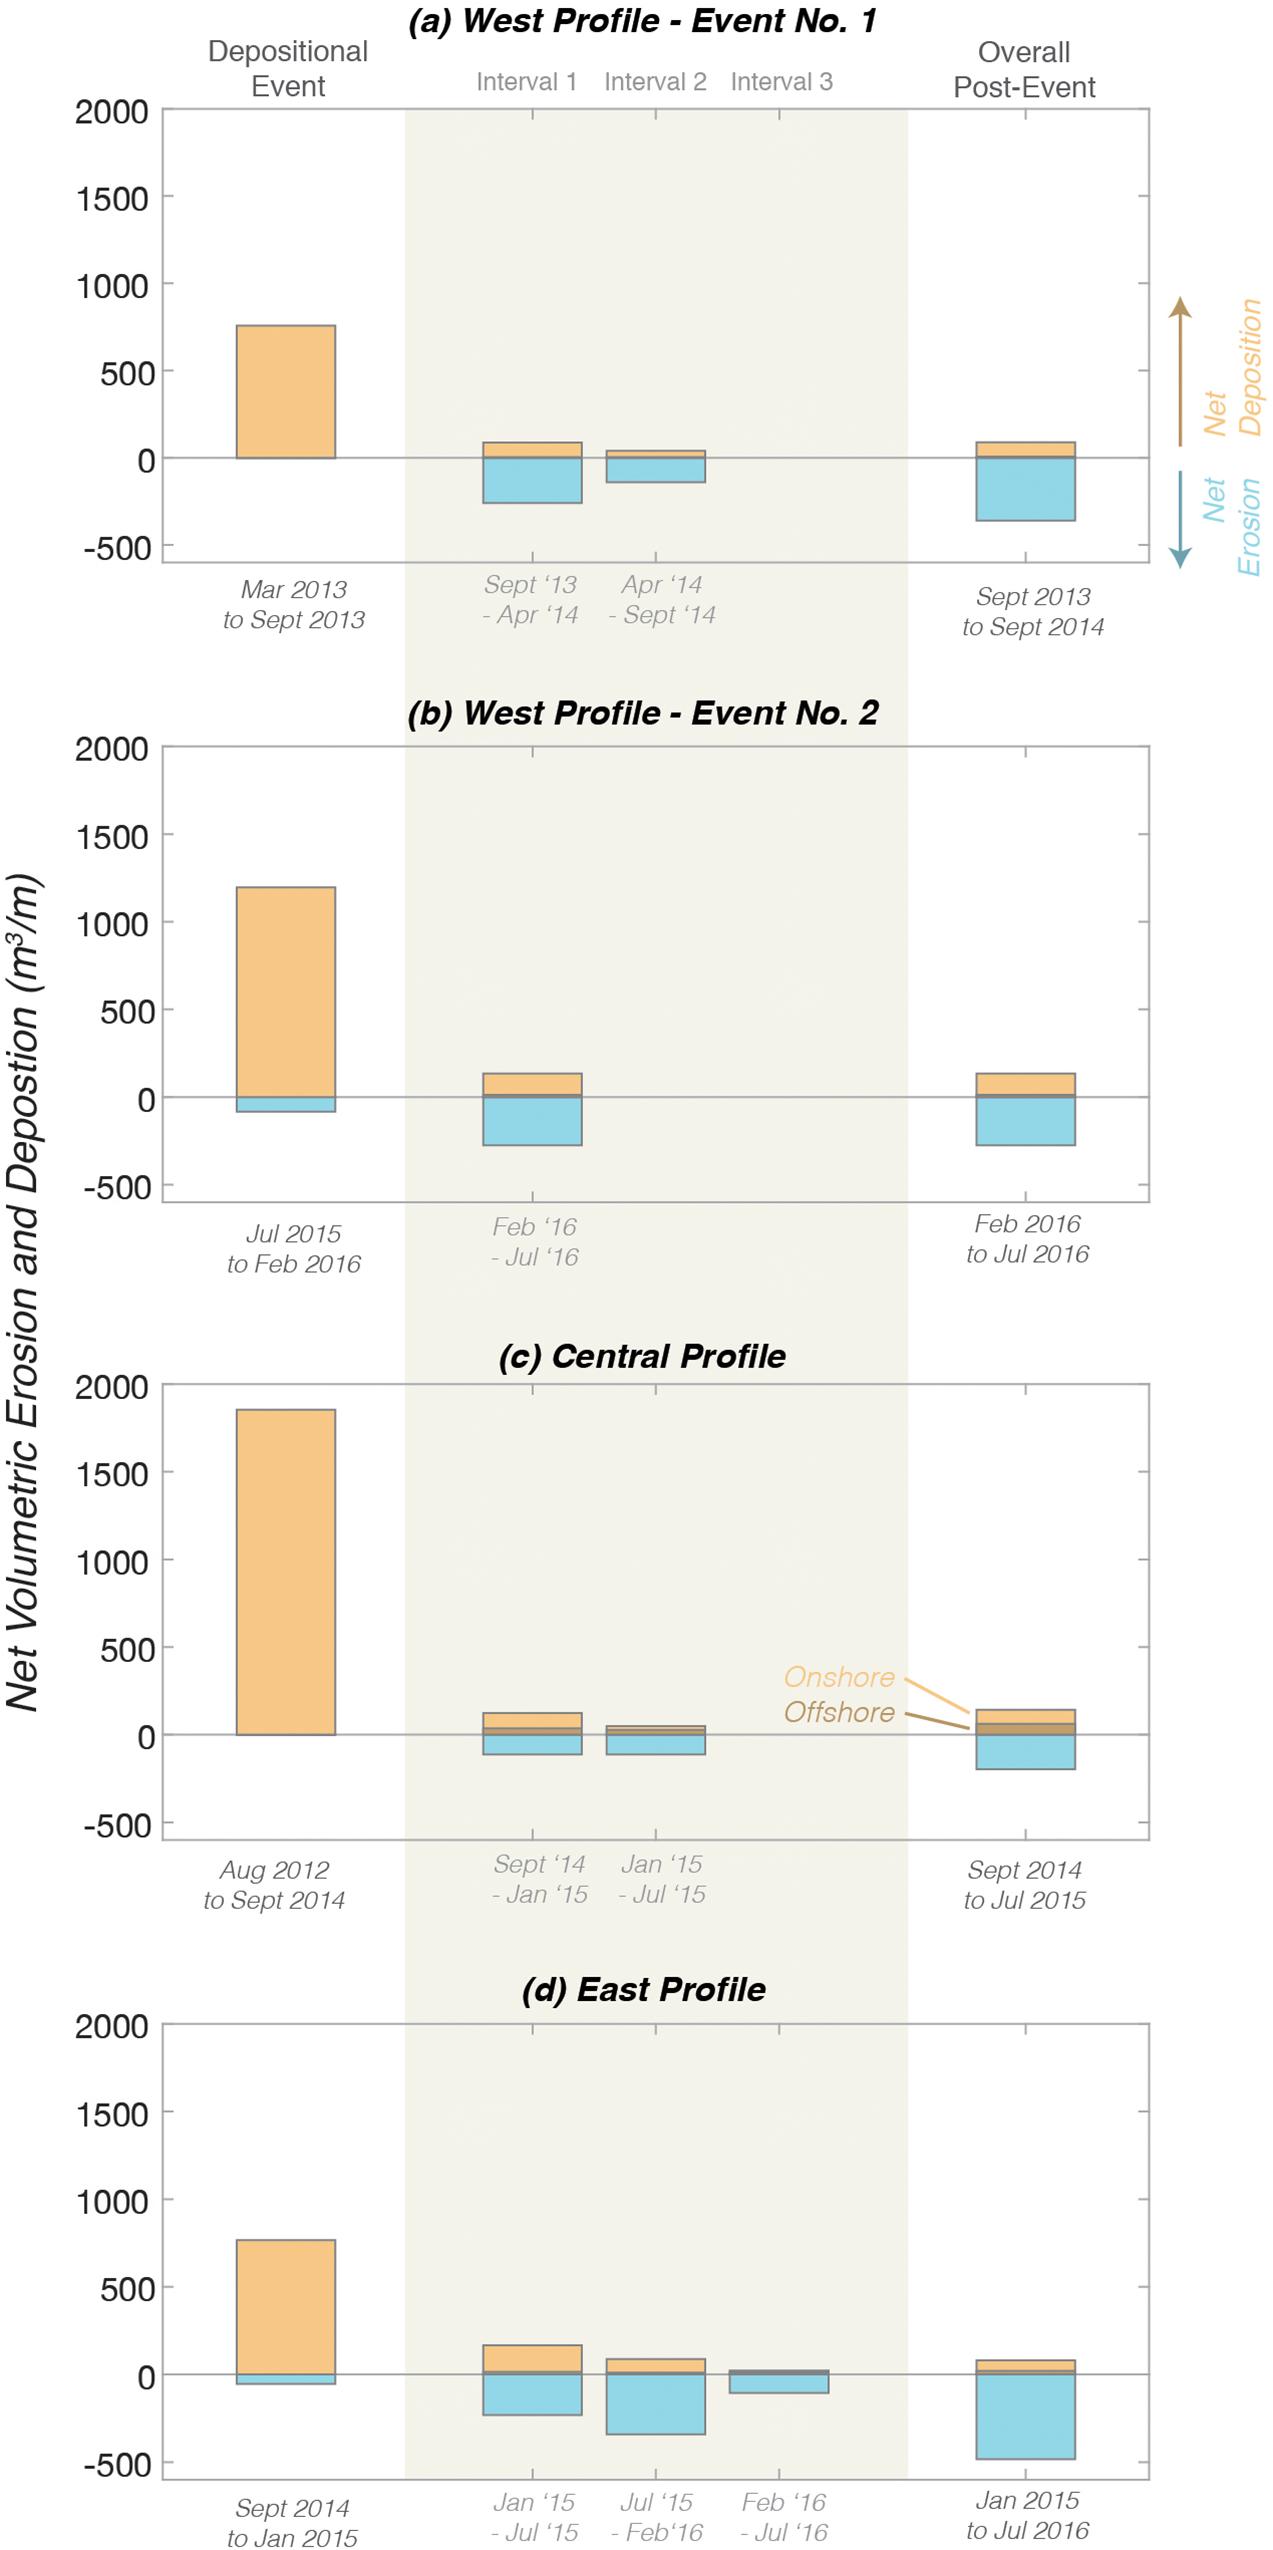
Figure 6. (a–d) Volumetric change along profiles of the Elwha River mouth for the four depositional events shown in Figure 4. Both net deposition (orange) and net erosion (blue) are shown for each interval of time. Net deposition is separated into deposition on the subaerial, or onshore, areas (light shading), and the submarine, or offshore, areas (dark shading). Results are presented for the depositional event (left-hand side) survey-to-survey intervals (center) and for the overall survey record (right-hand side). Interval dates are shown below each plot. Uncertainty in these measurements are ±20 m3/m.
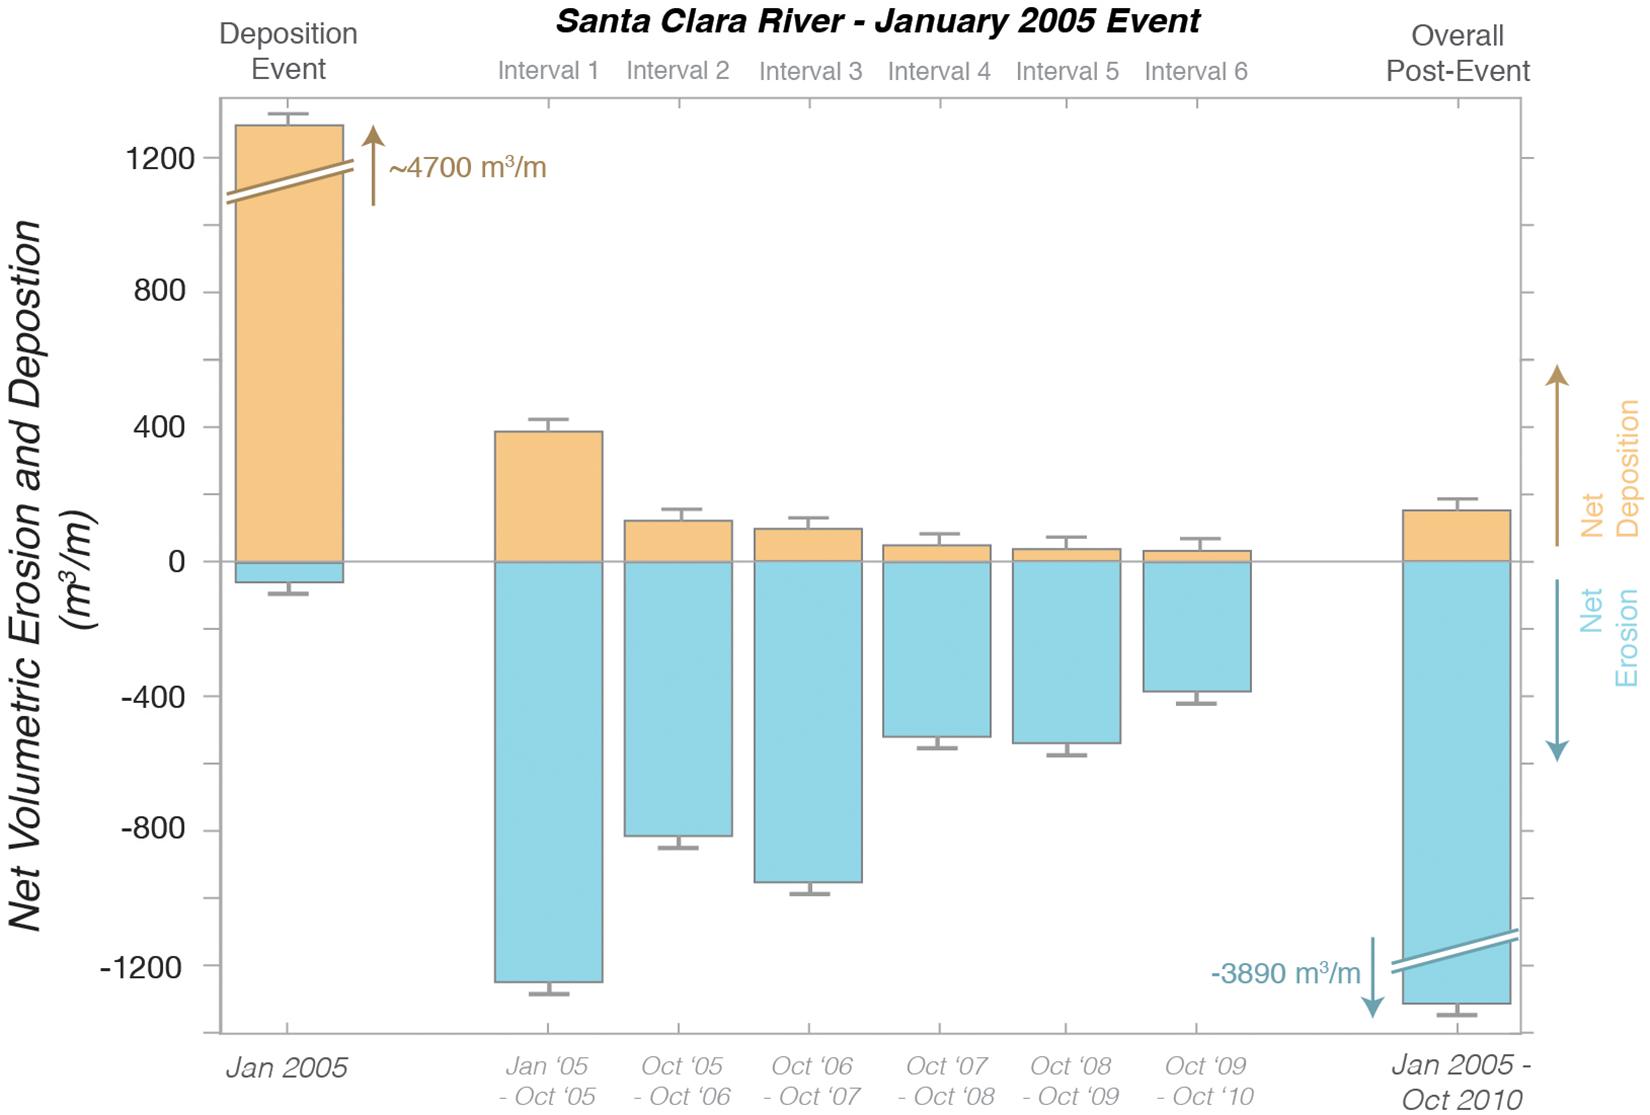
Figure 7. Volumetric change along the profile of the Santa Clara River mouth for the January 2005 depositional event. Consistent with Figure 6, both net deposition (orange) and net erosion (blue) are shown for each survey interval. Results are presented for the depositional event (left-hand side) survey-to-survey intervals (center) and for the overall survey record (right-hand side), and interval dates are shown below each plot. Error bars show the profile-length uncertainty (±40 m3/m) in change measurements.
A compilation of the time-dependent volumetric changes along apex profiles of both river sites provides additional information about sediment transport patterns (Figure 8). For this presentation, the volumetric changes were normalized by net erosion for each interval of time to enable comparisons across the order-of-magnitude range of change values (Figure 8). Additionally, longshore transport rates were estimated from the sediment volume balances as noted in the Methods section above.
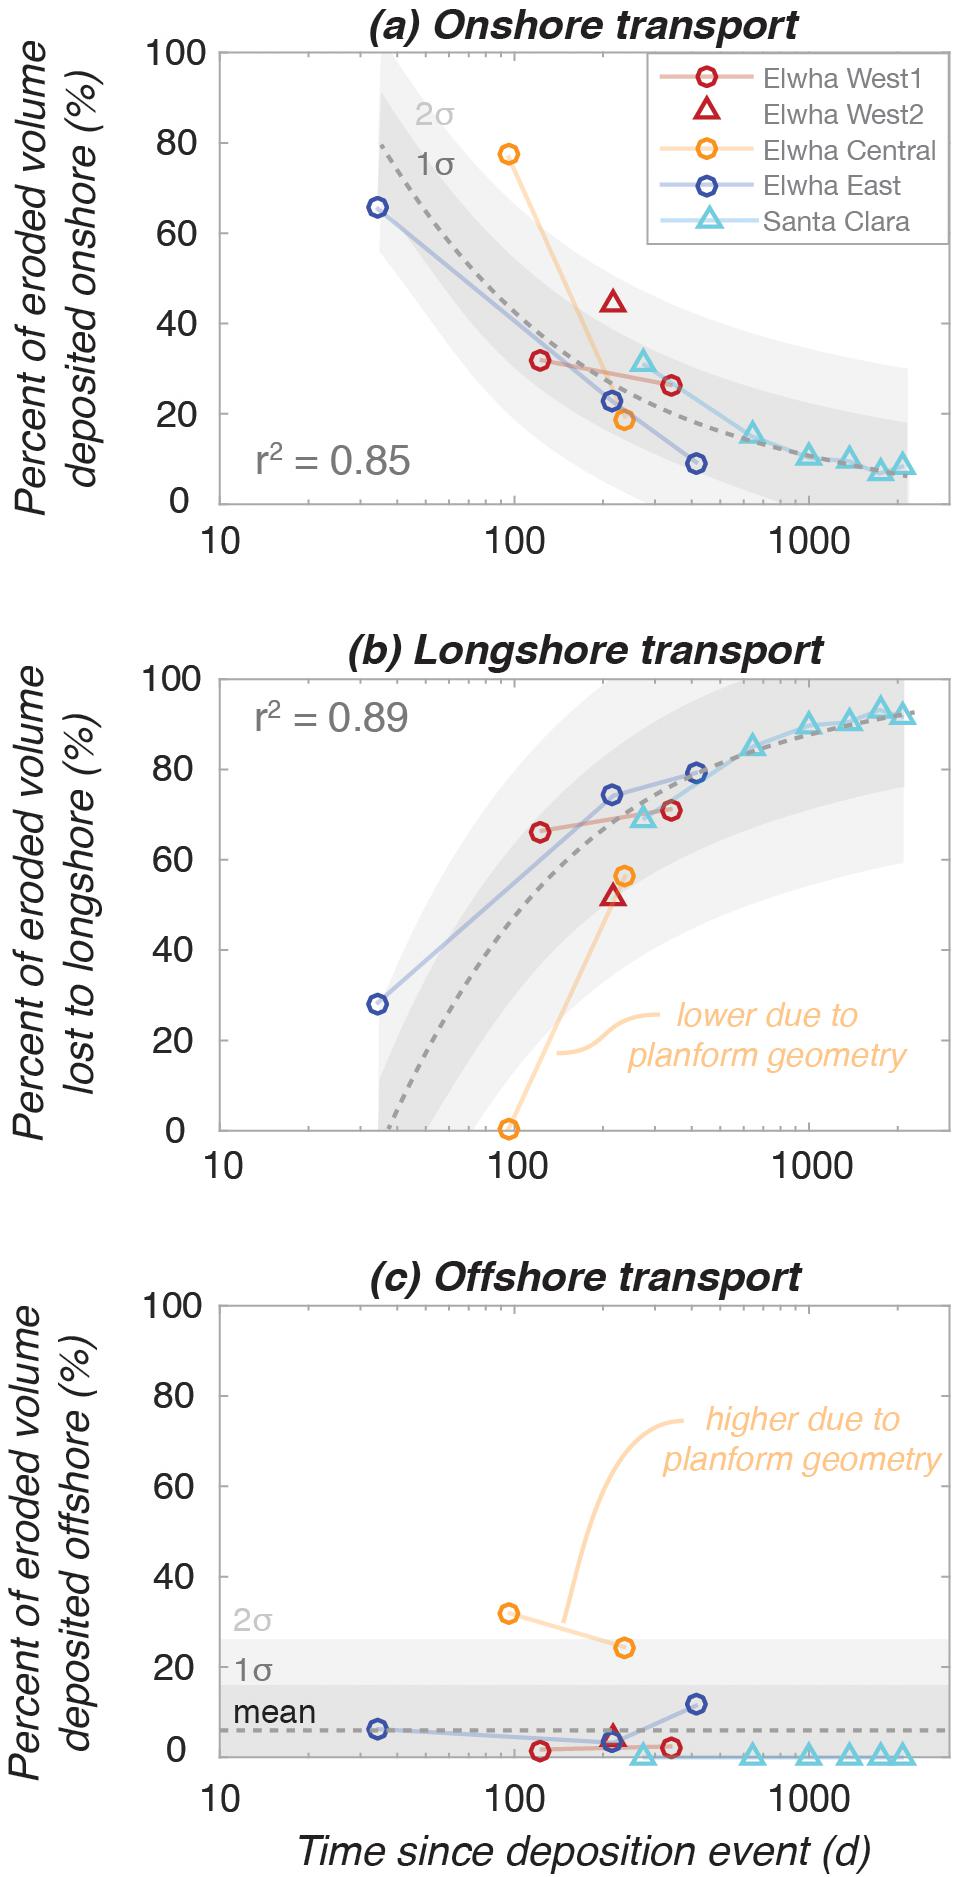
Figure 8. The temporal changes of the sediment volume budgets for the profiles of the Elwha River and Santa Clara River mouths. Data presented as the percent of net erosion for each survey interval that was transported in the following directions: (a) onshore, (b) longshore, and (c) offshore. Dashed line is the expoential fit through (a) and (b) with the corresponding correlation coeficients, and shading shows both one and two standard deviations of variation around the fit. For (c) the dashed line is the mean value (6.1%) and shading shows one and two standard deviations about the mean.
Several patterns manifest in these time-dependent transport data. First, the rate of onshore transport systematically decreased with time for all study sites taken both independently and collectively, ranging from 60 to 80% of the total eroded sediment during the first weeks after depositional events to less than 10% after several years (Figure 8a). Longshore transport from erosion of profile sediment, in contrast, systematically increased over time, ranging from a secondary or negligible component of the sediment budgets to over 90% of the eroded sediment after several years (Figure 8b). Offshore transport was generally less than 10% of the total transport budget for most study sites and intervals, except for the Central profile of the Elwha River, for which roughly a third of the eroded sediment volume was transported offshore (Figure 8c). Examination of the Central profile reveals that this offshore transport was deposited at the base of the delta foreset, and that the higher rate of offshore transport for this profile coincided with lower rates of longshore transport compared to the remaining sites (Figure 8b). Examination of the geometry of the Central profile shows that two new depositional lobes surrounded this profile during its post-event record (Figures 2h–j). These new lobes of sediment likely reduced longshore transport rates from the profile by straightening the shoreline and placing physical boundaries to longshore transport derived from the profile. Additionally, these new sediment lobes may have induced greater rates of offshore transport, because as the beach profile adjusted to wave attack without migrating inland or supplying the adjacent coast with longshore transport, sediment may have been lost off of the steep foreset (Figure 4b).
All profiles revealed that significant areas of the original sedimentation remained in place after months to years (Figures 4b, 5c). The remaining sediment was especially prevalent at the deeper sampled depths. For example, if depths of closure are assumed to be 5 and 10 m for the Elwha and Santa Clara, respectively, then 1.3 and 0.6 million m3 of sediment remained below these depths at the end of each survey record (Table 1). These volumes are equivalent to 43 and 14% of the total littoral-grade sediment discharged into the systems (Table 1). Volume balance also suggests that erosion of sediment was an inverse function of water depth. For example, at the Santa Clara River 54% of the original deposition at 10 m water depth eroded over the study, whereas only 33% of the deposition at 12 m eroded. Profiles and volume change from the Elwha River suggest that negligible change occurred at water depths greater than 5 m (Figure 4).
Discussion
The combined results from two different river mouth systems, the Elwha and Santa Clara Rivers, suggest that there are fundamental time-dependent patterns in the processes that rework deltaic deposits and deliver these sediments to littoral cells. These patterns include an initial period of onshore-dominated sediment transport followed by a prolonged period of longshore-dominated transport (Figure 8). The earliest phases of this transition occur during the building of the river mouth berm and reestablishment of the beach profile (Figures 4, 5). Offshore transport of sediment is generally a secondary or negligible pathway of sediment, unless, as hypothesized above, the longshore transport is inhibited during the initial profile adjustment.
Here these results are explored further by examining: (i) the cause of onshore-dominated sediment transport during berm formation, (ii) generalized conceptual models of sediment transport from rivers to littoral cells, and (iii) a comparison of these results to other river mouths throughout the world. Although it will be shown that new understanding was gained in this research, I will also highlight several hypotheses and unanswered questions that may be addressed by future investigations.
Cross-Shore Sediment Transport
Sediment budgets suggested that onshore transport was a significant factor early during the post-event morphodynamics, so it is important to examine why this transport was largely unidirectional during this early phase of coastal response. Developing a theoretical understanding for these cross-shore transport patterns could be achieved by scaling from, for example, cross-shore and longshore transport or diffusivity relationships (e.g., Nienhuis et al., 2015; Ortiz and Ashton, 2016). Unfortunately, most relationships are developed for full beach profiles, which include subaerial, intertidal and submarine portions of the profile. This inhibits application to the river mouths shown here, because as noted above and detailed below, the profiles initially do not have intertidal or subaerial sections (i.e., the profiles do not have foreshores). To develop a theoretical understanding for these settings, better understanding of the physical processes is needed. Thus, here I examine observed and hypothesized characteristics of river mouths and use the existing understanding to hypothesize why onshore transport dominates the early morphodynamics.
Cross-shore sediment transport processes of surf zones are inherently complicated owing to three-dimensional topography and hydrodynamics including three-dimensional asymmetric oscillatory flows, wave grouping and associated energy transformation into infragravity frequencies, wave- and bathymetric induced vorticies, turbulence introduced by wave breaking and dissipation, and undertow patterns (Roelvink and Stive, 1989; Aagaard, 2014; Wei et al., 2017). Studies of cross-shore sediment transport are commonly limited to sandy beach settings and focused on conditions that cause beach change, such as shoreline erosion or bar formation (Butt and Russell, 2000; Mariño-Tapia et al., 2007; Masselink et al., 2008). Studies of the physical effects of waves at river mouth settings have generally focused on wave influences on river plume formation and initial river mouth bar formation in embayed settings without littoral zones (Nardin and Fagherazzi, 2012; Nardin et al., 2013; Gao et al., 2018) or on patterns of littoral sediment bypassing of river mouths (Nienhuis et al., 2016b). Although these studies do not address the reworking of river mouth bar sediment toward the beach, they are consistent in suggesting that the effects of waves on the timing and geometry of sediment transport can be complex (Nardin and Fagherazzi, 2012; Nardin et al., 2013; Nienhuis et al., 2016b; Gao et al., 2018).
To gain insights into the hydrodynamics that influence sediment transport during the early stages of post-event river mouth morphodynamics, it is useful to consider aerial photographs of river mouths during these stages for evidence of wave breaking and water level information (Figures 1b, 9). The early post-event morphodynamic stages captured in these photos show waves breaking across river mouth bars without the influence of a subaerial shoreface to cause downrush or return flows. That is, wave bores are observed to propagate across bars and dissipate within the river mouths. Additionally, the Elwha River imagery provides evidence that the river mouth bar is discontinuous with at least six deeper channel-like sections (Figure 9; Zurbuchen et al., 2020). Turbid waters are observed to spread offshore of many of these channel-like features, suggesting that they may serve as important conduits for return flow.
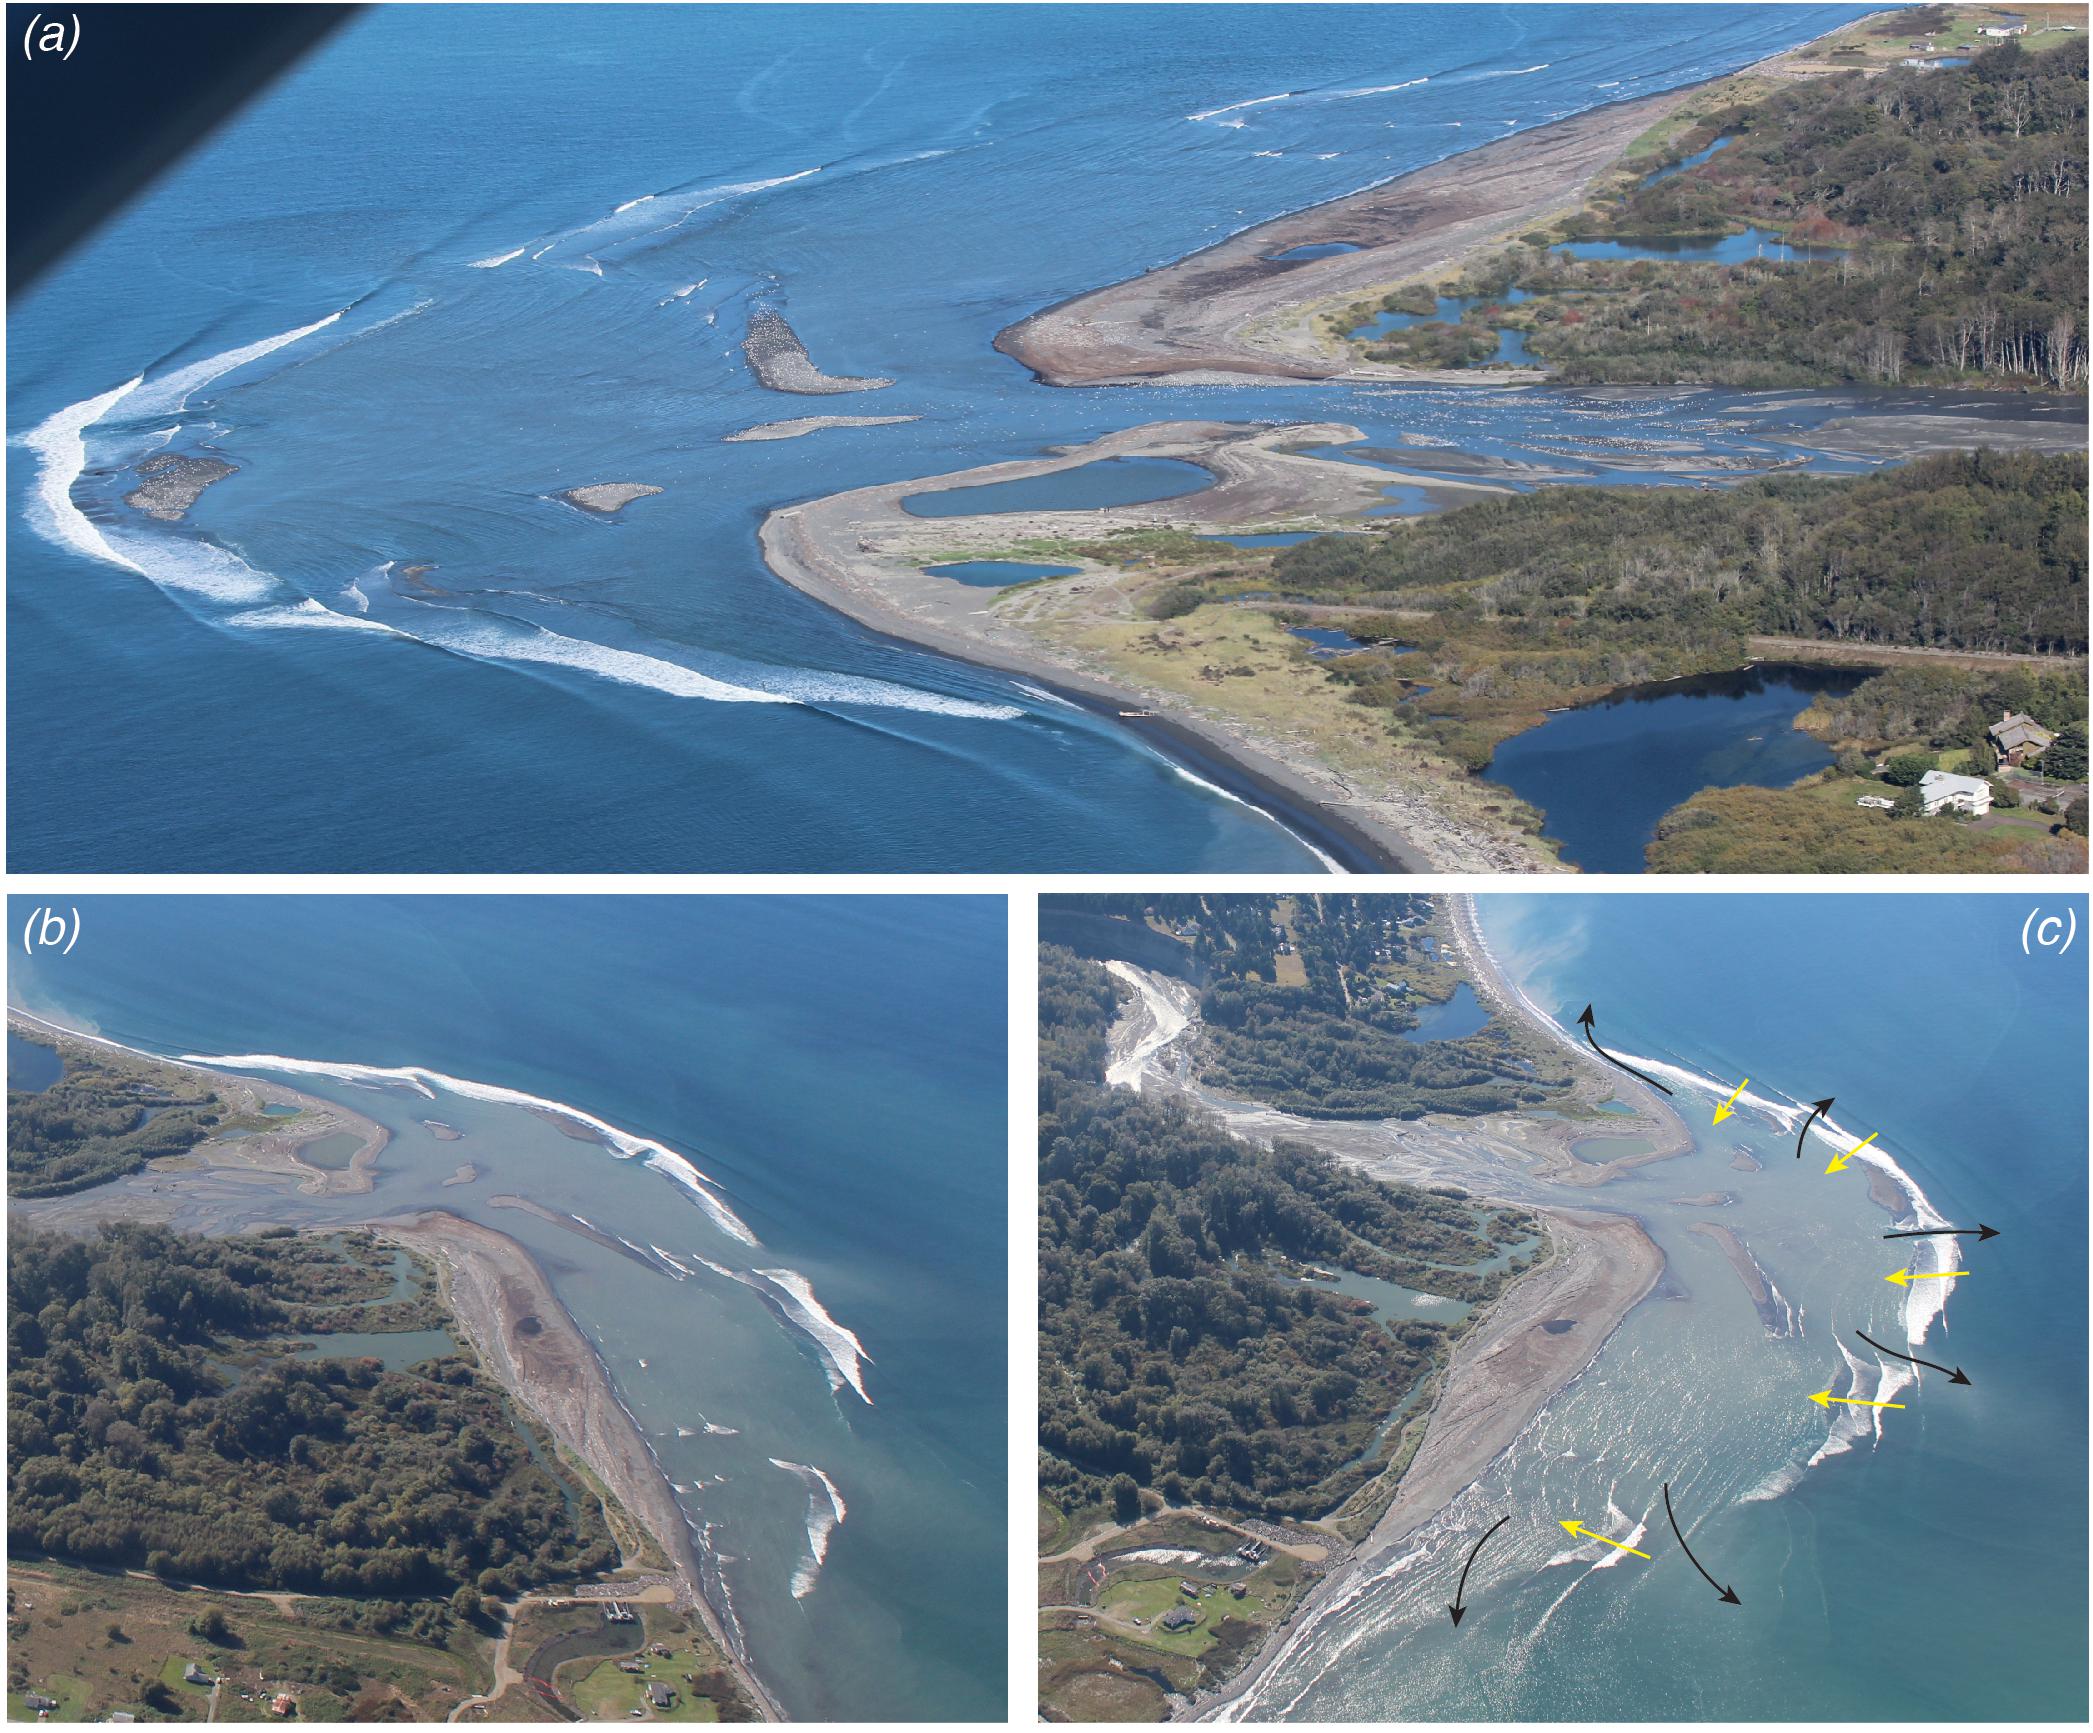
Figure 9. (a–c) Oblique aerial photographs of the Elwha River mouth from September 27, 2013 highlighting wave-breaking patterns on river mouth bars that are related to cross-shore and longshore sediment transport. Hypothesized flow pathways are highlighted in the lower right panel showing onshore flow across bars (yellow arrows) and offshore return flow through channels in the gaps between bars (black arrows). Photo credits: Neal and Linda Chism of LightHawk.
Combined, flow paths are hypothesized to be landward across the bars and seaward through the channels (Figure 9c), which is somewhat analogous to flow behavior in coastal bar-rip morphologies (MacMahan et al., 2006, 2010). Under the more commonly studied bar-rip setting, onshore mean flow occurs on the bars during low-to-moderate wave conditions, which causes onshore bar migration (Masselink et al., 2008). For the river mouth bar scenario, there is the added complexity of no foreshore immediately behind the bar, which eliminates up- and downrush processes (Butt and Russell, 2000) and provides a large water body behind the bar to redistribute water (Figure 9). Without downrush or return flow, waves and their resulting sediment transport will extend farther inland (Kobayashi and Lawrence, 2004), which would likely eliminate the net offshore velocity moments in the inner surfzone (cf. Mariño-Tapia et al., 2007). That is, without a subaerial beach, flow over river mouth bars will be strongly landward. Thus, the morphology of the submarine-to-intertidal river mouth bars are hypothesized to result in onshore flow and sediment transport on the bars, which results in landward bar translation.
As the bar translates inland, the profile is observed to evolve toward a pre-event shape (Figures 4, 5). This profile evolution coincides with vertical accretion of the submarine bar, thereby transforming it into a subaerial feature (Figures 1, 4, 5). As the bar rises to become subaerial, the shoreface will develop, thereby introducing swash hydrodynamics and sediment transport (Bailard, 1981; Wright and Short, 1984). With the near continuous and seaward-bulging arcuate shape of the subaerial berm, onshore sediment transport will be limited to overwash events, which will translate the berm farther inland (Zurbuchen et al., 2020). As such, longshore transport will become a dominant process along the arcuate shoreline owing to the oblique wave breaking angles along the berm (Komar, 1973; Giosan et al., 2005; Nienhuis et al., 2015; Warrick et al., 2019). Hence, the transition of the submarine bar into a subaerial berm is hypothesized to be a fundamental driver of the transition of sediment transport from onshore to longshore. As the shoreline straightens, the influence of regional longshore transport will increase and rival, if not overwhelm, the longshore transport generated by erosion of the new deltaic sediments (Nienhuis et al., 2016b). However, the hydrodynamic conditions of these transient morphodynamic settings are not well know and may be considered an important area for further investigation.
Simple Morphodynamic Models
Using the combined results and discussion presented above, generalized conceptual models of the river mouth profile morphodynamics were generated (Figures 10, 11). Profile evolution models for the apex of the Elwha and Santa Clara River deltas show initial river mouth profiles that include river mouth berms, simplified beach profiles, and depths of closure (DoC), below which it will be assumed that littoral transport is negligible (Figures 10a, 11a). The morphodynamics are initiated by river sediment inputs, which build a Gilbert-like delta for the Elwha River system (Figure 10b) and a more dispersed hyperpycnal delta landform for the Santa Clara River system (Figure 11b). For the model shown in Figure 11, it was assumed that the hyperpycnal deposit terminated abruptly offshore of the depth of closure, much like suggested by regional mapping of other deltas (Warrick et al., 2013; Steel et al., 2016), although the toe of this deposit may extend much farther out onto the continental shelf.
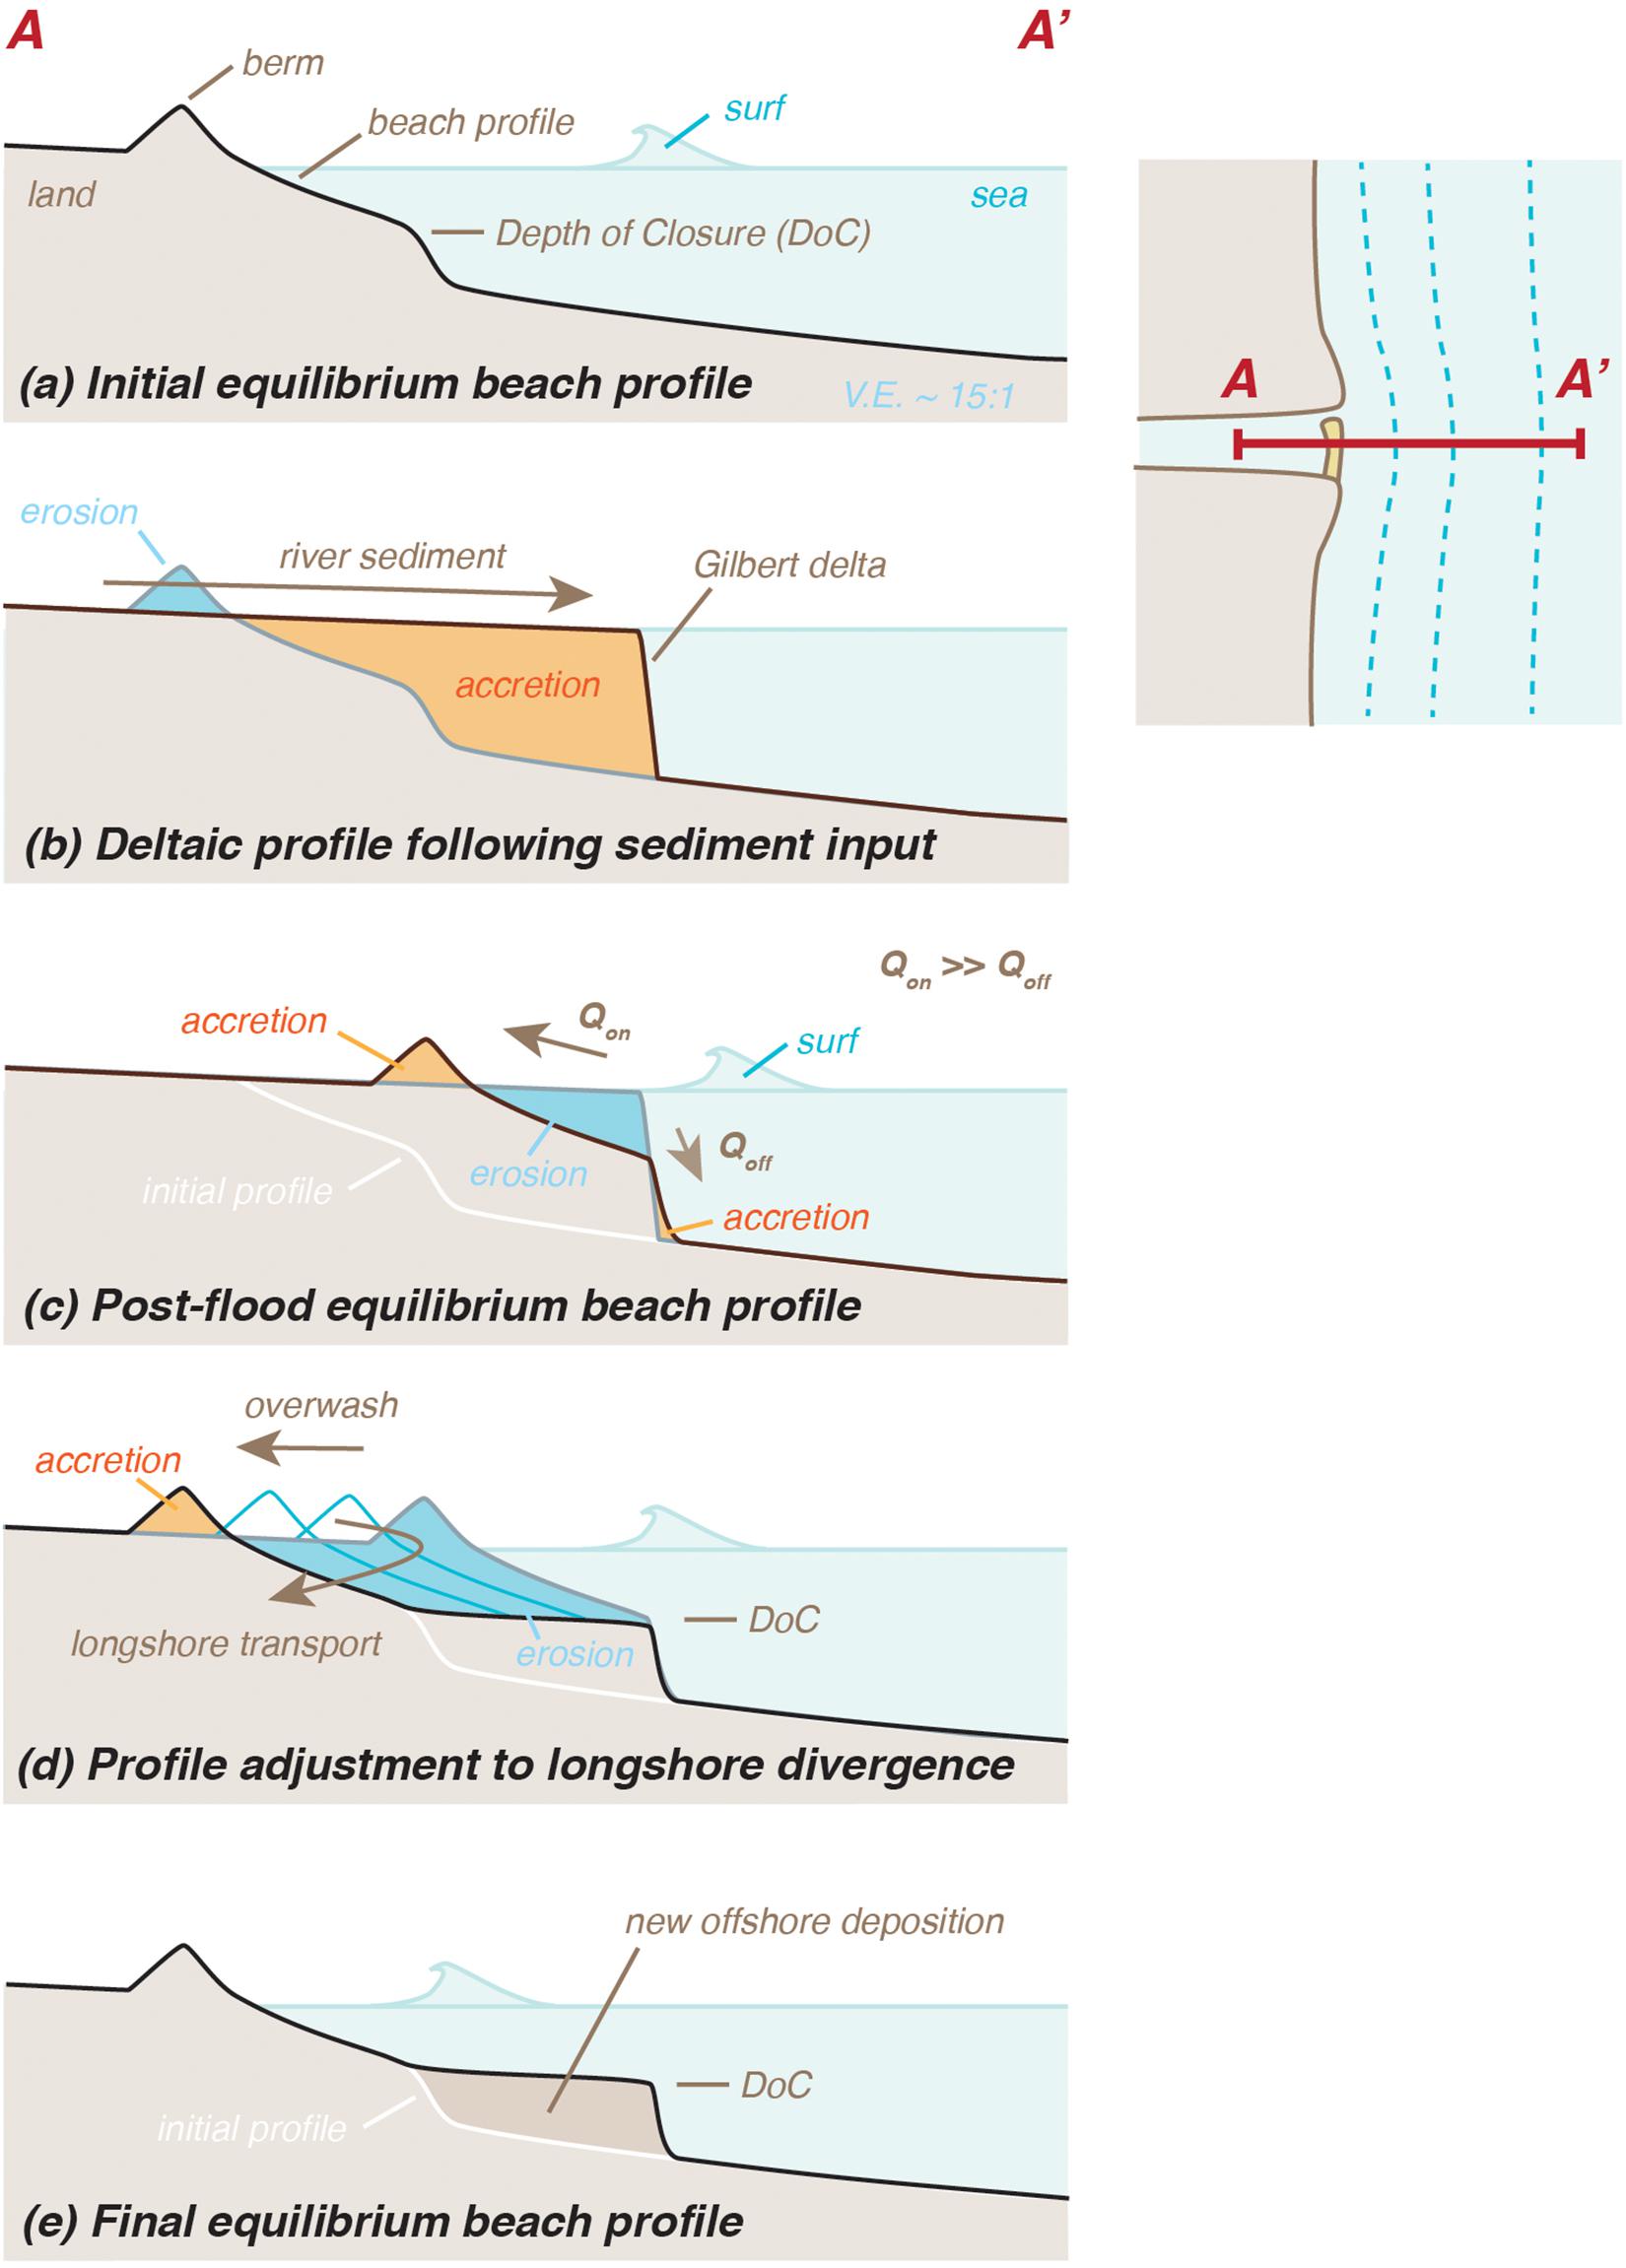
Figure 10. (a–e) Generalized morphodynamic model for river mouths with Gilbert-like delta during and after sediment input from the river based on observations from the Elwha River of Washington. The onshore and offshore fluxes (Qon and Qoff, respectively) of sediment are shown with arrows, and the vertical exacerbation (V.E.) is approximately 15.
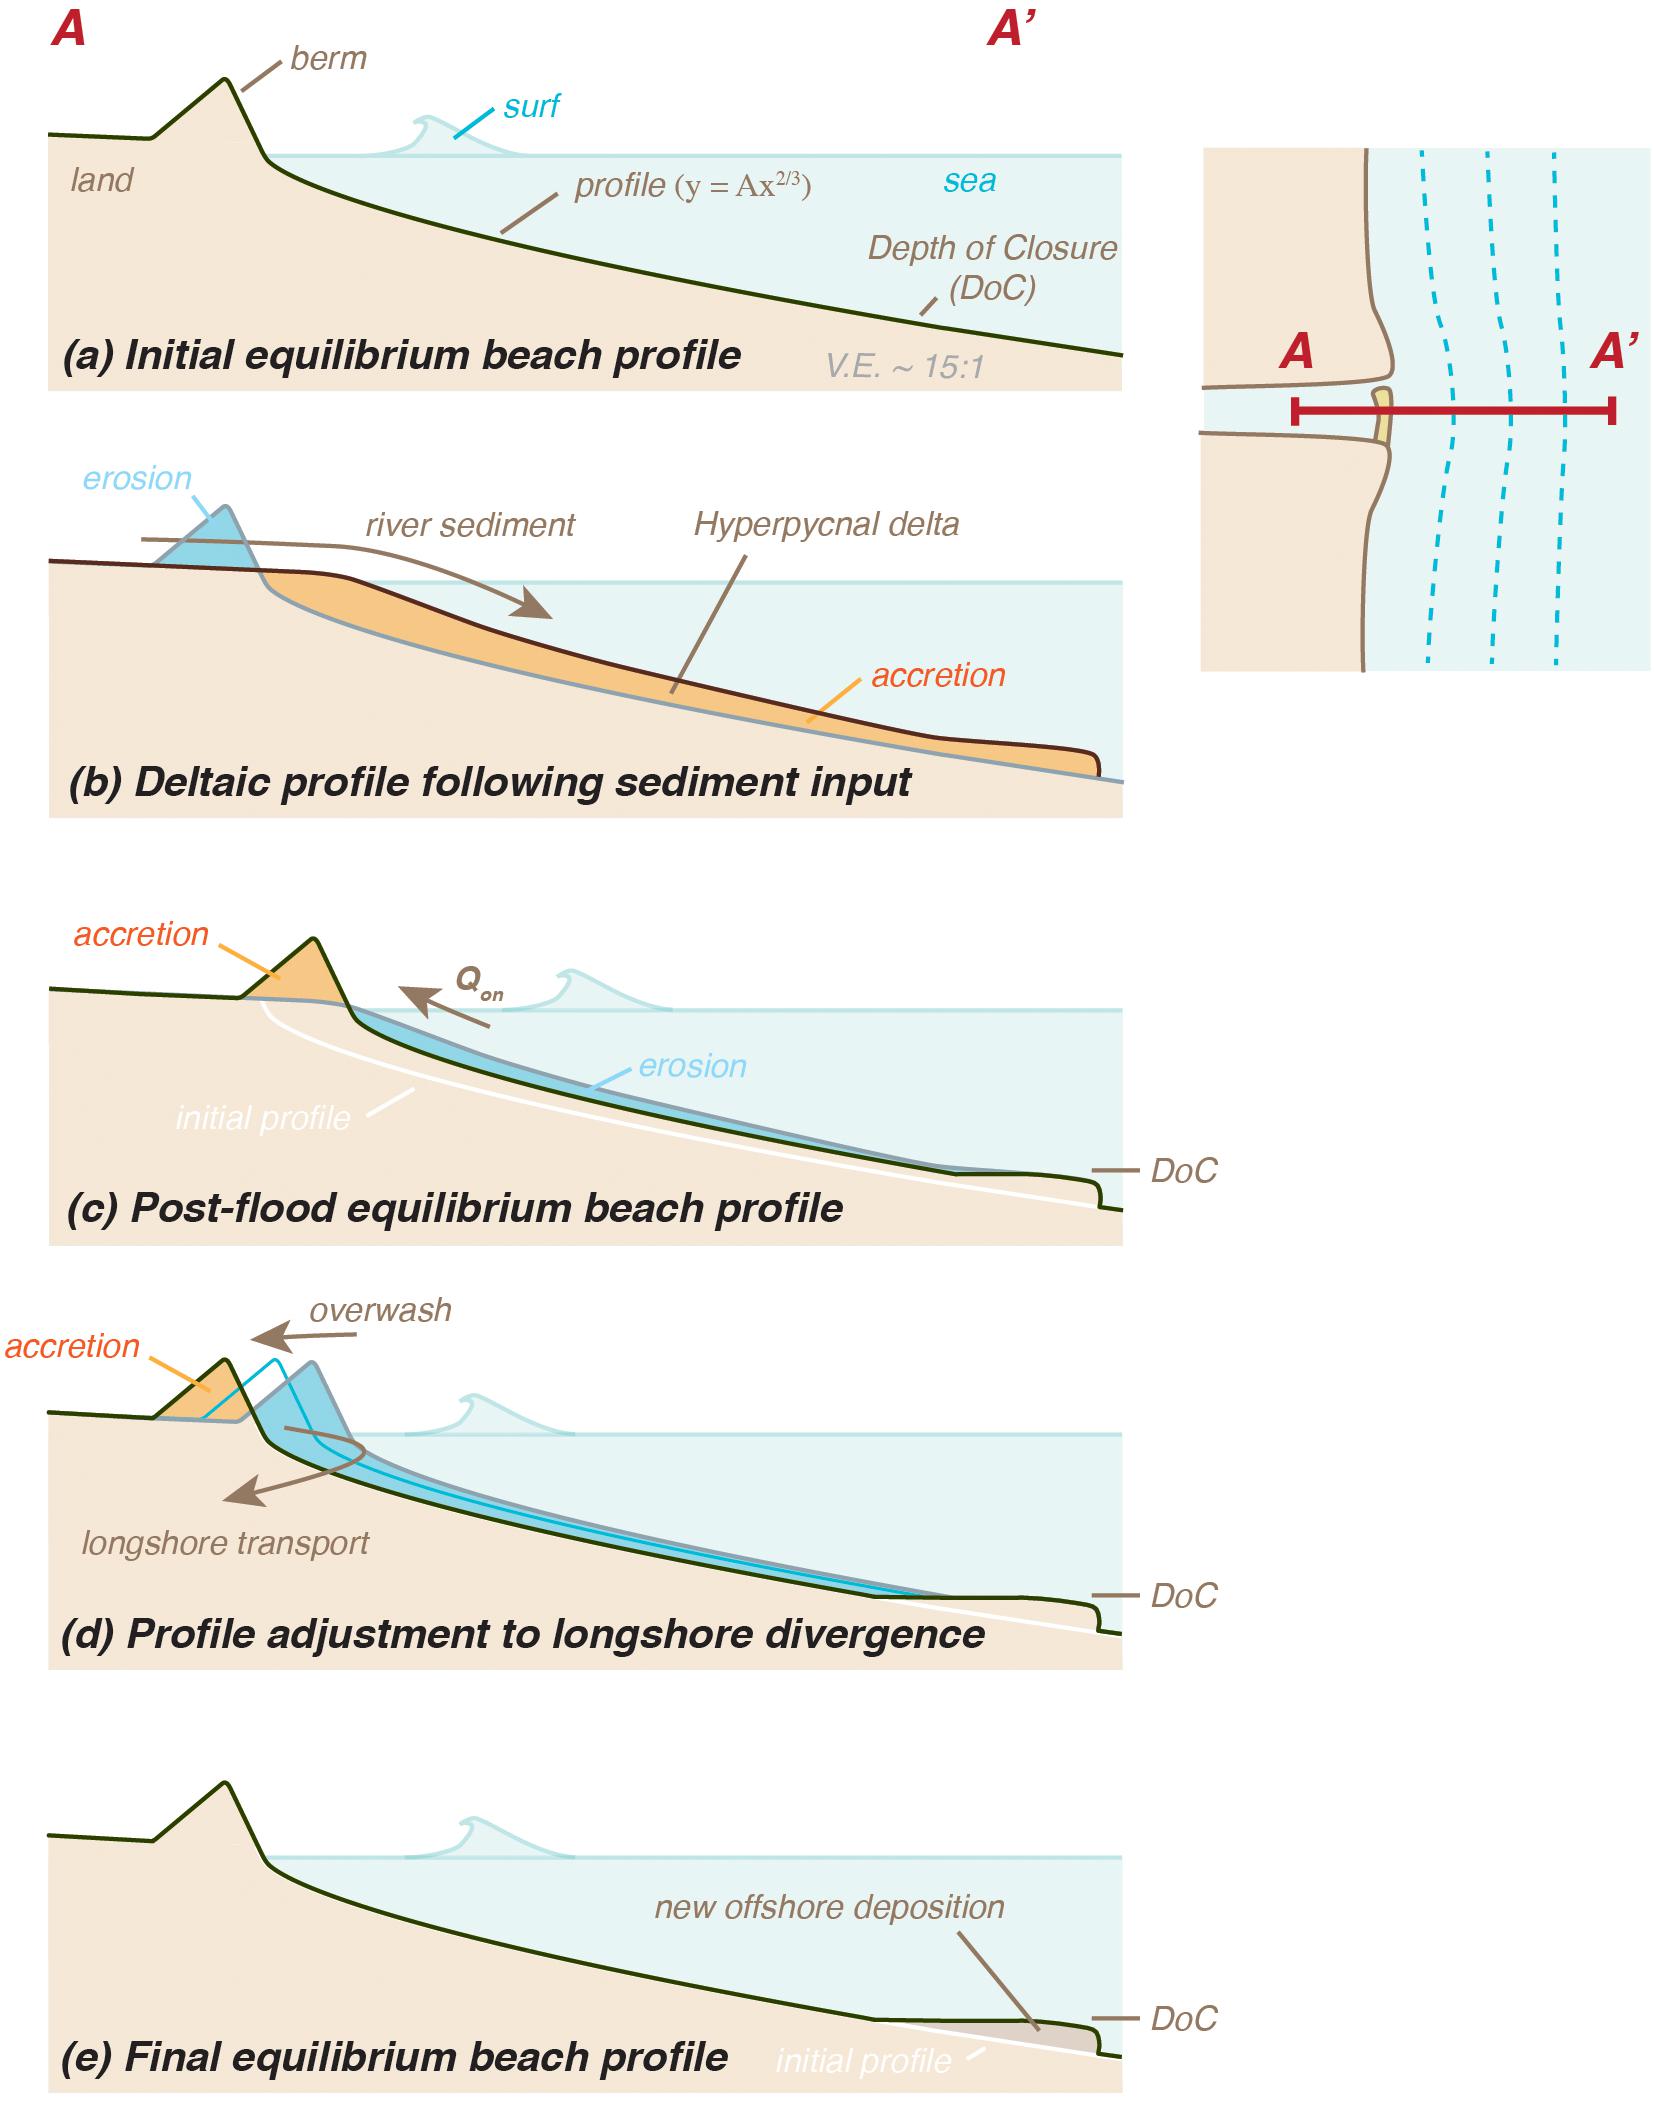
Figure 11. (a–e) Generalized morphodynamic model for river mouths with dispersive or hyperpycal deltas during and after sediment input from the river based on observations from the Santa Clara River of California. Consistent with Figure 10, the vertical exacerbation (V.E.) is approximately 15.
Post-event morphodynamics are initially dominated by cross-shore transport until the subaerial river mouth berm is built, after which sediment transport is longshore-dominated. Within the conceptual model, these dynamics result in the building of the river mouth berm and the reestablishment of the beach profile to the depth of closure (Figures 10c, 11c). The reestablishment of the beach profile is consistent with general profile equilibrium concepts (Dean, 1991), and as such, these concepts are examined in greater detail below with rules-based testing of this model. Cross-shore transport during this early stage may result in both onshore and offshore sediment transport (Qon and Qoff, respectively), although Qoff, is likely low-to-negligible as noted above (Figures 10c, 11c). As the berm and beach profile are reestablished, longshore transport generated from the profile will increase and result in divergence of sediment from the delta front (Figures 10d, 11d). This will result in erosion of the profile and subsequent inland translation of the beach berm driven by overwash processes. Assuming that the littoral transport extends only to the depth of closure, sediment initially deposited deeper than this would be left offshore as the profile translates landward (Figures 10e, 11e). In the end, the scenarios presented here result in new volumes of offshore deposition beyond the depth of closure, which is consistent with observations and volume balances from both the Elwha and Santa Clara River systems (Figures 4, 5 and Table 1).
Rules-Based Geometric Models
These simple conceptual models can be used to generate rules-based geometric models to explore the effects of different transport patterns and/or rates on time-dependent evolution of the river mouth (cf. Dean, 1991; Cowell et al., 1999; Liang et al., 2015). For example, this approach was applied to a scenario scaled to the Elwha River to explore the effects of different rules for cross-shore transport (Figure 12). Several geometric properties were assigned to scale to the Elwha River with a simple equilibrium beach profile (Table 2). Additional rules included: (i) an angle of repose was assumed for all new depositional regions, (ii) the cross-shore and longshore-dominated intervals were assumed to be discrete in time and bounded by the full establishment of the sub-aerial berm, and (iii) longshore transport was assumed to proceed at a constant rate until the river mouth berm reoccupied its original position.
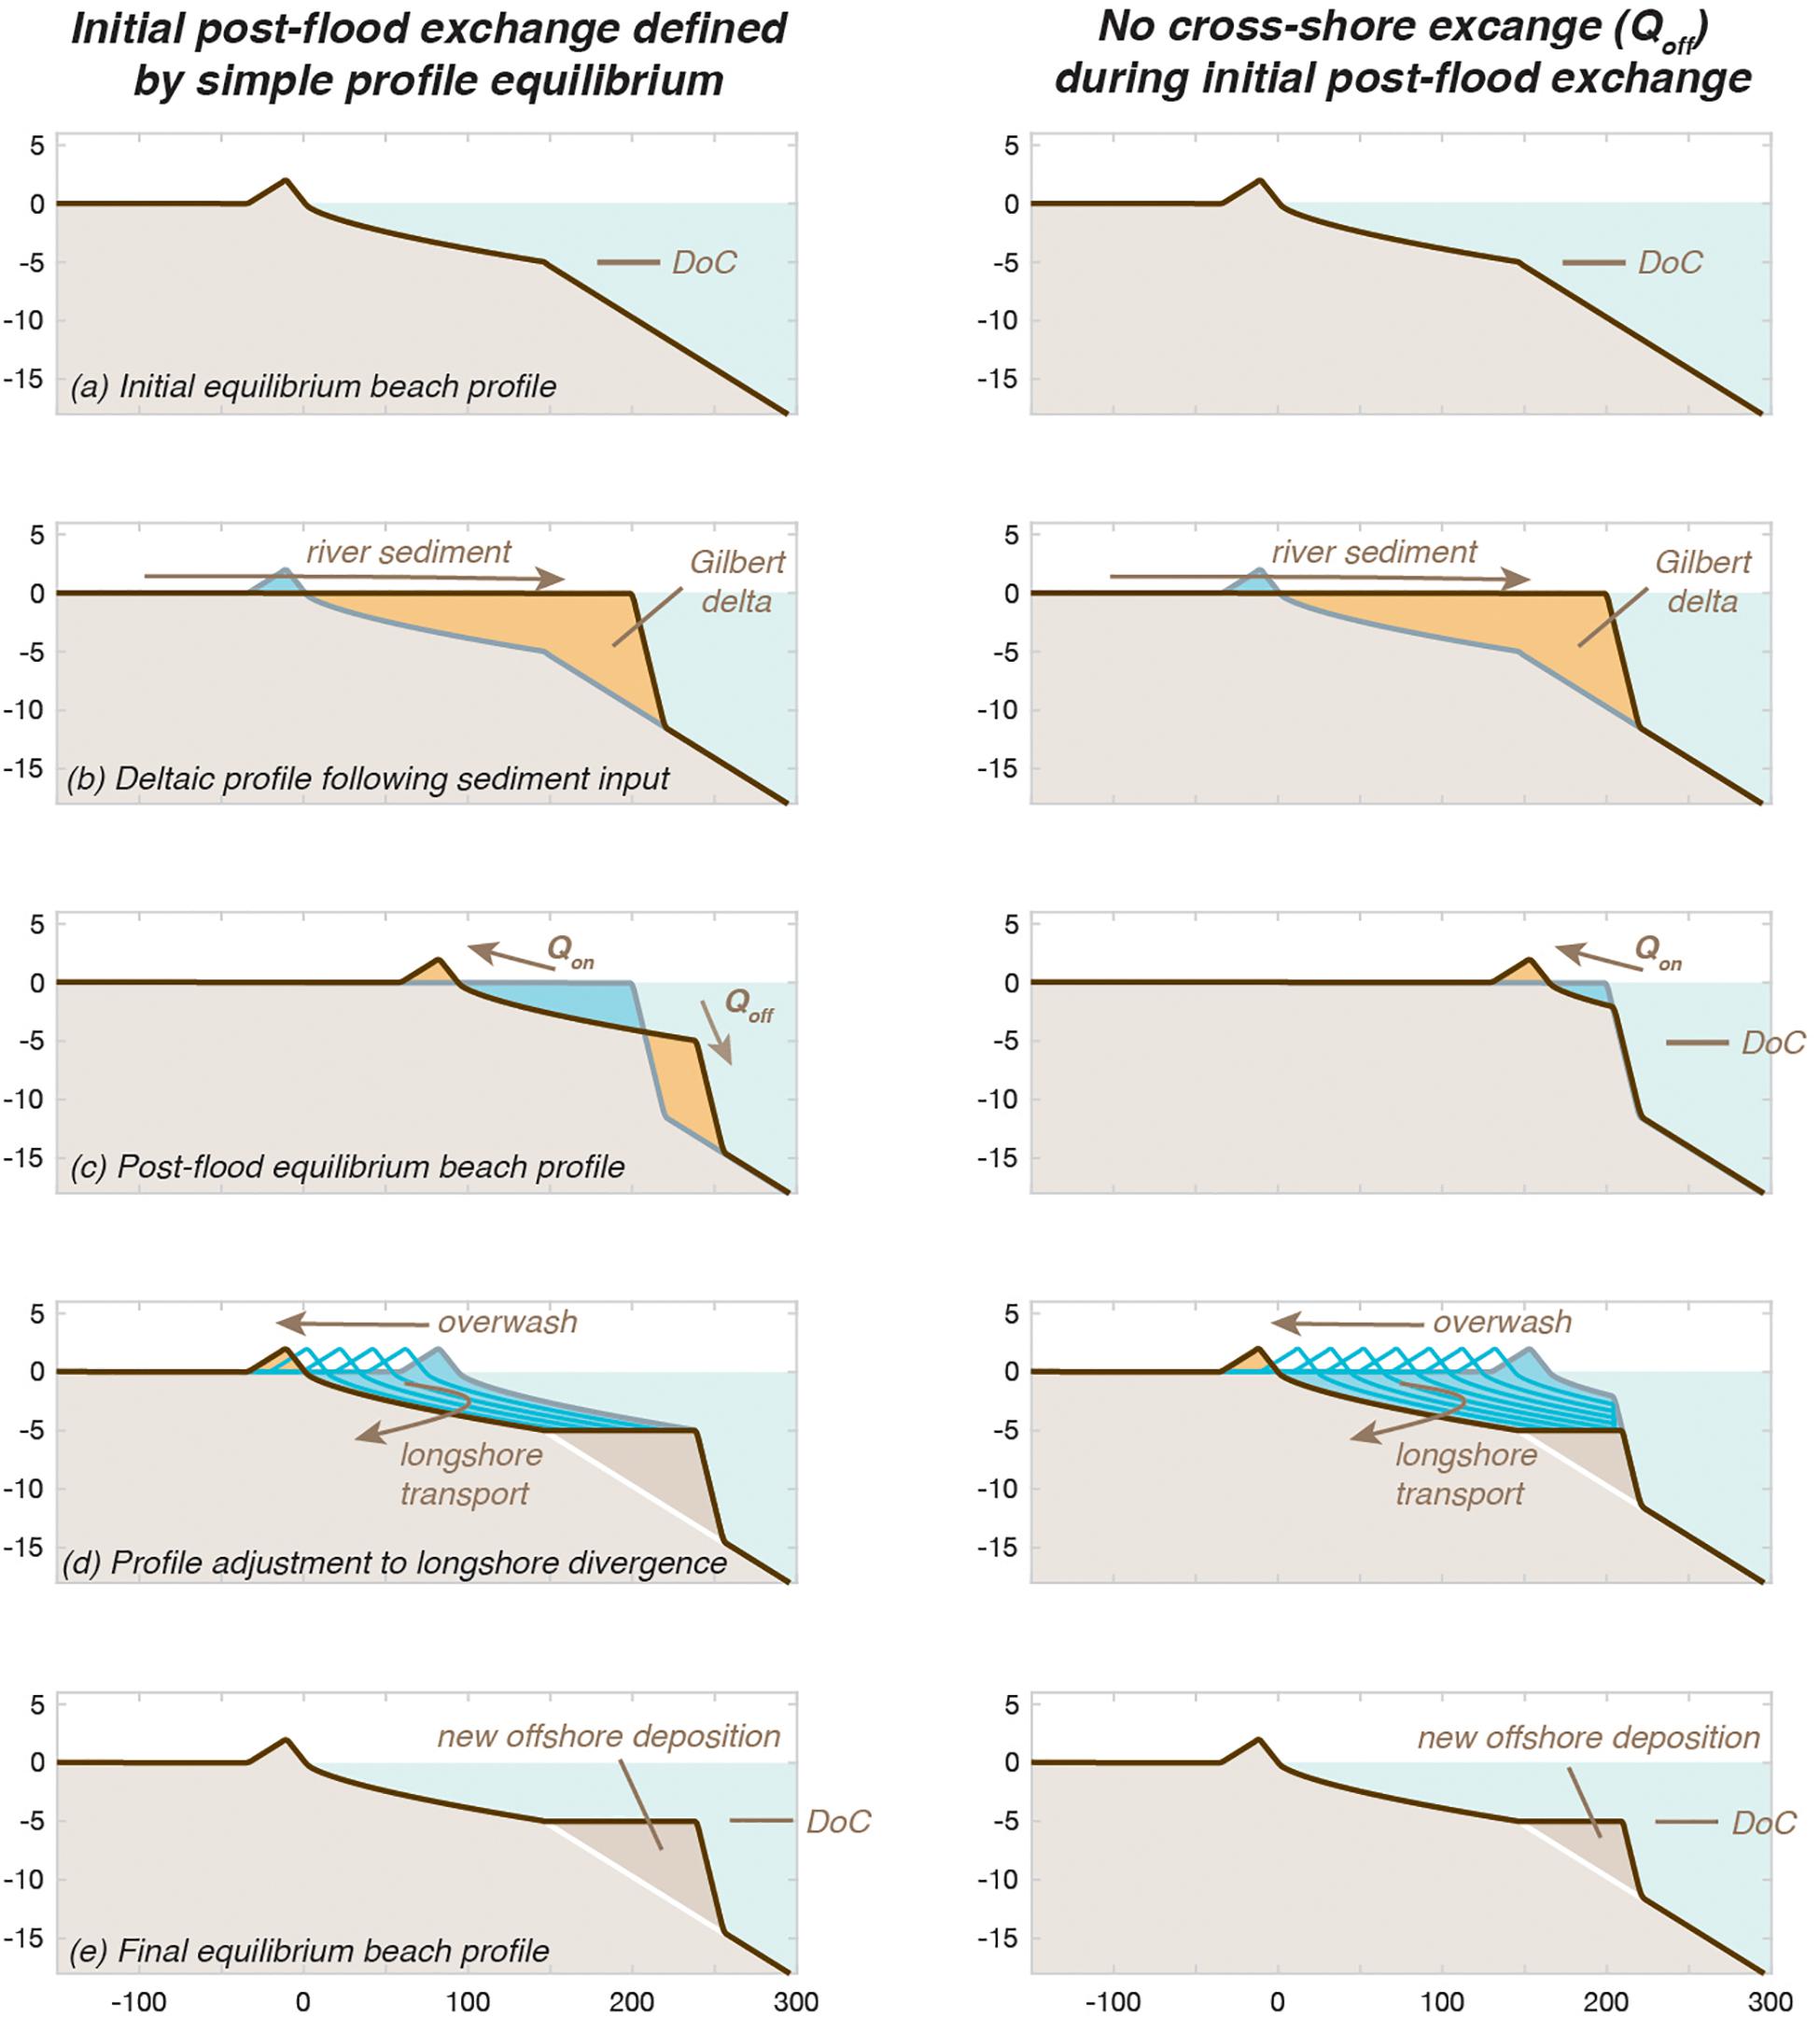
Figure 12. Geometric evolution of a river mouth profile for a Gilbert-like delta deposit using a simple rules-based morphodynamic model with two different conditions. The initial profiles (a) are modified by rules that define the profile shape(s) and sediment transfers for different stages of delta evolution (b–e). The differences in the model output are caused by different rules defining sediment exchanges during the initial post-flood profile evolution (c). For the simple equilibrium condition (left-hand column), the delta profile evolves toward an equilibrium beach profile without constraining the direction or rate of cross-shore sediment transport. The second condition evolves toward an equilibrium profile without offshore transport (right-hand column). Parameters for these models are provided in Table 2.
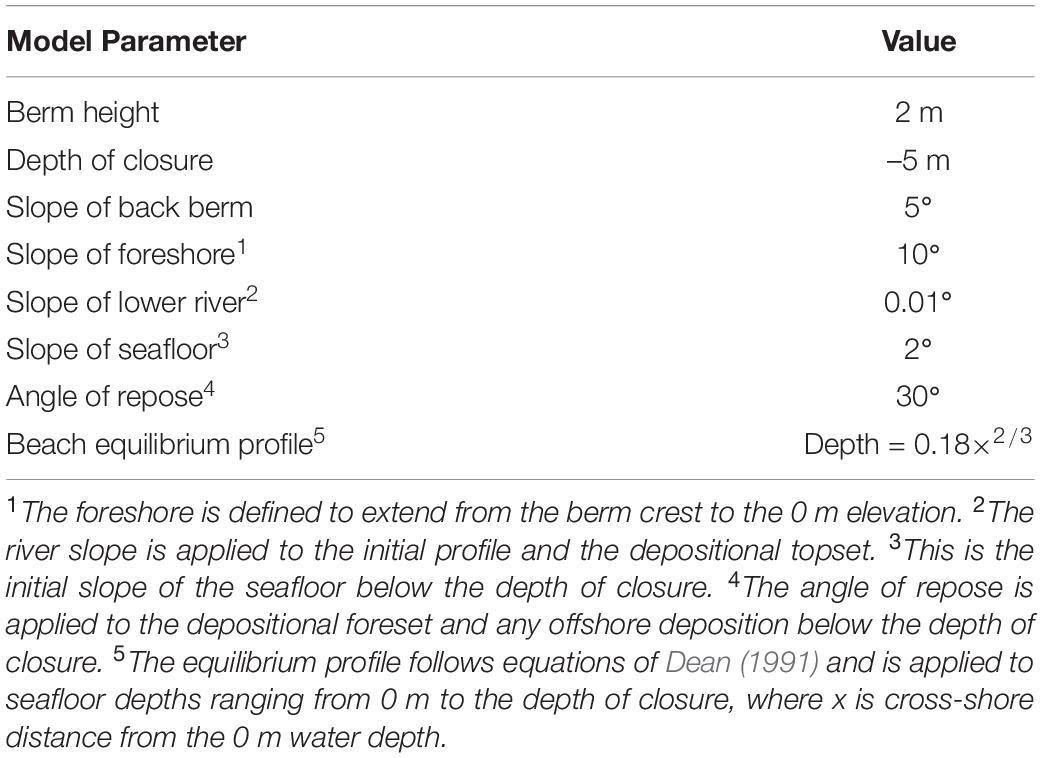
Table 2. Parameters for a simple rules-based morphodynamic model to evaluate the effect of cross-shore transport directions.
Using this framework, two conditions were compared. The first condition incorporated the simple equilibrium profile assumptions for the cross-shore response after techniques of Dean (1991). This response forced the full beach profile to reestablish across the newly deposited delta, ensuring a volume balance, regardless of the transport direction required to generate this outcome. This first model resulted in substantial offshore-directed sediment transport and deposition (Figure 12c; left column). The second model included the observation that offshore transport was generally negligible by allowing cross-shore transport to move only onshore. Erosion of the delta by cross-shore transport was, therefore, limited to the region that satisfied the volume balance needed to construct the onshore river mouth berm (Figure 12c; right column). Following these cross-shore changes, the profiles were allowed to retreat according to a simple constant longshore transport rule (Figure 12d).
Although the sediment input to these models was identical at 887 m3/m, transport patterns and the resulting morphology were considerably different (Figure 12). Using a simple Dean-like equilibrium profile response resulted in 87% of the cross-shore transport to be in the offshore direction (Figure 12c), which was considerably larger than observed for any profile evaluated above (cf. Figure 8). Constraining the offshore transport resulted in a much smaller initial cross-shore profile response (42 versus 270 m3/m), but it also resulted in greater overall longshore transport to reach the final shoreline position (675 versus 440 m3/m for the equilibrium profile). After the full profile adjustment, the equilibrium model resulted in a greater volume of sediment remaining below the depth of closure (447 versus 212 m3/m, which is equivalent to 50 and 24% of the initial deposition, respectively), and this difference was related to the offshore flux of sediment during the initial cross-shore profile response (Figure 12e).
This simple application of the profile conceptual model shows both the utility of these models and how simple assumptions, such as the equilibrium profile response, may generate results that are inconsistent with observations. As such, future applications of these and more complex models may be useful for examining the morphodynamics of river mouths and associated littoral cells, but care should be made in defining model assumptions and rules. Simple assumptions, such as equilibrium profile response (Dean, 1991; Cowell et al., 1999), are not likely valid for the complex sediment transport settings of river mouths.
Synthesis of River Mouth Observations
The observations summarized above have been integrated with understanding from other research into a general planform conceptual model for two different wave conditions: shoreline-parallel wave crests and shoreline-oblique wave crests (Figure 13). This model provides a general overview of how submarine deposition during a river sediment discharge event alters the nearshore bathymetry offshore of the river and also highlights key morphodynamic processes. Following the river sediment input, waves rework the sediment lobe into discontinuous submarine-to-intertidal bars and then a relatively continuous sub-aerial river mouth berm (Figures 13a,b). In the case of oblique waves, this berm may be deflected asymmetrically in the downcoast direction, which may induce downcoast erosion from transport divergence as suggested by Hicks and Inman (1987; Figure 13b). During the subaerial berm formation, the dominant transport pathway at the river mouth transitions from onshore to longshore, which will result in transport divergence at the river mouth owing to the arcuate bulge in the shoreline (Figure 13). The potential for deposition of littoral-grade sediment offshore of the littoral cell (i.e., deeper than the depth of closure) exists for these systems (Figures 13a,b), although a necessary condition for this is the export of sediment beyond the depth of closure during the early phases of the morphodynamics (cf. Figures 10, 11). Observations of river mouth systems that do not deposit sediment beyond the depth of closure have noted fairly rapid incorporation of the new sediment into the littoral cell and negligible new river sediment remaining in the profile (Hicks and Inman, 1987; East et al., 2018). For information about river mouth processes during intervals of time not studied here, several key references are highlighted in Figure 13d.
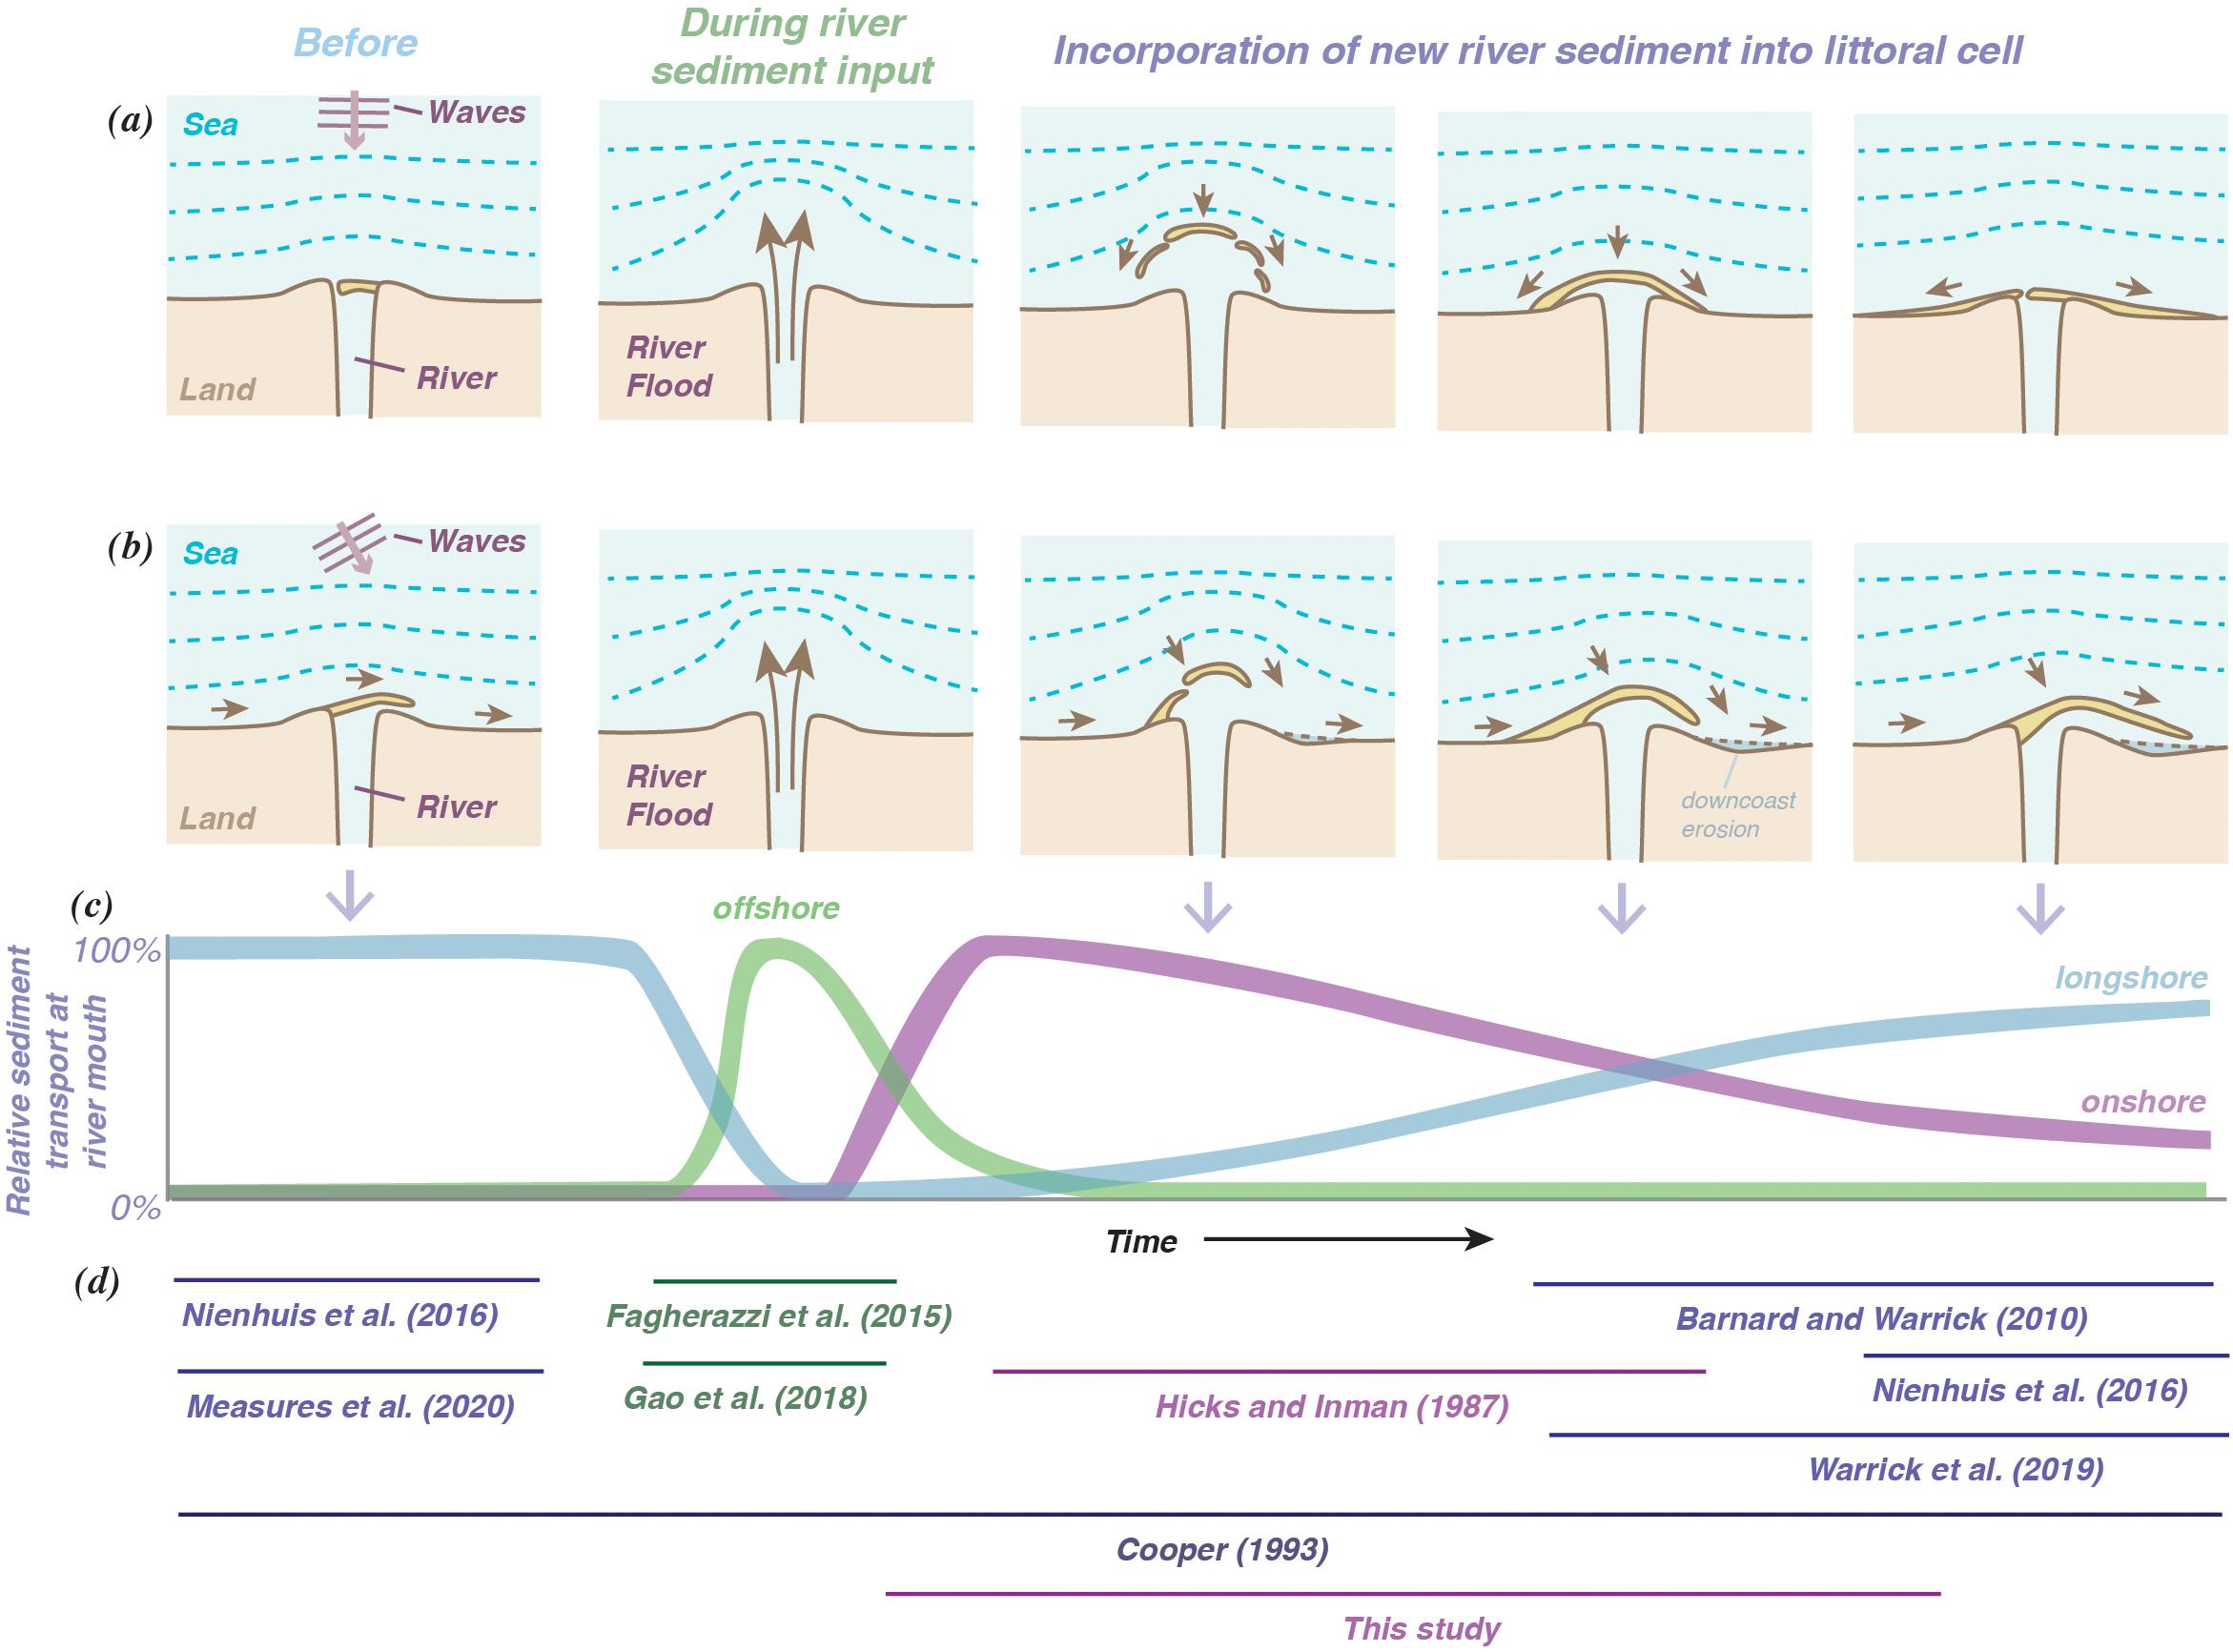
Figure 13. Generalized schematic of sediment from rivers into littoral cells showing the morphodynamic stages before, during and after input. (a) Top row shows a scenario in which ocean waves approach normal to the shoreline; (b) the bottom row shows the effects of oblique wave directions. Sediment transport vectors from fluvial and littoral processes are shown with brown arrows. (c) A generalized model for post-event sediment transport directions. (d) References that provide further information about the patterns and processes of river mouth morphodynamics; horizontal lines highlight the applicable stages and processes of each reference.
Application to River Mouths Globally
It is valuable to consider the diversity of settings where river sediment is discharged into littoral cells to evaluate how and where the results provided herein may be applicable. To discharge littoral-grade sediment, which is commonly sand to gravel grain size (Limber et al., 2008), the hydrodynamics of the lower reach of a river will have to facilitate coarse-grained sediment transport. Many rivers of the world do not meet these conditions, such as found for most U.S. rivers draining to the Atlantic Ocean and other passive tectonic margin and low-gradient coasts (Meade, 1982). As noted in the Introduction section, rivers that discharge littoral-grade sediment to the coast are generally on active tectonic settings, where short, steep and erosion-prone watersheds exist (Inman and Nordstrom, 1971; Komar, 1998, 2010; Anthony and Blivi, 1999; Willis and Griggs, 2003; Giosan et al., 2005; Barnard and Warrick, 2010; Boateng et al., 2012; Anthony et al., 2014).
However, it has been shown that many of the steep, small rivers that discharge littoral-grade sediment to the coast may not have recognizable deltaic landforms (Caldwell et al., 2019). Many of these small rivers are characterized as river channels terminating at wave-dominated beaches (Caldwell et al., 2019), which is often how these systems appear during intervals of time between their infrequent sediment discharge events (Milliman and Farnsworth, 2013). A well-known example are the beaches of southern California, where several rivers provide the dominant supply of littoral sand to the region (Inman and Brush, 1973; Inman and Jenkins, 1999; Griggs et al., 2005; Warrick, 2009). None of these rivers have deltas as classified by the techniques of Caldwell et al. (2019), which suggests that important river-derived sediment supplies of littoral sediment may occur where deltas are not easily recognizable. On a global scale, steep rivers with small-to-negligible deltas occur along tectonically active coastal margins, and ocean settings of these margins commonly result in wave-dominated river mouths and beaches (Inman and Nordstrom, 1971; Hicks and Inman, 1987; Milliman and Syvitski, 1992; Hovius et al., 1997; Hicks et al., 2004; Kao and Milliman, 2008; Milliman and Farnsworth, 2013).
An examination of coasts along tectonically active margins of the world will reveal thousands of river mouth settings, many of which have significant time-dependent changes (Nienhuis et al., 2020). For example, two regions with high sediment yield watersheds and dynamic coasts are New Zealand and Taiwan, which combined have dozens of river mouths that experience significant inputs of sediment during hydrologic events (Griffiths, 1979; Kirk, 1980, 1991; Gibb and Adams, 1982; Shulmeister and Kirk, 1997; Hovius et al., 2000; Hicks et al., 2004; Addington et al., 2007; Hsu et al., 2007; Kao and Milliman, 2008; Hart, 2009; Komar, 2010). River mouths of these settings are inherently dynamic and include river bar breaching during high river flow and inlets that migrate, overwash, and occasionally close during lower flows (Hart, 2009; Measures et al., 2020). Imagery from a few of these rivers provide examples of the morphodynamics of these systems following river discharge events, including offshore bar formation after high flows and bar migration and evolution during the months to years following discharge events (see Supplementary Materials). Additionally, imagery also provides evidence that these morphodynamic cycles can happen repetitively over time and dramatically reorganize the wave-dominated delta planform shoreline (see Supplementary Materials). Thus, there is evidence that the morphodynamic patterns summarized above may be applicable to a broad set of rivers and littoral cells throughout the world, especially in similar tectonic and open ocean settings, such as found around the rim of the Pacific Ocean (Inman and Nordstrom, 1971; Milliman and Syvitski, 1992; Milliman and Farnsworth, 2013).
Although many investigations have explored the morphodynamics of these small river mouths, studies generally focus on the sub-aerial beach of the river mouth and the dynamics of river barrier breaching, which, although important to resource management and ecosystem services, do not include an overall sediment mass balance (Hume and Herdendorf, 1988; Kirk, 1991; Bird, 1994; Cooper, 2001; Bittencourt et al., 2007; Hart, 2009; Lichter et al., 2011; Behrens et al., 2013; Measures et al., 2020). A key method to capture the sediment mass balance is the collection of frequent, high-accuracy coastal topography and bathymetry, which can be challenging and expensive to obtain but are essential to understanding the morphodynamic patterns and sediment budgets (Zăinescu et al., 2019).
For the limited studies that have included bathymetric measurements of river mouths, their results are generally consistent with the observations shown here and described in the conceptual models (Figures 10, 11, 13). For example, early studies noted the initial deposition of river sediments in the submarine portion of the delta and rapid shoreline morphodynamics after the river flows receded (Hicks and Inman, 1987; Cooper, 1993). The new river sediments were described to be reworked by ocean waves into emergent bars and then river mouth barriers and littoral sediments over intervals of months to years (Hicks and Inman, 1987; Cooper, 1993), consistent with observations synthesized here (Figure 8). More recent observations of the San Lorenzo River of California provide additional sediment budgets of the submarine deposition of sediment and the reworking of this sediment into subaerial bars and littoral sediments, although in contrast to the Santa Clara and Elwha River data shown here, there was not long-term offshore deposition (East et al., 2018). The new results summarized here suggest that the lack of long-term offshore deposition would occur if the initial deposition is within the depth of closure, which is consistent with East et al. (2018).
Additionally, exceptionally large sediment discharge events have been shown to fundamentally alter shoreline morphodynamics and coastal sediment budgets. For example, a catastrophic volcanic eruption in 1902 within the Samala River, Guatemala, increased river sediment loads and resulted in 7 km of seaward progradation of its delta during the subsequent two decades (Kuenzi et al., 1979). This massive expansion of the delta resulted in lateral redistribution of sand into the littoral cell and a modern arcuate shoreline form that continues to extend ∼1 km seaward of the pre-1902 shoreline. As such, it should be acknowledged that the time scales for the coastal adjustment from a river sediment discharge event may range from months to decades, depending on the volume of sediment and the coastal processes acting on the sediment during the post-event interval.
A key consideration, then, to river mouth morphodynamics is the initial shape and location of the sediment deposit. Where littoral-grade sediment is initially deposited at depths below the active littoral cell, it may not come back to the beach over the scales of time sampled here. For example, watersheds that regularly produce plunging hyperpycnal (negatively buoyant) currents from exceptional sediment concentrations transport sediments to water depths beyond typical depths of closure (Mulder et al., 2003; Warrick and Milliman, 2003; Hicks et al., 2004). Example settings where this “loss” of sediment occurs includes relatively flat continental shelves, for which sands can be transported to mid-shelf settings (Warrick et al., 2013; Steel et al., 2016), and also steep submarine canyons, such as observed at Fiamara of Sicily, Gaoping Submarine Canyon of Taiwan, and the Var Submarine Canyon of France, which all transport sands to the deep sea (Mulder et al., 2003; Khripounoff et al., 2009; Casalbore et al., 2011; Liu et al., 2012). Additionally, the offshore “loss” of littoral-grade sediment may also occur off of the foresets of Gilbert-like delta as shown for the Elwha River herein.
Thus, there is considerable evidence from other river mouths that the fundamental pathways and time-dependent patterns of sediment transport described here are broadly applicable to wave-dominated river mouths with infrequent sediment discharge events. Exceptions and variations to these models certainly exist, and specific watershed and river mouth conditions likely play important roles in the ultimate transfer and transport of sediment into and around the coast.
Conclusion
A synthesis of the morphodynamics of river mouths was derived from surveys of sediment discharge events at markedly different systems. This resulted in a new understanding of time-dependent cross-shore and longshore sediment transport patterns following river sediment discharge events. Initially, onshore-dominated transport occurs during the transformation of the submarine river mouth bar into a subaerial berm. Within weeks to months, this transitions into longshore-dominated transport with overwash-controlled berm retreat. These findings appear to be consistent with observations of other small river mouth settings, especially those along tectonically active settings.
Although generalized conceptual models were derived from a synthesis of quantitative results, there remain several hypotheses and unknowns about river mouth morphodynamics that could use further investigation. These include the discontinuous morphology of the river mouth bars observed at the Elwha River (Zurbuchen et al., 2020), and whether this is representative of other river mouth settings. Why do river mouth bars become discontinuous and how is this related to the coastal and riverine setting? Furthermore, how are water and sediment transport patterns related to this three-dimensional bar morphology? And how does this complex morphology evolve with time to become the more continuous river mouth berm?
The greatest rates of morphologic change were consistently measured during the intervals immediately following river sediment deposition, when onshore transport dominated and the river mouth bar emerged from a submarine to a subaerial state. What are the dominant patterns and processes that dictate these morphodynamics? Are there feedbacks between the morphology and the physical processes that alter the river mouth bars? It is hypothesized that coastal waves are a dominant factor in these bar-to-berm transformations, but waves are inherently complex, especially around three-dimensional coastal landforms and in areas with net flow from river and tidal conditions. It would be useful to measure or simulate these physical processes under varying conditions to build a better understanding for the rates, styles and drivers of river mouth transformation.
Although the initial transport following deposition of river sediment was found to be largely onshore, subsequent offshore transport was measured for some limited conditions of the Elwha River. This transport may be related to the adjustment of the beach profile during a time when longshore transport was inhibited by the broader morphology of the delta landform. It would be valuable to better characterize both the conditions under which offshore transport occurs, as well as the frequency and magnitude of this offshore transport, to better constrain coastal sediment budgets and stratigraphic models of deltas.
Lastly, the results of both the Elwha and Santa Clara River systems suggest that littoral-grade sediment may be deposited in water depths from which the sediment may not return to the shoreline and littoral cell (Table 1). This may be considered an incomplete integration of the littoral-grade river sediment into the littoral cell, thereby resulting in a “loss” of potential littoral sediment. Although this is an important finding that is consistent with literature on hyperpycnal flows from rivers, it would be valuable to better characterize the applicability of these findings to other systems, perhaps with a synthesis of shelf sediment deposits offshore of modern river mouths.
Data Availability Statement
Publicly available datasets were analyzed in this study. This data can be found here: Barnard et al. (2009), Barnard and Warrick (2010), and Stevens et al. (2017).
Author Contributions
The author compiled and analyzed all the data, made figures and tables, and wrote the manuscript text.
Funding
This research was supported by the U.S. Geological Survey–s Coastal and Marine Hazard and Resources Program.
Conflict of Interest
The author declares that the research was conducted in the absence of any commercial or financial relationships that could be construed as a potential conflict of interest.
Acknowledgments
I am thankful for the thorough reviews and suggested improvements from Olivia Cheriton, Guy Gelfenbaum, Chris Magirl, and the three reviewers.
Supplementary Material
The Supplementary Material for this article can be found online at: https://www.frontiersin.org/articles/10.3389/feart.2020.00355/full#supplementary-material
References
Aagaard, T. (2014). Sediment supply to beaches: cross-shore sand transport on the lower shoreface. J. Geophys. Res. Earth Surf. 119, 913–926. doi: 10.1002/2013JF003041
Addington, L. D., Kuehl, S. A., and McNinch, J. E. (2007). Contrasting modes of shelf sediment dispersal off a high-yield river: Waiapu River. New Zealand. Mar. Geol. 243, 18–30. doi: 10.1016/j.margeo.2007.04.018
Anderson, S. W. (2019). Uncertainty in quantitative analyses of topographic change: error propagation and the role of thresholding. Earth Surf. Process. Landf. 44, 1015–1033. doi: 10.1002/esp.4551
Anthony, E. J. (2015). Wave influence in the construction, shaping and destruction of river deltas: a review. Mar. Geol. 361, 53–78. doi: 10.1016/j.margeo.2014.12.004
Anthony, E. J., and Blivi, A. B. (1999). Morphosedimentary evolution of a delta-sourced, drift-aligned sand barrier–lagoon complex, western Bight of Benin. Mar. Geol. 158, 161–176. doi: 10.1016/S0025-3227(98)00170-4
Anthony, E. J., Brunier, G., Besset, M., Goichot, M., Dussouillez, P., and Nguyen, V. L. (2015). Linking rapid erosion of the Mekong River delta to human activities. Sci. Rep. 5:14745. doi: 10.1038/srep14745
Anthony, E. J., Marriner, N., and Morhange, C. (2014). Human influence and the changing geomorphology of Mediterranean deltas and coasts over the last 6000years: from progradation to destruction phase? Earth-Sci. Rev. 139, 336–361. doi: 10.1016/j.earscirev.2014.10.003
Ashton, A. D., and Giosan, L. (2011). Wave-angle control of delta evolution: wave-angle control of delta evolution. Geophys. Res. Lett. 38:L13405. doi: 10.1029/2011GL047630
Ashton, A. D., Hutton, E. W. H., Kettner, A. J., Xing, F., Kallumadikal, J., Nienhuis, J., et al. (2013). Progress in coupling models of coastline and fluvial dynamics. Comput. Geosci. 53, 21–29. doi: 10.1016/j.cageo.2012.04.004
Bailard, J. A. (1981). An energetics total load sediment transport model for a plane sloping beach. J. Geophys. Res. Oceans 86, 10938–10954. doi: 10.1029/JC086iC11p10938
Barnard, P. L., Hoover, D., Hubbard, D. M., Snyder, A., Ludka, B. C., Allan, J., et al. (2017). Extreme oceanographic forcing and coastal response due to the 2015–2016 El Niño. Nat. Commun. 8, 1–8. doi: 10.1038/ncomms14365
Barnard, P. L., Hubbard, D. M., and Dugan, J. E. (2012). Beach response dynamics of a littoral cell using a 17-year single-point time series of sand thickness. Geomorphology 13, 588–598. doi: 10.1016/j.geomorph.2011.12.023
Barnard, P. L., Revell, D. L., Hoover, D., Warrick, J., Brocatus, J., Draut, A. E., et al. (2009). Coastal Processes Study of Santa Barbara and Ventura Counties, California. Reston, VI: U.S. Geological Survey.
Barnard, P. L., Short, A. D., Harley, M. D., Splinter, K. D., Vitousek, S., Turner, I. L., et al. (2015). Coastal vulnerability across the Pacific dominated by El Niño/Southern Oscillation. Nat. Geosci. 8:801.
Barnard, P. L., and Warrick, J. A. (2010). Dramatic beach and nearshore morphological changes due to extreme flooding at a wave-dominated river mouth. Mar. Geol. 271, 131–148. doi: 10.1016/j.margeo.2010.01.018
Behrens, D. K., Bombardelli, F. A., Largier, J. L., and Twohy, E. (2013). Episodic closure of the tidal inlet at the mouth of the Russian River — A small bar-built estuary in California. Geomorphology 189, 66–80. doi: 10.1016/j.geomorph.2013.01.017
Bird, E. C. F. (1994). “Chapter 2 Physical Setting and Geomorphology of Coastal Lagoons,” in Elsevier Oceanography Series Coastal Lagoon Processes, ed. B. Kjerfve (Amsterdam: Elsevier), 9–39. doi: 10.1016/S0422-9894(08)70007-2
Bittencourt, A. C. D. S. P., Dominguez, J. M. L., Fontes, L. C. S., Sousa, D. L., Silva, I. R., and Da Silva, F. R. (2007). Wave Refraction, River Damming, and Episodes of Severe Shoreline Erosion: the São Francisco River Mouth, Northeastern Brazil. J. Coast. Res. 234, 930–938. doi: 10.2112/05-0600.1
Boateng, I., Bray, M., and Hooke, J. (2012). Estimating the fluvial sediment input to the coastal sediment budget: a case study of Ghana. Geomorphology 138, 100–110. doi: 10.1016/j.geomorph.2011.08.028
Brandon, M. T., Roden-Tice, M. K., and Garver, J. I. (1998). Late Cenozoic exhumation of the Cascadia accretionary wedge in the Olympic Mountains, northwest Washington State. GSA Bull. 110, 985–1009. doi: 10.1130/0016-76061998110<0985:LCEOTC<2.3.CO;2
Butt, T., and Russell, P. (2000). hydrodynamics and cross-shore sediment transport in the swash-zone of natural beaches: a review. J. Coast. Res. 16, 255–268.
Caldwell, R. L., Edmonds, D. A., Baumgardner, S., Paola, C., Roy, S., and Nienhuis, J. H. (2019). A global delta dataset and the environmental variables that predict delta formation on marine coastlines. Earth Surf. Dyn. 7, 773–787. doi: 10.5194/esurf-7-773-2019
Carter, L., Milliman, J. D., Talling, P. J., Gavey, R., and Wynn, R. B. (2012). Near-synchronous and delayed initiation of long run-out submarine sediment flows from a record-breaking river flood, offshore Taiwan. Geophys. Res. Lett. 39:12603. doi: 10.1029/2012GL051172
Casalbore, D., Chiocci, F. L., Scarascia Mugnozza, G., Tommasi, P., and Sposato, A. (2011). Flash-flood hyperpycnal flows generating shallow-water landslides at Fiumara mouths in Western Messina Strait (Italy). Mar. Geophys. Res. 32, 257–271. doi: 10.1007/s11001-011-9128-y
Cooper, J. A. G. (1993). Sedimentation in a river dominated estuary. Sedimentology 40, 979–1017. doi: 10.1111/j.1365-3091.1993.tb01372.x
Cooper, J. A. G. (2001). Geomorphological variability among microtidal estuaries from the wave-dominated South African coast. Geomorphology 40, 99–122. doi: 10.1016/S0169-555X(01)00039-3
Cowell, P. J., Roy, P. S., Cleveringa, J., and Boer, P. L. D. (1999). Simulating coastal systems tracts using the shoreface translation model. Soc. Econ. Palaeontol. Mineral. Spec. Publ. 41, 165–175.
Dean, R. G. (1991). Equilibrium beach profiles: characteristics and applications. J. Coast. Res. 7, 53–84.
East, A. E., Stevens, A. W., Ritchie, A. C., Barnard, P. L., Campbell-Swarzenski, P., Collins, B. D., et al. (2018). A regime shift in sediment export from a coastal watershed during a record wet winter, California: implications for landscape response to hydroclimatic extremes. Earth Surf. Process. Landf. 43, 2562–2577. doi: 10.1002/esp.4415
Elias, E. P. L., Barnard, P. L., and Brocatus, J. (2009). Littoral transport rates in the santa barbara littoral cell: a process- based model analysis. J. Coast. Res. 6, 947–951.
Falqués, A. (2006). Wave driven alongshore sediment transport and stability of the Dutch coastline. Coast. Eng. 53, 243–254. doi: 10.1016/j.coastaleng.2005.10.012
Fan, S., Swift, D. J. P., Traykovski, P., Bentley, S., Borgeld, J. C., Reed, C. W., et al. (2004). River flooding, storm resuspension, and event stratigraphy on the northern California shelf: observations compared with simulations. Mar. Geol. 210, 17–41. doi: 10.1016/j.margeo.2004.05.024
FitzGerald, D. M., Fenster, M. S., Argow, B. A., and Buynevich, I. V. (2008). Coastal Impacts Due to Sea-Level Rise. Annu. Rev. Earth Planet. Sci. 36, 601–647. doi: 10.1146/annurev.earth.35.031306.140139
Gao, W., Shao, D., Wang, Z. B., Nardin, W., Yang, W., Sun, T., et al. (2018). Combined Effects of Unsteady River Discharges and Wave Conditions on River Mouth Bar Morphodynamics. Geophys. Res. Lett. 45, 903–912. doi: 10.1029/2018GL080447
Gelfenbaum, G., Stevens, A. W., Miller, I., Warrick, J. A., Ogston, A. S., and Eidam, E. (2015). Large-scale dam removal on the Elwha River, Washington, USA: coastal geomorphic change. Geomorphology 246, 649–668. doi: 10.1016/j.geomorph.2015.01.002
Gibb, J. G., and Adams, J. (1982). A sediment budget for the east coast between Oamaru and Banks Peninsula, South Island, New Zealand. N. Z. J. Geol. Geophys. 25, 335–352. doi: 10.1080/00288306.1982.10421497
Giosan, L., and Bhattacharya, J. P. (eds) (2005). River Deltas-Concepts, Models, and Examples. SEPM. Tulsa: Society for Sedimentary Geology. doi: 10.2110/pec.05.83
Giosan, L., Donnelly, J. P., Vespremeanu, E., Bhattacharya, J. P., and Olariu, C. (2005). River delta morphodynamics: Examples from the Danube Delta. Available online at: https://pdfs.semanticscholar.org/3fac/80ccb163c420c691a6c401ee5e5f7ca15eff.pdf?_ga=2.153875064.1951386744.1597641694-907029459.1582451746 (accessed September 23, 2019).
Gran, K. B., and Montgomery, D. R. (2005). Spatial and temporal patterns in fluvial recovery following volcanic eruptions: channel response to basin-wide sediment loading at Mount Pinatubo, Philippines. GSA Bull. 117, 195–211. doi: 10.1130/B25528.1
Griffiths, G. A. (1979). High sediment yields from major rivers of the Western Southern Alps, New Zealand. Nature 282, 61–63. doi: 10.1038/282061a0
Griggs, G. B., Patsch, K. B., and Savoy, L. (eds) (2005). Living with the Changing California Coast. First. Berkeley: University of California Press.
Hart, D. E. (2009). Morphodynamics of Non-Estuarine Rivermouth Lagoons on High- Energy Coasts. J. Coast. Res. 56, 1355–1359.
Hicks, D. M., Gomez, B., and Trustrum, N. A. (2004). Event Suspended Sediment Characteristics and the Generation of Hyperpycnal Plumes at River Mouths: East Coast Continental Margin, North Island, New Zealand. J. Geol. 112, 471–485. doi: 10.1086/421075
Hicks, D. M., and Inman, D. L. (1987). Sand dispersion from an ephemeral river delta on the Central California coast. Mar. Geol. 77, 305–318. doi: 10.1016/0025-3227(87)90119-8
Hovius, N., Stark, C. P., and Allen, P. A. (1997). Sediment flux from a mountain belt derived by landslide mapping. Geology 25, 231–234.
Hovius, N., Stark, C. P., Hao-Tsu, C., and Jiun-Chuan, L. (2000). Supply and Removal of Sediment in a Landslide-Dominated Mountain Belt: Central Range, Taiwan. J. Geol. 108, 73–89. doi: 10.1086/314387
Hsu, T.-W., Lin, T.-Y., and Tseng, I.-F. (2007). Human impact on coastal erosion in Taiwan. J. Coast. Res. 23, 961–973. doi: 10.2112/04-0353R.1
Hume, T. M., and Herdendorf, C. E. (1988). A geomorphic classification of estuaries and its application to coastal resource management—A New Zealand example. Ocean Shorel. Manag. 11, 249–274. doi: 10.1016/0951-8312(88)90022-7
Inman, D. L., and Jenkins, S. A. (1999). Climate Change and the Episodicity of Sediment Flux of Small California Rivers. J. Geol. 107, 251–270. doi: 10.1086/314346
Inman, D. L., and Nordstrom, C. E. (1971). On the tectonic and morphologic classification of coasts. J. Geol. 79, 1–21.
Kao, S. J., and Milliman, J. D. (2008). Water and Sediment Discharge from Small Mountainous Rivers, Taiwan: the Roles of Lithology, Episodic Events, and Human Activities. J. Geol. 116, 431–448. doi: 10.1086/590921
Khripounoff, A., Vangriesheim, A., Crassous, P., and Etoubleau, J. (2009). High frequency of sediment gravity flow events in the Var submarine canyon (Mediterranean Sea). Mar. Geol. 263, 1–6. doi: 10.1016/j.margeo.2009.03.014
Kirk, R. M. (1980). Mixed sand and gravel beaches: morphology, processes and sediments. Prog. Phys. Geogr. Earth Environ. 4, 189–210. doi: 10.1177/030913338000400203
Kirk, R. M. (1991). River-beach interaction on mixed sand and gravel coasts: a geomorphic model for water resource planning. Appl. Geogr. 11, 267–287. doi: 10.1016/0143-6228(91)90018-5
Kniskern, T. A., Warrick, J. A., Farnsworth, K. L., Wheatcroft, R. A., and Goñi, M. A. (2011). Coherence of river and ocean conditions along the US West Coast during storms. Cont. Shelf Res. 31, 789–805. doi: 10.1016/j.csr.2011.01.012
Kobayashi, N., and Lawrence, A. R. (2004). Cross-shore sediment transport under breaking solitary waves. J. Geophys. Res. Oceans 109:C03047. doi: 10.1029/2003JC002084
Komar, P. D. (1973). Computer Models of Delta Growth due to Sediment Input from Rivers and Longshore Transport. Geol. Soc. Am. Bull. 84, 2217–2226.
Komar, P. D. (2010). Shoreline Evolution and Management of Hawke’s Bay, New Zealand: tectonics, Coastal Processes, and Human Impacts. J. Coast. Res. 2010, 143–156. doi: 10.2112/08-1079.1
Kuenzi, W. D., Horst, O. H., and McGehee, R. V. (1979). Effect of volcanic activity on fluvial-deltaic sedimentation in a modern arc-trench gap, southwestern Guatemala. Geol. Soc. Am. Bull. 90, 827–838.
Lamb, M. P., McElroy, B., Kopriva, B., Shaw, J., and Mohrig, D. (2010). Linking river-flood dynamics to hyperpycnal-plume deposits: experiments, theory, and geological implications. Geol. Soc. Am. Bull. 122, 1389–1400. doi: 10.1130/B30125.1
Liang, M., Voller, V. R., and Paola, C. (2015). A reduced-complexity model for river delta formation Part 1: modeling deltas with channel dynamics. Earth Surf. Dyn. 3, 67–86. doi: 10.5194/esurf-3-67-2015
Lichter, M., Klein, M., and Zviely, D. (2011). Dynamic morphology of small south-eastern Mediterranean river mouths: a conceptual model. Earth Surf. Process. Landf. 36, 547–562. doi: 10.1002/esp.2077
Limber, P. W., Patsch, K. B., and Griggs, G. B. (2008). Coastal Sediment Budgets and the Littoral Cutoff Diameter: a Grain Size Threshold for Quantifying Active Sediment Inputs. J. Coast. Res. 2, 122–133. doi: 10.2112/06-0675.1
Liu, J. T., Wang, Y.-H., Yang, R. J., Hsu, R. T., Kao, S.-J., Lin, H.-L., et al. (2012). Cyclone-induced hyperpycnal turbidity currents in a submarine canyon. J. Geophys. Res. Oceans 117:C04033. doi: 10.1029/2011JC007630
MacMahan, J., Brown, J., Brown, J., Thornton, E., Reniers, A., Stanton, T., et al. (2010). Mean Lagrangian flow behavior on an open coast rip-channeled beach: a new perspective. Mar. Geol. 268, 1–15. doi: 10.1016/j.margeo.2009.09.011
MacMahan, J. H., Thornton, E. B., and Reniers, A. J. H. M. (2006). Rip current review. Coast. Eng. 53, 191–208. doi: 10.1016/j.coastaleng.2005.10.009
Mariño-Tapia, I. J., Russell, P. E., O’Hare, T. J., Davidson, M. A., and Huntley, D. A. (2007). Cross-shore sediment transport on natural beaches and its relation to sandbar migration patterns: 1. Field observations and derivation of a transport parameterization. J. Geophys. Res. Oceans 112:C03001. doi: 10.1029/2005JC002893
Masselink, G., Austin, M., Tinker, J., O’Hare, T., and Russell, P. (2008). Cross-shore sediment transport and morphological response on a macrotidal beach with intertidal bar morphology, Truc Vert, France. Mar. Geol. 251, 141–155. doi: 10.1016/j.margeo.2008.01.010
Meade, R. H. (1982). Sources, Sinks, and Storage of River Sediment in the Atlantic Drainage of the United States. J. Geol. 90, 235–252.
Measures, R. J., Hart, D. E., Cochrane, T. A., and Hicks, D. M. (2020). Processes controlling river-mouth lagoon dynamics on high-energy mixed sand and gravel coasts. Mar. Geol. 420:106082. doi: 10.1016/j.margeo.2019.106082
Miller, I. M., and Warrick, J. A. (2012). Measuring sediment transport and bed disturbance with tracers on a mixed beach. Mar. Geol. 299–302, 1–17. doi: 10.1016/j.margeo.2012.01.002
Miller, I. M., Warrick, J. A., and Morgan, C. (2011). Observations of coarse sediment movements on the mixed beach of the Elwha Delta, Washington. Mar. Geol. 282, 201–214. doi: 10.1016/j.margeo.2011.02.012
Milliman, J. D., and Farnsworth, K. L. (2013). River Discharge to the Coastal Ocean: A Global Synthesis. Cambridge: Cambridge University Press.
Milliman, J. D., and Syvitski, J. P. M. (1992). Geomorphic/Tectonic Control of Sediment Discharge to the Ocean: the Importance of Small Mountainous Rivers. J. Geol. 100, 525–544. doi: 10.1086/629606
Mulder, T., Syvitski, J. P. M., Migeon, S., Faugères, J.-C., and Savoye, B. (2003). Marine hyperpycnal flows: initiation, behavior and related deposits. A review. Mar. Pet. Geol. 20, 861–882. doi: 10.1016/j.marpetgeo.2003.01.003
Nardin, W., and Fagherazzi, S. (2012). The effect of wind waves on the development of river mouth bars. Geophys. Res. Lett. 39:L12607. doi: 10.1029/2012GL051788
Nardin, W., Mariotti, G., Edmonds, D. A., Guercio, R., and Fagherazzi, S. (2013). Growth of river mouth bars in sheltered bays in the presence of frontal waves. J. Geophys. Res. Earth Surf. 118, 872–886. doi: 10.1002/jgrf.20057
Nienhuis, J. H., Ashton, A. D., Edmonds, D. A., Hoitink, A. J. F., Kettner, A. J., Rowland, J. C., et al. (2020). Global-scale human impact on delta morphology has led to net land area gain. Nature 577, 514–518. doi: 10.1038/s41586-019-1905-9
Nienhuis, J. H., Ashton, A. D., and Giosan, L. (2015). What makes a delta wave-dominated? Geology 43, 511–514. doi: 10.1130/G36518.1
Nienhuis, J. H., Ashton, A. D., and Giosan, L. (2016a). Littoral steering of deltaic channels. Earth Planet. Sci. Lett. 453, 204–214. doi: 10.1016/j.epsl.2016.08.018
Nienhuis, J. H., Ashton, A. D., Nardin, W., Fagherazzi, S., and Giosan, L. (2016b). Alongshore sediment bypassing as a control on river mouth morphodynamics. J. Geophys. Res. Earth Surf. 121, 664–683. doi: 10.1002/2015JF003780
Ortiz, A. C., and Ashton, A. D. (2016). Exploring shoreface dynamics and a mechanistic explanation for a morphodynamic depth of closure. J. Geophys. Res. Earth Surf. 121, 442–464. doi: 10.1002/2015JF003699
Patsch, K., and Griggs, G. (2008). A sand budget for the Santa Barbara Littoral Cell, California. Mar. Geol. 252, 50–61. doi: 10.1016/j.margeo.2008.01.013
Pratellesi, M., Ciavola, P., Ivaldi, R., Anthony, E. J., and Armaroli, C. (2018). River-mouth geomorphological changes over (130 years (1882–2014) in a small Mediterranean delta: is the Magra delta reverting to an estuary? Mar. Geol. 403, 215–224. doi: 10.1016/j.margeo.2018.06.003
Ratliff, K. M., Hutton, E. H. W., and Murray, A. B. (2018). Exploring Wave and Sea-Level Rise Effects on Delta Morphodynamics With a Coupled River-Ocean Model. J. Geophys. Res. Earth Surf. 123, 2887–2900. doi: 10.1029/2018JF004757
Ritchie, A. C., Warrick, J. A., East, A. E., Magirl, C. S., Stevens, A. W., Bountry, J. A., et al. (2018). Morphodynamic evolution following sediment release from the world’s largest dam removal. Sci. Rep. 8:13279. doi: 10.1038/s41598-018-30817-8
Roelvink, J. A., and Stive, M. J. F. (1989). Bar-generating cross-shore flow mechanisms on a beach. J. Geophys. Res. Oceans 94, 4785–4800. doi: 10.1029/JC094iC04p04785
Shulmeister, J., and Kirk, R. M. (1997). Holocene fluvial-coastal interactions on a mixed sand and sand and gravel beach system. North Canterbury, New Zealand. CATENA 30, 337–355. doi: 10.1016/S0341-8162(97)00013-1
Steel, E., Simms, A. R., Warrick, J., and Yokoyama, Y. (2016). Highstand shelf fans: the role of buoyancy reversal in the deposition of a new type of shelf sand body. Geol. Soc. Am. Bull. 128, 1717–1724. doi: 10.1130/B31438.1
Stevens, A. W., Gelfenbaum, G., Warrick, J. A., Miller, I. M., and Weiner, H. M. (2017). Bathymetry, Topography, and Sediment Grain-Size Data from the Elwha River delta, Washington. Washington, DC: U.S. Geological Survey data release. doi: 10.5066/f72n51gc
Tabor, R. W. (1988). Geology of Olympic National Park, 3rd Printing Edn. Seattle: Northwest Interpretive Assn.
Vitousek, S., Barnard, P. L., and Limber, P. (2017). Can beaches survive climate change? J. Geophys. Res. Earth Surf. 122, 1060–1067.
Warrick, J. A. (2009). “Introduction to Southern California source-to-sink sedimentation,” in Earth Science in the Urban Ocean: The Southern California Continental Borderland, eds H. J. Lee and W. R. Normark (Boulder, CO: Geological Society of America), doi: 10.1130/2009.2454(2.1
Warrick, J. A., and Barnard, P. L. (2012). The offshore export of sand during exceptional discharge from California rivers. Geology 40, 787–790. doi: 10.1130/G33115.1
Warrick, J. A., Draut, A. E., McHenry, M. L., Miller, I. M., Magirl, C. S., Stevens, A. W., et al. (2011a). “Geomorphology of the Elwha River and its Delta,” in Coastal habitats of the Elwha River, Washington—Biological and physical patterns and processes prior to dam removal U.S. Geological Survey Scientific Investigations Report, eds J. J. Duda, J. A. Warrick, and C. S. Magirl (Reston, VI: U.S. Geological Survey), 47–74.
Warrick, J. A., Stevens, A. W., Miller, I. M., and Gelfenbaum, G. (2011b). “Coastal Processes of the Elwha River Delta,” in Coastal habitats of the Elwha River, Washington—Biological and physical patterns and processes prior to dam removal U.S. Geological Survey Scientific Investigations Report, eds J. J. Duda, J. A. Warrick, and C. S. Magirl (Reston, VI: U.S. Geological Survey), 111–130.
Warrick, J. A., and Farnsworth, K. L. (2009). “Dispersal of river sediment in the Southern California Bight,” in Earth Science in the Urban Ocean: The Southern California Continental Borderland, eds H. J. Lee, and W. R. Normark (Boulder, CO: Geological Society of America), doi: 10.1130/2009.2454(2.3
Warrick, J. A., and Mertes, L. A. K. (2009). Sediment yield from the tectonically active semiarid Western Transverse Ranges of California. GSA Bull. 121, 1054–1070. doi: 10.1130/B26452.1
Warrick, J. A., and Milliman, J. D. (2003). Hyperpycnal sediment discharge from semiarid southern California rivers: implications for coastal sediment budgets. Geology 31:781. doi: 10.1130/G19671.1
Warrick, J. A., Simms, A. R., Ritchie, A., Steel, E., Dartnell, P., Conrad, J. E., et al. (2013). Hyperpycnal plume-derived fans in the Santa Barbara Channel, California. Geophys. Res. Lett. 40, 2081–2086. doi: 10.1002/grl.50488
Warrick, J. A., Stevens, A. W., Miller, I. M., Harrison, S. R., Ritchie, A. C., and Gelfenbaum, G. (2019). World’s largest dam removal reverses coastal erosion. Sci. Rep. 9, 1–12. doi: 10.1038/s41598-019-50387-7
Warrick, J. A., Xu, J., Noble, M. A., and Lee, H. J. (2008). Rapid formation of hyperpycnal sediment gravity currents offshore of a semi-arid California river. Cont. Shelf Res. 28, 991–1009. doi: 10.1016/j.csr.2007.11.002
Wei, Z., Dalrymple, R. A., Xu, M., Garnier, R., and Derakhti, M. (2017). Short-crested waves in the surf zone. J. Geophys. Res. Oceans 122, 4143–4162. doi: 10.1002/2016JC012485
Willis, C. M., and Griggs, G. B. (2003). Reductions in Fluvial Sediment Discharge by Coastal Dams in California and Implications for Beach Sustainability. J. Geol. 111, 167–182. doi: 10.1086/345922
Wright, L. D., Friedrichs, C. T., and Scully, M. E. (2002). Pulsational gravity-driven sediment transport on two energetic shelves. Cont. Shelf Res. 22, 2443–2460. doi: 10.1016/S0278-4343(02)00133-4
Wright, L. D., and Short, A. D. (1984). Morphodynamic variability of surf zones and beaches: a synthesis. Mar. Geol. 56, 93–118. doi: 10.1016/0025-3227(84)90008-2
Zăinescu, F., Vespremeanu-Stroe, A., Anthony, E., Tătui, F., Preoteasa, L., and Mateescu, R. (2019). Flood deposition and storm removal of sediments in front of a deltaic wave-influenced river mouth. Mar. Geol. 417:106015. doi: 10.1016/j.margeo.2019.106015
Keywords: river sediment discharge, river sediment output, sediment input to coast, sand, sand and gravel, coarse sediment, littoral, coastal sediment budget
Citation: Warrick JA (2020) Littoral Sediment From Rivers: Patterns, Rates and Processes of River Mouth Morphodynamics. Front. Earth Sci. 8:355. doi: 10.3389/feart.2020.00355
Received: 30 April 2020; Accepted: 31 July 2020;
Published: 09 September 2020.
Edited by:
Michaël Hermoso, UMR 8187 Laboratoire d’Océanologie et de Géosciences (LOG), FranceReviewed by:
Pauline Delorme, University of Southampton, United KingdomJaap Nienhuis, Utrecht University, Netherlands
Sandric Lesourd, Université de Caen Normandie, France
Copyright © 2020 Warrick. This is an open-access article distributed under the terms of the Creative Commons Attribution License (CC BY). The use, distribution or reproduction in other forums is permitted, provided the original author(s) and the copyright owner(s) are credited and that the original publication in this journal is cited, in accordance with accepted academic practice. No use, distribution or reproduction is permitted which does not comply with these terms.
*Correspondence: Jonathan A. Warrick, jwarrick@usgs.gov