Effect of Beauveria bassiana Fungal Infection on Survival and Feeding Behavior of Pine-Tree Lappet Moth (Dendrolimus pini L.)


1
Croatian Forest Research Institute, Cvjetno naselje 41, HR-10450 Jastrebarsko, Croatia
2
Arbofield Ltd., Mihanovićeva 3, HR-10450 Jastrebarsko, Croatia
*
Author to whom correspondence should be addressed.
Forests 2020, 11(9), 974; https://doi.org/10.3390/f11090974
Submission received: 30 July 2020
/
Revised: 3 September 2020
/
Accepted: 4 September 2020
/
Published: 9 September 2020
(This article belongs to the Section Forest Ecology and Management)
Abstract
:Research highlights: The pine-tree lappet moth, Dendrolimus pini, can cause serious needle defoliation on pines with outbreaks occurring over large geographical areas. Under laboratory conditions, the promising potential of the naturally occurring entomopathogenic fungus Beauveria bassiana was tested against D. pini larvae as a biological control method. Background and objectives: The aim of this study was to investigate the most effective concentration and treatment dose of B. bassiana conidial suspension and how it affected the survival and feeding behavior of the pest. Materials and methods: The first experiment applied the fungal suspension directly on the back of selected larvae, and in the second experiment, sporulating cadavers obtained in the first experiment were placed into Petri dishes with healthy individuals. Different doses per larvae [µL] and spore suspension concentration [spores/µL]) were used. The second experiment was designed to investigate the horizontal transmission of fungi by exposing individual caterpillars to a cadaver covered in B. bassiana mycelia. Mortality rates were analyzed by Chi-squared tests using absolute values for total mortality and B. bassiana- attributed mortality. The lethal time and feeding-disruption speed were analyzed with parametric and non-parametric tests with the aim to determine whether statistically significant differences were observed between treatments. Results: Analysis of lethal time revealed that the 20 µL dose and 7.9 × 10⁴ concentration yielded highest mortality, but also the average dieback rate of 9.4 days was significantly faster compared to all other treatments. In order to see whether insects stopped feeding after infection with B. bassiana, larvae weight loss was examined. Results showed that effective treatments induced change in the feeding behavior of infected larvae. The feeding disruption caused by the 20 µL treatment occurred on average 5.5 days after exposure or 3.9 days before the final dieback of larvae.
1. Introduction
Pine-tree lappet moth, Dendrolimus pini L. (Lepidoptera, Lasiocampidae) is considered one of the most important harmful insect species in pine forests in Europe. This insect covers an area from Western Europe to Middle Asia (China and Asian Russia) and was recorded in North Africa, with the highest activity recorded in Central Europe [1]. Currently this forest pest is spreading to the north and south of the continent due to climate change [2]. Considering the fact that the main activity of D. pini was previously more or less concentrated in Poland and Germany [1], outbreaks in Sweden, Scotland, or Croatia are new reports [3,4,5] that could be examples of the increasing pest activity throughout Europe. Flight period of D. pini moths typically lasts from July until middle August, but is variable and temperature dependent [6]. After mating, each female moth lays their eggs (150–300 eggs) on pine needles, twigs, or bark in the canopy [7]. Larvae usually begin hatching during August/early September and during the first 10 days, they begin to feed on pine needles and this autumn feeding lasts until the first frost occurs (November). Then, the larvae move down the tree trunks to overwintering sites that are between the mineral soil and litter layer. In spring, after overwintering, they climb into tree crowns where they feed on needles as well as the bark and buds of young shoots [6,7]. In warmer climates, a part of the population stays in the canopy during the winter (M Pernek, personal observations). They are predominantly monovoltine species [8].
In spite of the fact that D. pini could destroy pine forests [8] and thus there is a need for forest protection measures, there are official restrictions for the aerial application of pesticides that cause severe problems for forest owners [9]. Therefore, there is a need to improve or create new strategies for D. pini suppression like the use of pheromone traps in order to improve the monitoring system [10]. Biological control measures could also build an important opportunity. Natural enemies like parasitoids have already been the subject of numerous studies [4,7,11] and studies on the naturally occurring entomopathogenic nematodes have been observed [12]. There have been few attempts in using entomopathogenic fungi against D. pini like Cordyceps militaris (L.) Link. (Ascomycota: Hypocreales) [13]. Naturally occurring Beauveria bassiana (Balsamo) Vuillemin (Ascomycota: Hypocreales) has recently caused mass mortality of D. pini in Aleppo pine (Pinus halepensis Mill.) forests in Croatia and therefore show high potential [5].
Numerous laboratory and field experiments with entomopathogenic fungus B. bassiana have been conducted to date, yielding many efficient isolates and formulations [14,15,16]. It is used as a biocontrol agent for agricultural pests worldwide, and its pathogenicity has also been shown for different forest insect pests [17,18,19,20]. However, different problems concerning optimum application and success in the field arise when this agent is used for practical purposes [21].
Infection strategy of B. bassiana includes penetration through the insect cuticle by spore germination. When conidia attach to the insect’s body, secretion of enzymes like proteases, chitinases, and lipases cause the degradation of cuticular components, allowing germination and growth of the fungus across the host surface. When the fungus gets inside the insect body it grows, spreading its structures through the hemocoel, exploiting the hemolymph nutrients and producing toxins, eventually killing the host. The fungus colonizes the cadaver and hyphae emerge and sporulate on the surface of the insect body, causing mummification [22,23].
Perpetual stress that affects the trees by changed weather and soil conditions, drought, poor air quality, or improper forest management can lead to an insect outbreak [24], and for the case in Croatia, extremely warm weather and domination of monotypic Aleppo pine, P. halepensis, stands were probably the triggers for the massive appearance of D. pini between 2014–2017 [5].
B. bassiana played a major role in D. pini population breakdown, causing a high mortality (above 98%) and stopping the outbreak of this pest in Aleppo pine forest in Skradin, Croatia. In 2017, this unusual phenomenon was repeated in Nature Park Telašćica at Dugi Otok, Croatia, an island in the Adriatic Sea with 70 km² of protected area where D. pini infestation caused total defoliation of a large area of Aleppo pine forest. Again, B. bassiana appeared on dead D. pini larvae on the soil surface [5].
The aim of this study was to test one isolate obtained from naturally occurring entomopathogenic fungus B. bassiana against D. pini larvae under laboratory conditions to find the most effective concentration and dose of B. bassiana conidial suspension. We also wanted to investigate the correlation between B. bassiana infestation and larvae weight loss (i.e., examine whether and when insects stop feeding after infection). Moreover, we tested whether mortality could be raised by contact of healthy individuals with sporulating cadavers, in order to see to what extent the infection could be horizontally transmitted. The results presented here will be beneficial for future investigations of the effectiveness of this isolate in field conditions.
2. Materials and Methods
2.1. Collection of Insects
Larvae of D. pini were collected in August and September 2017 in the area of Nature Park Telašćica, Dugi Otok (43°53′20,9724″ N, 15°10′9714″ E) in Croatia. The first collection in August consisted of collecting 300 larvae for the first experiment and another 100 larvae were collected in September for the second experiment. Larvae from the third and fourth larval stages were selected from needles, branches, trunks, and soil, and were transferred in plastic cylinders with a cloth over the opening to the Laboratory for Entomological Analysis at the Croatian Forest Research Institute, where they were incubated overnight under laboratory conditions (L:D = 16:8, T = 23 ± 1 °C, relative humidity = 60 ± 5%).
2.2. Fungal Isolation
For preparation of spore suspension, one B. bassiana isolate was obtained from D. pini cadavers, previously collected in 2014 near Skradin, in the vicinity of Šibenik. Fungal cultures were prepared by planting pieces of mycelium on PDA (potato dextrose agar) plates and incubated for a minimum of 14 days at 25 ± 1 °C. Fully sporulated cultures were used for the preparation of suspensions.
2.3. Preparation of Spore Suspensions
Spores were harvested by adding 10 mL of Tween 80 and sterile distilled H2O solution (0.1%) to each Petri dish with fungal culture, and the conidia from the surface of the agar plates were gently scraped with a sterile triangular cell spreader (15 cm). After that, 1 mL of obtained spore suspension was diluted with sterile distilled H2O and Tween solution (0.1%) in 1:10 dilution, and was vortexed for 1 min for homogenization (V-1 Plus Vortex-Mixer). Afterward, spore suspension was filtered through four layers of sterile cheesecloth into 50 mL sterile plastic tubes (Falcon), in order to remove possible residuals of mycelium and agar pieces. Spore concentration was determined with Neubauer hemocytometer at 20× magnification under the phase-contrast microscope (Olympus, model BX53, Olympus, Tokyo, Japan). For the D group in the first experiment, one part of the suspension was separated and adjusted to the desired concentration (1:100 dilution), while the spore suspension for the other experimental groups was not diluted, only differing doses between groups.
2.4. Confirmation of Conidial Viability
Conidial viability was assessed by determining the percentage of the germinated conidia in 24 h after spreading 100 μL of conidial suspension on malt extract agar (MEA) medium. To estimate the percentage of germination, 100 conidia in three randomly chosen plate areas were examined (total of 300 conidia per plate). Conidia were considered germinated when the germ tube was longer than the conidial diameter. The dishes were incubated at 25 ± 1 °C under natural day–night regime and there were five replicates (Petri dishes).
2.5. Setting up the Experiments
From the larvae collected in the field, the healthy and vital ones were chosen, divided into groups, and separately placed into plastic Petri dishes. Two experiments were conducted. The first experiment consisted of pipetting the suspension directly on the back of the selected larvae (Table 1). The first experiment was designed to investigate differences in mortality rates, lethal time, and quickness in feeding disruption between different concentrations and doses of spore suspension. This experiment was composed of four treatments: E1T1 (each caterpillar received 1 µL of 7.9 × 10⁴ spores/µL suspension), E1T5 (each caterpillar received 5 µL of 7.9 × 10⁴ spores/µL suspension), E1T20 (each caterpillar received 20 µL of 7.9 × 10⁴ spores/µL suspension), E1T01 (each caterpillar received 1 µL of 7.9 × 10² spores/µL suspension), and E1C as a control group (each caterpillar received 20 µL of 0.1% Tween suspension). The duration of the experiment was 15 days (40 individuals per group, L:D = 16:8 h, T = 23 ± 1 °C, relative humidity = 60 ± 5%).
In the second experiment, sporulating cadavers obtained in the first experiment were individually placed into a separate Petri dish with the healthy individuals (Table 2). The second experiment was designed to investigate horizontal transmission of fungi by exposing individual caterpillars to a cadaver covered in B. bassiana mycelia (E2CAD). In each Petri dish (50 × 9 mm), there was one larva exposed to one cadaver for 30 min. A control group was also set in order to rule out the effect of naturally present infection (E2C). The duration of the experiment was 15 days (50 individuals per group, temperature = 23 °C, photoperiod L:D = 16:8 h).
After treatment, larvae were checked every day for mortality and appearance of fungi mycelium on cadavers. Each larva was fed daily with fresh Aleppo pine needles and all excrement was removed from the container. In the first experiment, each larva was also weighed every day (analytical scale Acculab ATILON ATL-224-I, 220 × 0.0001 g).
During both experiments, each dead larva was placed into the moisture chamber to stimulate fungal sporulation outside of the cadaver. For confirmation of the cause of death, re-isolation of fungi on the new PDA medium was carried out from the individuals on which the white mycelium appeared, and every new culture obtained was microscopically examined. Dead individuals with either no or poorly developed mycelium were dissected to examine the interior of the body for the presence of fungi.
Experiments were designed to last for 15 days, which is considered as the threshold for acute mortality [25]. Mortality rates were determined by counting the individuals that died within the 15 days of the experiment and are represented in absolute and relative value. The mortality of individuals with symptoms of infection by B. bassiana were attributed to the entomopathogenic fungus.
2.6. Statistical Analyses
Mortality rates were represented in absolute and relative value for both total and B. bassiana attributed mortality. Abbot’s formula was used in order to evaluate the treatment results with correction for mortality observed in the control group [26]. Lethal time was determined by recording consecutive day of dieback for each individual caterpillar after the start of the experiment. Likewise, feeding disruption speed was determined by recording consecutive day after the start of the experiment at which individual caterpillars stopped feeding. For purpose of feeding disruption analysis, the chrysalis forming day and day 15 were used respectively for individuals that did not die during the experiment, all with the aim to keep the whole set of observations and maintain robustness of analyses by including both infection induced and naturally induced disruption in feeding.
Mortality rates were analyzed by Chi-squared tests using absolute values for both the total and B. bassiana attributed mortality in order to determine if a significant difference existed between observed mortalities and lethal dose (LD100: dose required to kill 100% of D. pini larvae). Lethal time and feeding disruption speed were analyzed by parametric (ANOVA) and non-parametric (Kruskal–Wallis) tests with the aim to determine whether statistically significant differences were observed between treatments. Tukey and Steel–Dwass–Critchlow–Fligner multiple pairwise comparison where performed based on parametric and non-parametric tests, respectively, in order to distinguish the differences between treatments.
All analyses were performed using MS Office Excel (Microsoft) and XLSTAT (Addinsoft) statistical tools add-on.
3. Results
3.1. Experiment 1
3.1.1. Mortality Rates
According to overall mortality, E1T20 treatment yielded 100% total mortality and 88% B. bassiana attributed mortality, while the lowest concentration and doses yielded lower mortalities (Table 3). There was 13% mortality observed in the control group, although none of the dead caterpillars in this group showed symptoms of B. bassiana infection. The Chi-square test showed that E1T20 treatment was the only one not significantly different from LD100 for both the total and B. bassiana attributed mortality. Treatment E1T5 was not significantly different in terms of total mortality, however, significant difference from LD100 could not be rejected for mortality attributed to B. bassiana infection. Two other treatments and control were significantly different from LD100 looking at both the total and B. bassiana attributed mortality (Table 3).
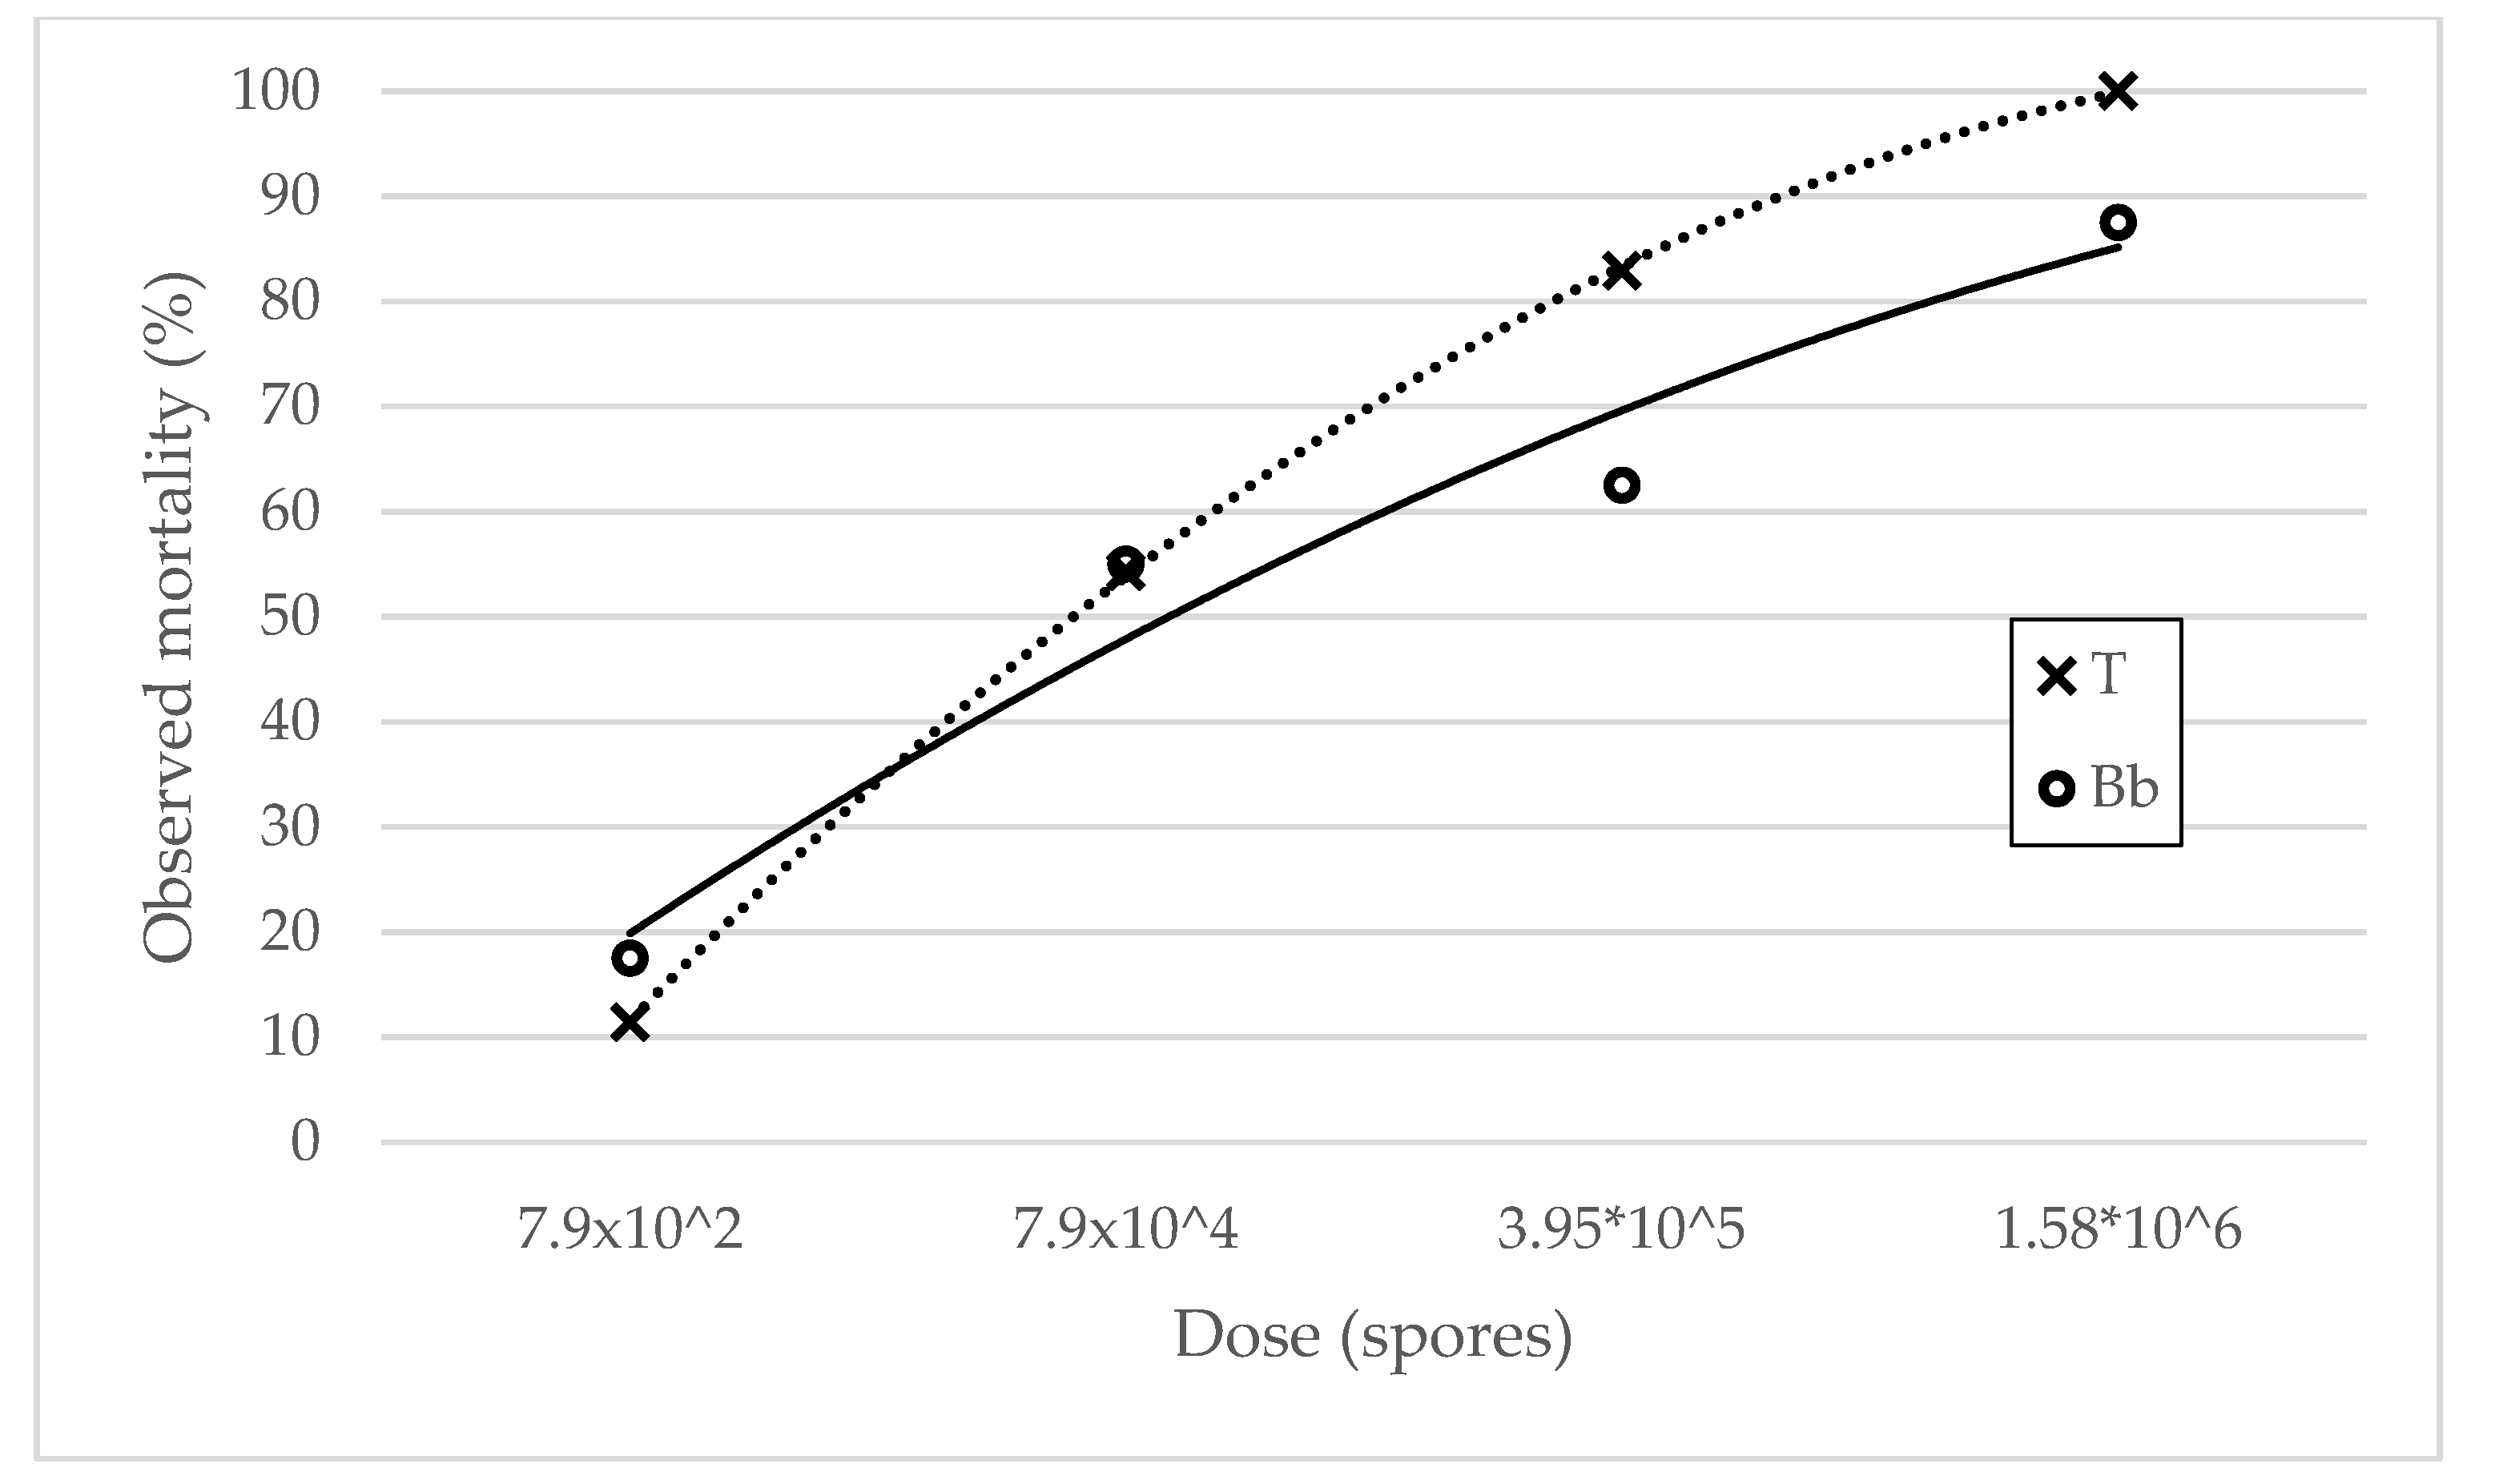
Dose response curves depict a segment of the hyperbolic curve in I quadrant with a steady positive slope, showing positive correlation between mortality and dose increase (Figure 1). Total mortality reached the maximum at the highest dose used in the experiment while the B. bassiana curve did not reach the maximum as it did not account for whole observed mortality. Neither curve reached a plateau. High coefficients of determination indicate high consistency in mortality increase as a result of dose increase.
3.1.2. Lethal Time
The lethal time results showed lowest values for 20 μL treatment, followed by 5 and 1 µL. Highest value was observed for the control group and 1:100 diluted spore solution treatment. Differences between treatment groups were significant, as determined by ANOVA (Table 4). However, the Shapiro–Wilk’s test showed that residuals did not follow normal distribution (W = 0.961; p-value (Two-tailed) = 0.009), indicating that condition of validity was not met and therefore a non-parametric test was also performed on the same set of data.
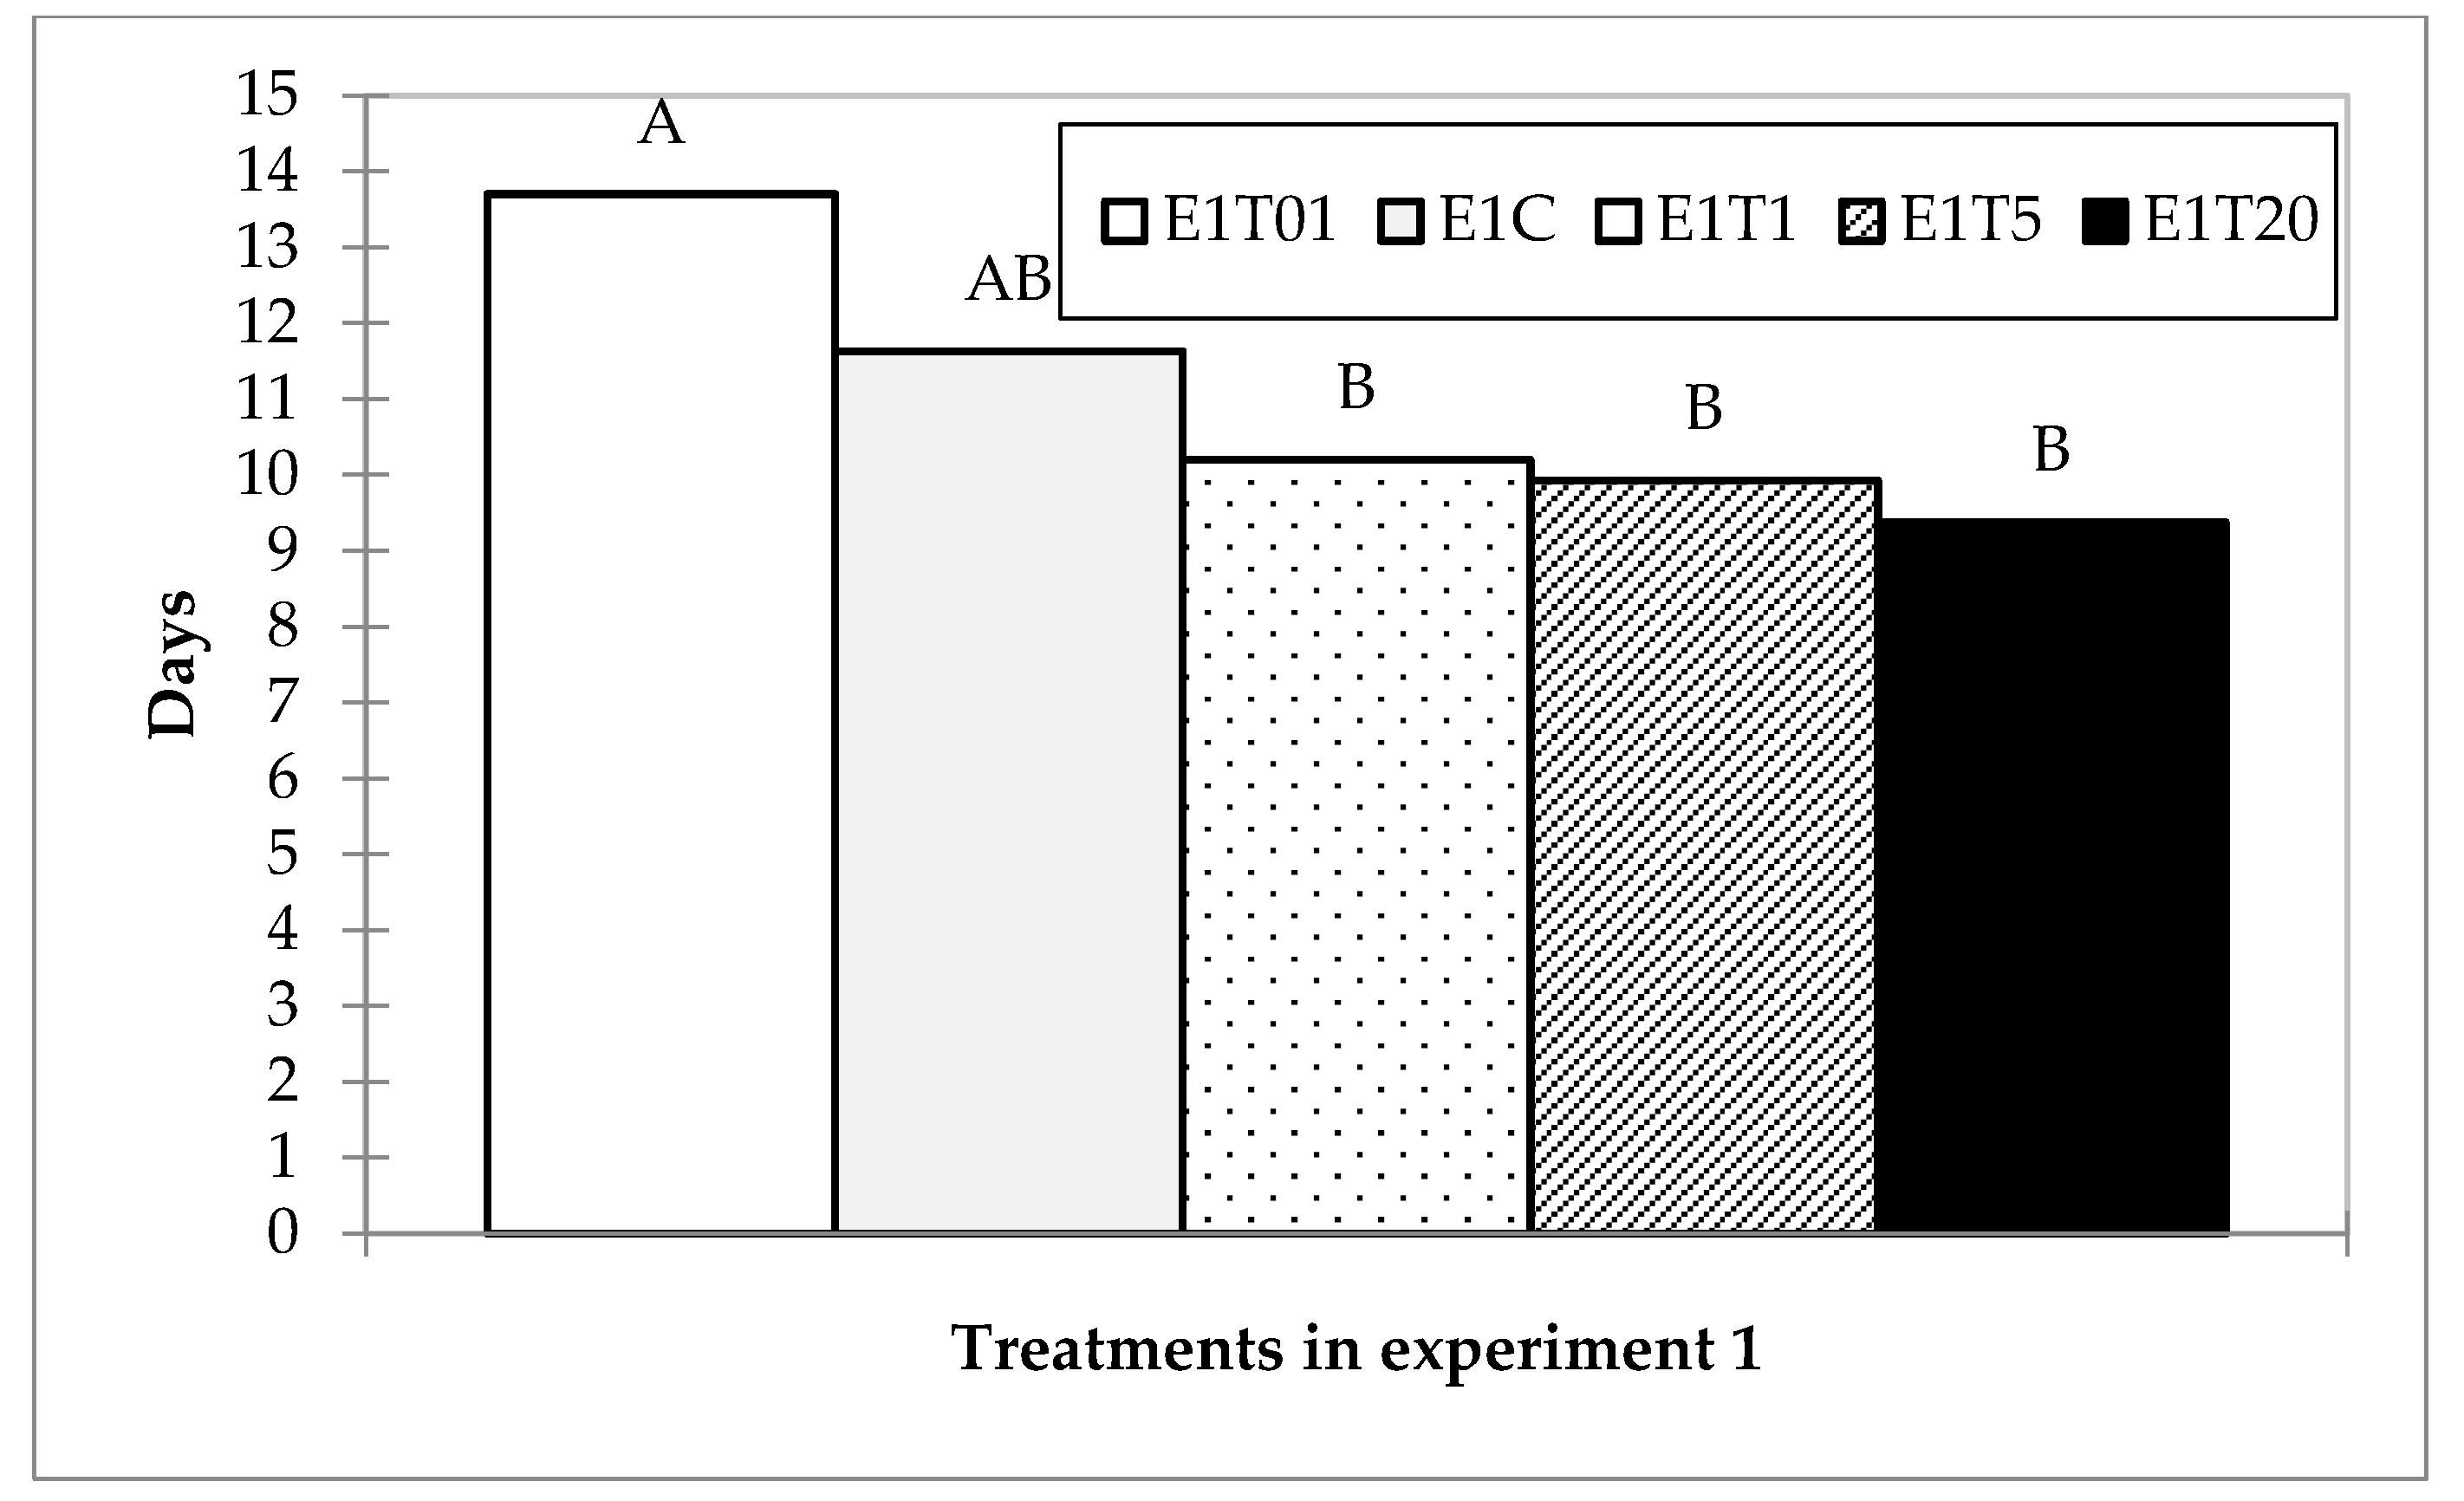
A Tukey multiple pairwise comparison of the differences between the categories with a confidence interval of 95% grouped treatments in two groups: Group A—treatment with 1:100 diluted spore solution and Group B—1 µL, 5 µL, and 20 µL dose treatment, while the control group could not be discriminated between groups (Figure 2).
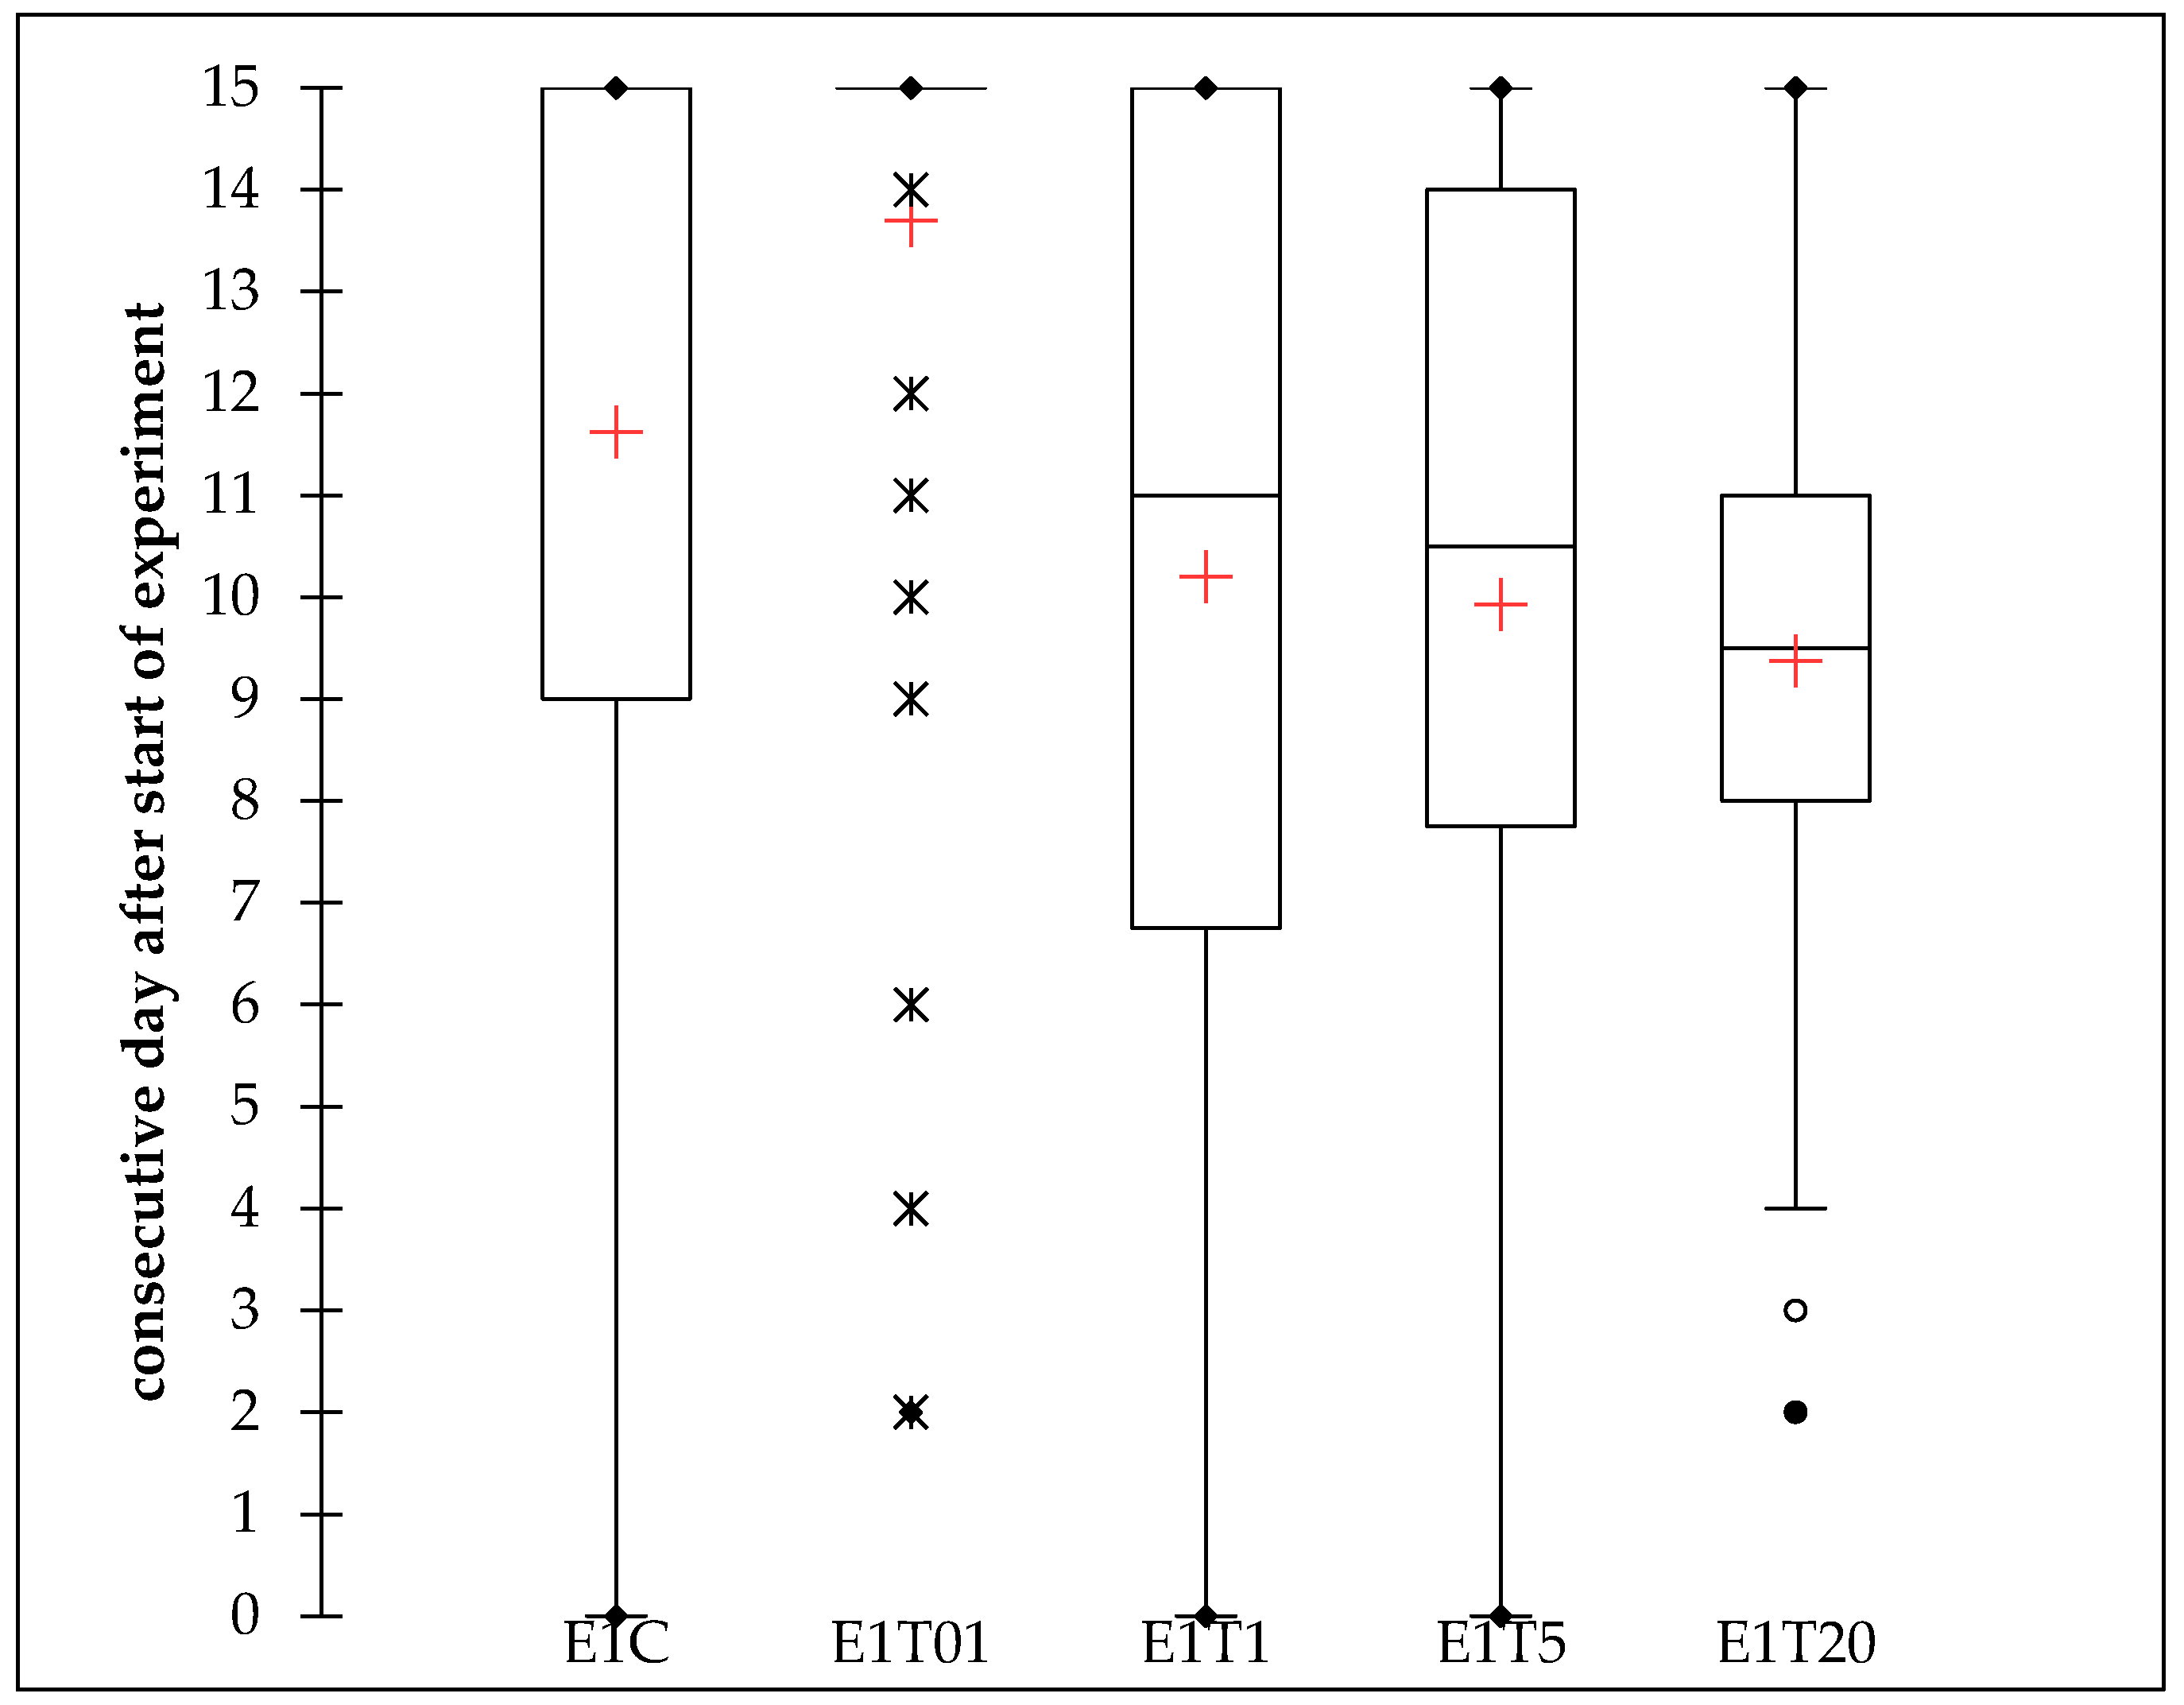
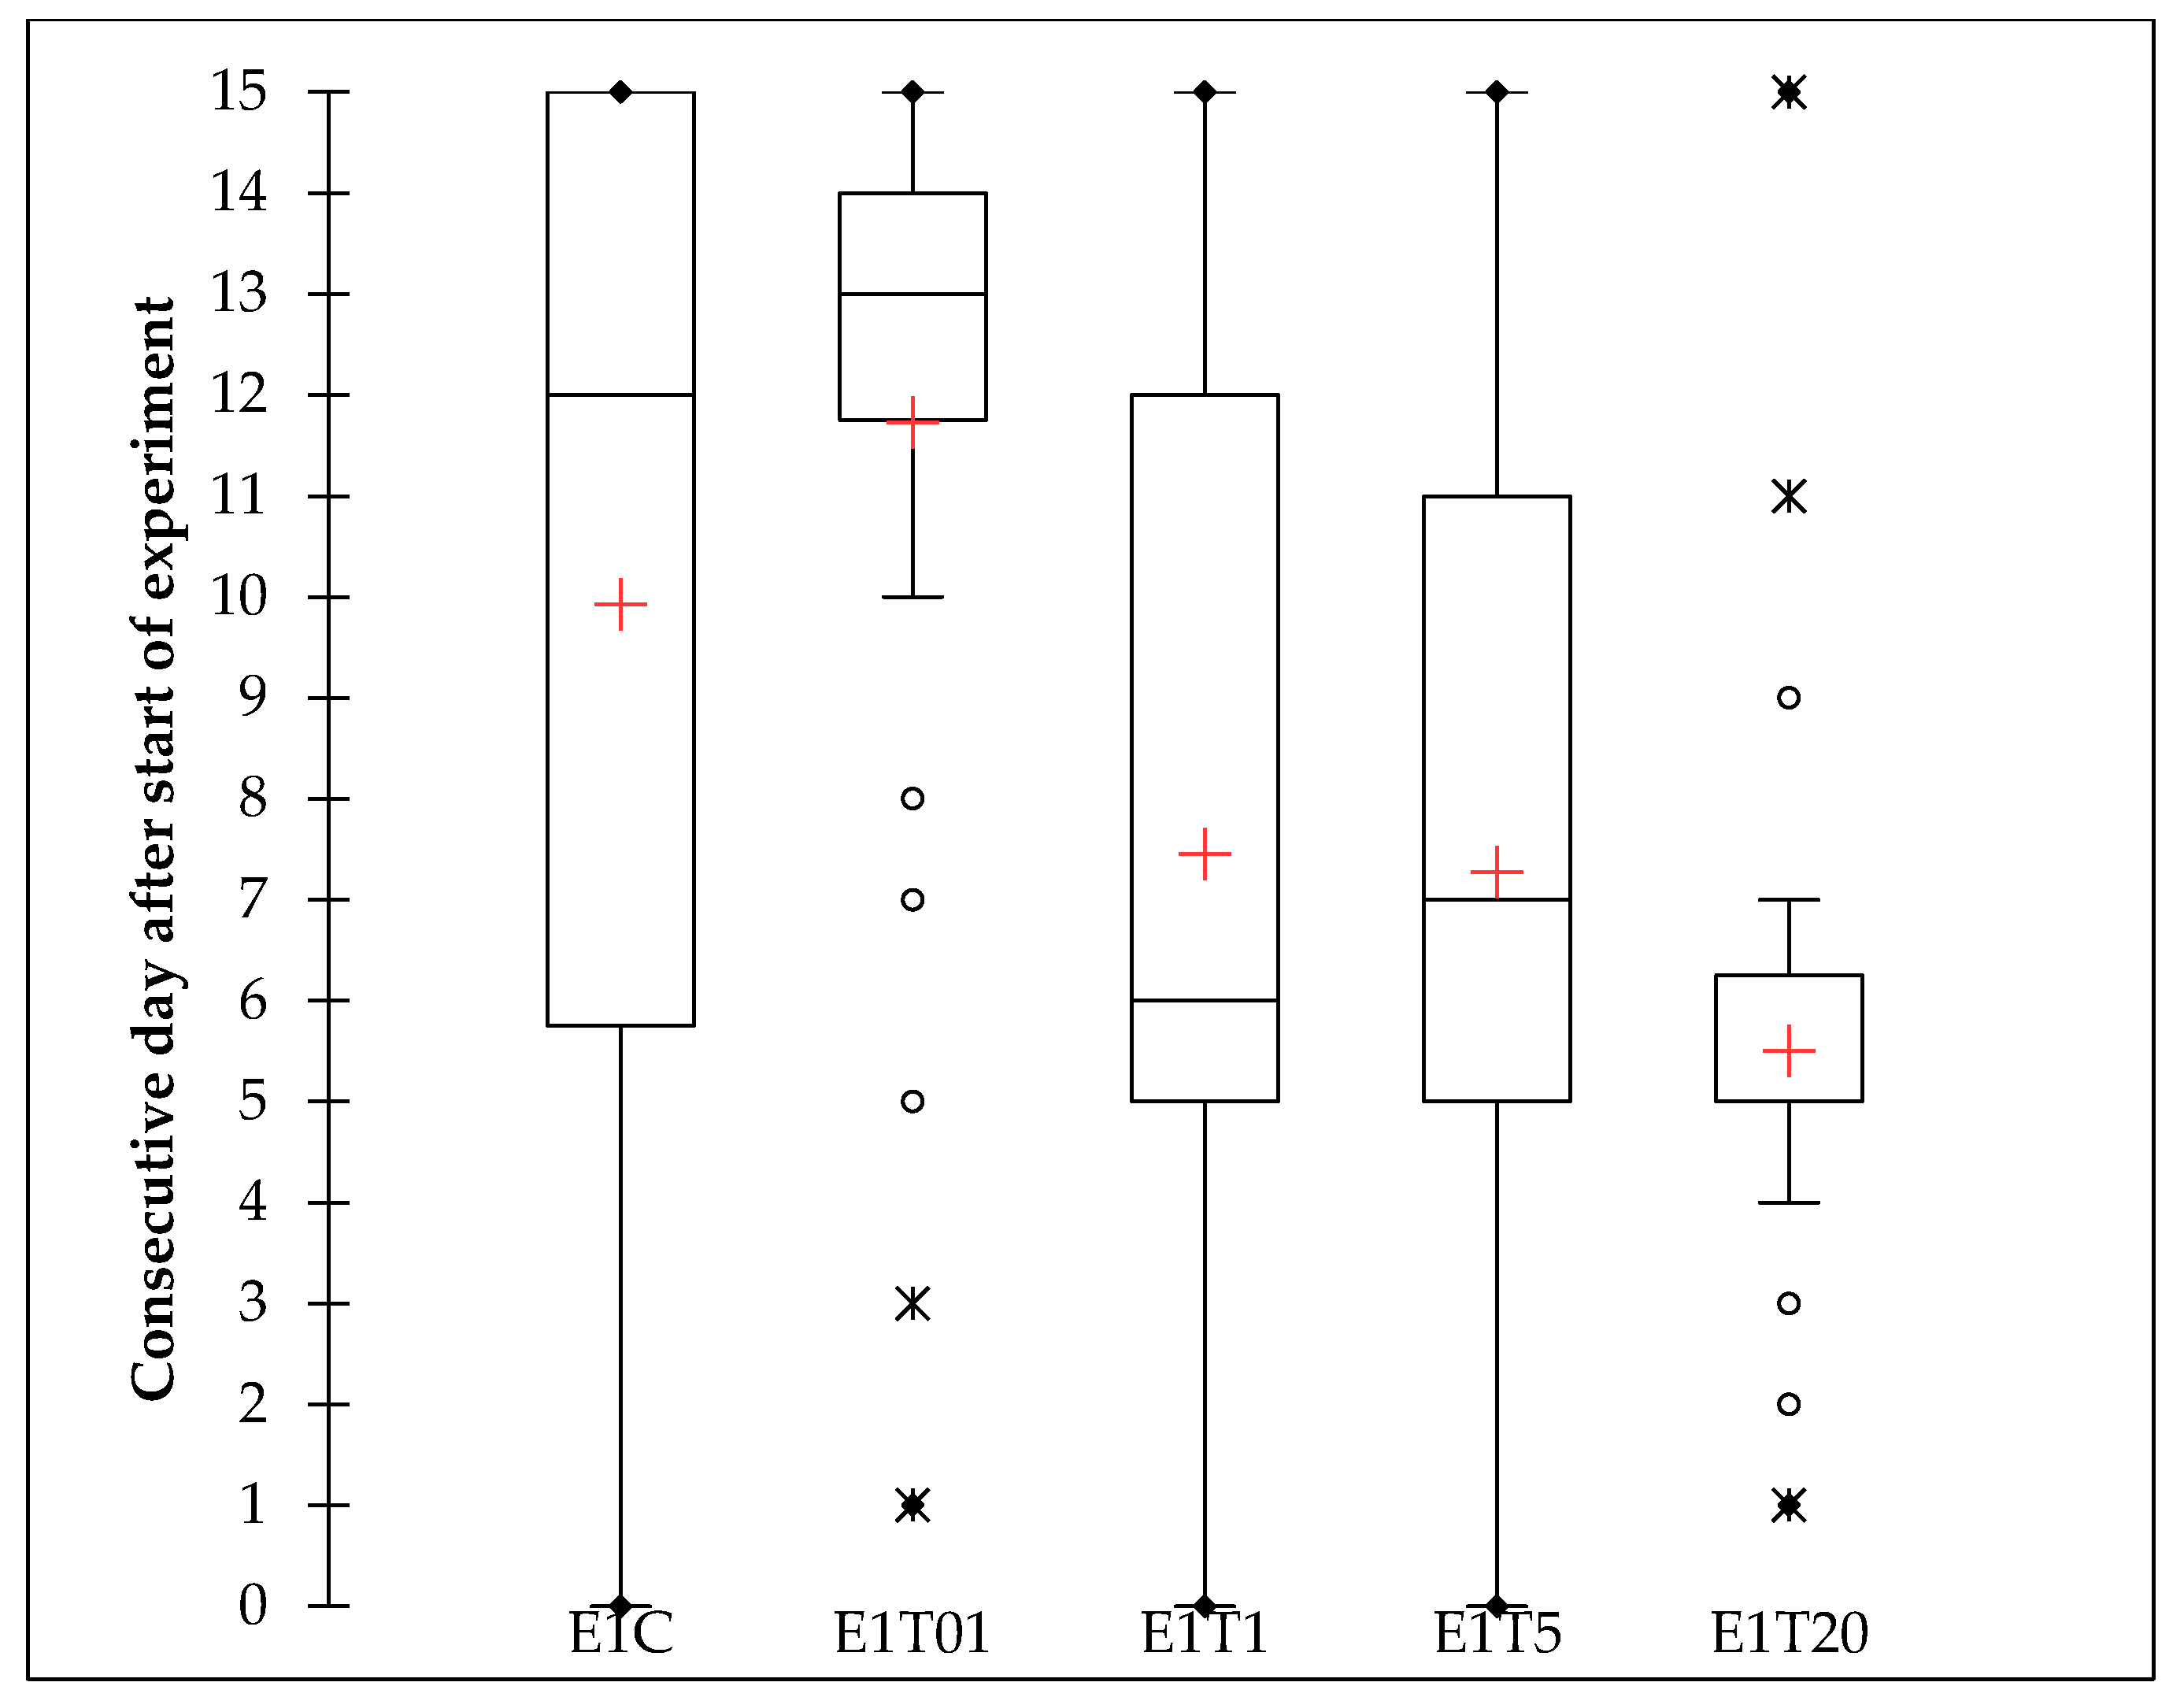
The non-parametric test also showed significant difference in lethal time between treatments in experiment 1, and multiple pairwise comparison using Steel–Dwass–Critchlow–Fligner procedure resulted in three groups. According to this analysis, the 20 µL treatment was clearly designated to Group A, the 5 µL and 1 µL treatments could not be discriminated between Groups A and B, the control could not be discriminated between Groups B and C, while the treatment with 1:100 diluted solution was designated to Group C. The differences between treatments are clearly visible in the Box-Whiskers histograms (Figure 3).
3.1.3. Feeding Disruption Speed
The feeding disruption speed results also showed lowest values for the 20 μL treatment, followed by 5 and 1 µL. The highest value was observed for the control group and 1:100 diluted spore solution treatment. Differences between treatment groups were significant, as determined by ANOVA. However, the Shapiro–Wilk’s test showed that residuals did not follow a normal distribution (W = 0.977; p-value (Two-tailed) = 0.002), indicating that the condition of validity was not met and therefore a non-parametric test was also performed on the same set of data.
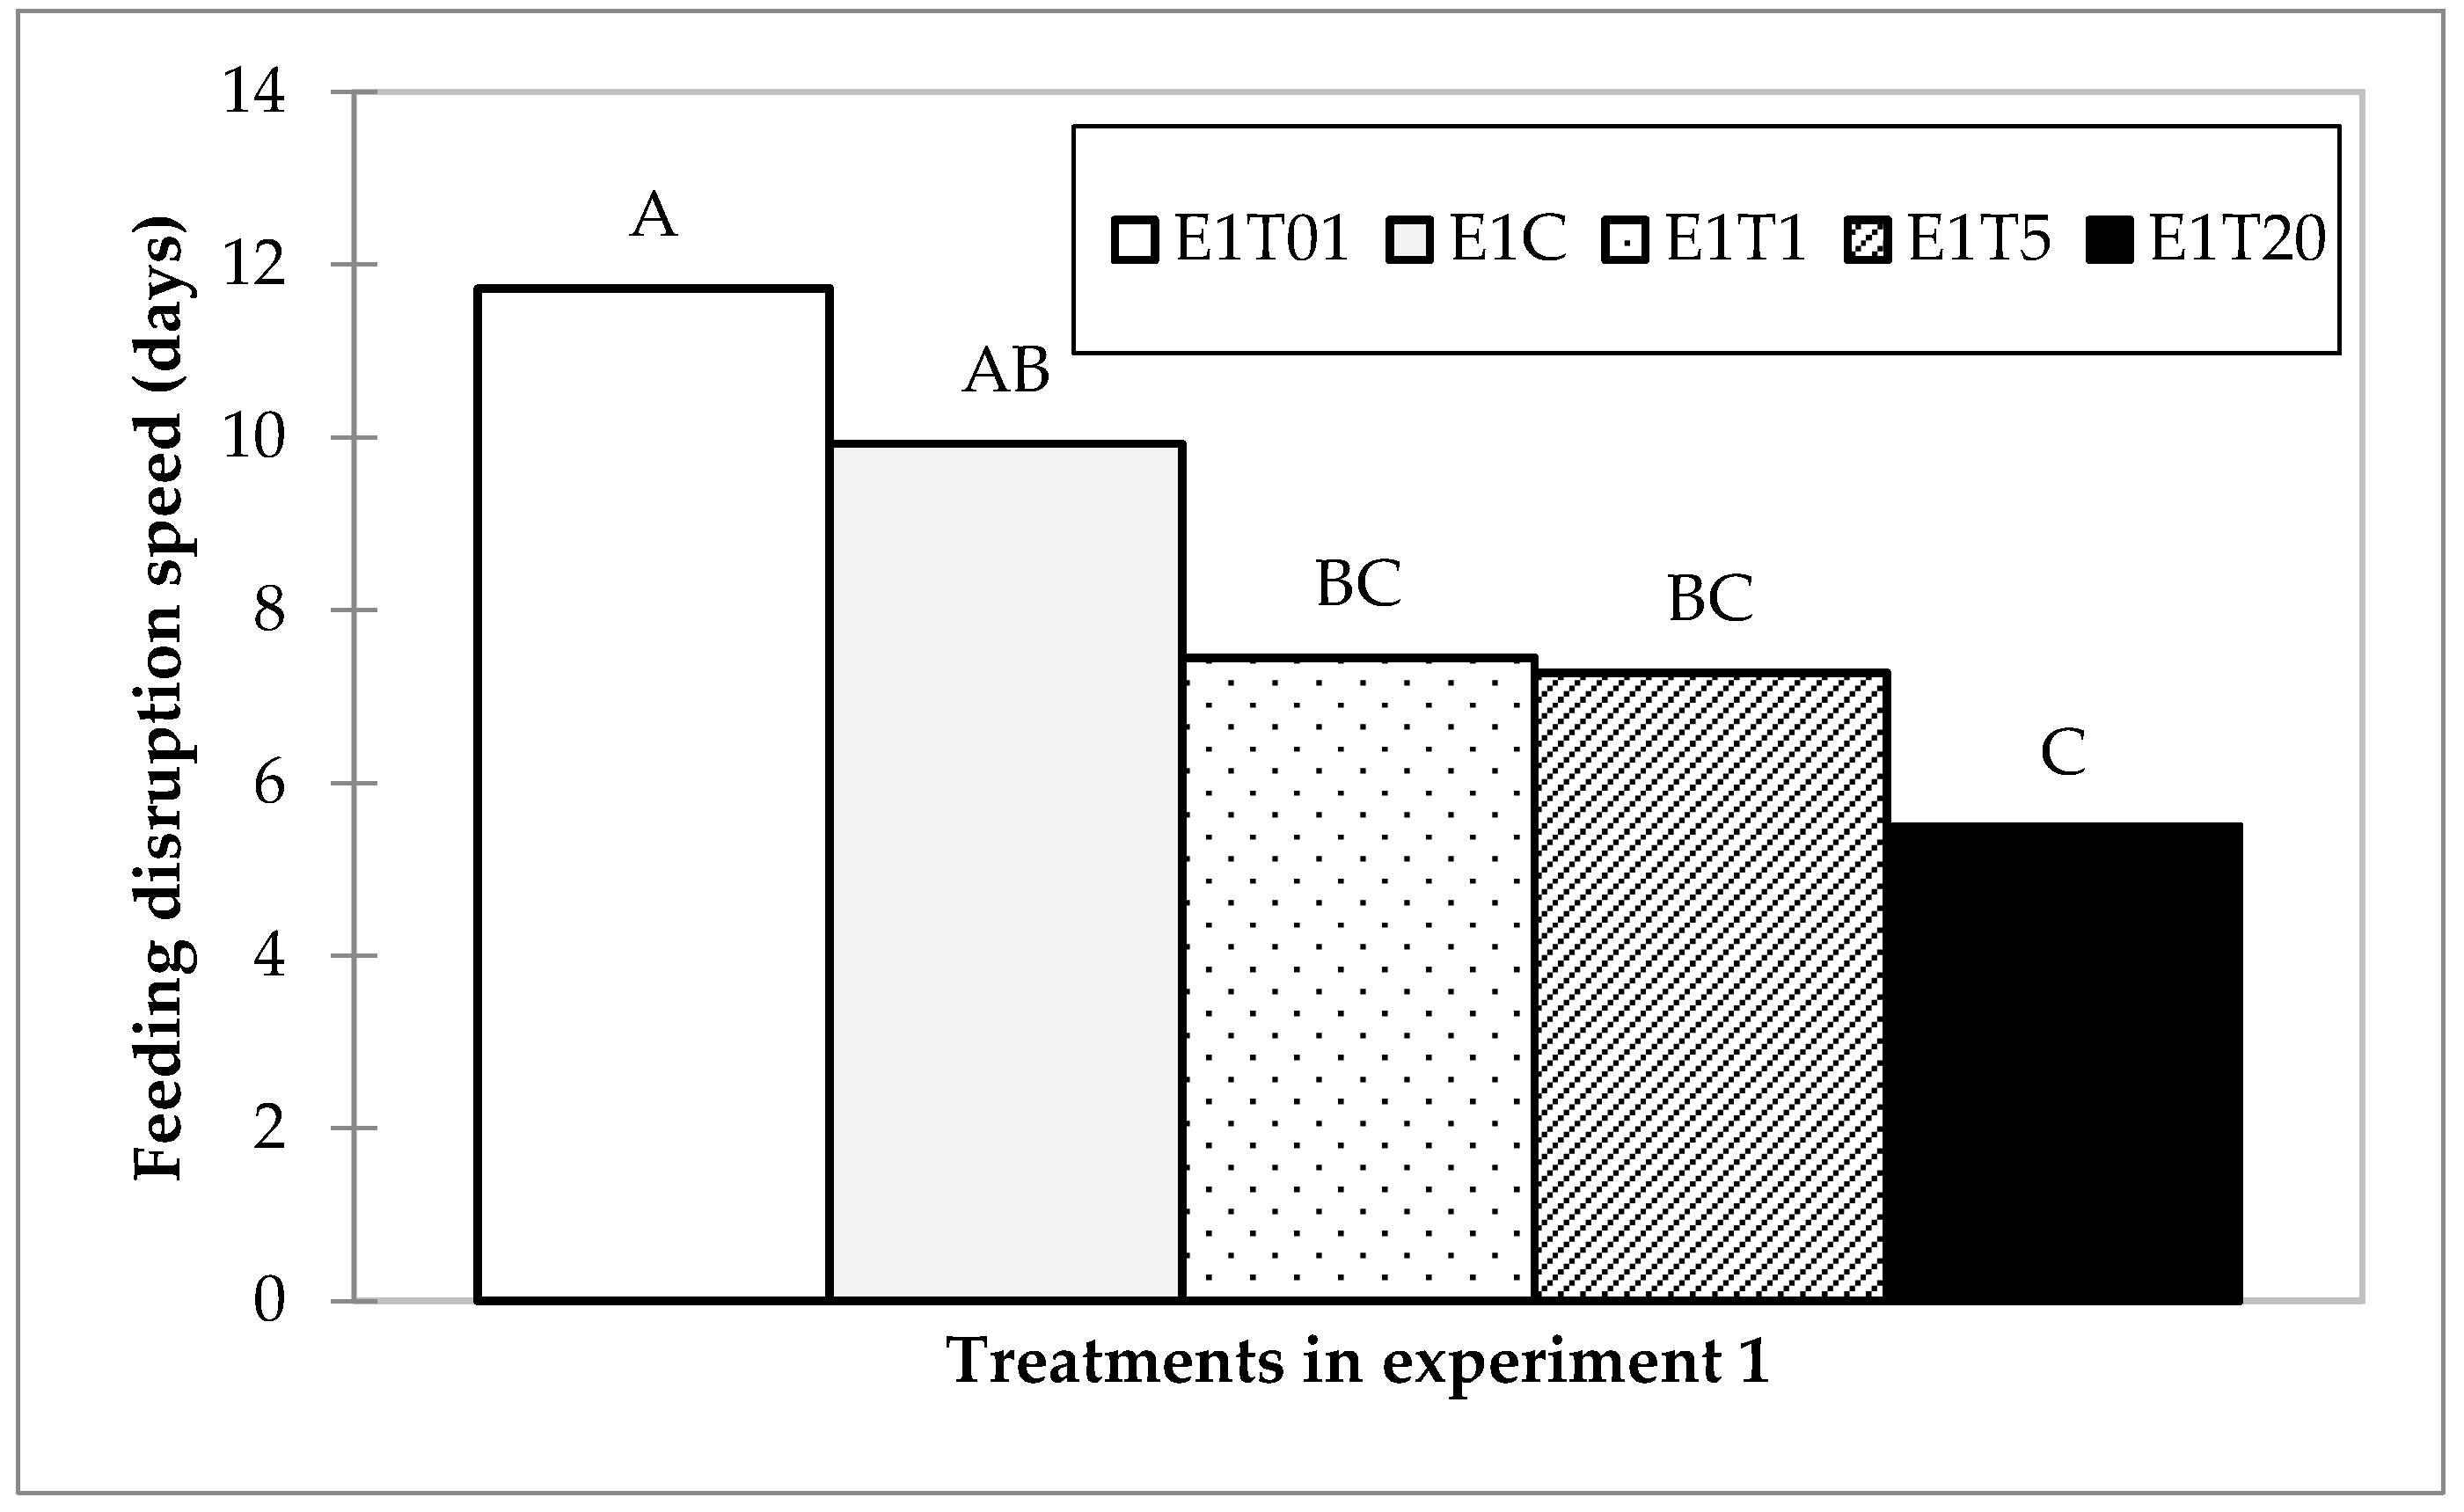
A Tukey multiple pairwise-comparison of the differences between the categories with a confidence interval of 95% grouped treatments in three groups; the treatment with 1:100 diluted spore solution was designated to Group A, the control could not be discriminated between groups A and B, the 1 µL and 5 µL could not be discriminated between Groups B and C; and the 20 µL treatment was designated to Group C (Figure 4).
The non-parametric test also showed a significant difference in lethal time between treatments in experiment 1, and multiple pairwise comparison using the Steel–Dwass–Critchlow–Fligner procedure resulted in three groups. According to this analysis, the 20 µL treatment was clearly designated to Group A, the 5 µL and 1 µL treatments could not be discriminated between Groups A and B, the control could not be discriminated between Groups B and C, while the treatment with 1:100 diluted solution was clearly designated into Group C. The differences between treatments are clearly visible in the Box-Whiskers histograms (Figure 5).
3.2. Experiment 2
Mortality Rates
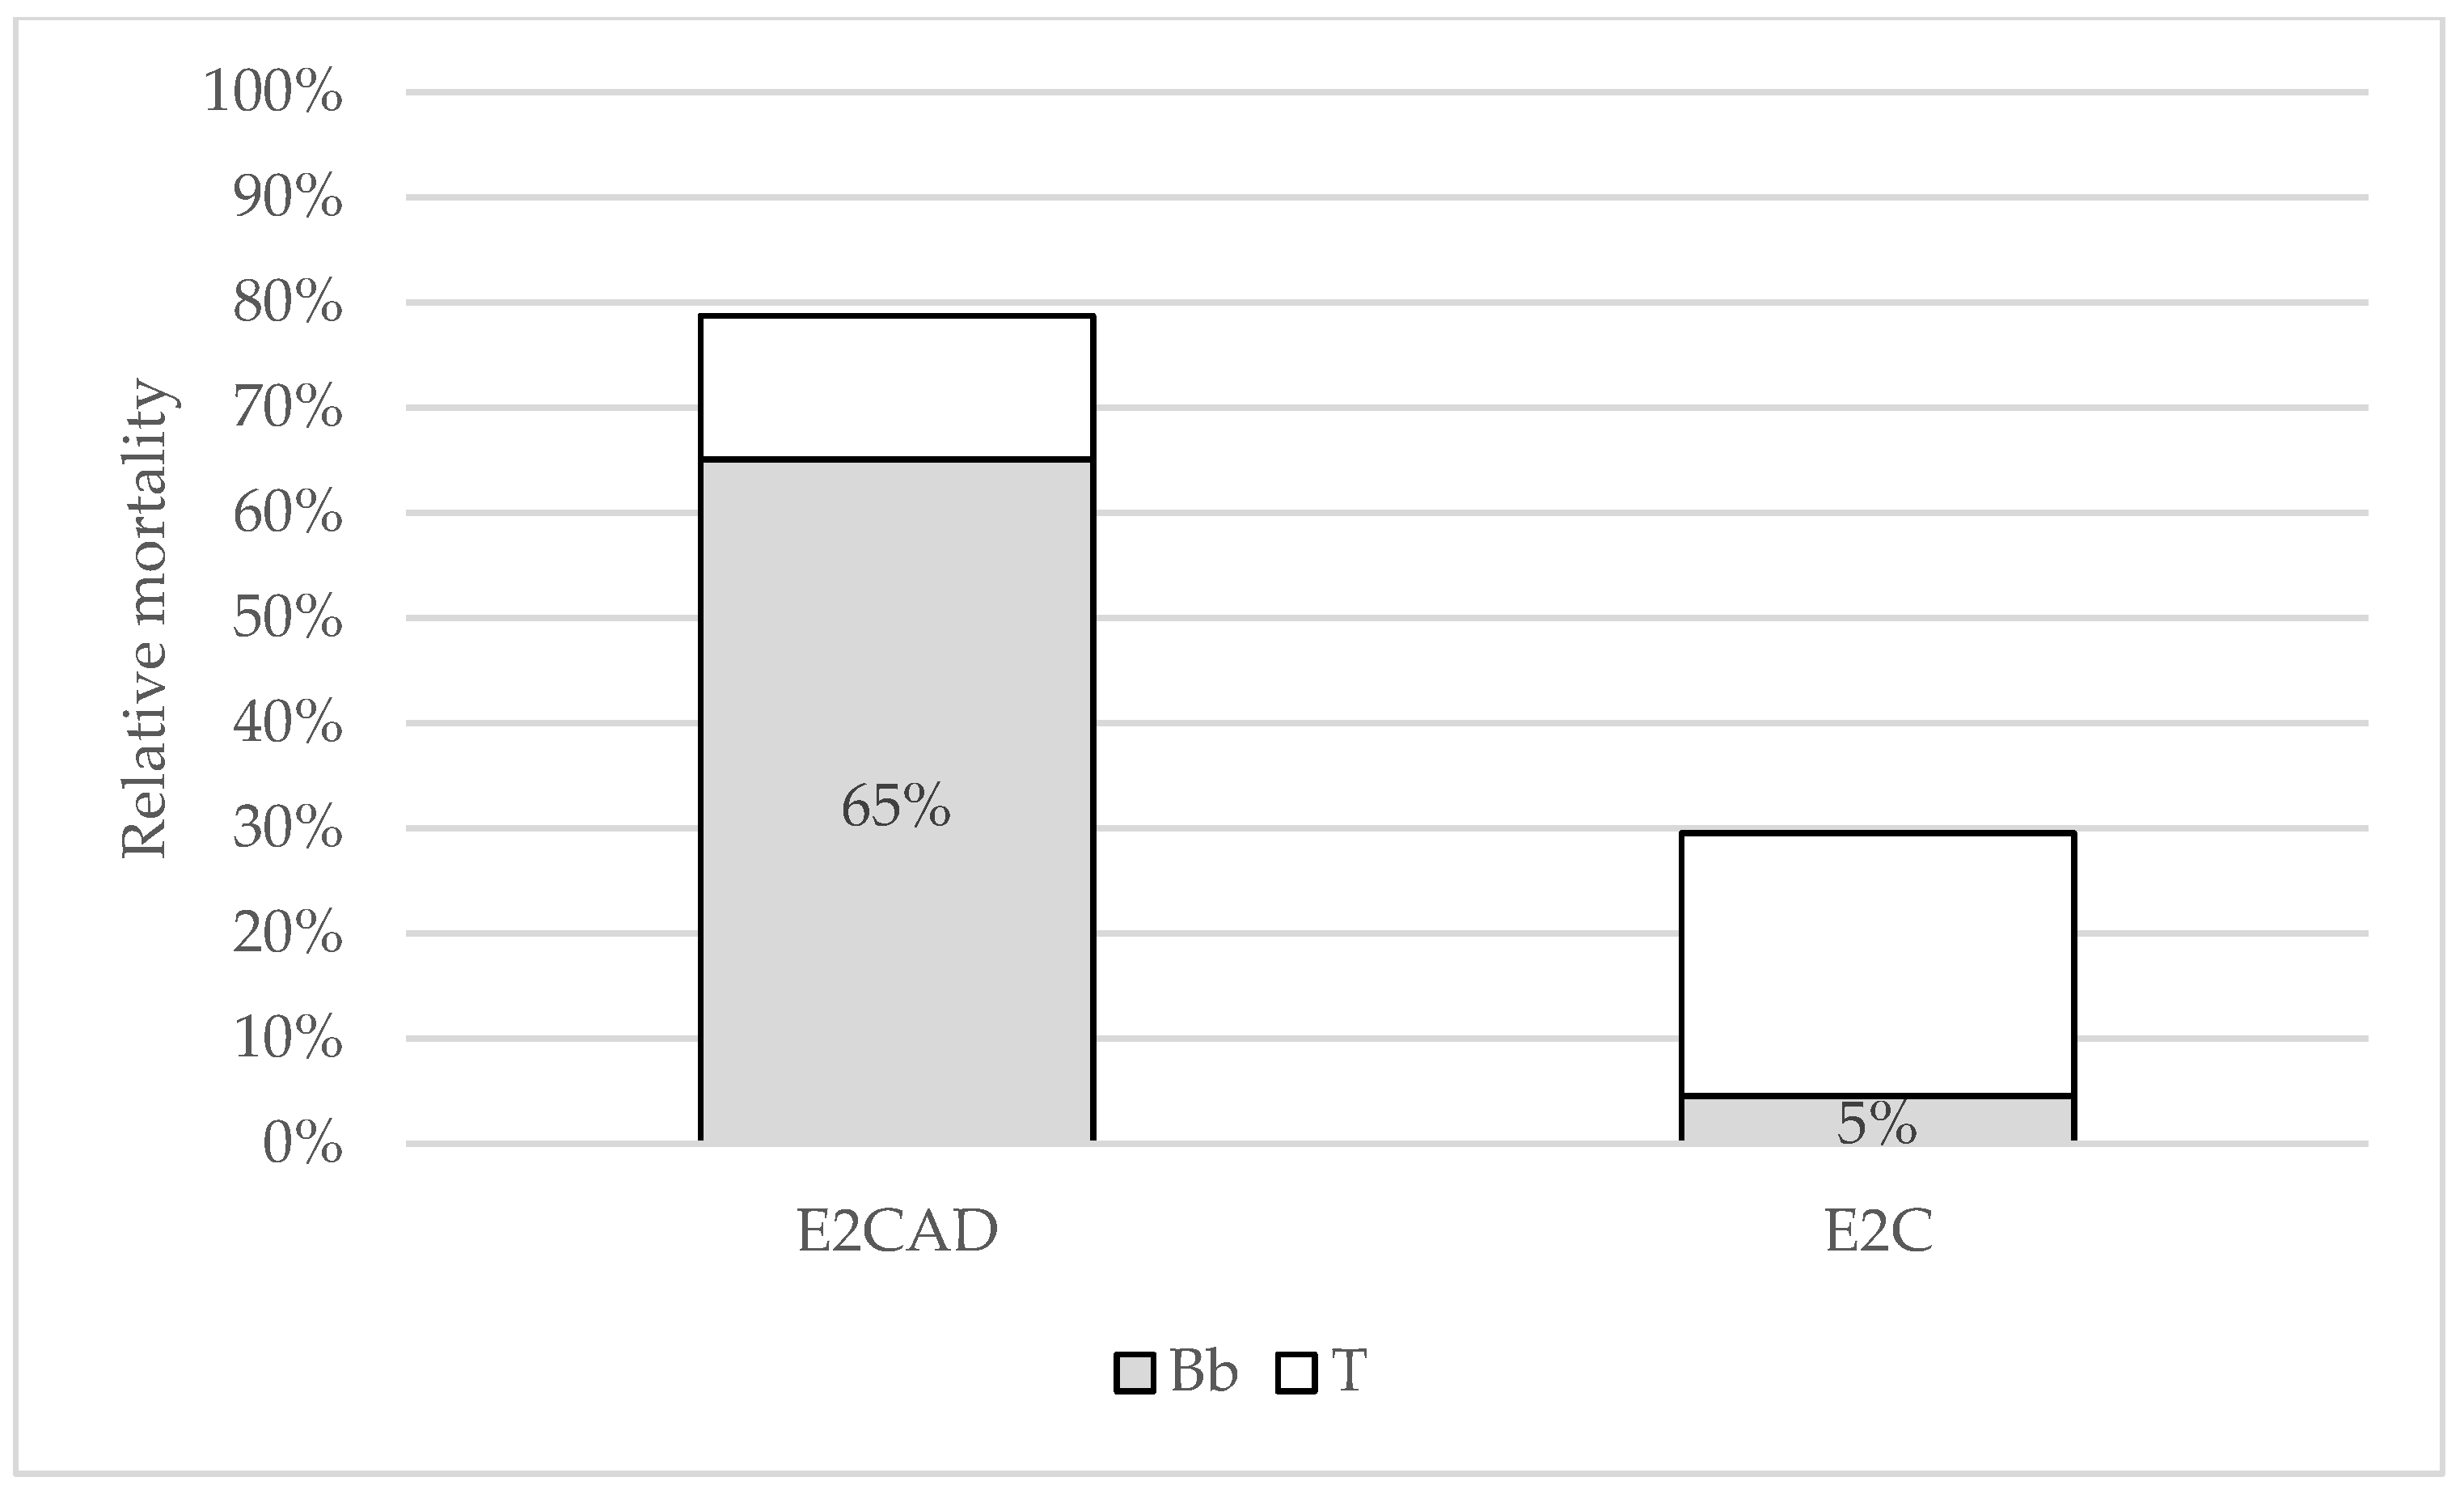
Treatment by exposure to cadavers yielded 85% total mortality and 67% B. bassiana attributed mortality, while there was 30% total and 5% fungus attributed mortality observed in the control group and thus Abbott’s formula was applied to calculate the corrected relative mortality for treated group (Table 5).
The Chi-square test showed that cadaver exposure treatment (E2CAD) total mortality rates were not significantly different from LD100, while mortality attributed to fungus infection was significantly different from LD100 even though it reached 67%. Mortality rates in the control group were significantly different from LD100 looking at both the total and B. bassiana attributed mortality (Figure 6).
4. Discussions
This study was performed with the aim to investigate the potential of B. bassiana isolates for control of D. pini. We compared the susceptibility of D. pini larvae to different doses and concentrations of spore suspensions and revealed that application of 20 µL of 7.9 × 10⁴ conidia/µL suspension could yield 100% mortality with 88% of B. bassiana infection, and a Chi-square test showed that both results could be effectively considered as LD100. The 5 µL and 1 µL dose had a significantly lower yield, however both yielded over 50% mortality attributed to B. bassiana infection. Mortality in the control group of the first experiment was at the level of 13% and was attributed to parasitoid infections and bacteriosis. Looking at the differences between total and B. bassiana attributed mortalities among the treatment groups, the average difference was 11%, thus indicating that differences did not diverge substantially from naturally observed mortality. Consequently, the yield of B. bassiana attributed mortalities in the treatment groups can be considered as a result of our treatments.
Lethal time analysis revealed an average of 9.4 days until dieback for the 20 µL dose, which was also significantly faster compared to all other treatments, and 2.2 days faster than the control group. The 5 µL dose averaged 9.9 days until dieback and was marginally different from the control group. The 1 µL and 1:100 dilution treatments were not significantly different from the control group.
In addition to lethal time, our results showed that effective treatments induced the change in feeding behavior of infected caterpillars. On average, feeding disruption occurred 5.5 days after exposure to 20 µL treatment, which was 3.88 days before the final dieback of caterpillars. Feeding disruption in the control group occurred 9.9 days after the start of the experiment. Comparing these two groups, the disruption in the feeding of caterpillars occurred on average 4.4 days sooner compared to the control group. This is a very interesting result to consider when making forest protection decisions because, not only would treatment disrupt the reproduction and population growth of D. pini through increased mortality, but it would also induce substantially faster cessation of damages inflicted by targeted caterpillars. These findings are in agreement with other studies that reported a decline in food consumption and excretion associated with fungal infections in insects. For example, reduced food intake was observed after treatment with entomopathogenic fungi B. bassiana and Metarhizium anisopliae (Metschn.) Sorokïn (Hypocreales: Clavicipitaceae) in maize stem borer Chilo partellus Swinhoe (Lepidoptera: Crambidae) larvae [27] and in malaria vector mosquitoes [28,29]. Significant reduction in feeding was also demonstrated in green peach aphid Myzus persicae Sulzer (Homoptera: Aphididae) mycosed with entomopathogenic fungus Lecanicillium longisporum (Petch) Zare & W. Gams (Hypocreales: Cordycipitaceae) [30] as well as in desert locust Schistocerca gregaria Forskål (Orthoptera: Acrididae) [4] and variegated grasshopper Zonocerus variegatus L. (Orthoptera: Pyrgomorphidae) [31], both infected with Metarhizium flavoviride Gams and Rozsypal (Hypocreales: Clavicipitaceae).
Looking back at the mortality rates, the relative increase in mortality as a result of dose increase was 2.73% per µL for 5 µL dose and 2.95% per µL for 20 µL dose, all compared to the 1 µL dose. This finding showed that increase in dose to 20 µL yielded higher relative increase in mortality than the 5 µL dose, a result that further bolsters the conclusion that an increase in dose to 20 µL is justified in order to reach significantly higher mortality.
Experiment two resulted in high mortality rate among caterpillars exposed to cadavers covered in mycelia of B. bassiana, demonstrating the ability of horizontal transmission by the fungus. Mortality among caterpillars exposed to cadavers was rather high at 85%, with 67% attributed to fungus infection, while there was 30% total mortality in the control group, 5% of which was attributed to fungus infection. These were 80% and 65%, respectively, when Abbott’s correction was applied due to mortality observed in the control group.
Whether this was an artifact of contamination or a naturally present infection remains unclear. However, the rate observed in the treatment group was significantly greater, thus rendering the results indisputably meaningful. For example, it was demonstrated that horizontal transmission of the B. bassiana infection to healthy Diaphorina citri Kuwayama (Hemiptera: Liviidae) adults [32] and spruce bark beetle Ips typographus L. (Coleoptera: Curculionidae) [33] yielded high mortality rates, indicating that microbial control can be subsequently promoted through conidial cycling (i.e., by generating new infection cycles). In Drummond and Groden [34], infection from B. bassiana sporulating cadavers resulted in significant reduction of a Colorado potato beetle Leptinotarsa decemlineata Say (Coleoptera: Chrysomelidae) population in years following treatment. Horizontal transmission enables self-sustainment and spread of the biocontrol agent, a trait of major importance in light of modern approaches in integrated forest protection.
5. Conclusions
In conclusion, biological methods of controlling D. pini by using entomopathogenic B. bassiana as a natural enemy seems to represent an environmentally acceptable solution that could replace, or at least reduce, the use of chemical insecticides. These laboratory studies should be extended to the field in order to determine the impact of tested concentration and doses of B. bassiana suspensions on D. pini in natural conditions.
Author Contributions
Conceptualization, M.P. and M.K.; Methodology, M.P.; Formal analysis, N.L.; Investigation, M.K.; Data curation, N.L.; Writing—original draft preparation, M.K.; Writing—review and editing, M.P. and N.L.; Visualization, M.K. and N.L.; Supervision, M.P.; Funding acquisition, M.P. All authors have read and agreed to the published version of the manuscript.
Funding
This work was financially supported by the Diagnostic and Prognostic Service (IPP) under the Ministry of Agriculture.
Acknowledgments
The authors greatly appreciate the assistance of their colleagues Ivana Mihaljević, Blaženka Ercegovac, and Nikola Zorić during the field and laboratory work. The authors thank Stacy Blomquist (USA) for the linguistic and editorial improvements.
Conflicts of Interest
The authors declare no conflict of interest.
References
- Skrzecz, I.; Ślusarski, S.; Tkaczyk, M. Integration of science and practice for Dendrolimus pini (L.) management—A review with special reference to Central Europe. For. Ecol. Manag. 2020, 455, 117697. [Google Scholar] [CrossRef]
- Ray, D.; Peace, A.; Moore, R.; Petr, M.; Grieve, Y.; Convery, C.; Ziesche, T. Improved prediction of the climate-driven outbreaks of Dendrolimus pini in Pinus sylvestris forests. Forestry 2016, 89, 230–244. [Google Scholar] [CrossRef] [Green Version]
- Björkman, C.; Lindelöw, A.; Eklund, K.; Kyrk, S.; Klapwijk, M.J.; Fedderwitz, F.; Nordlander, G. A rare event—An isolated outbreak of the pine-tree lappet moth (Dendrolimus pini) in the Stockholm archipelago. Entomol. Tidskr. 2013, 134, 1–9. [Google Scholar]
- Moore, D.; Reed, M.; Le Patourel, G.; Abraham, Y.J.; Prior, C. Reduction of feeding by the desert locust, Schistocerca gregaria, after infection with Metarhizium flavoviride. J. Invertebr. Pathol. 1992, 60, 304–307. [Google Scholar] [CrossRef]
- Matek, M.; Pernek, M. First record of Dendrolimus pini outbreak on Aleppo Pine in Croatia and severe case of population collapse caused by entomopathogen Beauveria bassiana. South East Eur. For. 2018, 9, 91–96. [Google Scholar] [CrossRef] [Green Version]
- Lesniak, A. Climatic and meteorological conditions of the pine moth (Dendrolimus pini L.) outbreaks. Ekol. Polska 1976, 24, 515–547. [Google Scholar]
- Sierpinska, A. Towards an integrated management of Dendrolimus pini L. In Population Dynamics, Impacts, and Integrated Management of Forest Defoliating Insects; McManus, M.L., Liebhold, A.M., Eds.; U.S. Department of Agriculture: Radnor, PA, USA, 1998; pp. 129–142. [Google Scholar]
- Altenkirch, W.; Majunke, C.; Ohnesorge, B. Waldschutz auf ökologischer Grundlage; Ulmer: Stuttgart, Germany, 2002; p. 434. [Google Scholar]
- Habermann, M. Auswirkungen der Anwendungsbestimmungen für die Ausbringung von Pflanzenschutzmitteln mit Luftfahrzeugen im Wald. J. Kult. 2017, 69, 249–254. [Google Scholar] [CrossRef]
- Sukovata, L.; Asztemborska, M.; Rudziński, K.J.; Cieślak, M.; Staszek, D.; Janiszewski, W.; Szmigielski, R.; Kolk, A.; Raczko, J. Effect of dispenser type, trap design and placement on catches of pine-tree lappet moth, Dendrolimus pini. Phytoparasitica 2020, 48, 63–74. [Google Scholar] [CrossRef]
- Sukovata, L.; Jaworski, T. The abundance of the nun moth and lappet moth larvae on trees of different trunk thickness in Scots pine stands in the Notec forest complex. For. Res. Pap. 2010, 71, 231–237. [Google Scholar] [CrossRef]
- Tumialis, D.; Skrzecz, I.; Mazurkiewicz, A.; Pezowicz, E. Sensitivity of caterpillars of the pine tree lappet moth Dendrolimus pini to native isolates of entomopathogenic nematodes. Int. J. Pest. Manag. 2018, 1–6. [Google Scholar] [CrossRef]
- Gedminas, A.; Lynikienė, J.; Ρovilaitienė, A. Entomopathogenic fungus Cordyceps militaris. Distribution in south Lithuania,‘in vitro’ cultivation and pathogenicity tests. Balt. For. 2015, 21, 359–368. [Google Scholar]
- Batta, Y.A. Biocontrol of almond bark beetle (Scolytus amygdali Geurin-Meneville, Coleoptera: Scolytidae) using Beauveria bassiana (Bals.) Vuill. (Deuteromycotina: Hyphomycetes). J. Appl. Microbiol. 2007, 103, 1406–1414. [Google Scholar] [CrossRef]
- Khosravi, R.; Sendi, J.J.; Zibaee, A.; Shokrgozar, M.A. Virulence of four Beauveria bassiana (Balsamo) (Asc., Hypocreales) isolates on rose sawfly, Arge rosae under laboratory condition. J. King Saud Univ. Sci. 2015, 27, 49–53. [Google Scholar] [CrossRef] [Green Version]
- Bukhari, T.; Takken, W.; Koenraadt, C.J.M. Development of Metarhizium anisopliae and Beauveria bassiana formulations for control of malaria mosquito larvae. Parasites Vectors 2011, 4, 23. [Google Scholar] [CrossRef] [Green Version]
- Li, Z.Z. List on the insect hosts of Beauveria bassiana. In Study and Application of Entomogenous Fungi in China; Academic Periodical Press: Beijing, China, 1988; Volume 1, pp. 241–255, (In Chinese with Latin names and English summary). [Google Scholar]
- Feng, M.G.; Poprawski, T.J.; Khachatourians, G.G. Production, formulation and application of the entomopathogenic fungus Beauveria bassiana for insect control: Current status. Biocontrol Sci. Technol. 1994, 4, 3–34. [Google Scholar] [CrossRef]
- Zhang, L.W.; Liu, Y.J.; Yao, J.; Wang, B.; Huang, B.; Li, Z.Z.; Sun, J.H. Evaluation of Beauveria bassiana (Hyphomycetes) isolates as potential agents for control of Dendroctonus valens. Insect Sci. 2011, 18, 209–216. [Google Scholar] [CrossRef]
- Mc Namara, L.; Kapranas, A.; Williams, C.D.; O’Tuama, P.; Kavanagh, K.; Griffin, C.T. Efficacy of entomopathogenic fungi against large pine weevil, Hylobius abietis, and their additive effects when combined with entomopathogenic nematodes. J. Pest. Sci. 2018, 91, 1407–1419. [Google Scholar] [CrossRef]
- Singh, D.; Raina, T.K.; Singh, J. Entomopathogenic fungi: An effective biocontrol agent for management of insect populations naturally. J. Pharm. Sci. Res. 2017, 9, 830–839. [Google Scholar]
- Ortiz-Urquiza, A.; Keyhani, N.O. Action on the Surface: Entomopathogenic Fungi versus the Insect Cuticle. Insects 2013, 4, 357–374. [Google Scholar] [CrossRef] [PubMed]
- Valero-Jiménez, C.A.; Wiegers, H.; Zwaan, B.J.; Koenraadt, C.J.M.; Van Kan, J.A.L. Genes involved in virulence of the entomopathogenic fungus Beauveria bassiana. J. Invertebr. Pathol. 2016, 133, 41–49. [Google Scholar] [CrossRef]
- Kaulfuß, S. The Monitoring and Prognosis of Insect Pests: Early Recognition, Monitoring, Analysis and Action. Wald Wissen. Net, Informationen für die Fortspraxis -Forest Pest Handbook. 2012. Available online: http://www.waldwissen.net (accessed on 22 July 2020).
- Duffus, J.H.; Nordberg, M.; Templeton, D.M. Glossary of terms used in toxicology, 2nd Edition (IUPAC recommendations 2007). Pure Appl. Chem. 2007, 79, 1153–1344. [Google Scholar] [CrossRef] [Green Version]
- Abbott, W.S. A method of computing the effectiveness of an insecticide. J. Econ. Entomol. 1925, 18, 265–267. [Google Scholar] [CrossRef]
- Tefera, T.; Pringle, K.L. Food consumption by Chilo partellus (Lepidoptera: Pyralidae) larvae infected with Beauveria bassiana and Metarhizium anisopliae and effects of feeding natural versus artificial diets on mortality and mycosis. J. Invertebr. Pathol. 2003, 84, 220–225. [Google Scholar] [CrossRef] [PubMed]
- Scholte, E.J.; Knols, B.G.J.; Takken, W. Infection of the malaria mosquito Anopheles gambiae with the entomopathogenic fungus Metarhizium anisopliae reduces blood feeding and fecundity. J. Invertebr. Pathol. 2006, 91, 43–49. [Google Scholar] [CrossRef] [PubMed]
- Blanford, S.; Shi, W.; Christian, R.; Marden, J.H.; Koekemoer, L.L.; Brooke, B.D.; Coetzee, M.; Read, A.F.; Thomas, M.B. Lethal and pre-lethal effects of a fungal biopesticide contribute to substantial and rapid control of malaria vectors. PLoS ONE 2011, 6, e23591. [Google Scholar] [CrossRef] [Green Version]
- Roditakis, E.; Couzin, I.D.; Franks, N.R.; Charnley, A.K. Effects of Lecanicillium longisporum infection on the behaviour of the green peach aphid Myzus persicae. J. Insect Physiol. 2008, 54, 128–136. [Google Scholar] [CrossRef] [Green Version]
- Thomas, M.B.; Blanford, S.; Lomer, C.J. Reduction of feeding by the variegated grasshopper, Zonocerus variegatus, following infection by the fungal pathogen, Metarhizium flavoviride. Biocontrol Sci. Technol. 2010, 7, 327–334. [Google Scholar] [CrossRef]
- Conceschi, M.R.; D’Alessandro, C.P.; de Andrade Moral, R.; Demétrio, C.G.B.; Júnior, I.D. Transmission potential of the entomopathogenic fungi Isaria fumosorosea and Beauveria bassiana from sporulated cadavers of Diaphorina citri and Toxoptera citricida to uninfected D. citri adults. Biocontrol 2016, 61, 567–577. [Google Scholar] [CrossRef] [Green Version]
- Kreutz, J.; Zimmermann, G.; Vaupel, O. Horizontal transmission of the entomopathogenic fungus Beauveria bassiana among the spruce bark beetle, Ips typographus (Col., Scolytidae) in the laboratory and under field conditions. Biocontrol Sci. Technol. 2004, 14, 837–848. [Google Scholar] [CrossRef]
- Drummond, F.A.; Groden, E. IV. Insect Pests and Natural Enemies. In The Ecology, Economics, and Management of Potato Cropping Systems: A Report of the First Four Years of the Maine Potato Ecosystem Project; Marra, M.C., Harrity, B.A., Eds.; University of Maine: Maine, ME, USA, 1996; pp. 80–118. [Google Scholar]
Figure 1.
Total (T) and B. bassiana attributed (Bb) relative mortality as a result of dose and associated dose response curves plotted as polynomic regression of the second order. Abbott’s formula was used for calculation of relative mortality rates. Equations and coefficients of determination for T and Bb dose response curves were y = −6.45x2 + 61.69x − 43.7; R2 = 0.9999 and y = −3.125x2 + 37.375x − 14.375; R2 = 0.9552, respectively.

Figure 2.
Histogram of mean lethal time for treatments in experiment one with denoted affiliation to groups according to Tukey multiple pairwise comparison.
Figure 2.
Histogram of mean lethal time for treatments in experiment one with denoted affiliation to groups according to Tukey multiple pairwise comparison.

Figure 3.
Box plots histograms of lethal time observed for different treatments in experiment one. Twenty μL treatment showed the lowest mean and dissipation of data, followed by 5 μL and 1 μL, while the 1:100 dilution showed highest value, even higher than the control group. Cross represents the arithmetic mean, central line of the box represents the median, upper line of the box represents the third quartile, lower line of the box represents the first quartile, outreaching lines represent standard deviations, dots represent outlayers.

Figure 4.
Summary of the Tukey multiple pairwise comparison of the disruption speed differences between treatments with a confidence interval of 95%.
Figure 4.
Summary of the Tukey multiple pairwise comparison of the disruption speed differences between treatments with a confidence interval of 95%.

Figure 5.
Box plot histograms of feeding disruption speeds observed for different treatments in experiment 1. The 20 μL treatment showed the lowest mean and dissipation of data, followed by 5 μL and 1 μL, while the 1:100 dilution showed the highest value, even higher than the control group. Cross represents the arithmetic mean, the central line of the box represents the median, the upper line of the box represents the third quartile, the lower line of the box represents the first quartile, outreaching lines represent standard deviations, dots represent outlayers.

Figure 6.
Histogram of total (T) B. bassiana (Bb) attributed mortality for treatments in experiment two. Relative rates for treated group (E2CAD) were Abbott corrected for the mortality observed in the control group (E2C).
Figure 6.
Histogram of total (T) B. bassiana (Bb) attributed mortality for treatments in experiment two. Relative rates for treated group (E2CAD) were Abbott corrected for the mortality observed in the control group (E2C).


Table 1.
Experiment 1: Directly pipetting Beauveria bassiana on the back of larvae.
| Group | E1T1 | E1T5 | E1T20 | E1T01 | E1C |
|---|---|---|---|---|---|
| Treatment | Spore suspension | Spore suspension | Spore suspension | Spore suspension | H₂O + Tween (0.1%) |
| Dose per larvae [µL] | 1 | 5 | 20 | 1 | 20 |
| Spore suspension concentration [spores/µL] | 7.9 × 10⁴ | 7.9 × 10⁴ | 7.9 × 10⁴ | 7.9 × 10² (dilution 1:100) | - |
Table 2.
Experiment 2: Using sporulating cadavers with Beauveria bassiana.
| Group | E2CAD | E2C |
|---|---|---|
| Treatment | Healthy larvae + cadaver | Only healthy larvae |
Table 3.
Total and B. bassiana attributed absolute and relative mortality rates with Abbott’s correction for treatments in experiment set 1 and corresponding results of a Chi-square test. Values that are not significantly different from LD100 are highlighted in bold, and values for which H0 cannot be accepted nor rejected are depicted in cursive.
| Treatment | E1T1 | E1T5 | E1T20 | E1T01 | E1C | |||||
|---|---|---|---|---|---|---|---|---|---|---|
| Mortality rate | Abs | Rel | Abs | Rel | Abs | Rel | Abs | Rel | Abs | Rel |
| Total | 24 | 54% | 34 | 83% | 40 | 100% | 9 | 11% | 5 | 13% |
| χ2 (p) | 6.40 (0.0114) | 0.90 (0.3428) | 0.00 (1.0000) | 24.03 (<0.0001) | 30.63 (<0.0001) | |||||
| B. bassiana | 22 | 55% | 25 | 63% | 35 | 88% | 7 | 18% | 0 | 0% |
| χ2 (p) | 8.10 (0.0044) | 5.63 (0.0177) | 0.63 (0.4292) | 27.23 (<0.0001) | 40.00 (0.0000) | |||||
Table 4.
Lethal time descriptive statistics and results of parametric and non-parametric statistical tests of differentiation between treatments in Experiment 1.
Table 4.
Lethal time descriptive statistics and results of parametric and non-parametric statistical tests of differentiation between treatments in Experiment 1.
| Treatment | N | Min | Max | Sd | ANOVA | Kruskal–Wallis | |||
|---|---|---|---|---|---|---|---|---|---|
| E1C | 40 | 0.000 | 15.000 | 11.625 | 5.092 | DF | 4 | K (Observed value) | 40.230 |
| E1T01 | 40 | 2.000 | 1.000 | 13.700 | 3.164 | Sum of squares | 484.430 | K (Critical value) | 9.488 |
| E1T1 | 40 | 0.000 | 15.000 | 10.200 | 4.794 | Mean squares | 121.108 | DF | 4 |
| E1T20 | 40 | 2.000 | 15.000 | 9.375 | 2.862 | F | 6.901 | p-value (one-tailed) | <0.0001 |
| Pr > F | <0.0001 | ||||||||
Table 5.
Total and B. bassiana attributed absolute and relative mortality rates for treatments in experiment set two and corresponding results of the Chi-square tests. Values that are not significantly different from LD100 are highlighted in bold. Abbott’s formula was used to calculate relative mortality for thee treated group (E2CAD) due to mortality observed in the control group (E2C).
| Treatment | E2CAD | E2C | ||
|---|---|---|---|---|
| Mortality | Abs | Rel | Abs | Rel |
| Total | 51 | 85% | 13 | 30% |
| χ2 (p) | 1.35 (0.2453) | 21.84 (<0.0001) | ||
| B. bassiana | 40 | 67% | 2 | 5% |
| χ2 (p) | 6.67 (0.0098) | 40.09 (<0.0001) | ||
© 2020 by the authors. Licensee MDPI, Basel, Switzerland. This article is an open access article distributed under the terms and conditions of the Creative Commons Attribution (CC BY) license (http://creativecommons.org/licenses/by/4.0/).
Share and Cite
MDPI and ACS Style
Kovač, M.; Lacković, N.; Pernek, M. Effect of Beauveria bassiana Fungal Infection on Survival and Feeding Behavior of Pine-Tree Lappet Moth (Dendrolimus pini L.). Forests 2020, 11, 974. https://doi.org/10.3390/f11090974
AMA Style
Kovač M, Lacković N, Pernek M. Effect of Beauveria bassiana Fungal Infection on Survival and Feeding Behavior of Pine-Tree Lappet Moth (Dendrolimus pini L.). Forests. 2020; 11(9):974. https://doi.org/10.3390/f11090974
Chicago/Turabian StyleKovač, Marta, Nikola Lacković, and Milan Pernek. 2020. "Effect of Beauveria bassiana Fungal Infection on Survival and Feeding Behavior of Pine-Tree Lappet Moth (Dendrolimus pini L.)" Forests 11, no. 9: 974. https://doi.org/10.3390/f11090974
Note that from the first issue of 2016, this journal uses article numbers instead of page numbers. See further details here.