


Abstract
Objective: To investigate the association between subjective pain intensity and objective parameters obtained from two autonomic function tests in a longitudinal study targeting acute pain model in otolaryngology-head and neck region: pupillary light reflex (PLR) and heart rate variability (HRV). Approach: We enrolled 35 patients with acute otolaryngology—head and neck region inflammatory disorders at pre-treatment stage. The acute inflammatory disorders were defined as acute tonsillitis, peritonsillar abscess, acute epiglottitis, acute sinusitis, and deep neck space abscess. Patients underwent a numeric rating scale (NRS) to monitor subjective pain intensity, PLR, and HRV as objective tests at 4 time-points during the follow-up term. As main outcome variables, we used 15 analyzable PLR/HRV parameters. To improve robustness of conclusions about the association between NRS and PLR/HRV parameters, we prepared four linear mixed-effects models (LMMs) including predictor variables such as NRS, sociodemographic factors, and individual variability. And then, we selected the better-fit model based on the lowest Akaike's information criterion. Main results: NRS significantly decreased due to treatments. In 14 out of 15 parameters, better-fit models were models including not only sociodemographic factors but also individual variability. We observed significant parameter alterations to one unit change of NRS in five PLR and four HRV parameters. Significance: The current study revealed that PLR/HRV parameters can be used as biomarkers reflecting pain relief effects. In addition, the findings suggest the importance of adjusting predictor variables, especially individual variability defined as random effects in LMMs, for obtaining more accurate parameter estimation in the longitudinal study.
Export citation and abstract BibTeX RIS
Abbreviations
| ACV | averaged constriction velocity |
| ADV | averaged dilation velocity |
| ANS | autonomic nervous system |
| DELTA | constriction ratio |
| END | minimum pupil size after light stimulus |
| HF norm | normalized values of high frequency HRV |
| HRV | heart rate variability |
| INIT | initial pupil size |
| LAT | latency |
| LF norm | normalized values of low frequency HRV |
| LMMs | linear mixed-effects models |
| MCV | max constriction velocity |
| NRS | numeric rating scale |
| PLR | pupillary light reflex |
| pNN50 | percentage of adjacent R-R intervals that differ from each other by more than 50 ms |
| PNS | parasympathetic nervous system |
| rMSSD | root mean square of successive R-R interval differences |
| rMSSDc | corrected rMSSD |
| SDNN | standard deviation of normal R-R intervals |
| SDNNc | corrected SDNN |
| SNS | sympathetic nervous system |
| T75 | time taken for 75% recovery of INIT |
Introduction
Acute inflammatory disorders in the otolaryngology—head and neck region, such as acute tonsillitis (Sadeghirad et al 2017), peritonsillar abscess (Galioto 2017), acute epiglottitis (Shapira Galitz et al 2017), acute sinusitis (Pipolo et al 2018), and deep neck space abscess (Buckley et al 2019) are representative pain models for otolaryngologists, as patients visit the hospital for severe pain and obtain symptomatic relief due to a few weeks' treatments during the follow-up term. Otolaryngologists have assessed the pain intensity of patients using subjective tools such as numeric rating scale (NRS). However, the subjective interpretation can differ among patients, and can be affected by several factors such as socioeconomic and psychological status (Thumboo et al 2002). The inherent bias of subjective tools can prevent otolaryngologists from grasping a patient's pain intensity accurately, leading to inappropriate pain assessment and insufficient treatments for pain relief. Therefore, the establishment of objective tools reflecting pain intensity is clinically required.
Autonomic nervous system (ANS) function tests targeting heart rate and pupil responses have been used for pain assessment (Kyle and McNeil 2014). The tests reflect the function of the ANS, which consists of the sympathetic nervous system (SNS) and the parasympathetic nervous system (PNS). Heart rate variability (HRV) has been reviewed as a tool for assessing experimentally-induced pain in adult subjects (Koenig and Thayer 2016). Moreover, in addition to HRV, pupil size is another objective tool for pain assessment, with pupil dilation occurring due to experimentally-induced pain (Ellermeier and Westphal 1995, Tassorelli et al 1995, Chapman et al 1999, Walter et al 2005, Hofle et al 2008, Bertrand et al 2013) and clinically-induced noxious stimulation (Larson et al 1997, Isnardon et al 2013, Lukaszewicz et al 2015, Wildemeersch et al 2018). Pain modulates activation of the excitatory sympathetic premotor neurons in the locus coeruleus (LC) of diurnal species, such as humans, leading to pupil dilation (Szabadi 2012, 2018). A previous clinical study reported the association of maximum pupillary constriction velocity and pupil size with subjective pain scores in pediatric patients (Connelly et al 2014), supporting the utility of PLR as a tool for pain assessment. To date, no clinical studies have investigated the association between NRS and PLR/HRV parameters in the pain model of acute disorders of otolaryngology—head and neck region.
A longitudinal study design with repeated measurements has been shown to be helpful in understanding inter-subject and intra-subject variability of pain (Mun et al 2019). The obtained data are often clusters of non-independent observational units with hierarchy in nature. Therefore, longitudinal studies possess some statistical complexities since the customary assumption that all observations are independent does not usually hold true. In addition, the individual variability can be an obstacle to obtain an accurate estimation of altered HRV and PLR parameters due to pain relief. Repeated-measures analysis of variance (RM-ANOVA) is one of the classic methods for repeated measurements in linear models and has been applied in longitudinal studies. RM-ANOVA can be applied under the following criteria: setting discrete covariates; no missing data; and common time points of measurement for all subjects (McCulloch 2005). However, clinically-designed longitudinal studies often possess unbalanced and incomplete data. Thus, researchers might wonder which statistical methods should be selected to overcome such issues while conducting longitudinal studies. Recently, the clinical utility of linear mixed-effects models (LMMs) in longitudinal studies has been well-documented because LMMs possess the flexibility for the criteria described above, the characteristics accounting for the clustering, and the ability of adjusting the individual variability as random effects (Finucane et al 2007, Harrison et al 2018). Thus, LMMs can provide accurate estimation of HRV/PLR parameter in response to pain relief; thereby, improving the robustness of the results under a given set of data.
The aim of the current study was to assess the association between NRS and HRV/PLR parameters using LMMs over the duration of clinical treatment for acute inflammatory disorders in the otolaryngology—head and neck region, and to explore the clinical potential of HRV/PLR parameters as biomarkers for pain relief assessment.
Methods
Patients
Patients with acute inflammatory disorders in the otolaryngology—head and neck region, treated at the Hyogo Prefectural Amagasaki General Medical Center between August 2018 and March 2019, were enrolled in a prospective longitudinal study.
The acute inflammatory disorders were defined as acute tonsillitis, peritonsillar abscess, acute epiglottitis, acute sinusitis, and deep neck space abscess. Inclusion criteria were patients aged older than 17 years, requiring hospitalization for medical treatment of acute inflammatory disorders in the otolaryngology—head and neck region. Experienced otolaryngologists (more than 10 years' experience) judged the necessity of the hospitalization if the following symptoms and findings were present: dysphagia due to pain; abscess requiring surgical drainage; potential of sudden respiratory obstruction. We collected the following sociodemographic and medical data: sex; age; body mass index (BMI); alcohol consumption; smoking intensity; asthma status; diabetes status, by means of questionnaires. BMI was categorized as follows: (1) Underweight and healthy, BMI < 25; (2) Overweight and obese, 25.0  BMI. Based on alcohol consumption, individuals were classified as follows: (1) Non-drinker; (2) Light/Moderate drinker; (3) Heavy drinker. Light/Moderate drinker was defined as drinking one (included) to five drinks per day, while heavy drinker as drinking more than five drinks per day. Smoking intensity based on Brinkman index (number of cigarettes smoked per day multiplied by the number of years of smoking),
All patients gave informed consent prior to initiating treatment. After performing pain assessments using subjective and objective tools, patients received treatments, mainly by way of intravenous and oral antibiotic agents. When diagnostic imaging showed an abscess in the tonsils or neck, the patients underwent abscess drainage prior to antibiotic treatment. All patients were hospitalized for at least 3 days. As they obtained sufficient symptomatic relief, patients were discharged from hospital, with subsequent ambulant follow-up. All patients were followed-up from day 7 to day 28 post-treatment.
This prospective study was approved by the Research Ethics Committee of Hyogo Prefectural Amagasaki General Medical Center.
Tools for assessing post-surgical pain
We used portable infrared pupillometer (PLR-3000, NeurOptics, Irvine, California, USA) and HRV devices (CheckMyHeart, Daily Care BioMedical, Taiwan) for the PLR and HRV tests, respectively.
In PLR tests, we determined the following eight parameters: (1) initial pupil size (INIT, mm); (2) minimum pupil size after the light stimulus (END, mm); (3) averaged constriction velocity (ACV, mm s−1); (4) maximum constriction velocity (MCV, mm s−1); (5) constriction ratio, defined as the difference between INIT and END divided by INIT (DELTA, %); (6) latency for constriction (LAT, ms); (7) averaged dilation velocity (ADV, mm s−1); (8) time taken for 75% recovery of INIT (T75, s). PLR parameters are markedly affected by the stimulus intensity range (Ellis 1981, Gavriysky 1991, Bitsios et al 1996, Ishikawa 2020). To assess how a range of stimulus intensity can affect PLR parameters, we prepared four different stimulus intensities (10, 50, 121, and 180 μW) by a transient flashlight with 800 ms pulse duration. We set the stimulation duration of three seconds to 10 μW, while that of five seconds to the other stimulus intensities. To measure parameters in response to each stimulus intensity, we adopted a step-up method to both eyes, as reported previously (Ishikawa 2020).
HRV data were recorded from both forearms for five minutes, and then analyzed automatically by the device, using the built-in software provided by the manufacturer. For time domain analysis, we obtained three detrend parameters of standard deviation of normal R-R intervals (SDNN), root mean square of successive R-R interval differences (rMSSD), pNN50 (percentage of adjacent R-R intervals that differed from each other by more than 50 ms). Normal values of HRV parameters obtained from analysis of the time domain are known to have a universal exponential decay-like relationship with heart rate, and can result in misleading conclusions about scientific findings (Monfredi et al 2014). Therefore, it is recommended to correct the values for heart rate level (Monfredi et al 2014, van Roon et al 2016, van den Berg et al 2018). We obtained corrected SDNN (SDNNc) and rMSSD (rMSSDc) using a correction procedure reported previously (van den Berg et al 2018). For frequency domain analysis, we obtained 5 detrend parameters, quantified with an autoregressive method: (1) the power of low frequency HRV (LF power; 0.04 to 0.15 Hz); (2) the power of high frequency HRV (HF power; 0.15 to 0.4 Hz); (3) normalized values of low frequency HRV (LF norm; LF power × 100/Total power—very low frequency); (4) normalized values of high frequency HRV (HF norm; HF power × 100/Total power—very low frequency); and (5) LF/HF values. Previous studies pointed out the disadvantage of raw values (LF power and HF power) because of the large individual variability, which leads to a long-tailed right-skewed exponential distribution (Burr 2007, Ishikawa 2020). Finally, we adopted SDNN, SDNNc, rMSSD, rMSSDc, pNN50, HFnorm, LFnorm, and LF/HF for HRV analysis.
Study design
Four time-points were set for assessment during the time course of treatments: (1) pre-treatment; (2) day 1 post-treatment; (3) day 2 post-treatment; (4) last follow-up during the days 7–28 post-treatment period. The last follow-up was defined as the final consultation during the follow-up term.
For the assessments, all patients completed questionnaires on pain intensity, followed by PLR and HRV tests. In the questionnaire, the NRS, ranging from 0 to 10, was used as a general index of pain intensity, with 0 representing no pain and 10 representing the worst imaginable pain.
We performed PLR and HRV tests in a quiet consulting room. Patients underwent the HRV test in the dim room, followed by the PLR test. The data collection protocol was time-sensitive, particularly at the pre-treatment and at the last follow-up. Pre-treatment measurements were performed between 8 am and 11 pm, while those at the last follow-up were performed between 9 am and 3 pm. At days 1 and 2 post-treatment, measurements were performed between 8 am and 11 am.
Data analysis
We expressed variables as means and 95% confidence intervals (CI) or as medians and interquartile ranges (IQR). We compared NRS data over the time course using a Friedman test with Dunn's multiple comparison test.
To explore the association between NRS and PLR/HRV parameters, we used four LMMs. LMMs consist of fixed or random effects. In fixed effects of HRV data, we specified predictor variables in the following: NRS and sociodemographic factors such as age, sex, categorized BMI, alcohol consumption, and smoking intensity. Random effects consisted of random intercept and slope. In fitting only a random intercept, we assumed values of PLR/HRV parameters can differ among subjects; however, the alteration of the parameters for a one unit change in NRS can be common: different intercepts with common slopes among subjects. In fitting random intercepts and slopes, we assumed that the alteration of PLR/HRV parameters to the NRS alteration can differ among subjects: different intercepts and slopes among subjects. Model 1 consisted of NRS. In Model 1 of PLR parameters, the stimulus intensity was added to fixed effects. Model 2 contained all the terms of Model 1, with an additional term for sociodemographic factors such as age, sex, categorized BMI, alcohol consumption, and smoking intensity. Model 3 (defined as random intercept model) added random intercept to all the terms of Model 2. Model 4 (defined as random slope model) added random slope to all the terms of Model 3. The NRS was specified as the random slope by adding it to the structure. We fit subject ID (n = 35 subjects for HRV data) or subject's eye ID (n = 70 eyes of 35 subjects for PLR data) as a random intercept. We compared values of Akaike's information criterion (AIC) among the four models. The better-fit models were defined as the lower AIC model. A two-sided p-value < 0.05 was considered statistically significant. All statistical analyses were performed with R in the statistical analyses (version 3.6.1, R Foundation for Statistical Computing, Vienna, Austria, lme4 and lmerTest package). The formula of the four models are shown using notation equivalent to fitting models in the lme4 package code.
Model 1: ANS parameter values = Intercept + NRS (+ stimulus intensity in PLR)
Model 2: ANS parameter values = Model 1 +sociodemographic factors
Model 3: ANS parameter values = Model 2 +(1 ∣ subject ID in HRV or subject's eye ID in PLR)
Model 4: ANS parameter values = Model 3 + (1 + NRS ∣ subject ID in HRV or subject's eye ID in PLR)
Results
Characteristics of patients
Thirty-five Japanese patients were enrolled in the current study. Table 1 shows the sociodemographic and medical characteristics of the patients. There were no patients suffering from asthma and diabetes, and lost to follow-up.
Table 1. Sociodemographic and medical characteristics of patients.
| Characteristics | Patients (n = 35) |
|---|---|
| Mean age (SD) | 38 (14) |
| Sex, Male, n (%) | 21 (60) |
| Body mass index, kg m−2 | |
| Underweight or healthy weight, <25 | 24 (69) |
| Overweight or obese, ≥25.0 | 11 (31) |
| Alcohol consumption, n (%) | |
| Non-drinker | 17 (49) |
| Light/Moderate drinker | 10 (29) |
| Heavy drinker | 8 (22) |
| Cigarette smoking intensity | |
| Brinkman index, median (IQR) | 180 (0–390) |
| Type of disease, n (%) | |
| Acute tonsillitis | 16 (45) |
| Peritonsillar abscess | 10 (29) |
| Acute epiglottis | 5 (14) |
| Deep neck space abscess | 2 (6) |
| Acute sinusitis | 2 (6) |
Alteration of NRS due to treatments
We compared the NRS scores along the 4 time-points. The median values (IQR) were 8 (5, 9), 5 (3, 6), 2 (5, 1), and 0 (0, 0) at pre-treatment, Day 1, Day 2, and last follow-up, respectively. Statistical analysis revealed a significant decrease in the NRS over time (p < 0.001). A post-hoc test revealed a significant decrease of NRS values at last follow-up in comparison to values at pre-treatment (p < 0.001).
Efficacy of selecting better-fit models for parameter estimation in LMMs
In PLR data, more than 32% of the T75 data were unanalyzable because of an insufficient test duration to recover 75% of INIT, and therefore we excluded the parameter from the analysis. In Model 2 of LMMs, we observed collinearity between age and smoking intensity through the model selection process. Therefore, we excluded the latter from sociodemographic factors.
We compared AIC among the four models in PLR/HRV parameters (table 2). All parameters except LF/HF showed the lower AIC due to adding random effects. Based on the lowest AIC, we selected, as better-fit models, Model 3 in all HRV parameters except LF/HF, Model2 in LF/HF, and Model 4 in all PLR parameters.
Table 2. Comparison of Akaike's information criterion among four models and selection of better-fit model.
| Model | Model 1 | Model 2 | Model 3 | Model 4 | Better-fit model | |
|---|---|---|---|---|---|---|
| PLR parameter | INIT | 3320 | 3070 | 1589 | 1493 | Model 4 |
| END | 2738 | 2598 | 1217 | 1157 | Model 4 | |
| ACV | 2229 | 2015 | 1369 | 1306 | Model 4 | |
| MCV | 3295 | 3086 | 2400 | 2342 | Model 4 | |
| DELTA | 7483 | 7359 | 6542 | 6492 | Model 4 | |
| LAT | −4748 | −4912 | −5143 | −5148 | Model 4 | |
| ADV | 179 | 111 | −109 | −121 | Model 4 | |
| HRV parameter | SDNN | 1248 | 1248 | 1221 | Failed | Model 3 |
| SDNNc | 1564 | 1567 | 1534 | Failed | Model 3 | |
| rMSSD | 1200 | 1205 | 1188 | Failed | Model 3 | |
| rMSSDc | 1786 | 1792 | 1746 | Failed | Model 3 | |
| pNN50 | 1038 | 1035 | 1024 | Failed | Model 3 | |
| HF norm | 1218 | 1197 | 1181 | Failed | Model 3 | |
| LF norm | 1218 | 1197 | 1181 | Failed | Model 3 | |
| LF/HF | 594 | 583 | 598 | 600 | Model 2 |
ACV, ADV, DELTA, END, HF norm, HRV, INIT, LAT, LF norm, LF/HF, MCV, NRS, PLR, pNN50, rMSSD, rMSSDc, SDNN, and SDNNc: see 'Abbreviations'.The term 'Failed' means failed convergence.Model 1: Outcome variable = Intercept + NRS (+ Stimulus intensity in PLR).Model 2: Outcome variable = Model 1 + Sociodemographic factors.Model 3: Outcome variable = Model 2 + random intercept.Model 4: Outcome variable = Model 3 + random slope.
Table 3 shows how regression estimate and 95% CI can differ among the four models when we expected change in values of PLR parameters for one microwatt change in stimulus intensity. In all PLR parameters, we observed same regression estimates among four models, and narrower 95% CI due to adding predictor variables such as sociodemographic factors and random effects. Model 4, the better-fit model, showed all significant PLR parameter shifts due to an increased stimulus intensity in the following: (1) the decrease of INIT, END, and ADV, (2) the shortening of LAT, and (3) the increase of ACV, MCV, and DELTA.
Table 3. Expected change in values of pupillary light reflex parameters for one microwatt change in stimulus intensity.
| Parameter (unit) | INIT (mm) | END (mm) | ACV (mm s−1) | MCV (mm s−1) |
|---|---|---|---|---|
| Regression estimate (95% CI) × 10−4 | ||||
| Model 1 | −14.4 ** (−23.9, −4.9) | −43.3 *** (−50.6, −35.9) | 17.5 *** (11.6, 23.3) | 45.1 *** (35.6, 54.5) |
| Model 2 | −14.4 *** (−22.9, −5.9) | −43.3 *** (−50.2, −36.4) | 17.5 *** (12.2, 22.8) | 45.1 *** (36.5, 53.6) |
| Model 3 | −14.4 *** (−18.2, −10.6) | −43.3 *** (−46.5, −40.1) | 17.5 *** (13.9, 21.0) | 45.1 *** (39.5, 50.7) |
| Model 4 | −14.4 *** (−17.8, −11.0) | −43.3 *** (−46.3, −40.3) | 17.5 *** (14.2, 20.7) | 45.1 *** (39.8, 50.3) |
| Parameter (unit) | DELTA (%) | LAT (ms) | ADV (mm s−1) # | |
| Regression estimate (95% CI) × 10−2 | ||||
| Model 1 | 6.0 *** (5.4, 6.6) | −10.3 *** (−12.8, −7.6) | −4.9 *** (−7.3, −2.6) | |
| Model 2 | 6.0 *** (5.4, 6.5) | −10.3 *** (−12.7, −7.8) | −4.9 *** (−7.2, −2.7) | |
| Model 3 | 6.0 *** (5.6, 6.3) | −10.3 *** (−12.2, −8.3) | −4.9 *** (−6.8, −3.1) | |
| Model 4 | 6.0 *** (5.6, 6.3) | −10.3 *** (−12.1, −8.4) | −4.9 *** (−6.8, −3.1) | |
ACV, ADV, DELTA, END, INIT, LAT, and MCV: see 'Abbreviations'.*, p < 0.05; **, p < 0.01; ***, p < 0.001.#, regression estimate (95% CI) × 10−4.Model 1: Outcome variable = Intercept + NRS (+ Stimulus intensity in PLR).Model 2: Outcome variable = Model 1 + Sociodemographic factors.Model 3: Outcome variable = Model 2 + random intercept.Model 4: Outcome variable = Model 3 + random slope.
Association between NRS and PLR/HRV parameters
In PLR analysis, we observed significant associations between NRS and INIT, END, MCV, LAT, and ADV (table 4). One unit decrease in NRS was significantly associated with a mean increase of 2.4 × 10⁻² mm in INIT (figures 1(a)) and 2.1 × 10⁻² mm in END (figure 1(b)), mean decrease of 2.8 × 10⁻² mm s−1 in MCV (figure 1(c)) and of 1.3 × 10⁻² mm s−1 in ADV (figure 1(d)), and mean prolongation of 78.6 ×10⁻² ms in LAT (figure 1(e)).
Table 4. Expected change in values of pupillary light reflex parameters for one unit change in pain numeric rating scale.
| Parameter (unit) | INIT (mm) | END (mm) | ACV (mm s−1) | MCV (mm s−1) |
|---|---|---|---|---|
| Regression estimate (95% CI) × 10−2 | ||||
| NRS | −2.4 ** (−4.1, −0.7) | −2.1 ** (−3.4, −0.7) | 1.1 (−0.4, 2.7) | 2.8 * (0.4, 5.3) |
| Parameter (unit) | DELTA (%) | LAT (ms) | ADV (mm s−1) | |
| Regression estimate (95% CI) × 10−2 | ||||
| NRS | 8.2 (−6.2, 22.4) | −78.6 ** (−135.0, −21.0) | 1.3 *** (0.8, 1.8) | |
ACV, ADV, DELTA, END, INIT, LAT, MCV, and NRS: see 'Abbreviations'.*, p < 0.05; **, p < 0.01; ***, p < 0.001.
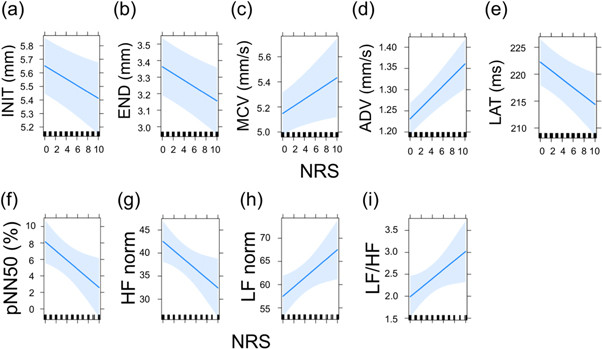
Figure 1. Plots of numeric rating scale influence on parameters showing significant effects. Parameters of pupillary light reflex parameters (a)–(e) and heart rate variability (f)–(i). Graphs show parameter slopes for NRS alteration with bounds of 95% confidence intervals.
Download figure:
Standard image High-resolution image
In HRV analysis, we observed significant associations between NRS and pNN50, HF norm, LF norm, and LF/HF (table 5). Decreased one unit in NRS caused mean increase of 0.56% in pNN50 (figure 1(f)) and of 1 in HF norm (figure 1(g)), while mean decrease of 1 in LF norm (figure 1(h)) and of 0.1 in LF/HF (figure 1(i)).
Table 5. Expected alteration in values of heart rate variability parameters for one unit change in pain numeric rating scale.
| Parameter (unit) | SDNN (ms) | SDNNc (ms) | rMSSD (ms) | rMSSDc (ms) |
|---|---|---|---|---|
| Regression estimate (95% CI) | ||||
| NRS | −0.93 (−1.87, 0.05) | 1.44 (−1.72, 4.69) | −0.55 (−1.38, 0.36) | 5.41 (−1.75, 12.57) |
| Parameter (unit) | pNN50 (%) | HF norm | LF norm | LF/HF |
| Regression estimate (95% CI) | ||||
| NRS | −0.56 * (−1.01, −0.08) | −1.00 * (−1.86, 0.17) | 1.00 * (−0.17, 1.86) | 0.10 * (0.01, 0.20) |
HFnorm, LFnorm, LF/HF, pNN50, rMSSD, rMSSDc, SDNN, and SDNNc: see 'Abbreviations'.*, p < 0.05.
Discussion
We investigated association between NRS and PLR/HRV parameters using LMMs in the pain model of acute disorders of the otolaryngology—head and neck region. In the process of selecting better-fit models, the introduction of sociodemographic factors and random effects had an important role. The better-fit models showed significant association between NRS and nine parameters.
Introduction of random effects in LMMs allows the estimation of variable among and within subjects, which can reduce the possibility of false negatives and positives (Harrison et al 2018). As shown in tables 2 and 3, adding not only sociodemographic factors but also individual variability (random intercepts and slopes) can lessen AIC, resulting in narrower 95% CI. These findings supported the theory that the ability of LMMs to deal with individual variability and the process of selecting the better-fit models are essential to more accurately estimate parameter alteration due to predictor variables (Harrison et al 2018). Therefore, the better-fit models in the current study can provide the more robust conclusions about the association between NRS and PLR/HRV parameters.
Some PLR and HRV parameters have been reviewed as biomarkers of ANS activity (Pfeifer et al 1982, Morley et al 1991, Fotiou et al 2000, Burr 2007, Wang et al 2016, Shaffer and Ginsberg 2017). The parameter roles as biomarkers reflecting ANS activities are summarized in supplementary table 1 is available online at stacks.iop.org/BPEX/6/055003/mmedia. Interpreting these parameters as direct biomarkers reflecting ANS activity is clinically straightforward. However, the interpretations can evoke controversy (Eckberg 1997, Wang et al 2016). For instance, in HRV parameters, SDNN and rMSSD are influenced by hear rate (Monfredi et al 2014), and the range of raw values in HF and LF represents intra-subject and inter-subject variability (Burr 2007). Therefore, in HRV parameters, corrected or normalized values should be applied.
In the PLR, light stimulus causes pupillary diameter constriction, with LAT (phase 1), followed by a fast re-dilation (phase 2), and slow re-dilation to recover INIT (phase 3) (Wang et al 2016). Both of the iris dilator and iris sphincter controls pupil size. The post-ganglionic SNS fibers mediates the iris dilator, while projecting PNS fibers from the ganglion ciliare mediates the iris sphincter, which receives input from the parasympathetic preganglionic neurons in the Edinger–Westphal nucleus of the midbrain (Szabadi 2018). Parameters obtained from phase 1, such as ACV, DELTA, MCV, and LAT, can be used as PNS indicators because light-induced pupil constriction is the consequence of stimulated PNS activity. In the current study, we observed significant effects of stimulus intensities in all parameters. Strengthened stimulus intensity caused an increase in ACV, DELTA, and MCV, with a shortened LAT, and decreased INIT, END and ADV, which was consistent with a previous study of normal adult subjects (Ishikawa 2020). Decreased INIT can be due to the step-up method of stimulus intensity as reported previously (Ishikawa 2020). In parameters obtained from phase 1, the alteration patterns of ACV, DELTA, MCV, and LAT due to strengthened stimulus intensity indicated increased PNS activity. Thus, a range of stimulus intensities is effective for predicting the utility of parameters as indicators of ANS activity.
Altered NRS caused alterations in HRV and PLR parameters, meaning the altered ANS activity due to pain relief. However, the interpretation of alteration of SNS and PNS activity due to pain relief still remains debatable. In HRV parameters reflecting PNS activity, there were no alterations of rMSSD/rMSSDc, while significant alterations of pNN50 and HF norm were observed. These findings might be due to some factors: a lack of acknowledgments regarding parameter roles as biomarkers of ANS activity or different sensitivities to pain relief effects among parameters. In PLR parameters reflecting PNS activity, we observed no alterations of DELTA, while there were significant alterations of MCV and LAT. Increased INIT due to pain relief observed in the current study was unexpected because the pupil dilates in response to pain as described above. One explainable reason is that INIT can be controlled by the balance of SNS and PNS activities. Pain relief might result in predominance of SNS activity because we can assume the decreased PNS activity, as shown in decreased MCV and prolonged LAT. In PLR, only T75 can be used as a direct biomarker of SNS activity in all parameters, although we failed to collect T75. In HRV, LF norm can be used as a biomarker of aggregate modulation of both SNS and PNS. Therefore, the increase of HF norm and the decrease of LF norm due to pain relief might reflect the decrease of SNS activity.
The current study had some limitations. Firstly, we failed to collect over 30% of T75, an SNS indicator in PLR (Morley et al 1991). The modification of the duration setting would enable us to collect T75 data, helping to clarify the effect of pain relief on SNS activities in PLR. Secondly, the model itself has some limitations. Patients visited the hospital after symptomatic onset of disorders, and therefore, the collectability of the data prior to the onset was not feasible. Therefore, it was not possible to assume how pain onset can affect PLR/HRV parameters. Another pain model may be more suitable for assessing the effect of pain onset on ANS activity. Thirdly, we analyzed the data obtained from a small sample size. Therefore, Model 4 including random slope failed to converge in all HRV parameters because models including random slopes tend to fail to converge when sample sizes across groups are unbalanced or include few data (Grueber et al 2011).
In summary, the current longitudinal study illustrated altered ANS activity of PLR and HRV due to pain relief in the clinical pain model. In the study design, LMMs can be a candidate to improve robustness of obtained conclusions as statistical methods. While the interpretation of altered ANS activity due to pain relief still remains debatable, the clinical potential of nine PLR/HRV parameters reflecting pain relief effects needs to be stressed.
Acknowledgments
The author would like to thank Dr Youhei Kumabe, Dr Takeshi Morita, Dr Syuhei Ootsuki, and Dr Hiroatsu Hatsukawa for clinical care to the patients, and Editage (www.editage.com) for English language editing.
Funding
This work was supported by a Shiono Wellness Foundation research grant in 2018.
Conflicts of interest/competing interests
Not applicable.