Response of Submerged Macrophyte Growth, Morphology, Chlorophyll Content and Nutrient Stoichiometry to Increased Flow Velocity and Elevated CO2 and Dissolved Organic Carbon Concentrations
 Rosanne E. Reitsema1*
  Jan-Willem Wolters1
  Stefan Preiner2,3
  Patrick Meire1
  Thomas Hein2,3
  Gudrun De Boeck4
  Ronny Blust4
  Jonas Schoelynck1
- 1Ecosystem Management Research Group, Department of Biology, University of Antwerp, Wilrijk, Belgium
- 2WasserCluster Lunz (WCL), Inter-university Research Institute, Lunz am See, Austria
- 3Institute of Hydrobiology and Aquatic Ecosystem Management, University of Natural Resources and Life Sciences, Vienna, Austria
- 4Systemic Physiological and Ecotoxicological Research, Department of Biology, University of Antwerp, Antwerp, Belgium
It is expected that climate change will cause more frequent extreme events of heavy precipitation and drought, changing hydrological conditions in riverine ecosystems, such as flow velocity, evapotranspiration (drought) or runoff (heavy precipitation). This can lead to an increased input of terrestrial organic matter and elevated levels of dissolved organic carbon (DOC) and CO2 due to degradational processes in water. Consequences for submerged macrophytes, as essential organism group, are still poorly understood. The combined effects of changing flow velocity, DOC and CO2 have not been studied before, so this was tested in a racetrack flume experiment on the macrophyte Berula erecta using a trait-based approach. The plants were exposed to two different flow velocities, two DOC concentrations and two CO2 concentrations in a full factorial design. Apart from individual dose-response tests, two climate change scenarios were tested: a wet scenario simulating heavy precipitation and runoff with high flow velocity, high DOC and CO2 concentrations and a dry scenario simulating evapotranspiration with low flow velocity, high DOC and high CO2 concentrations. Growth rate, biomass, morphology, chlorophyll and nutrient content (C, N, and P) were measured. B. erecta responded strongly to both scenarios. Biomass and the relative growth rate increased and stems were shorter, especially in the wet scenario, and vegetative reproduction (the number of stolons) decreased. In both scenarios, the N content was lower and P content higher than in conditions without climate change. It can be concluded that climate change effects, especially shading by DOC, strongly influence macrophytes: macrophyte abundance will probably be negatively affected by climate change, depending on the macrophyte species and abundance of epiphytic algae. This may have consequences for other components of the aquatic ecosystem.
Introduction
As a result of human-induced climate change, worldwide precipitation patterns are altering. In Europe, for example, the frequency of heavy precipitation events is increasing in winter, whereas there is an increased risk of drought in summer at the same time in some regions (Hoegh-Guldberg et al., 2018). If temperatures increase by 1.5°C, it has been predicted that heavy precipitation intensity (annual maximum 5-day precipitation) increases by at least 5–10% in many parts of Europe, whereas precipitation may decrease by 5–15% in some periods, especially in the Mediterranean area (Jacob et al., 2018). Because precipitation is an important driver of changes in river discharge (Dai et al., 2009), more extremes in discharge can be expected in the future, which can profoundly affect water quality and riverine ecosystems (van Vliet et al., 2013). Aquatic macrophytes play a key role in those ecosystems as they affect nutrient cycling and sedimentation (Clarke, 2002), oxygen dynamics (Uehlinger et al., 2000) and organise stream structure and functioning (Schoelynck et al., 2012b).
Macrophytes can be affected in several ways by changing river discharge. Firstly, aquatic macrophytes are directly affected by changes in river discharge. Dry periods with slow flowing or standing water can lead to warmer water and a lower water level with more eutrophic conditions including high algae growth and relatively more fish, and in some cases more saline conditions; leading to a decline of submerged macrophytes (Short et al., 2016). When discharge and flow velocity are high, macrophytes can break or uproot due to increased pulling forces acting on the plants (Schutten et al., 2005). Hydrodynamic stress caused by increased flow velocity can also affect plant physiology: photosynthesis can decrease by 30–60% (Madsen et al., 1993). Macrophytes can adapt to hydrodynamic stress by changing their morphology. There are two strategies: the first strategy is stress avoidance, which involves becoming more streamlined or smaller, so this affects plant biomass. The second strategy is stress tolerance, which involves increasing resistance to breakage by increasing their cross-sectional area and forming stronger tissue (Puijalon et al., 2011), for example by increasing their silica content (Schoelynck et al., 2012a). Altered plant biomass and nutrient stoichiometry can indirectly affect other organisms that depend on macrophytes.
Secondly, changing precipitation patterns can affect the amount of organic and inorganic carbon in water. From 1990 an increase in dissolved organic carbon (DOC) concentrations in surface waters has been observed, especially in Europe and North America (Monteith et al., 2007), which often leads to an increase in water colour called “brownification” (Kritzberg and Ekström, 2012). This is probably caused by a complex interaction of different factors, but two main mechanisms have been proposed: due to better regulation of sulphate pollution in the atmosphere, atmospheric acid deposition decreased which caused higher soil organic matter solubility (Pagano et al., 2014). The second mechanism is the effects of climate change: with increasing temperature and increased atmospheric carbon dioxide (CO2) concentrations, more terrestrial organic matter is produced and with increased precipitation intensity this material can be flushed into rivers (Pagano et al., 2014). The flux of terrestrial carbon to inland waters is 5.1 Pg C year–1, and this is increasing with 0.3 Pg year–1 (Drake et al., 2018). On the other hand, drought can be a driver of DOC as well: when the water level is lowered, in some cases more aerobic conditions are created which can stimulate the production of DOC (Porcal et al., 2009). Increased DOC concentrations in the water can have several effects on macrophytes. DOC from terrestrial sources like tree leaves often mainly consists of humic substances that give the water a brown colour (Sachse et al., 2005) and may thus be a main driver for brownification. Moreover, it is expected that as a result of climate change more DOC will consist of humic substances in the future (Creed et al., 2018). Humic substances can directly negatively affect macrophytes as they diminish light availability to primary producers (Karlsson et al., 2009; Choudhury et al., 2019) and reduce macrophyte colonisation depth (Chambers and Prepas, 1988). Moreover, some humic substances may directly affect macrophytes by entering the plant’s cells and causing damage by production of reactive oxygen species (Grigutytė et al., 2009) or by interfering with photosynthesis (Pflugmacher et al., 2006). Even though DOC may cause a major threat to macrophytes, research about the magnitude of the problem and the exact effects on macrophytes is still limited (Reitsema et al., 2018).
Upon degradation, DOC can also be a source of CO2 (Sobek et al., 2005). Mainly due to the high quantity of carbon entering from terrestrial soil or wetlands the world average CO2 concentration in rivers and streams is 3100 ppm (Raymond et al., 2013), which is substantially higher than the concentration of 400 ppm in the atmosphere. Despite the fact that riverine CO2 concentrations are relatively high, a further rise is expected in the future (Sobek et al., 2005; Phillips et al., 2015). DOC degradation is one of the mechanisms behind this, together with a reduced CO2 efflux from the water as a result of higher atmospheric CO2 concentrations, caused by a rise in CO2 emissions (Phillips et al., 2015). It is difficult to predict future CO2 levels in freshwater ecosystems because the exact factors controlling aquatic CO2 concentrations and their response to climate change are not yet well understood. Moreover, current CO2 and total inorganic carbon levels in rivers are highly variable and can depend on the catchment (Iversen et al., 2019), and location within the river (Maberly et al., 2015). As a consequence, it is hard to predict future CO2 levels and how freshwater organisms will respond (Hasler et al., 2016). Research on the effects of CO2 mainly focusses on marine ecosystems, where the resulting ocean acidification is relatively well studied (Boyd et al., 2016). Studies looking at the effects of elevated CO2 concentrations on freshwater macrophytes observed increased plant growth rates under high CO2 concentrations (Eusebio Malheiro et al., 2013; Dülger et al., 2017; Lv et al., 2019), increased biomass production (Hussner et al., 2016), and an increase in root:shoot ratio (Madsen et al., 1996; Hussner et al., 2016; Dülger et al., 2017). Moreover, the nitrogen (N) content of macrophyte tissue was found to be lower (Dülger et al., 2017; Hussner et al., 2019), the phosphorus (P) content was higher (Yan et al., 2006), chlorophyll content was lower (Madsen et al., 1996; Dülger et al., 2017), their dry matter content higher (Eusebio Malheiro et al., 2013) and specific leaf area (SLA) lower (Madsen et al., 1996).
Although the separate effects of varying flow velocity, increased DOC and increased CO2 concentration have been studied before, their combined effects have not. However, macrophytes will probably be affected by a combination of different climate change effects. Often, complex ecological drivers like climate change are simplified in experiments (Knapp et al., 2018), so by testing the interactions between three factors a more realistic situation can be approached. This is important because contrasting results may be expected for the different factors that are tested. Macrophytes exposed to high DOC concentrations may remain smaller (Szmeja and Bociąg, 2004), whereas macrophytes exposed to high CO2 concentrations may produce more biomass (Hussner et al., 2016) and show more clonal growth (Yan et al., 2006). Larger plants may be more vulnerable when flow velocity increases (Puijalon et al., 2011). Studying multiple aspects of climate change may result in more accurate predictions about how macrophytes may respond to climate change.
This study aims to test how macrophytes respond to flow velocity, DOC, CO2 and their interactions. Besides individual dose-response tests, the effects of two climate change scenarios were tested: a wet scenario with high flow velocity, high DOC and high CO2 concentrations, and a dry scenario with low flow velocity, high DOC and high CO2 concentrations. A trait-based approach was used with analysis of growth rate, morphology, biomass allocation, chlorophyll production and C, N and P content of the plant. We hypothesised that in both scenarios plants would produce more biomass, especially more reproductive biomass like stolons, and that they would have a lower N and chlorophyll content and higher P content due to the increased CO2 concentration. In contrast, we hypothesised that DOC would partially counteract the effect of elevated CO2 due to shading, resulting in decreased plant growth. We also hypothesised that the stems would be shorter and thicker in the wet scenario as an adaptation to hydrodynamic stress. Lastly, we hypothesised that there would be interaction effects between flow velocity, DOC and CO2 concentrations, due to the contrasting effects they can have as described in earlier paragraphs.
Materials and Methods
Plant Material
In this experiment Berula erecta (Hudson) Coville (Apiaceae) was chosen as model species, since it is a sub-cosmopolitan species that can grow in many different lotic and lentic freshwater habitats (de Belair and Lansdown, 2013), and it is not a floating species, which makes it relatively vulnerable to the effects of climate change (Short et al., 2016). B. erecta is a homophyllous amphibious species, but at the sampling location it grew only submerged. Although many macrophyte species can take up two forms of inorganic carbon [bicarbonate (HCO3–) and CO2], B. erecta can only take up CO2 (Sand-Jensen et al., 1992), so we expected that this species would respond strongly to changes in CO2 availability. Young plants were collected in the Fischa River in Austria close to the village of Pottendorf (47.91° N, 16.39° E). Plants of similar size were selected with initial dry mass of 0.11 ± 0.06 g. This was determined on 12 representative individuals that were not used in the experiment: from those 12 plants fresh and dry weight was measured and the conversion factor between fresh and dry weight was used to estimate dry weight of the experimental plants, based on their fresh weight. 384 plants (48 pseudo replicates per treatment) were each placed in 9 × 9 × 10 cm square pots filled with 0–2 mm grain size cleaned river sand (commercially bought: Cobo gardens, Niel, Belgium) and with a layer of gravel on top to prevent erosion of the sand.
Experimental Design
The experiment was carried out in a greenhouse at the University of Antwerp (Belgium), where the plants were exposed to the natural day/night cycle. Plants were divided over four 400 × 120 cm racetrack flumes, in a 155 × 36 cm test section with a water height of 44 cm. Tap water was used [initial nutrient concentrations: 0.002 mg L–1 phosphorus (PO43–-P), 0.03 mg L–1 ammonium (NH4+-N), 0.002 mg L–1 nitrite (NO2–-N), and 2.308 mg L–1 nitrate (NO3–-N)] and temperature was kept constant at 18°C. After 19 days of acclimatisation the plants in two flumes were exposed to higher flow velocity (0.4 m s–1) and the other two flumes to low flow velocity (0.04 m s–1), measured with a Valeport 801 ElectroMagnetic Flowmeter at 5, 10, 15, and 20 cm above the sediments in the middle of the flume, at 10 cm left from the middle and at 10 cm right from the middle, afterward the average was calculated. Moreover, CO2 gas from a commercial bottle was added to two flumes with an airstone at approximately 2 L h–1 (gas pressure 2 bar). Gas flux was regulated with a Skalar GT1355 Sho-Rate G flowmeter. This resulted in four different treatments: high CO2 (1000 ppm) with high flow velocity (HC-HF), high CO2 with low flow velocity (HC-LF), low CO2 (400 ppm) with high flow velocity (LC-HF), and low CO2 with low flow velocity (LC-LF). The experiment was done between May 19, 2017 and July 24, 2017 without any added DOC (low DOC or LD treatment) and the experiment was repeated the year after between May 24, 2018 and July 31, 2018, this time DOC was added to all treatments (high DOC or HD treatment), see Figure 1 for experimental setup. Solar radiation on the roof of the greenhouse was measured and in 2017 the total amount of radiation received during the experiment was 4.32 MW m–2 (224 W m–2 d–1) and in 2018 this was 4.65 MW m–2 (237 W m–2 d–1).
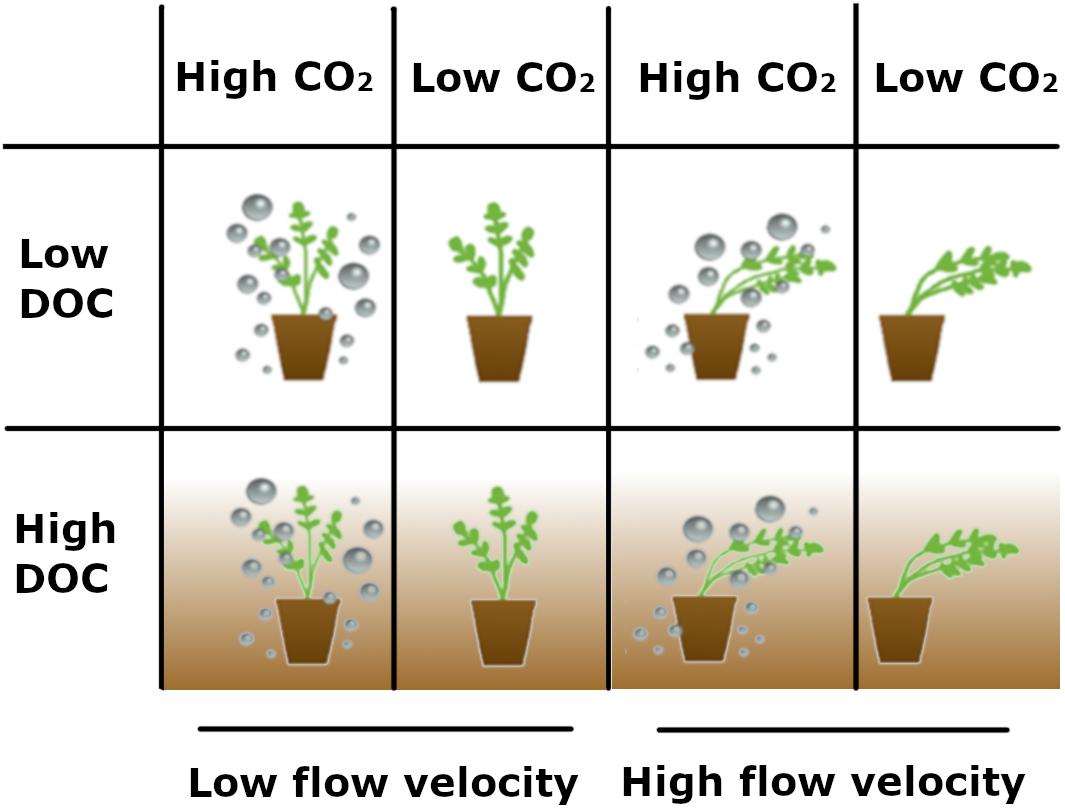
Figure 1. Schematic overview of the experimental setup. The experiment was carried out in four flumes with each their own combination of treatments: high CO2 × low flow velocity, low CO2 × low flow velocity, high CO2 × high flow velocity, and low CO2 × high flow velocity. This experiment was then repeated with the same treatments, but this time DOC was added to all flumes.
DOC
In this study it was decided to use leaf and peat leachate as DOC source. In some other studies artificial humic acid is used, but when we tested this material it did not dissolve well and only resulted in low DOC values that did not correlate with the amount of artificial humic acid added to the water. DOC was created in two tanks of approximately 2000 litres of water. To each tank, four 100 L bags of leaf litter (a mix of Fagus sylvatica L. and Quercus robur L.) and 30 L of peat (commercially bought: Aveve) was added. This was done on the 25th of May (the second day of the experiment). The tanks were covered with cloth to prevent photodegradation of the DOC. On day 21, 30, and 54 of the experiment, approximately 200 L of DOC-water was added to each flume after being filtered through muslin cloth, in order to establish a DOC concentration of 5 mg C L–1. In total, eight different treatments were tested (one flume per treatment), with the LD-LC-LF treatment as “no climate change scenario,” and the HD-HC-HF and HD-HC-LF treatments as two climate change scenarios; in both scenarios increased CO2 and increased DOC were tested, with heavy precipitation and drought being simulated in the HF and LF scenario, respectively. The other five treatments help in understanding the relative contribution of the three tested aspects of climate change to the response of the macrophytes.
Water Quality Measurements
The concentration of CO2 in the water was measured continuously with a Pro-Oceanus Digital Mini CO2 probe which alternated between the flumes. In addition, pH was measured weekly on approximately the same time of the day (early afternoon) (multiline F/set-3 multimeter) Alkalinity was measured four times during the experiment (SAN++, Skalar, Breda, Netherlands). Nutrient concentrations in the water were measured on day 6, 20, 50, and 67 of experiment 1 and on day 12, 26, 40, 54, and 68 of experiment 2; water samples were filtered with 0.45 μm filters (Chromafil® Xtra MV-45/25, Macherey-Nagel, Düren, Germany) and the concentration of PO43–-P, NH4+-N, NO2–-N, NO3–-N was measured (SAN++, Skalar, Breda, Netherlands). The concentration of DOC was measured on day 6 (first experiment) and day 6, 12, 22, 26, 33, 40, 47, 54, 61, and 68 (second experiment). In order to measure DOC quality a sample from the DOC stock (see earlier paragraph) was filtered with a 0.45 μm filter and subsequently the sample was characterised by LC-OCD (liquid chromatography – organic carbon detection) (Huber et al., 2011). With this technique different size class fractions can be determined: biopolymers (large molecules like polysaccharides and proteins), humic substances (humic and fulvic acids), building blocks (oxidation products of humics) and low molecular weight neutrals and acids.
The effect of DOC on photosynthetically active radiation (PAR) availability was measured as well. On two clouded days, plastic transparent 5 L buckets (diameter 19 cm, height 20 cm) were filled with water from each flume and another bucket was filled with tap water in order to be able to compare to a control. A light sensor (MQ-210 Apogee underwater quantum PAR meter) was mounted to a frame to keep the sensor in the same position in all buckets. The frame was put in the middle of each bucket and the amount of PAR was measured. PAR availability was measured in buckets to avoid effects of shading from the macrophytes, the lid of the flume and the roof of the greenhouse. Additionally, a light profile was made in each flume in the middle of the test section by measuring PAR at every 5 cm, starting at the bottom.
Plant Growth and Morphology Measurements
Before planting on day 1, the total fresh mass (roots and shoots together) was determined for each individual. On day 1, 28, 46, and 67 (experiment 1) and day 1, 30, 47, and 68 (experiment 2) all plants were measured: number of stems and leaves, length and stem diameter of the longest stem, number of stolons (if visible) and the number of stems and leaves on the new ramets were counted (all are non-disturbing measurements). After harvesting the plants, stems, leaves and roots were separated and weighed fresh, and after drying the plant material for 48 h at 70°C the dry mass was determined. Before drying the samples, a subsample of 10 randomly chosen plants from each treatment was selected. The leaves of those plants were separated from the stems and photographed on a white background, after which the surface area of the leaves was calculated using the image processing programme ImageJ.
During the experiment periphytic algae started growing and covered the inner walls of the flumes and parts of the macrophytes. The algae were removed from the macrophytes twice by carefully taking them off the leaves by hand (see Supplementary Figure S1), but often started growing again within a few days. The amount of algae growing in the flumes was not quantified, but on pictures that have been taken it can be seen that in the treatment with high DOC there appear to be more algae growing in the flumes than in the treatment with low DOC (Supplementary Figure S1). The dissolved CO2 pattern in the water also suggests that there were more algae in the high DOC treatment, as the day-night fluctuations were more pronounced than in the low DOC treatment (Supplementary Figure S2), despite a lower plant biomass.
Chlorophyll Analysis
From the subset of 10 plants per treatment used for the leaf surface area calculations, approximately 150 mg of fresh leaf material was ground with 80% acetone and quartz sand. The sample was centrifuged once at 4000 rpm and twice at 3000 rpm, after which the chlorophyll content (a, b, total and carotenoids) was determined spectrophotometrically. The samples were kept in the dark on ice during the extraction. The absorbance of the samples was measured at four different wavelengths (710, 663.2, 646.8, and 470 nm) which were used to calculate chlorophyll according to the following formulas (Ax = absorbance at specific wavelength):
The rest of the subsample plant material was dried in the same way as the other material and the dry weight was determined. Beside chlorophyll concentration, total chlorophyll content per plant was calculated by multiplying the total chlorophyll concentration with the total fresh weight of the leaves of each plant (as chlorophyll was measured in fresh biomass).
Plant Carbon, Nitrogen and Phosphorus Analysis
The dried plant material (leaves and stems separately) from each flume was combined into five samples (nine plants per sample), in order to have enough material for the analyses. Those combined samples were ground with an Ultra Centrifugal Mill ZM 200 (Retsch, Germany). The ground material was analysed for C and N content on a FLASH 2000 Organic Elemental Analyser, based on Flash Dynamic Combustion (Thermo Fisher Scientific, Waltham, MA, United States). P content was determined by acid digestion and subsequently measured on ICP-OES (iCAP 6300 Duo view, Thermo Fisher, Waltham, MA, United States).
Statistical Analyses
All statistical analyses were carried out in R statistics version 3.4.3. The effects of elevated CO2, DOC and flow velocity on growth and morphology parameters, chlorophyll, C, N and P content (35 traits in total, Tables 1, 2) were tested with a three-way ANOVA with type III sums of squares. Normal distribution of the residuals was tested with Shapiro–Wilk tests and checked visually with Q-Q plots, homogeneity was tested with Levene’s tests, and if necessary, data were transformed to meet the assumptions. When significant, a Tukey HSD post hoc test was performed. Variables with count data (number of stems and number of stolons) were analysed with poisson regression and variables with a severe positive skew (average and total stolon length and leaf, stem and root dry matter content) were analysed with gamma regression. In order to test the relative importance of the treatments and their interactions omega squared (ω2) was calculated, which shows the proportion of the variance that is explained by every treatment and interaction. Negative values were set to zero as it can be assumed that those values signify that the effect was negligible (Graham and Edwards, 2001). R package “sjstats” (Lüdecke, 2019) was used to calculate ω2 values and the values were visualised with Venn diagrams. To test how the plants responded to the treatment over time a Principal Response Curve (PRC) was used, which is a special case of the Redundancy Analysis (RDA) and was developed by Van den Brink and Ter Braak (1999). This was done using the “vegan” (Oksanen et al., 2019) package in R. In a PRC plot the effect of the different treatments is shown over time, relative to a control treatment that has been assigned before the analyses. The control treatment that was chosen is the “no climate change” scenario, with low CO2, low DOC and low flow velocity.
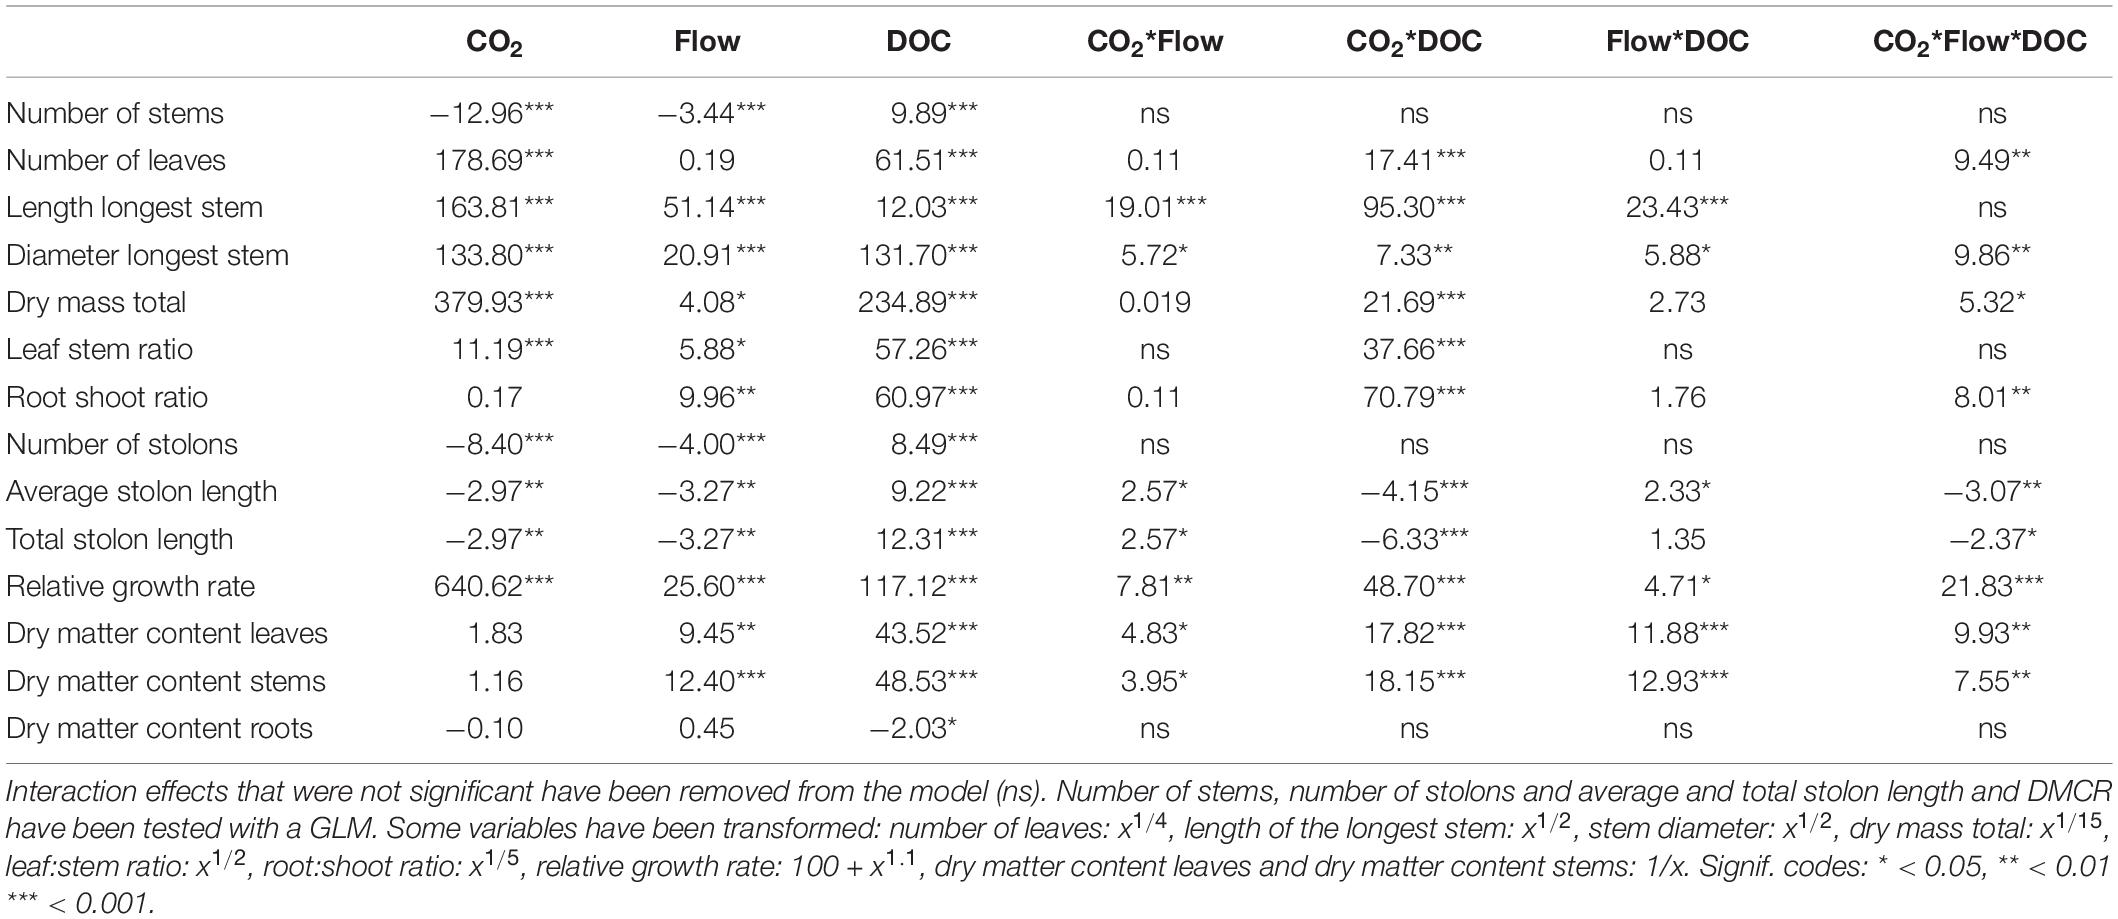
Table 1. F-values of the three-way ANOVA tests and z values of the generalised linear models of growth and morphological parameters (n = 48).
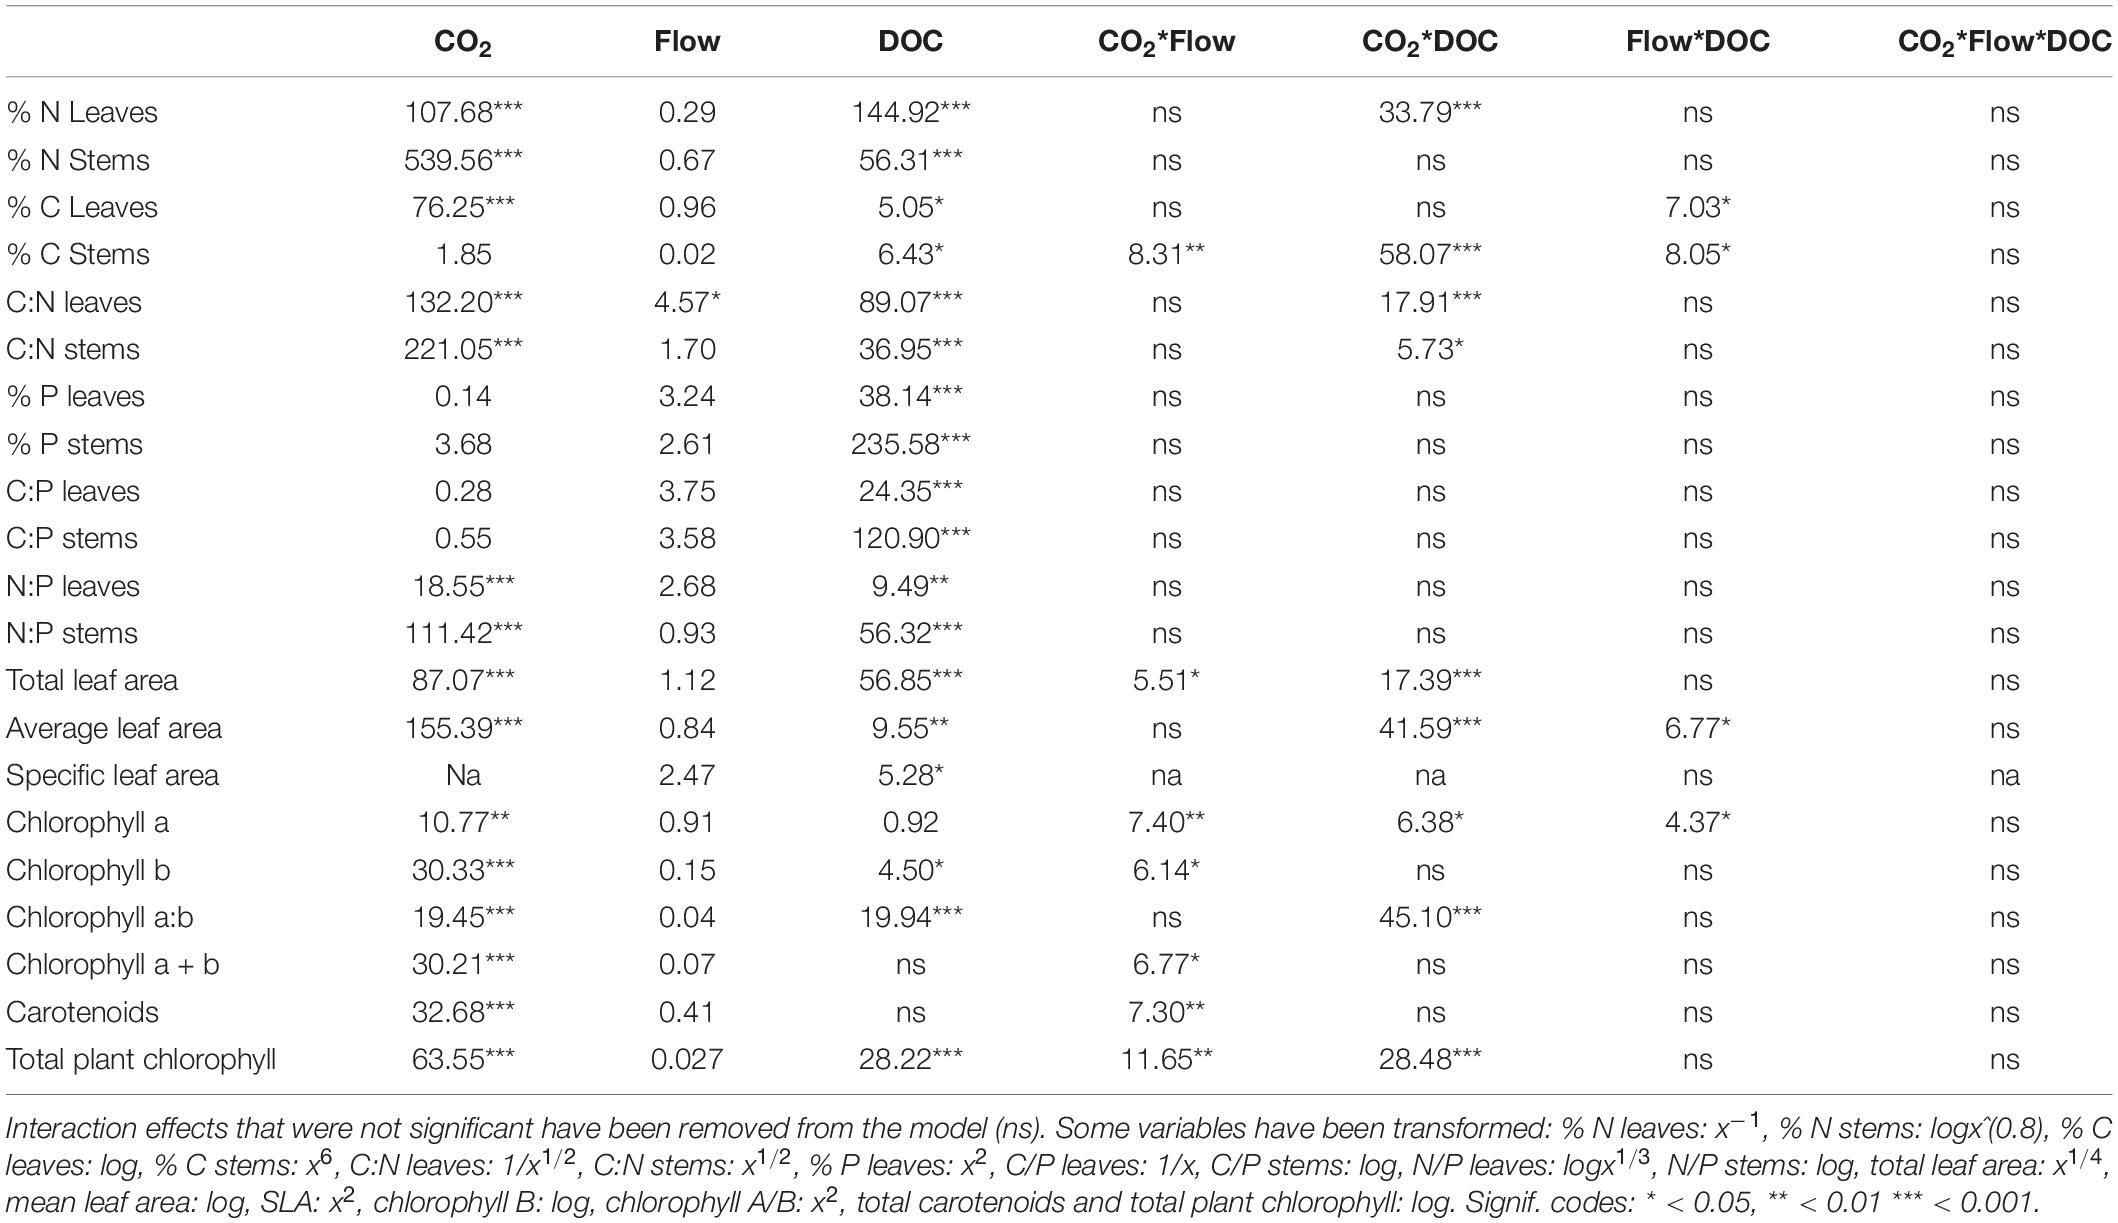
Table 2. F-values of the three-way ANOVA tests of morphological parameters, chlorophyll and nutrient stoichiometry parameters (n = 5–10).
Results
CO2 and DOC Concentrations
The average CO2 concentration in the HC-LD and HC-HD treatments was 1494 ppm ± 299 (62 ± 12 μM) and 1086 ppm ± 948 (45 ± 39 μM), respectively. In the LC-LD treatment it was 449 ppm ± 51 (19 ± 2 μM) and in the LC-HD treatment 183 ± 153 (8 ± 6 μM). The concentrations followed a day-night rhythm with the most pronounced fluctuations in the high DOC treatment (Supplementary Figure S2). The DOC added to the flumes had the following consistence: 72.6% humic substances, 11.64% neutrals with small molecular weight, 7.1% building blocks, 7.0% biopolymers and <5.5% acids with small molecular weight. The DOC concentration in the first experiment was very low (1.4 ± 0.3 mg L–1), whereas in the second experiment, where DOC was added regularly, it reached a reasonably constant value of 5.9 ± 0.8 mg L–1 (Supplementary Figure S3A). In the stock solution of DOC the amount of nutrients was relatively high, especially phosphate and ammonium. In a DOC solution of 5 mg C L–1 there was 0.29 mg L–1 phosphate (PO43–-P) and 0.87 mg L–1 ammonium (NH4+-N). However, in the flumes the measured concentrations were far lower (Supplementary Figure S4), suggesting that nutrients were consumed rapidly.
Light availability was lower in the second experiment compared to the first; this ranged (average for all flumes) from 437.5 ± 28.5 μmol m–2 s–1 just below the water surface to 163 ± 22.7 μmol m–2 s–1 at the bottom of the flumes (Supplementary Figure S3B). PAR availability decreased with 23.8% in water with increased DOC concentrations (measured in a 20 cm deep bucket, see section “Materials and Methods”). For more details on water quality (pH, alkalinity and nutrients) see Supplementary Information “detailed results and discussion” and Supplementary Figure S4.
Effects of the Treatments and Interactions
Flow velocity, CO2 and DOC all affected B. erecta. Out of the 35 traits measured, in 32 of them there was a significant effect of DOC, in 25 of them there was a significant effect of CO2, in 13 traits a significant effect of flow, in 20 a significant effect of the CO2∗DOC interaction, in 14 a significant effect of the CO2∗flow interaction, in nine a significant effect of the flow∗DOC interaction and in nine traits a three-way interaction (Tables 1, 2). When looking at the relative importance of the treatments (omega squared values), in most cases DOC and CO2 had the greatest effect, relative to the other treatments, followed by the CO2∗DOC treatment. Flow velocity and the other interactions had lower omega squared values in most traits (Tables 3, 4).
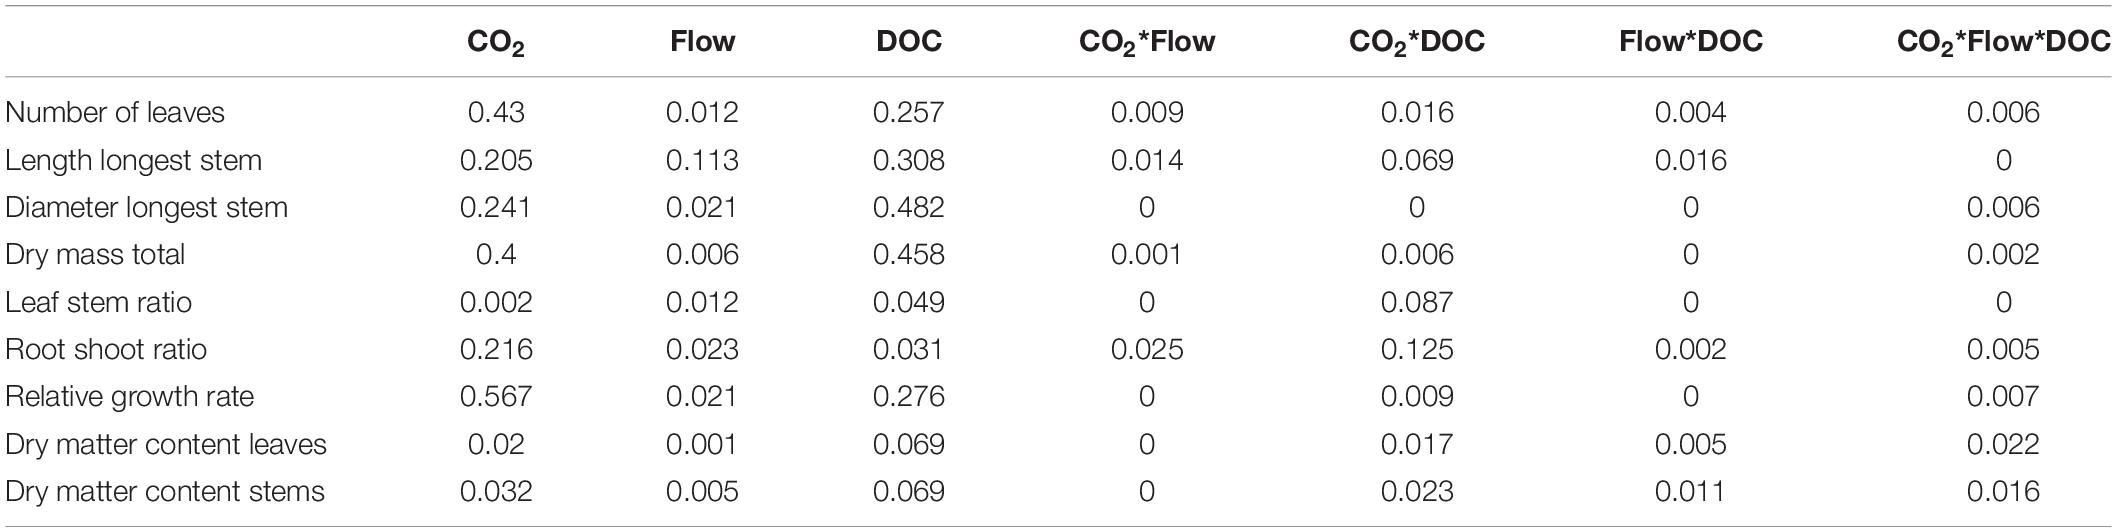
Table 3. Omega squared values for the growth and morphological parameters (n = 48).
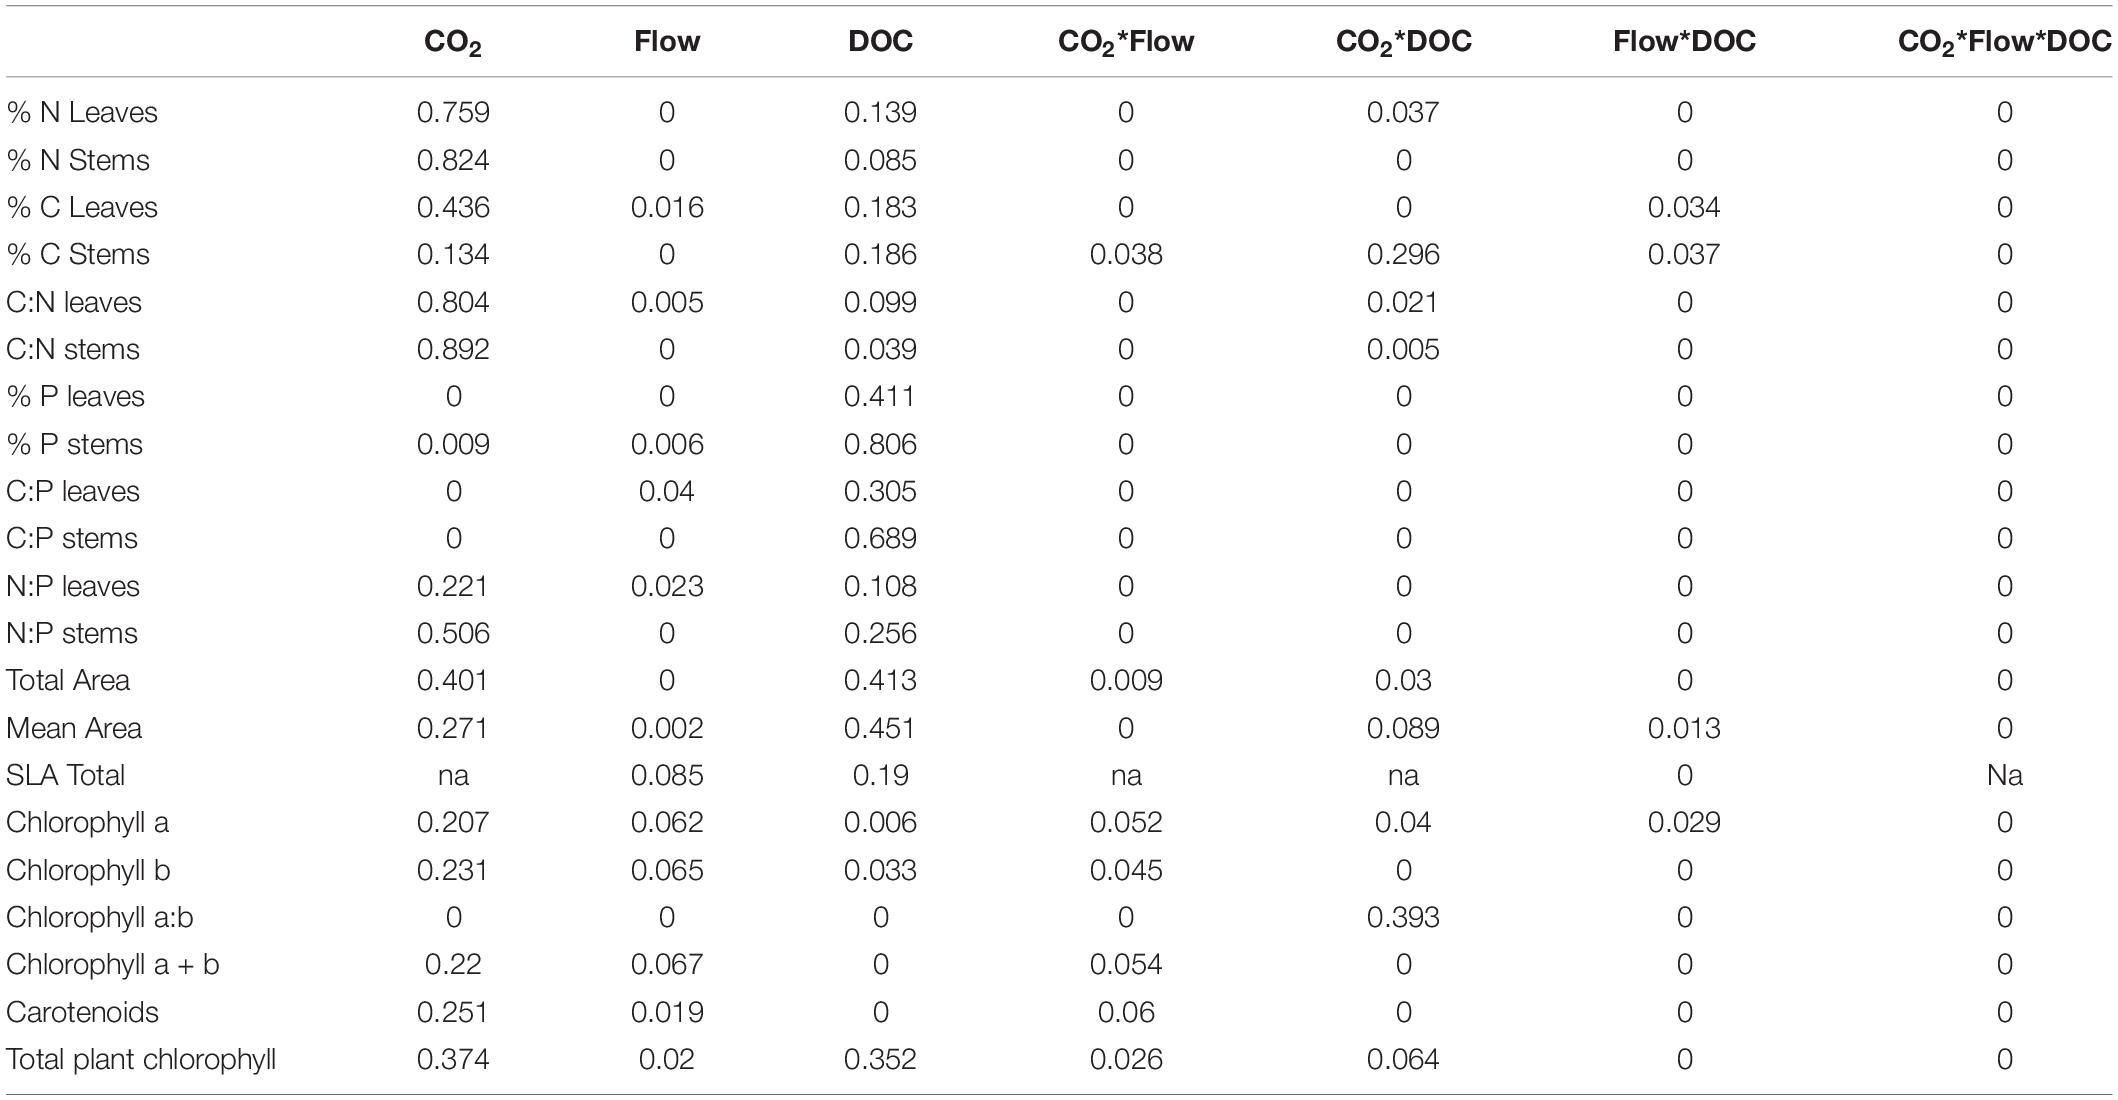
Table 4. Omega squared values for the morphological parameters, chlorophyll and nutrient stoichiometry parameters (n = 5–10).
Macrophyte Growth and Morphology
In the following paragraphs the main results will be highlighted, for a more detailed overview of the results, see Supplementary Information “detailed results and discussion”. CO2 and DOC had a pronounced effect on the relative growth rate (RGR) (Table 3) which was significantly higher in plants exposed to HC compared to LC and higher in LD compared to HD (Figures 2A, 3A). Flow velocity had a smaller effect: plants growing under low flow velocity (LF) had a lower RGR than plants growing under high flow velocity (HF), but this was only significant in the LC-LD and HC-HD treatment (Tables 1, 2). In nearly all LC and HD treatments the average RGR was negative. Biomass allocation was also affected by the treatments: the root:shoot ratio was mainly affected by CO2, and to a smaller extent by the CO2∗DOC interaction (Table 3 and Figure 2B). This can be seen in the LD treatment, where there is a positive effect of CO2 on root:shoot ratio, whereas there is no CO2 effect in the HD treatment. Moreover, the high flow, high CO2 and low DOC treatments resulted in more and longer stolons (Figure 2C). In most morphological traits a positive effect of CO2 and a negative effect of DOC was observed. This was most pronounced in the number of leaves (Figure 2D and Table 3). The number of stems, stem length, stem diameter (Figure 2E), total and average leaf area and total dry mass were also significantly more numerous or larger in HC and LD than in LC and HD conditions, SLA was also higher in the HD than the LD treatment.
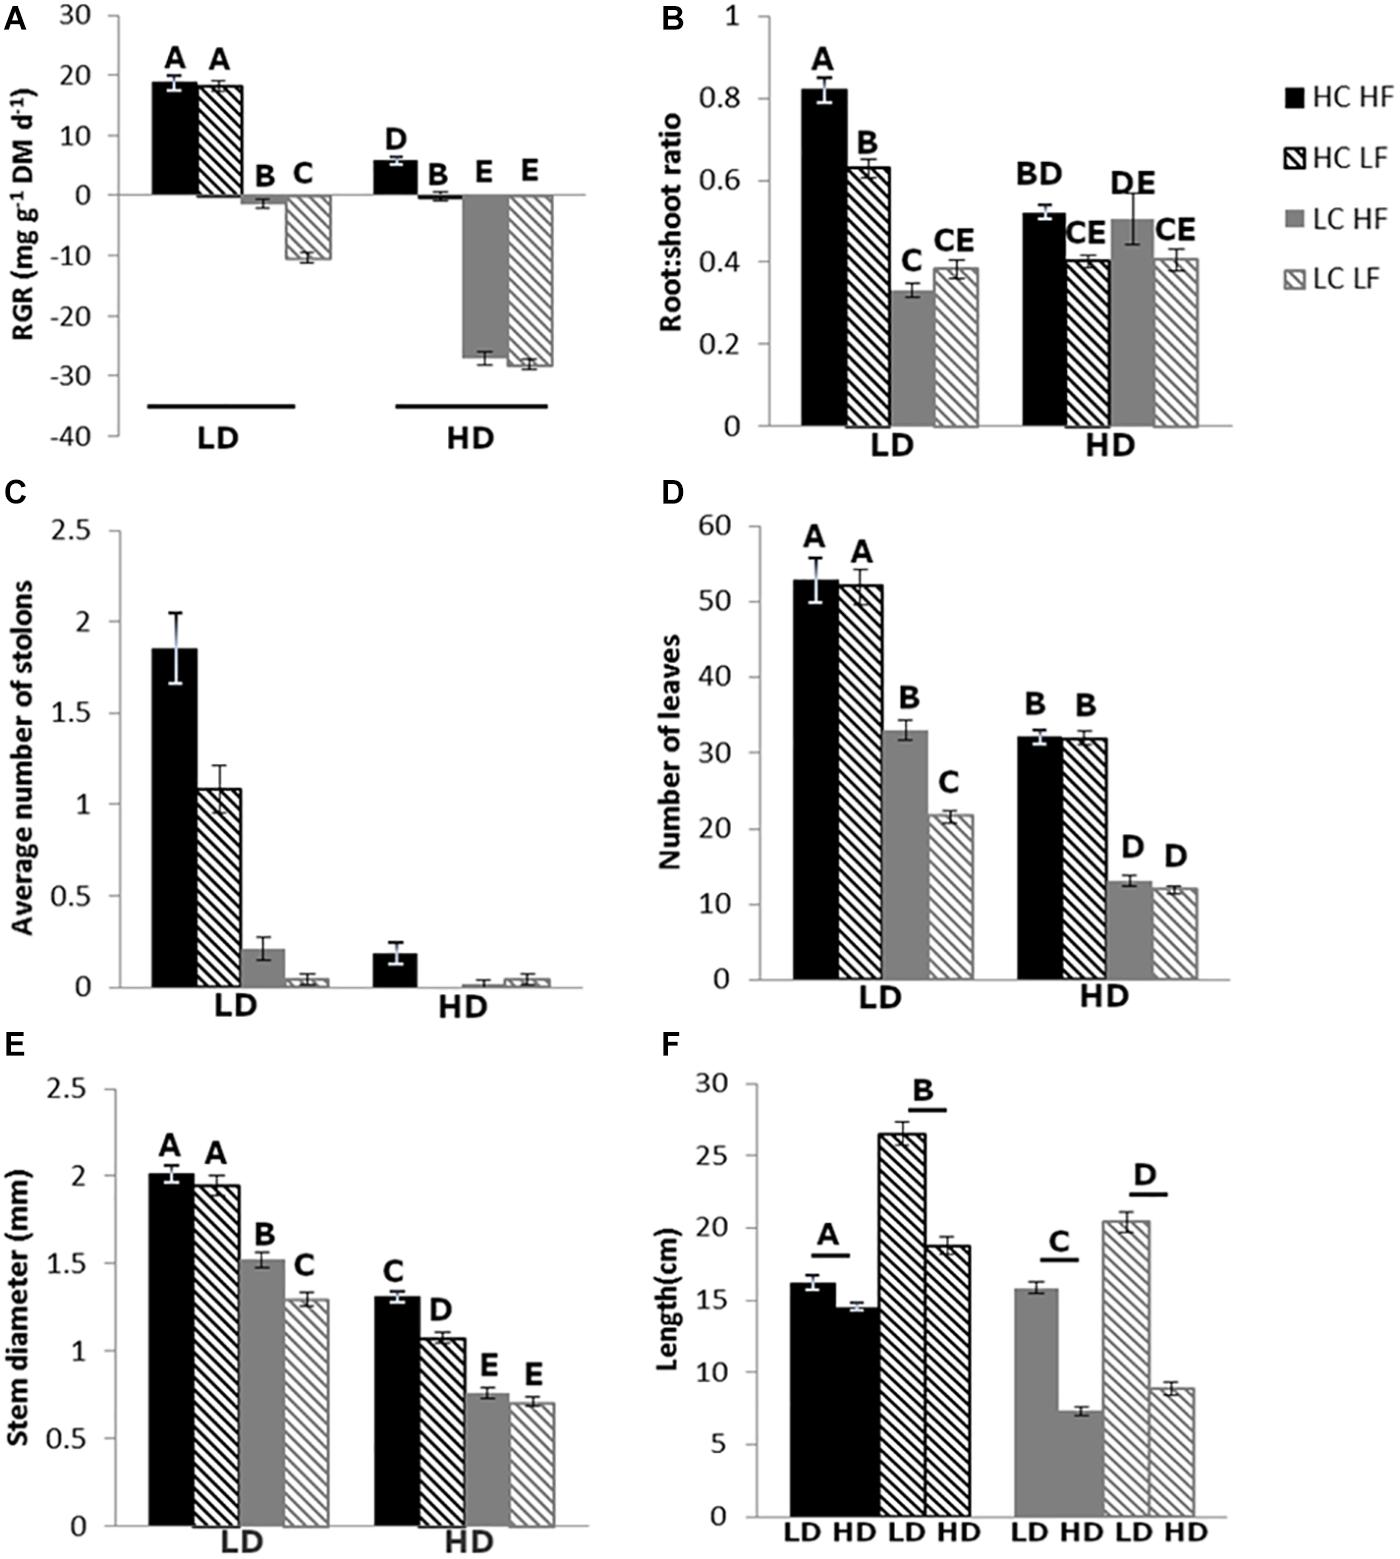
Figure 2. Relative growth rate (A), root:shoot ratio (B), number of stolons (C), number of leaves (D), stem diameter (E), and length of the longest stem (F). The letters above the graph indicate significant differences (p < 0.05, n = 48), tested with three-way ANOVA. In panels (A,B,D,E) three-way interactions are shown, in panel (C) there were no interactions, just main effects of flow velocity, carbon and DOC, and in panel (F) a CO2*Flow interaction.
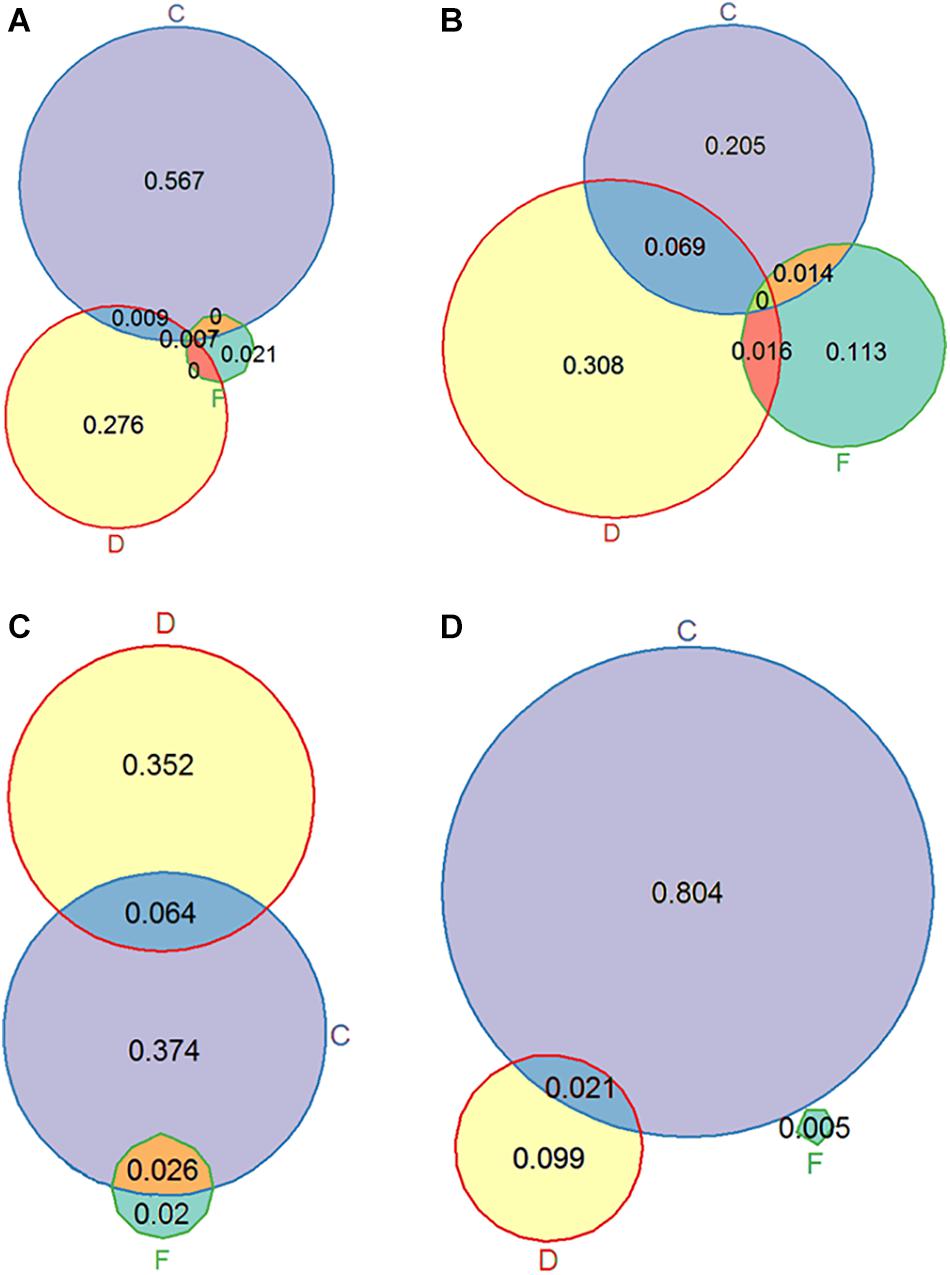
Figure 3. Venn diagrams showing omega squared values representing the proportion of variance explained by CO2 (C), flow (F), DOC (D) and their interactions for the variables relative growth rate (A), length of the longest stem (B), total plant chlorophyll (C) and leaf C:N ratio (D).
Flow velocity had a smaller effect on plant morphology: plants exposed to HF had more leaves and more and thicker stems than plants growing under LF, but this was only significant in the LC-LD treatment (Figures 2D,E). In the LD treatment, leaves exposed to HF were smaller than leaves exposed to LF. However, in the HD treatment there was no effect of flow velocity (Figure 4A). The clearest effect of flow velocity was observed in the stem length, with the longest stems in the LF treatment (Figures 2F, 3B).
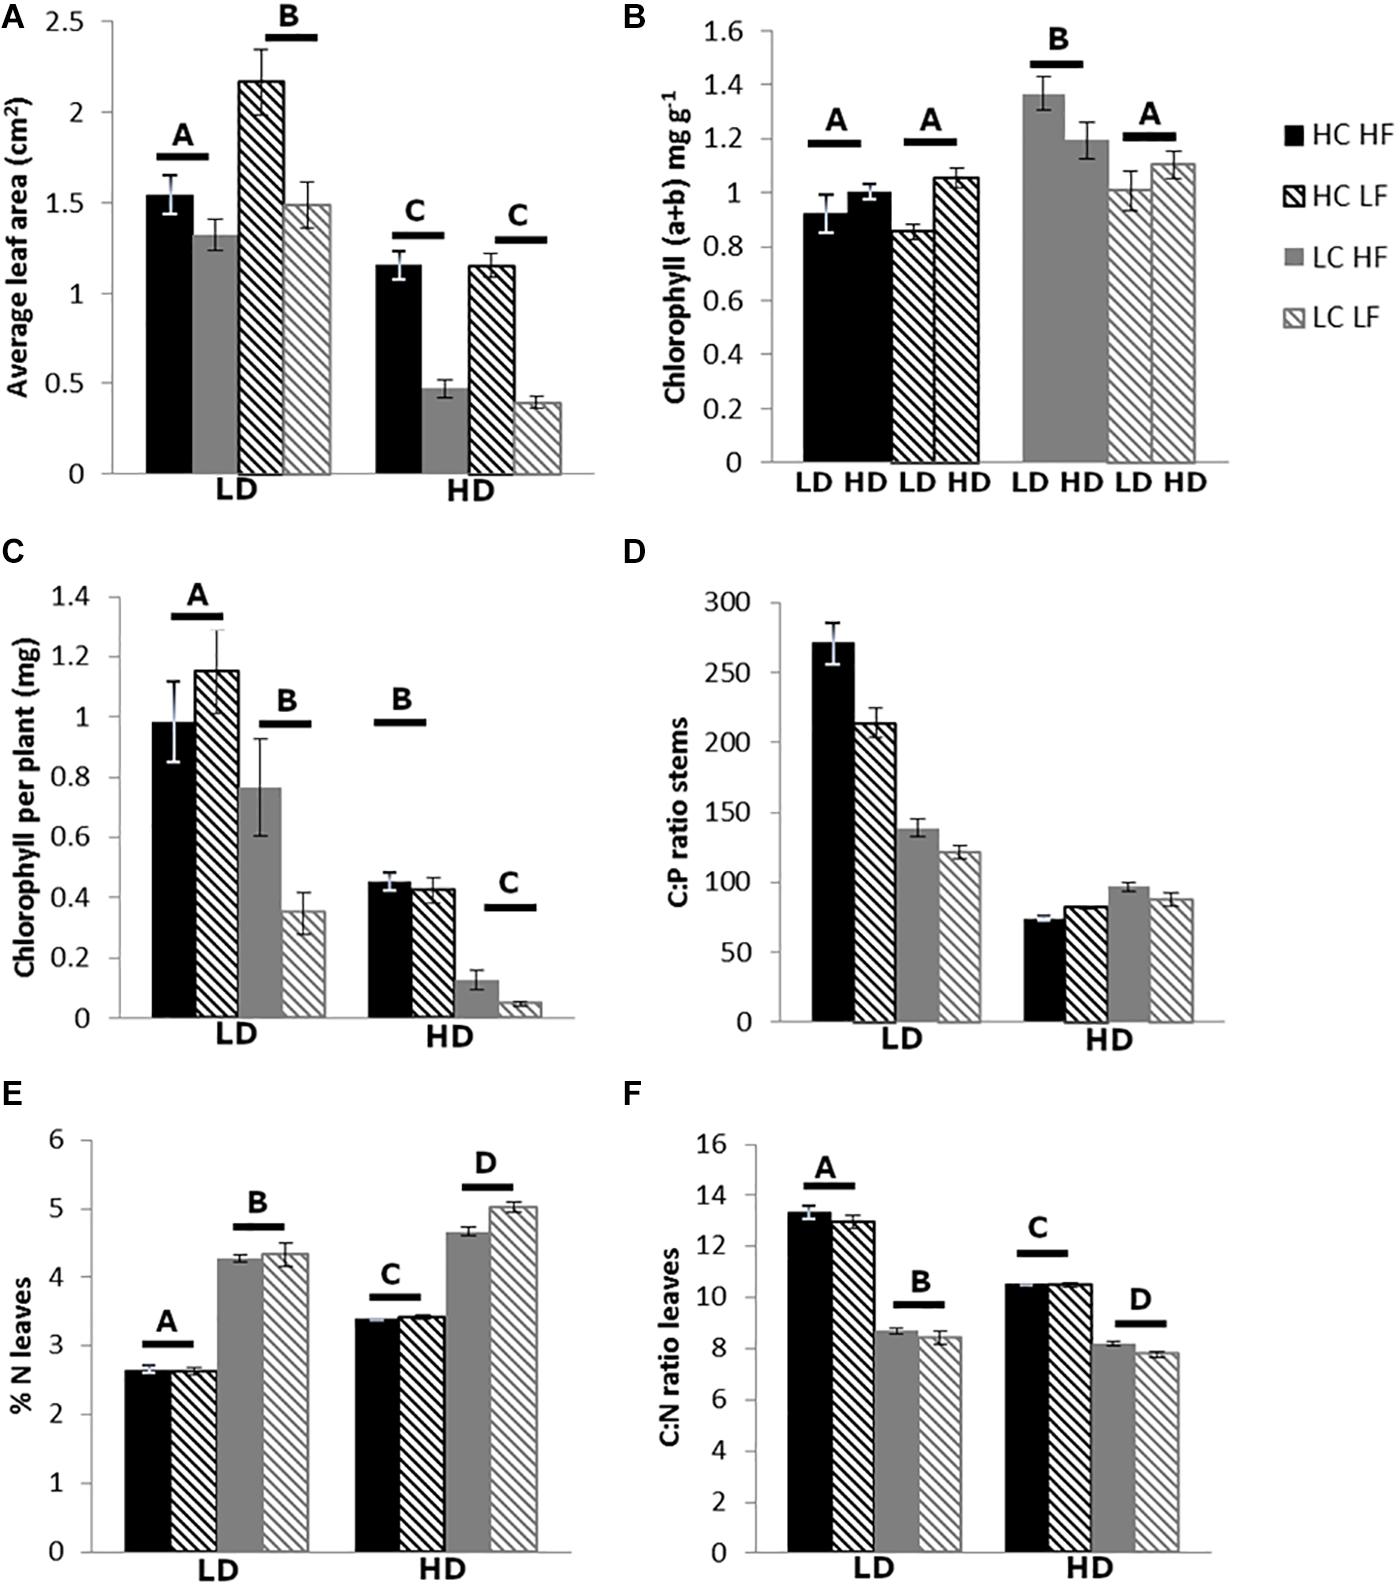
Figure 4. Average leaf area (A), total chlorophyll concentration (B), total amount of chlorophyll per plant (C), C:P ratio of the stems (D), % N in the leaves (E), and C:N ratio of the leaves (F). The letters above the graph indicate significant differences (p < 0.05, n = 5–10), tested with three-way ANOVA. In panels (A,C,E,F), CO2*DOC interactions are shown, in panel (B) a CO2*flow interaction and in panel (D) there were no interactions.
Chlorophyll and Nutrient Stoichiometry
For chlorophyll a, chlorophyll b and total chlorophyll (a + b) concentration (mg g–1 FM) similar results were observed. Plants growing in the LC-HF treatment had a higher chlorophyll concentration than plants growing in other treatments (Figure 4B). When looking at the total chlorophyll content per plant, a different pattern was observed: plants exposed to HC appeared to have more chlorophyll than plants exposed to LC, and in the LD treatment they had more chlorophyll than in the HD treatment (Figures 3C, 4C), as the plants in the HC-LD treatment had more biomass. The chlorophyll a: chlorophyll b ratio was higher in the LC than the HC treatment when plants were exposed to LD, but this was the other way around when plants were exposed to HD.
The DOC treatment affected every component of nutrient stoichiometry: in the high DOC treatment plants had higher N, C, and P concentrations than in the low DOC treatment; for P the differences were most pronounced, leading to lower C:P and N:P ratios in the HD treatment (Figure 4D and Table 2). The CO2 treatment mainly affected plant N concentrations, which were lower in the HC than the LC treatment, resulting in higher C:N ratios in both leaves and stems (Table 4 and Figures 3D, 4E,F), especially in the LD treatment.
Differences Over Time
For eight plant traits that have been measured four times during the experiment a PRC diagram was made (Figure 5) to show how the traits developed over time. This was done for: number of leaves and stems (total, on the main plants and on the newly formed ramets at the end of the stolons), the number of stolons and the length of the longest stem. 30% of the treatment variance could be explained by the model (F = 82.264, p = 0.001). All plant traits had positive weights, indicating a positive relationship with the treatments in the diagram. This means that, especially toward the end of the experiment, all plant traits (especially the number of leaves) were favoured by most treatments except for the LC-LF-HD and LC-HF-HD treatments. The differences between the treatments become more pronounced toward the end of the experiment. While CO2 and DOC had a relatively large effect, the effect of flow velocity was limited for the traits measured in this analysis.
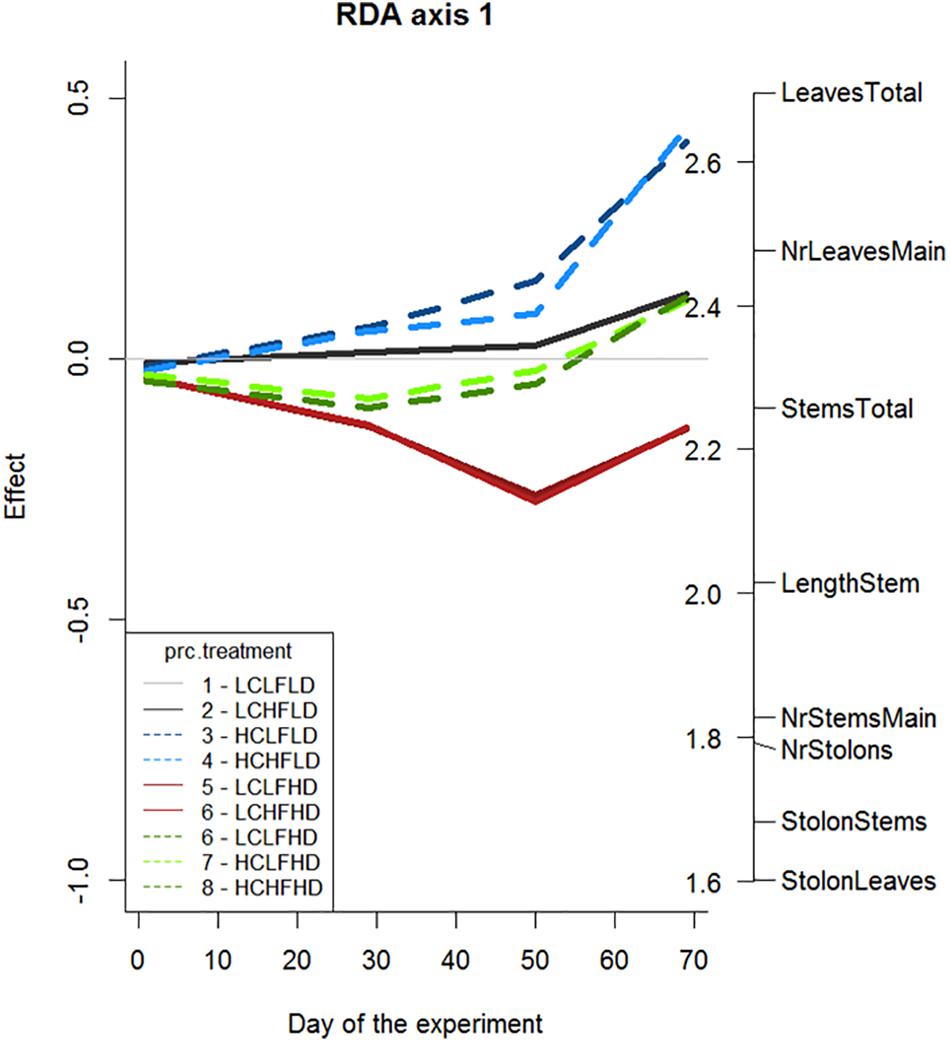
Figure 5. Principal response curve (PCR) with the effects of the treatments on eight plant traits. On the right vertical axis the response variables are shown (number of stems and leaves on the main plant, stems and leaves that grew on the new ramets on the stolons, total number of stems and leaves, number of stolons and length of the longest stem) and their relative contribution to the observed pattern. The treatment with low CO2 concentration, low flow velocity and a low DOC concentration is set as a reference situation (the horizontal grey line) and the effects of the other treatments are compared to this reference.
Discussion
In this study CO2, DOC and, to a smaller extent, flow velocity (all potential effects of climate change) had strong effects on the growth and development of B. erecta, which is consistent with what was found in literature (Steinberg et al., 2006; McElarney et al., 2010; Cao and Ruan, 2015; Reitsema et al., 2020). Macrophytes that grew in the wet climate change scenario with increased heavy precipitation intensity (HD-HC-HF) had a higher RGR, more biomass, shorter stems, a higher root:shoot ratio, lower N content and higher P content than the plants growing in the no climate change scenario. The higher RGR and biomass production, especially belowground, seemed to be mainly caused by the increased CO2 availability and this effect is also found in other studies (Dülger et al., 2017; Gufu et al., 2019). This effect is partly compensated by the negative effect of DOC on RGR and biomass production, which is probably caused by light limitation (Szmeja and Bociąg, 2004; Karlsson et al., 2009; Thrane et al., 2014), although DOC can also interfere with oxygen production (Pflugmacher et al., 2006) and cause oxidative stress (Steinberg et al., 2006). Additionally, the low, even negative, RGR in the HD treatment may have been caused indirectly by carbon limitation, besides the shading effect of elevated DOC. Measured CO2 concentrations in the HD-HC treatment were lower than in the LD-HC, possibly caused by growth of epiphytic algae on the macrophytes (Supplementary Figure S1). B. erecta is an homophyllous amphibious plant that is unable to take up other forms of inorganic carbon than CO2 and therefore it needs a high concentration of CO2 to sustain photosynthesis (Nielsen, 1993).
The higher root:shoot ratio under HC has also been observed in other studies (Madsen et al., 1996; Yan et al., 2006; Hussner et al., 2016) and can be explained by root carbohydrate storage for overwintering (Dülger et al., 2017) and investment in clonal reproduction, which is regarded as a strategy to increase the plants’ potential nutrient uptake (Yan et al., 2006). This last hypothesis seems to be most consistent with the results of the current study, as the stolons, which are used for clonal reproduction, were more numerous and longer in the LD-HC treatment.
In the HD-HC-HF scenario stems were shorter, and this may be explained by the plants’ adaptation strategy to develop a more compact growth form in order to avoid hydrodynamic stress (breakage or uprooting), which has been observed in other research studying B. erecta (Puijalon et al., 2005). This idea is supported by the high root:shoot ratio in the HF treatment, which can be explained by the fact that roots enable plant anchoring (Schutten et al., 2005). The lower plant N content in the HD-HC-HF scenario seemed to be caused by the increased CO2 treatment, which has been found in other studies as well (Titus and Pagano, 2002; Hussner et al., 2016). This may be explained by accumulation of carbohydrates under high CO2 concentrations, leading to nitrogen savings (Dülger et al., 2017), although no evidence was found in the current study as the dry matter content in the leaves was similar under HC and LC and leaf C content was even smaller under HC compared to LC. The higher stem P content, which seemed to be caused by the high DOC treatment, is more difficult to explain. In literature the opposite is found: due to light limitation plants elongate their stems and in this structural tissue the relative amount of C is high and P is low (Su et al., 2016). In the current study P originating from DOC may explain the high P content. After adding DOC, a high P peak was observed in the water, whereas this was less pronounced for N (Supplementary Figure S4D).
In the second climate change scenario with increased drought (HD-HC-LF) most of the results were comparable to the first climate change scenario with heavy precipitation (HD-HC-HF). The RGR was lower in the HD-HC-LF treatment, suggesting that there was a negative effect of increased boundary layers due to low flow velocity on biomass production (Westlake, 1967). However, the RGR was higher than in the no climate change scenario, suggesting that this negative effect of increased boundary layers was partially compensated by the increased CO2 availability. The root:shoot ratio was smaller and stems were longer in the HD-HC-LF scenario compared to the HD-HC-HF scenario and were more similar to the no climate change scenario (LD-LC-LF), suggesting that flow velocity had a major impact on those morphological traits due to a stress avoidance response (see previous paragraph). With regard to nutrient stoichiometry, plants responded similarly to both climate change scenarios; flow velocity had a negligible effect on nutrient stoichiometry.
Most of the plant traits were strongly affected by CO2. However, it should be taken into account that most rivers and streams are supersaturated with CO2 (Raymond et al., 2013), so in situ concentrations are likely always higher than the ones used in this experiment. Aquatic CO2 enhancement due to climate change may be relatively limited, and the effects on macrophytes less pronounced than in this experiment (Andersen and Pedersen, 2002). This means that the relative effects of flow velocity and DOC may be higher in natural situations. In this study, DOC had a negative effect on plant growth, but this is not observed for all macrophyte species: fast-growing potentially invasive species like Hydrilla verticillata (L. f.) Royle or Elodea nuttallii (Planch.) H. St. John show a positive growth response to DOC, due to accelerated growth rates under light limitation (Xu et al., 2018).
Although DOC is usually degraded in water by microorganisms, which results in CO2 production (Sobek et al., 2005), this was not observed in this experiment: CO2 concentrations in the LC treatment were lower in HD than LD conditions. Although additional tests confirmed that respiration increases when DOC is added to the water, in the flumes the extra amount of CO2 was consumed fast. The macrophytes may have taken up this CO2, but it is more likely that algae used the main part, as in general DOC had a negative effect on macrophyte growth and algae growth was more pronounced in the HD than the LC treatment. Moreover, the higher biomass of periphytic algae may also have caused additional shading (Supplementary Figure S1). A second factor to take into account concerning the HD treatment, besides periphytic algae growth, is that this treatment was done a year later than the LD treatment. Still, as the experiments were done in the same time of the year for an equal number of days, with equal constant water temperature, and a comparable amount of solar radiation we think that this difference was very small and did not significantly affect the results of this study.
Dissolved organic carbon also had a negative effect on vegetative reproduction: the number of stolons in the HD treatment is very low compared to the LD treatment. This may be explained by light limitation caused by brownification: although the effect of DOC on stolon formation has not been studied before, it has been found that there is a negative effect of water depth on stolon formation in Vallisneria natans (Lour.) H. Hara (Xiao et al., 2007), which suggests that in low light conditions, in this case caused by DOC, macrophytes produce fewer stolons. These results show why it is important to study multiple aspects of climate change in experiments, as different climate change aspects can have contrasting results, which makes it difficult to predict the response of macrophytes and the rest of the aquatic ecosystem.
To conclude, in this study it was found that B. erecta strongly responds to climate change. High flow velocity mainly affected plant morphology; stems were shorter and belowground biomass relatively larger. Biomass production was stimulated by CO2 and limited by DOC, and there were strong interaction effects between those two stressors. As CO2 has a large positive effect and DOC has a small negative effect on biomass production, compared to the control situation, one would expect a positive effect of the combination of CO2 and DOC. However, in this study the combined effects of CO2 and DOC are less positive than the sum of the two effects separately (a positive antagonistic effect) (Piggott et al., 2015). This means that elevated DOC concentrations can form a major reduction of performance in B. erecta, and this cannot be completely compensated by increased CO2. Therefore, if DOC levels rise in the future, it can be expected that, depending on the macrophyte species and abundance of epiphytic algae, macrophyte biomass production and reproduction is negatively affected, and it can also indirectly influence ecological functions of the ecosystem, because macrophytes play an important role in riverine ecosystems. For example, a reduction in macrophyte biomass may imply reduced nutrient cycling between sediments and water column (Clarke, 2002), a reduction in dissolved oxygen (Carpenter and Lodge, 1986) and reduced diversity of macroinvertebrates and small fish (Camp et al., 2014). It is important that more studies investigate changes in the DOC and CO2 concentrations, flow velocity and other parameters that will change due to climate change in rivers and how these changes correlate with macrophyte growth and the health of the ecosystem.
Data Availability Statement
The datasets generated for this study are available on request to the corresponding author.
Author Contributions
All authors contributed to the study design, commented on previous versions of the manuscript, and read and approved the final manuscript. RR, JS, J-WW, and SP performed the material preparation, data collection, and analysis. RR drafted the first manuscript.
Funding
This research was executed within the project FLASHMOB “FLuxes Affected by Stream Hydrophytes: Modelling Of Biogeochemistry” [Research Foundation-Flanders (FWO): No. G0F3217N and Austrian Science Fund (FWF): No. I3216-N29].
Conflict of Interest
The authors declare that the research was conducted in the absence of any commercial or financial relationships that could be construed as a potential conflict of interest.
The handling editor is currently organising a Research Topic with the authors JS and TH, and confirms the absence of any other collaboration.
Acknowledgments
The authors would like to thank Tom Van der Spiet and Anne Cools for carrying out the water quality and nutrient stoichiometry analyses and for their assistance with the chlorophyll measurements; Dimitri Van Pelt for technical support with the experimental setup, and Alexia Ghem, Robrecht Debbaut, Rebecca Van Coppenolle, Dácil Unzué Belmonte, Niels Van Putte, and Steven Jacobs for their practical help during the experiment.
Supplementary Material
The Supplementary Material for this article can be found online at: https://www.frontiersin.org/articles/10.3389/fenvs.2020.527801/full#supplementary-material
References
Andersen, T., and Pedersen, O. (2002). Interactions between light and CO 2 enhance the growth of Riccia fluitans. Hydrobiologia 477, 163–170.
Boyd, P. W., Cornwall, C. E., Davison, A., Doney, S. C., Fourquez, M., Hurd, C. L., et al. (2016). Biological responses to environmental heterogeneity under future ocean conditions. Global Change Biol. 22, 2633–2650. doi: 10.1111/gcb.13287
Camp, E. V., Staudhammer, C. L., Pine, W. E., Tetzlaff, J. C., and Frazer, T. K. (2014). Replacement of rooted macrophytes by filamentous macroalgae: effects on small fishes and macroinvertebrates. Hydrobiologia 722, 159–170. doi: 10.1007/s10750-013-1694-3
Cao, J., and Ruan, H. (2015). Responses of the submerged macrophyte Vallisneria natans to elevated CO2 and temperature. Aquat. Biol. 23, 119–127. doi: 10.3354/ab00605
Carpenter, S. R., and Lodge, D. M. (1986). Effects of submersed macrophytes on ecosystem processes. Aquat. Bot. 26, 341–370. doi: 10.1016/0304-3770(86)90031-8
Chambers, P., and Prepas, E. (1988). Underwater spectral attenuation and its effect on the maximum depth of angiosperm colonization. Can. J. Fish. Aqua. Sci. 45, 1010–1017. doi: 10.1139/f88-124
Choudhury, M. I., Urrutia-Cordero, P., Zhang, H., Ekvall, M. K., Medeiros, L. R., and Hansson, L.-A. (2019). Charophytes collapse beyond a critical warming and brownification threshold in shallow lake systems. Sci. Total Environ. 661, 148–154. doi: 10.1016/j.scitotenv.2019.01.177
Clarke, S. J. (2002). Vegetation growth in rivers: influences upon sediment and nutrient dynamics. Prog. Phys. Geogr. 26, 159–172. doi: 10.1191/0309133302pp324ra
Creed, I. F., Bergström, A.-K., Trick, C. G., Grimm, N. B., Hessen, D. O., Karlsson, J., et al. (2018). Global change-driven effects on dissolved organic matter composition: implications for food webs of northern lakes. Global Change Biol. 24, 3692–3714. doi: 10.1111/gcb.14129
Dai, A., Qian, T., Trenberth, K. E., and Milliman, J. D. (2009). Changes in continental freshwater discharge from 1948 to 2004. J. Clim. 22, 2773–2792. doi: 10.1175/2008jcli2592.1
de Belair, G., and Lansdown, R. V. (2013). Berula Erecta. The IUCN Red List of Threatened Species 2013. e.T164378A13575878. doi: 10.2305/IUCN.UK.2013-1.RLTS.T164378A13575878.en
Drake, T. W., Raymond, P. A., and Spencer, R. G. (2018). Terrestrial carbon inputs to inland waters: a current synthesis of estimates and uncertainty. Limnol. Oceanogr. Lett. 3, 132–142. doi: 10.1002/lol2.10055
Dülger, E., Heidbüchel, P., Schumann, T., Mettler-Altmann, T., and Hussner, A. (2017). Interactive effects of nitrate concentrations and carbon dioxide on the stoichiometry, biomass allocation and growth rate of submerged aquatic plants. Freshw. Biol. 62, 1094–1104. doi: 10.1111/fwb.12928
Eusebio Malheiro, A. C., Jahns, P., and Hussner, A. (2013). CO2 availability rather than light and temperature determines growth and phenotypical responses in submerged Myriophyllum aquaticum. Aqua. Bot. 110, 31–37. doi: 10.1016/j.aquabot.2013.05.001
Graham, M. H., and Edwards, M. S. (2001). Statistical significance versus fit: estimating the importance of individual factors in ecological analysis of variance. Oikos 93, 505–513. doi: 10.1034/j.1600-0706.2001.930317.x
Grigutytė, R., Nimptsch, J., Manusadžianas, L., and Pflugmacher, S. (2009). Response of oxidative stress enzymes in charophyte Nitellopsis obtusa exposed to allochthonous leaf extracts from beech Fagus sylvatica. Biologija 55, 142–149. doi: 10.2478/v10054-009-0021-4
Gufu, G. D., Manea, A., and Leishman, M. R. (2019). Experimental evidence that CO 2 and nutrient enrichment do not mediate interactions between a native and an exotic free-floating macrophyte. Hydrobiologia 846, 75–85.
Hasler, C. T., Butman, D., Jeffrey, J. D., and Suski, C. D. (2016). Freshwater biota and rising pCO2? Ecol. Lett. 19, 98–108. doi: 10.1111/ele.12549
Hoegh-Guldberg, O., Jacob, D., Taylor, M., Bindi, M., Brown, S., Camilloni, I., et al. (2018). “Impacts of 1.5°C global warming on natural and human systems,” in Global warming of 1.5°C. An IPCC Special Report on the Impacts of Global Warming of 1.5°C Above pre-Industrial Levels and Related Global Greenhouse Gas Emission Pathways, in the Context of Strengthening the Global Response to the Threat of Climate Change, Sustainable Development, and Efforts to Eradicate Poverty, eds V. Masson-Delmotte, P. Zhai, H. O. Pörtner, D. Roberts, J. Skea, P. R. Shukla, et al. (Geneva: World Meteorological Organization Technical Document).
Huber, S. A., Balz, A., Abert, M., and Pronk, W. (2011). Characterisation of aquatic humic and non-humic matter with size-exclusion chromatography – organic carbon detection – organic nitrogen detection (LC-OCD-OND). Water Res. 45, 879–885. doi: 10.1016/j.watres.2010.09.023
Hussner, A., Mettler-Altmann, T., Weber, A. P. M., and Sand-Jensen, K. (2016). Acclimation of photosynthesis to supersaturated CO2in aquatic plant bicarbonate users. Freshw. Biol. 61, 1720–1732. doi: 10.1111/fwb.12812
Hussner, A., Smith, R., Mettler-Altmann, T., Hill, M. P., and Coetzee, J. (2019). Simulated global increases in atmospheric CO2 alter the tissue composition, but not the growth of some submerged aquatic plant bicarbonate users growing in DIC rich waters. Aqua. Bot. 153, 44–50. doi: 10.1016/j.aquabot.2018.11.009
Iversen, L. L., Winkel, A., Baastrup-Spohr, L., Hinke, A. B., Alahuhta, J., Baattrup-Pedersen, A., et al. (2019). Catchment properties and the photosynthetic trait composition of freshwater plant communities. Science 366, 878–881.
Jacob, D., Kotova, L., Teichmann, C., Sobolowski, S. P., Vautard, R., Donnelly, C., et al. (2018). Climate Impacts in Europe Under +1.5°C Global Warming. Earth’s Future 6, 264–285. doi: 10.1002/2017EF000710
Karlsson, J., Bystrom, P., Ask, J., Ask, P., Persson, L., and Jansson, M. (2009). Light limitation of nutrient-poor lake ecosystems. Nature 460, 506–509. doi: 10.1038/nature08179
Knapp, A. K., Carroll, C. J. W., Griffin-Nolan, R. J., Slette, I. J., Chaves, F. A., Baur, L. E., et al. (2018). A reality check for climate change experiments: do they reflect the real world? Ecology 99, 2145–2151. doi: 10.1002/ecy.2474
Kritzberg, E., and Ekström, S. (2012). Increasing iron concentrations in surface waters–a factor behind brownification? Biogeosciences 9, 1465–1478.
Lüdecke, D. (2019). sjstats: Statistical Functions for Regression Models (version 0.17.3). doi: 10.5281/zenodo.1284472
Lv, C., Wang, H., Wang, J., Ma, X., and Xia, C. (2019). The influence of elevated CO2 on Vallisneria spiralis, Radix auricularia, and their plant–herbivore interaction. Aquat. Ecol. 53, 137–150. doi: 10.1007/s10452-019-09678-4
Maberly, S. C., Berthelot, S. A., Stott, A. W., and Gontero, B. (2015). Adaptation by macrophytes to inorganic carbon down a river with naturally variable concentrations of CO2. J. Plant Physiol. 172, 120–127. doi: 10.1016/j.jplph.2014.07.025
Madsen, T. V., Enevoldsen, H. O., and Jørgensen, T. B. (1993). Effects of water velocity on photosynthesis and dark respiration in submerged stream macrophytes. Plant Cell Environ. 16, 317–322. doi: 10.1111/j.1365-3040.1993.tb00875.x
Madsen, T. V., Maberly, S. C., and Bowes, G. (1996). Photosynthetic acclimation of submersed angiosperms to CO2 and HCO3. Aquat. Bot. 53, 15–30.
McElarney, Y. R., Rasmussen, P., Foy, R. H., and Anderson, N. J. (2010). Response of aquatic macrophytes in Northern Irish softwater lakes to forestry management; eutrophication and dissolved organic carbon. Aquat. Bot. 93, 227–236. doi: 10.1016/j.aquabot.2010.09.002
Monteith, D. T., Stoddard, J. L., Evans, C. D., de Wit, H. A., Forsius, M., Hogasen, T., et al. (2007). Dissolved organic carbon trends resulting from changes in atmospheric deposition chemistry. Nature 450, 537–540. doi: 10.1038/nature06316
Nielsen, S. L. (1993). A comparison of aerial and submerged photosynthesis in some Danish amphibious plants. Aquat. Bot. 45, 27–40.
Oksanen, J., Guillaume Blanchet, F., Friendly, M., Kindt, R., Legendre, P., McGlinn, D., et al. (2019). vegan: Community Ecology Package (version 2.5–4).
Pagano, T., Bida, M., and Kenny, J. (2014). Trends in levels of allochthonous dissolved organic carbon in natural water: a review of potential mechanisms under a changing climate. Water 6, 2862–2897. doi: 10.3390/w6102862
Pflugmacher, S., Pietsch, C., Rieger, W., and Steinberg, C. E. (2006). Dissolved natural organic matter (NOM) impacts photosynthetic oxygen production and electron transport in coontail Ceratophyllum demersum. Sci. Total Environ. 357, 169–175. doi: 10.1016/j.scitotenv.2005.03.021
Phillips, J., McKinley, G., Bennington, V., Bootsma, H., Pilcher, D., Sterner, R., et al. (2015). The potential for CO2-induced acidification in freshwater: a great lakes case study. Oceanography 25, 136–145. doi: 10.5670/oceanog.2015.37
Piggott, J. J., Townsend, C. R., and Matthaei, C. D. (2015). Reconceptualizing synergism and antagonism among multiple stressors. Ecol. Evol. 5, 1538–1547. doi: 10.1002/ece3.1465
Porcal, P., Koprivnjak, J. F., Molot, L. A., and Dillon, P. J. (2009). Humic substances-part 7: the biogeochemistry of dissolved organic carbon and its interactions with climate change. Environ. Sci. Pollut. Res. Int. 16, 714–726. doi: 10.1007/s11356-009-0176-7
Puijalon, S., Bornette, G., and Sagnes, P. (2005). Adaptations to increasing hydraulic stress: morphology, hydrodynamics and fitness of two higher aquatic plant species. J. Exp. Bot. 56, 777–786. doi: 10.1093/jxb/eri063
Puijalon, S., Bouma, T. J., Douady, C. J., van Groenendael, J., Anten, N. P., Martel, E., et al. (2011). Plant resistance to mechanical stress: evidence of an avoidance-tolerance trade-off. New Phytol. 191, 1141–1149. doi: 10.1111/j.1469-8137.2011.03763.x
Raymond, P. A., Hartmann, J., Lauerwald, R., Sobek, S., McDonald, C., Hoover, M., et al. (2013). Global carbon dioxide emissions from inland waters. Nature 503, 355–359. doi: 10.1038/nature12760
Reitsema, R. E., Meire, P., and Schoelynck, J. (2018). The future of freshwater macrophytes in a changing world: dissolved organic carbon quantity and quality and its interactions with macrophytes. Front. Plant Sci. 9:629. doi: 10.3389/fpls.2018.00629
Reitsema, R. E., Preiner, S., Meire, P., Hein, T., De Boeck, G., Blust, R., et al. (2020). Implications of climate change for submerged macrophytes: effects of CO2, flow velocity and nutrient concentration on Berula erecta. Aquat. Ecol. 54, 775–793. doi: 10.1007/s10452-020-09776-8
Sachse, A., Henrion, R., Gelbrecht, J., and Steinberg, C. E. W. (2005). Classification of dissolved organic carbon (DOC) in river systems: influence of catchment characteristics and autochthonous processes. Organ. Geochem. 36, 923–935. doi: 10.1016/j.orggeochem.2004.12.008
Sand-Jensen, K., Pedersen, M. F., and Nielsen, S. L. (1992). Photosynthetic use of inorganic carbon among primary and secondary water plants in streams. Freshw. Biol. 27, 283–293.
Schoelynck, J., Bal, K., Puijalon, S., Meire, P., and Struyf, E. (2012a). Hydrodynamically mediated macrophyte silica dynamics. Plant Biol. 14, 997–1005. doi: 10.1111/j.1438-8677.2012.00583.x
Schoelynck, J., de Groote, T., Bal, K., Vandenbruwaene, W., Meire, P., and Temmerman, S. (2012b). Self-organised patchiness and scale-dependent bio-geomorphic feedbacks in aquatic river vegetation. Ecography 35, 760–768. doi: 10.1111/j.1600-0587.2011.07177.x
Schutten, J., Dainty, J., and Davy, A. J. (2005). Root anchorage and its significance for submerged plants in shallow lakes. J. Ecol. 93, 556–571.
Short, F. T., Kosten, S., Morgan, P. A., Malone, S., and Moore, G. E. (2016). Impacts of climate change on submerged and emergent wetland plants. Aquat. Bot. 135, 3–17. doi: 10.1016/j.aquabot.2016.06.006
Sobek, S., Tranvik, L. J., and Cole, J. J. (2005). Temperature independence of carbon dioxide supersaturation in global lakes. Global Biogeochem. Cycles 19:GB2003. doi: 10.1029/2004gb002264
Steinberg, C. E. W., Kamara, S., Prokhotskaya, V. Y., Manusadzianas, L., Karasyova, T. A., Timofeyev, M. A., et al. (2006). Dissolved humic substances - ecological driving forces from the individual to the ecosystem level? Freshw. Biol. 51, 1189–1210. doi: 10.1111/j.1365-2427.2006.01571.x
Su, H., Wu, Y., Xie, P., Chen, J., Cao, T., and Xia, W. (2016). Effects of taxonomy, sediment, and water column on C:N:P stoichiometry of submerged macrophytes in Yangtze floodplain shallow lakes. China. Environ. Sci. Pollut. Res. 23, 22577–22585. doi: 10.1007/s11356-016-7435-1
Szmeja, J., and Bociąg, K. (2004). The disintegration of populations of underwater plants in soft water lakes enriched with acidic organic matter. Acta Soc. Bot. Pol. 73, 165–173.
Thrane, J.-E., Hessen, D. O., and Andersen, T. (2014). The absorption of light in lakes: negative impact of dissolved organic carbon on primary productivity. Ecosystems 17, 1040–1052. doi: 10.1007/s10021-014-9776-2
Titus, J. E., and Pagano, A. M. (2002). Decomposition of litter from submersed macrophytes: the indirect effects of high [CO2]. Freshw. Biol. 47, 1367–1375.
Uehlinger, U., König, C., and Reichert, P. (2000). Variability of photosynthesis-irradiance curves and ecosystem respiration in a small river. Freshw. Biol. 44, 493–507.
Van den Brink, P. J., and Ter Braak, C. J. F. (1999). Principal response curves: Analysis of time-dependent multivariate responses of biological community to stress. Environ. Toxicol. Chem. 18, 138–148. doi: 10.1002/etc.5620180207
van Vliet, M. T. H., Franssen, W. H. P., Yearsley, J. R., Ludwig, F., Haddeland, I., Lettenmaier, D. P., et al. (2013). Global river discharge and water temperature under climate change. Global Environ. Change 23, 450–464. doi: 10.1016/j.gloenvcha.2012.11.002
Westlake, D. F. (1967). Some effects of low-velocity currents on the metabolism of aquatic macrophytes. J. Exp. Bot. 18, 187–205.
Xiao, K., Yu, D., and Wu, Z. (2007). Differential effects of water depth and sediment type on clonal growth of the submersed macrophyte Vallisneria natans. Hydrobiologia 589, 265–272. doi: 10.1007/s10750-007-0740-4
Xu, X., Yang, L., Huang, X., Li, Z., and Yu, D. (2018). Water brownification may not promote invasions of submerged non-native macrophytes. Hydrobiologia 817, 215–225. doi: 10.1007/s10750-017-3387-9
Keywords: aquatic plants, Berula erecta, climate change, carbon dioxide, brownification, humic substances, flow velocity, multiple stressors
Citation: Reitsema RE, Wolters J-W, Preiner S, Meire P, Hein T, De Boeck G, Blust R and Schoelynck J (2020) Response of Submerged Macrophyte Growth, Morphology, Chlorophyll Content and Nutrient Stoichiometry to Increased Flow Velocity and Elevated CO2 and Dissolved Organic Carbon Concentrations. Front. Environ. Sci. 11:527801. doi: 10.3389/fenvs.2020.527801
Received: 17 January 2020; Accepted: 17 August 2020;
Published: 08 September 2020.
Edited by:
Dana M. Infante, Michigan State University, United StatesReviewed by:
Teresa Ferreira, University of Lisbon, PortugalRenato Tavares Martins, Universidade Federal de Goiás, Brazil
Copyright © 2020 Reitsema, Wolters, Preiner, Meire, Hein, De Boeck, Blust and Schoelynck. This is an open-access article distributed under the terms of the Creative Commons Attribution License (CC BY). The use, distribution or reproduction in other forums is permitted, provided the original author(s) and the copyright owner(s) are credited and that the original publication in this journal is cited, in accordance with accepted academic practice. No use, distribution or reproduction is permitted which does not comply with these terms.
*Correspondence: Rosanne E. Reitsema, Rosanne.Reitsema@uantwerpen.be