Phenological Patterns and Seasonal Segregation of Coprophilous Beetles (Coleoptera: Scarabaeoidea and Hydrophilidae) on a Cattle Farm in SE-Michigan, United States Throughout the Year
 Thomas Wassmer
- Department of Biology, Siena Heights University, Adrian, MI, United States
The seasonal occurrence of species and timing of key events in their life (phenology) affects the ecology and evolution of every species, population, and species community (SC) on Earth. Shifting phenologies and mismatches between species may affect range limits and lead to extinctions and biodiversity loss, which are especially concerning in ecologically and economically important SCs like coprophilous beetles. This study provides phenological data for many species of coprophilous beetles from the Midwestern region of the United States, includes the often-missing winter months, and compares the seasonal and successional differences between the “relocator” and “dweller” guilds. Beetles were sampled biweekly throughout the year from a 3.8 ha Farm in Adrian, SE-Michigan using 15 pitfall traps baited with cow manure. Samples were collected after 48 h and again after 72 h exposure time. Over the entire year, I caught 6,069 specimens from 24 species of Scarabaeoidea and 13 species of Hydrophilidae. The ROSARIO null model for continuous temporal data suggested a significant seasonal overlap of the SC (p < 0.0001) and a cluster analysis based on Pianka’s niche overlap index identified five clusters at a minimum overlap of 55% falling into three major phenological guilds. “Relocators” (6 Scarabaeinae, 2 Aphodiinae species) overlapped on average by 48.4%, whereas “dwellers” (9 Aphodiinae, 10 Hydrophilidae species) overlapped by 36.0% (Mann–Whitney test, p = 0.055). Small Hydrophilidae dwellers overlapped by 30.9% whereas large hydrophilid dwellers overlapped by 96.9%. Individual phenological patterns were compared to other sites in North America and Europe and predictions about geographical and phenological changes due to the man-made climate crisis and habitat loss and fragmentation are discussed. Differences between the seasonal overlaps of “relocators” and “dwellers” as well as small and large Onthophagus relocators and Hydrophilidae dwellers are suggesting profound ecological differences between the guilds and sub-guilds.
Introduction
All organisms living outside the inner tropics (approx. >± 15° latitude) experience regular and predictable seasonal climatic fluctuations over the time course of a year (Smith and Smith, 2001). Adaptation to the range and timing of these fluctuations that also determine the availability of food are vital to all organisms resulting in the global distribution patterns of species capable to survive and reproduce at those locations (Wallace, 1876; Fretwell, 1972). The particular seasonal timing of the occurrence of a species or of its biological key events is called phenology and affects nearly all aspects of the evolution and ecology of the species, its populations and the species communities (SCs) it is part of (Forrest and Miller-Rushing, 2010). Phenologies are dynamic and can be altered by changes in abiotic factors most significantly by the global climate crisis (Brown et al., 2016; Forrest, 2016; Scranton and Amarasekare, 2017) and/or biotic factors such as invasive species (Alexander and Levine, 2019) and biodiversity loss (Wolf et al., 2017), which are often entangled with the effects of the climate crisis (Colautti et al., 2017). Shifting phenologies may affect species’ range limits (Chen et al., 2011), increase competition (Carter and Rudolf, 2019) and may disrupt other direct and indirect interactions (Morente-López et al., 2018), leading to species extinctions (Rudolf, 2019) and may thus reduce biodiversity (Franco-Cisterna et al., 2020) causing substantial shifts in SCs. Due to the profound effects of phenological shifts and mismatches between species (Kharouba et al., 2018; Renner and Zohner, 2018; Damien and Tougeron, 2019), it is important to predict how the phenology of the species within a SC might shift under the influence of changing weather patterns or introduced invasive species (van den Heuvel et al., 2013; Wolkovich and Cleland, 2014; Colautti et al., 2017; Chmura et al., 2019). This is only possible, if the current phenologies of each species (or at least of key species) in a SC are known over their present geographical and ecological ranges.
One SC whose phenology is of particular interest are coprophilous beetles. These dung-loving beetles play a central role in nutrient and energy cycling from the grazing food chain into the soil (Doughty et al., 2016). Coprophilous beetles aerate the soil, breakdown and digest dung and incorporate nutrients into the organic soil horizon (Piccini et al., 2018). In addition, these organisms are at one of the junctions that connect the two major terrestrial flows of energy, the grazing and detritus food chain (Wu et al., 2011) and perform vital ecosystem services (Nichols et al., 2008; Manning and Cutler, 2018; Piccini et al., 2020) including carbon sequestration (Slade et al., 2016; Piccini et al., 2017), although the latter was not confirmed by all studies (e.g., Evans et al., 2019). Coprophilous beetles can be subdivided into several functional groups. Using differences in their larval and adult ecology, coprophilous beetles can be distinguished as either “relocators” or “dwellers” (Sladecek et al., 2013). “Relocators” are species whose larvae do not occupy dung pats at any stage of their development, but rather “relocate” their larvae away from the dung pats. This group includes “paracoprid” Scarabaeinae (Doube, 1990) and Aphodiinae that lay their eggs in the soil close to a dung pat such as Chilothorax distinctus, Colobopterus erraticus, and Melinopterus prodromus (Christensen and Dobson, 1976; Rojewski, 1983; Gittings and Giller, 1997; Vitner, 1998). In contrary to this, dwellers (synonymous to “endocoprids” sensu Doube (1990) are species in which the entire or at least the last stages of larval development occur within dung pats. This group includes most Aphodiinae and the subfamily Sphaeridiinae within the Hydrophilidae.
Communities of coprophilous beetles were assisted by traditional agriculture for centuries allowing species richness to double by adding introduced species to the existing fauna that transitioned from the excrements of native wildlife to the dung of bovine farm animals (Tiberg and Floate, 2011). Since the end of WWII, however, these rich blended SCs have been facing several threats: habitat loss and fragmentation due to agricultural intensification (Blayney, 2004; Clay et al., 2020) leading to resource scarcity and isolated populations (Roslin, 2001; Foster et al., 2020), and the manmade climate crisis (Menendez and Gutierrez, 2004; Dortel et al., 2013). Therefore, pasture systems need carefully tailored management efforts (Jay-Robert et al., 2008c; Giraldo et al., 2011; Beynon et al., 2012; Buse et al., 2015; Kremen and Merenlender, 2018; Tonelli et al., 2019; Clay et al., 2020; Guerra Alonso et al., 2020; Perrin et al., 2020; van den Pol-van Dasselaar et al., 2020). Coprophilous beetles are valuable bioindicators of habitat quality due to their dependency on animal excrements and are therefore well suited to monitor and evaluate conservation measures (Waßmer, 1995; Favila and Halffter, 1997; McGeoch et al., 2002; Alvarado et al., 2019; Raine and Slade, 2019; Carvalho et al., 2020). As the seasonal abundance patterns of many species are heavily influenced by the man-made climate crisis (Chuine, 2010; Wolkovich and Cleland, 2014; Brown et al., 2016; Wilsey et al., 2018), detailed phenologies and segregation patterns of the species and functional guilds within local communities of coprophilous beetles are an important tool informing the management of these vital agricultural (Chmielewski, 2003; Ruml and Vulić, 2005) and natural resources (Denny et al., 2014; Enquist et al., 2014; Bradford et al., 2018; Browning et al., 2018) and are essential for guiding effective conservation efforts (Escobar et al., 2008; Rosemartin et al., 2014; Morellato et al., 2016).
Despite their ecological and economic importance (Beynon et al., 2015), there are astonishingly few studies describing the phenology of local dung beetle communities, especially in North America. Only two studies provide data about dung beetle phenology in Michigan (Rounds and Floate, 2012; Wassmer, 2014) and only a few others from the Midwest of the United States (Kriska and Young, 2002; Worthington and Larsen, 2010). The first objective of this study was therefore to provide data to the insufficiently known phenology of coprophilous beetles from the Midwest of the United States. For this purpose, I will first describe the SC of coprophilous beetles based on both abundances and biomass and will document how the composition of the SC progressed over the sample months using appropriate metrics. Then, I will analyze the similarities of the SCs sampled in different months and finally calculate the phenological correspondence between individual species using a cluster analysis of pair-wise phenological niche overlaps.
The period between late fall and early spring is traditionally missing in phenologies from the mid and higher latitudes, as beetles were thought to be dormant during these months. However, during my 1994 study from SW-Germany, I found several species throughout the winter and identified a specialist species for the winter niche (Wassmer, 1994). As the man-made climate crisis causes milder winters in temperate, boreal and polar climates, the second objective of this study was to provide a phenology of the coprophilous beetle community throughout the year including the winter months.
Menéndez and Gutiérrez (1999), Sladecek et al. (2013), and Wassmer (2020) showed that the “relocator” guild has a distinctively different successional timing compared to the “dweller” guild. The third objective of the study was to compare the degree of seasonal segregation in these functional groups and relate those patterns to their successional separation reported in the sister study of this research (Wassmer, 2020) to outline a 2-dimensional temporal niche space for these guilds. The use of phenological patterns (phenophases) of guilds instead of individual species has been shown by Browning et al. (2018) to improve the efficiency of ecosystem monitoring and predictive modeling to inform land management outcomes.
Materials and Methods
Location
I conducted my study on Carpenter Farms, a farm with multiple MAEAP-certifications (Farmstead System, Livestock System, Cropping System and Greenhouse, Michigan Agriculture Environmental Assurance Program, 2019) located approx. 2 miles southeast of Adrian, in Madison Township, Lenawee County, Michigan, United States (41.874°, −84.010°, elevation 243 m above sea level). The 3.8 ha sized pasture area is surrounded by crop field on 3 sides and by a major highway on the remaining side and is embedded in a landscape mosaic consisting of patches of line crops, riparian forest, low and high density residential buildings, light industrial facilities as well as streets and highways (Figure 1). The nearest two surrounding pastures are at distances of 3.5 and 6.5 km providing connectivity between pasture habitats only for highly mobile beetle species. The pasture area is in use as a cattle pasture for at least 25 years. During my study, the herd consisted of about 45 cows, heifers and calves of Black Angus and Hereford-Angus breeds. Since 2013, the cattle are moved to a larger more productive pasture in mid to late spring and are replaced by a small herd of goats, a pony, and a donkey; cattle return to the farm in late autumn. More details about the study site can be found in Wassmer (2020).
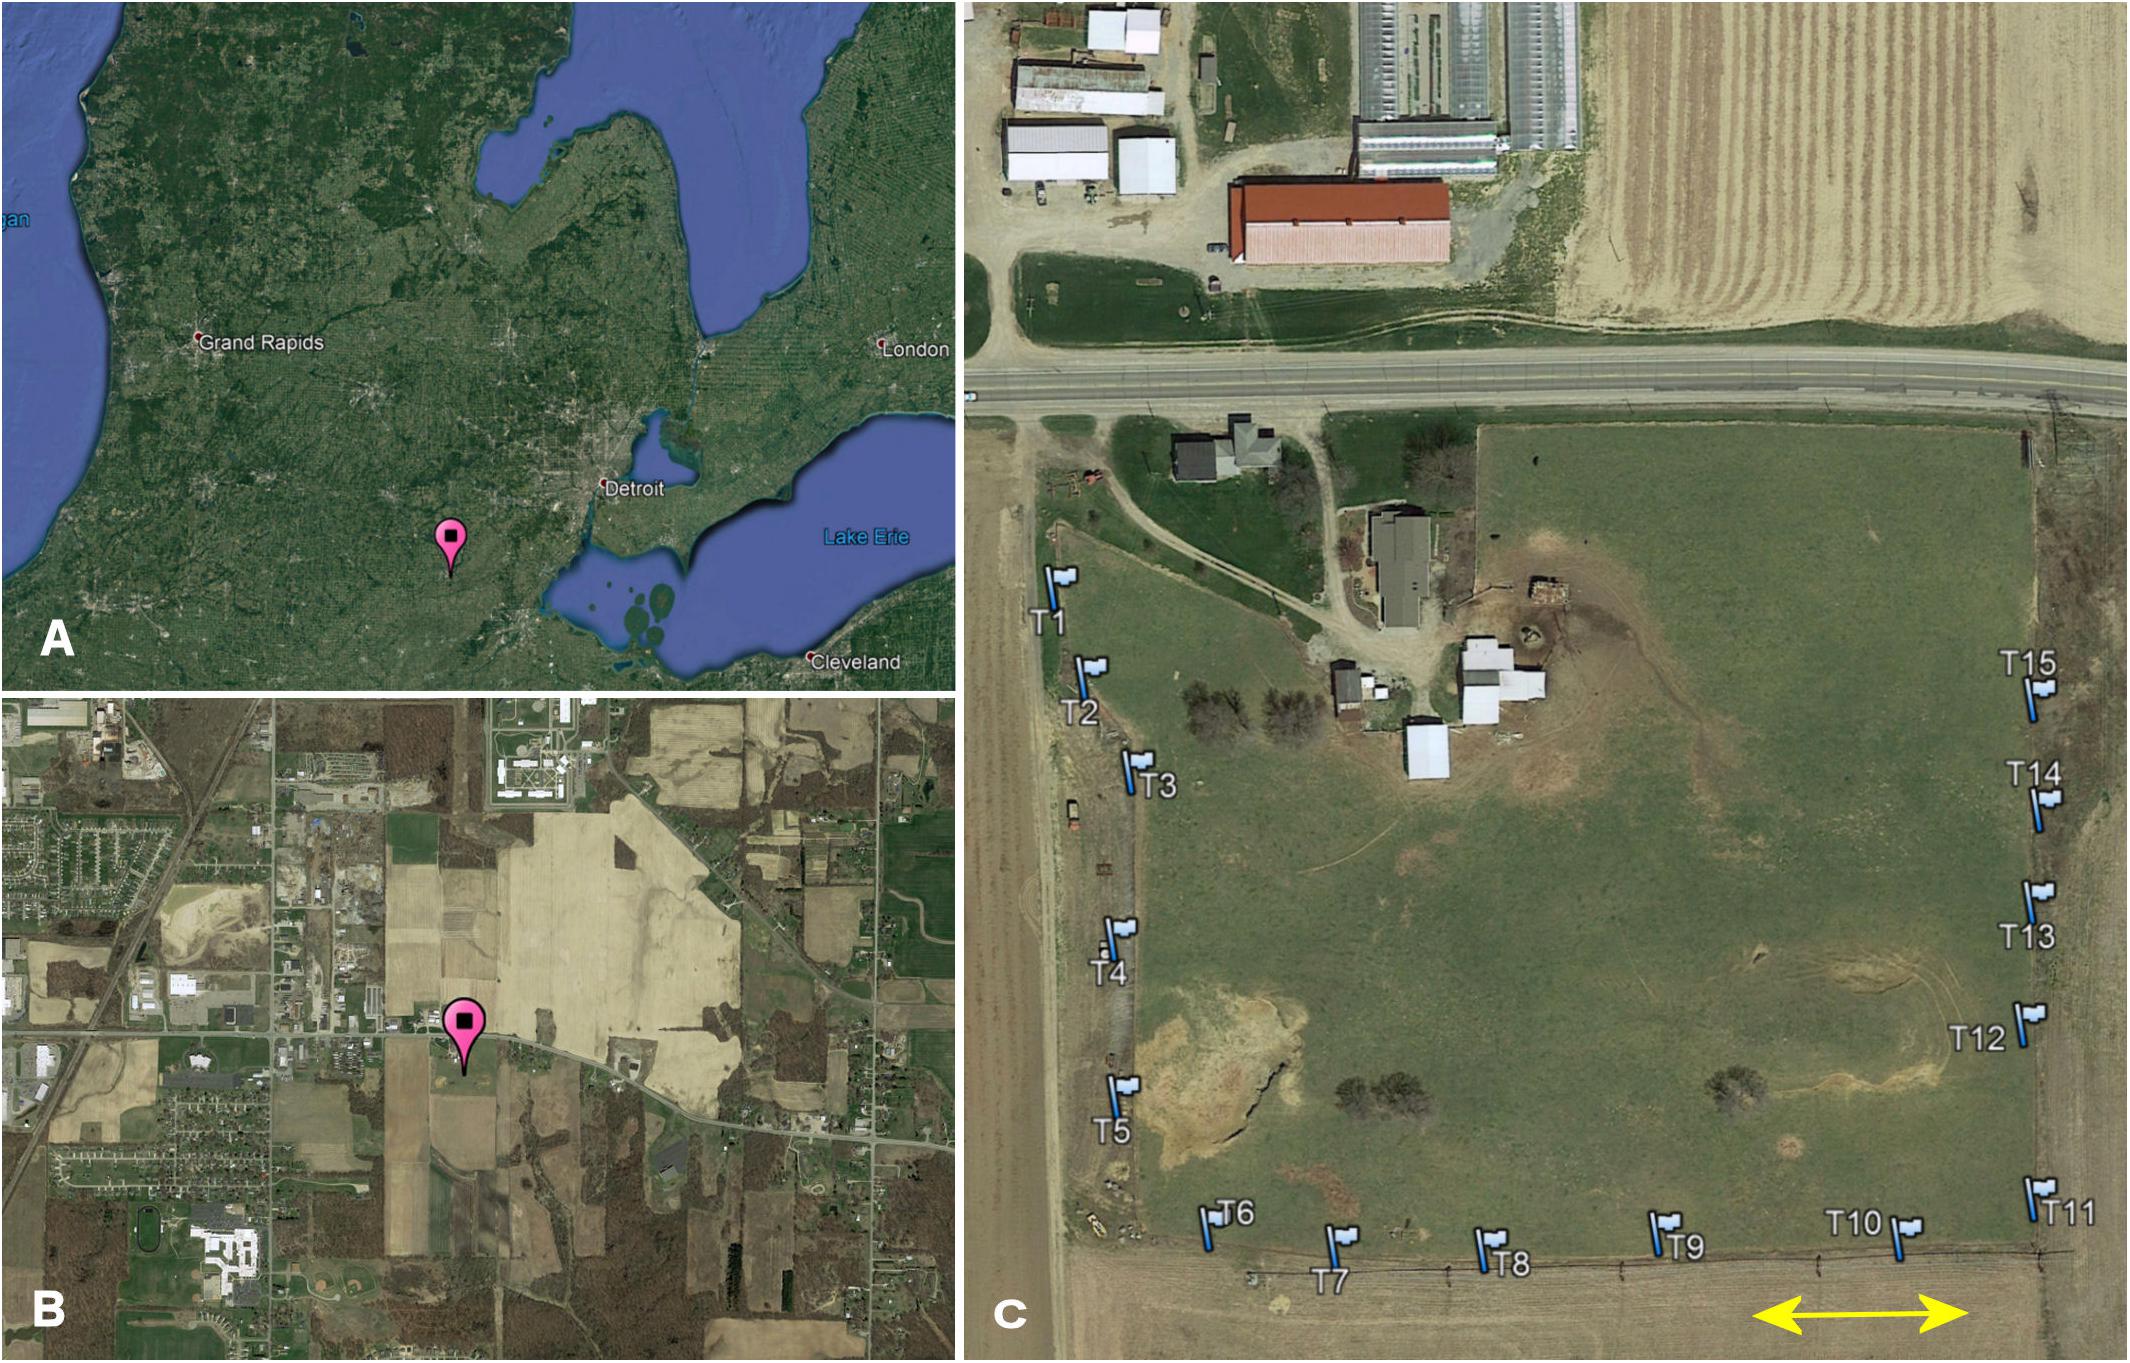
Figure 1. (A) Study location in Michigan (pin), (B) location within the local landscape mosaic of 4 by 2 km (pin), and (C) trap array (flags) along the fence line of Carpenter Farm. The arrow indicates 50 m.
Data Collection
I sampled coprophilous beetles in an array of 15 pitfall traps located immediately outside the pasture fence on three sides of the pasture (Figure 1). To facilitate sampling independence, traps were spaced at least 50 m apart (Larsen and Forsyth, 2005). I attracted beetles to the traps twice per month between 8:00 am and 5:00 pm depending on season and weather by using approx. 400 g of fresh uninhabited bovine dung. I collected beetles from the buckets every other week once after approximately 48 h without tampering with the bait, and a second time after 72 h (on December 25 after 96 h). Biweekly sampling started on June 08, 2017 and continued until May 27, 2018. Due to harsh winter conditions with a deep snow cover, I only collected one sample per month for January and February. For more details on the sampling protocol, beetle identification, and biomass computation, please refer to Wassmer (2020).
Using differences in their larval and adult ecology, I distinguished all coprophilous beetles either as: “relocators” or “dwellers” following Sladecek et al. (2013). Contrary to Sladecek et al. (2013), I also included Hydrophilidae as “dwellers” as I did not expect a major impact of predatory Hydrophilidae larvae within the short successional span of this study.
Data Analysis
The study design allowed the analyses of the impact of two temporal constraints on the species community (SC):
(1) Phenology (seasonality) 26 biweekly samples from the pooled 15 pitfall traps or as 12 monthly samples with two biweekly samples pooled together.
(2) Succession (exposure time) from the pooled 15 pitfall traps collected after 2 days exposure and a pooled late sample collected after 3 days. Analyses of these data were published in Wassmer (2020).
Data were visualized using Microsoft Excel 2019 and OriginLab Origin Pro 2019. Standard statistical tests were used for comparisons of group means, standard deviations and standard errors (Siegel and Castellan, 1988; Moore et al., 2013; Zar, 2018). Unless stated otherwise, means are presented together with their standard deviation (mean ± SD).
For the analysis of the seasonality of total abundances, biomass, species richness and diversity (section 3.2) and the monthly dominance structures (section 3.4), I used the Brillouin index and its associated evenness to measure α-diversity based on beetle abundance and the Shannon–Wiener diversity and evenness in analyses based on beetle biomass as suggested by Krebs (2014). In the same analyses, true diversities were calculated as the exponential of the Shannon–Wiener entropy -exp(H_Shannon) and the effective number of species followed Jost (2006). Monthly dominance classes in the monthly SCs (3.4) are based on Engelmann (1978): eudominant (ed) = 32 − 100%, dominant (d) = 10–31.9%, subdominant (sd) = 3.2–9.9%, recedent (r) = 1.0–3.19%, subrecedent (sr) = 0.32–0.99% and sporadic (s) ≤ 0.32%.
For the analysis of the phenological similarities between the SCs of different sample months (section 3.5), I computed an unweighted paired-group cluster analysis (UPGMA) of the percent similarity coefficient [Renkonen index, Renkonen (1938)] as this measure provides a better comparison of the abundances of species that are occurring in multiple months. The analysis of the phenological niche overlap and seasonal segregation between the species (section 3.6) were based on a UPGMA cluster analysis of Pianka’s niche overlap index (Pianka, 1973). This index measures the relative amount of habitat overlap between each pair of species and ranges from a minimum of 0.0 (no shared habitats) to a maximum of 1.0 (identical habitat use). To curtail a disproportional impact of rare species on the calculation of pairwise niche overlaps in the entire SC, I excluded the rarest 8 species that occurred in numbers below five as the slope of the linear regression decreased substantially at this number (Wassmer, 2020). The mean degree of community overlap was calculated using all possible pairs of species on the matrix of species and niche dimension (phenology). To assess the significance of this mean, the degree matrices were randomized (n = 10,000) according to the ROSARIO algorithm (Castro-Arellano et al., 2010) which was especially developed for continuous/temporal niche dimensions (seasonality/phenology) to create a null distribution of overlaps. A two-tailed significance was determined by comparing the randomized values with the respective observed distribution at α = 0.05. Significant overlap is indicated if the observed overlap is significantly greater than the randomizations, whereas segregation is indicated by significantly lower overlaps than that expected by chance (Albrecht and Gotelli, 2001). The randomizations and significance of the ROSARIO model was conducted using the software TimeOverlap (Rangel et al., 2010). The reliability of the cluster analyses was confirmed by the cophenetic correlation coefficient, which indicates if a dendrogram preserved the pairwise distances between the examined samples sufficiently well (Sokal and Rohlf, 1962).
Results
Species Composition
Over the entire year, I caught 6,069 specimens from 24 species of Scarabaeoidea and 13 species of Hydrophilidae (Supplementary Table S1). For an analysis of the faunal composition and the classification of species into the functional groups “dwellers” and “relocators,” refer to Wassmer (2020).
Seasonality of Total Abundances, Biomass, Species Richness and Diversity
During the year, there was a considerable fluctuation of both abundance and biomass of dung beetles (Supplementary Table S1 and Figure 2, lower panel). Abundance and biomass developed proportional with clear maxima in summer between late May-late July. Abundances showed a steady decline thereafter interrupted only by a miniscule peak of about a quarter of the summer abundances in late fall (mid-October). Biomass followed this trend but diminished less gradual and developed an intermittent peak on September 1st. Contrary to this, abundances showed an early peak in mid-April, while biomass was gradually rising toward the summer peak. In late autumn and winter (November–March), both abundances and biomass were very low and reached zero values in December and January. During this time, average temperatures were around or below 0°C (Figure 2, upper panel).
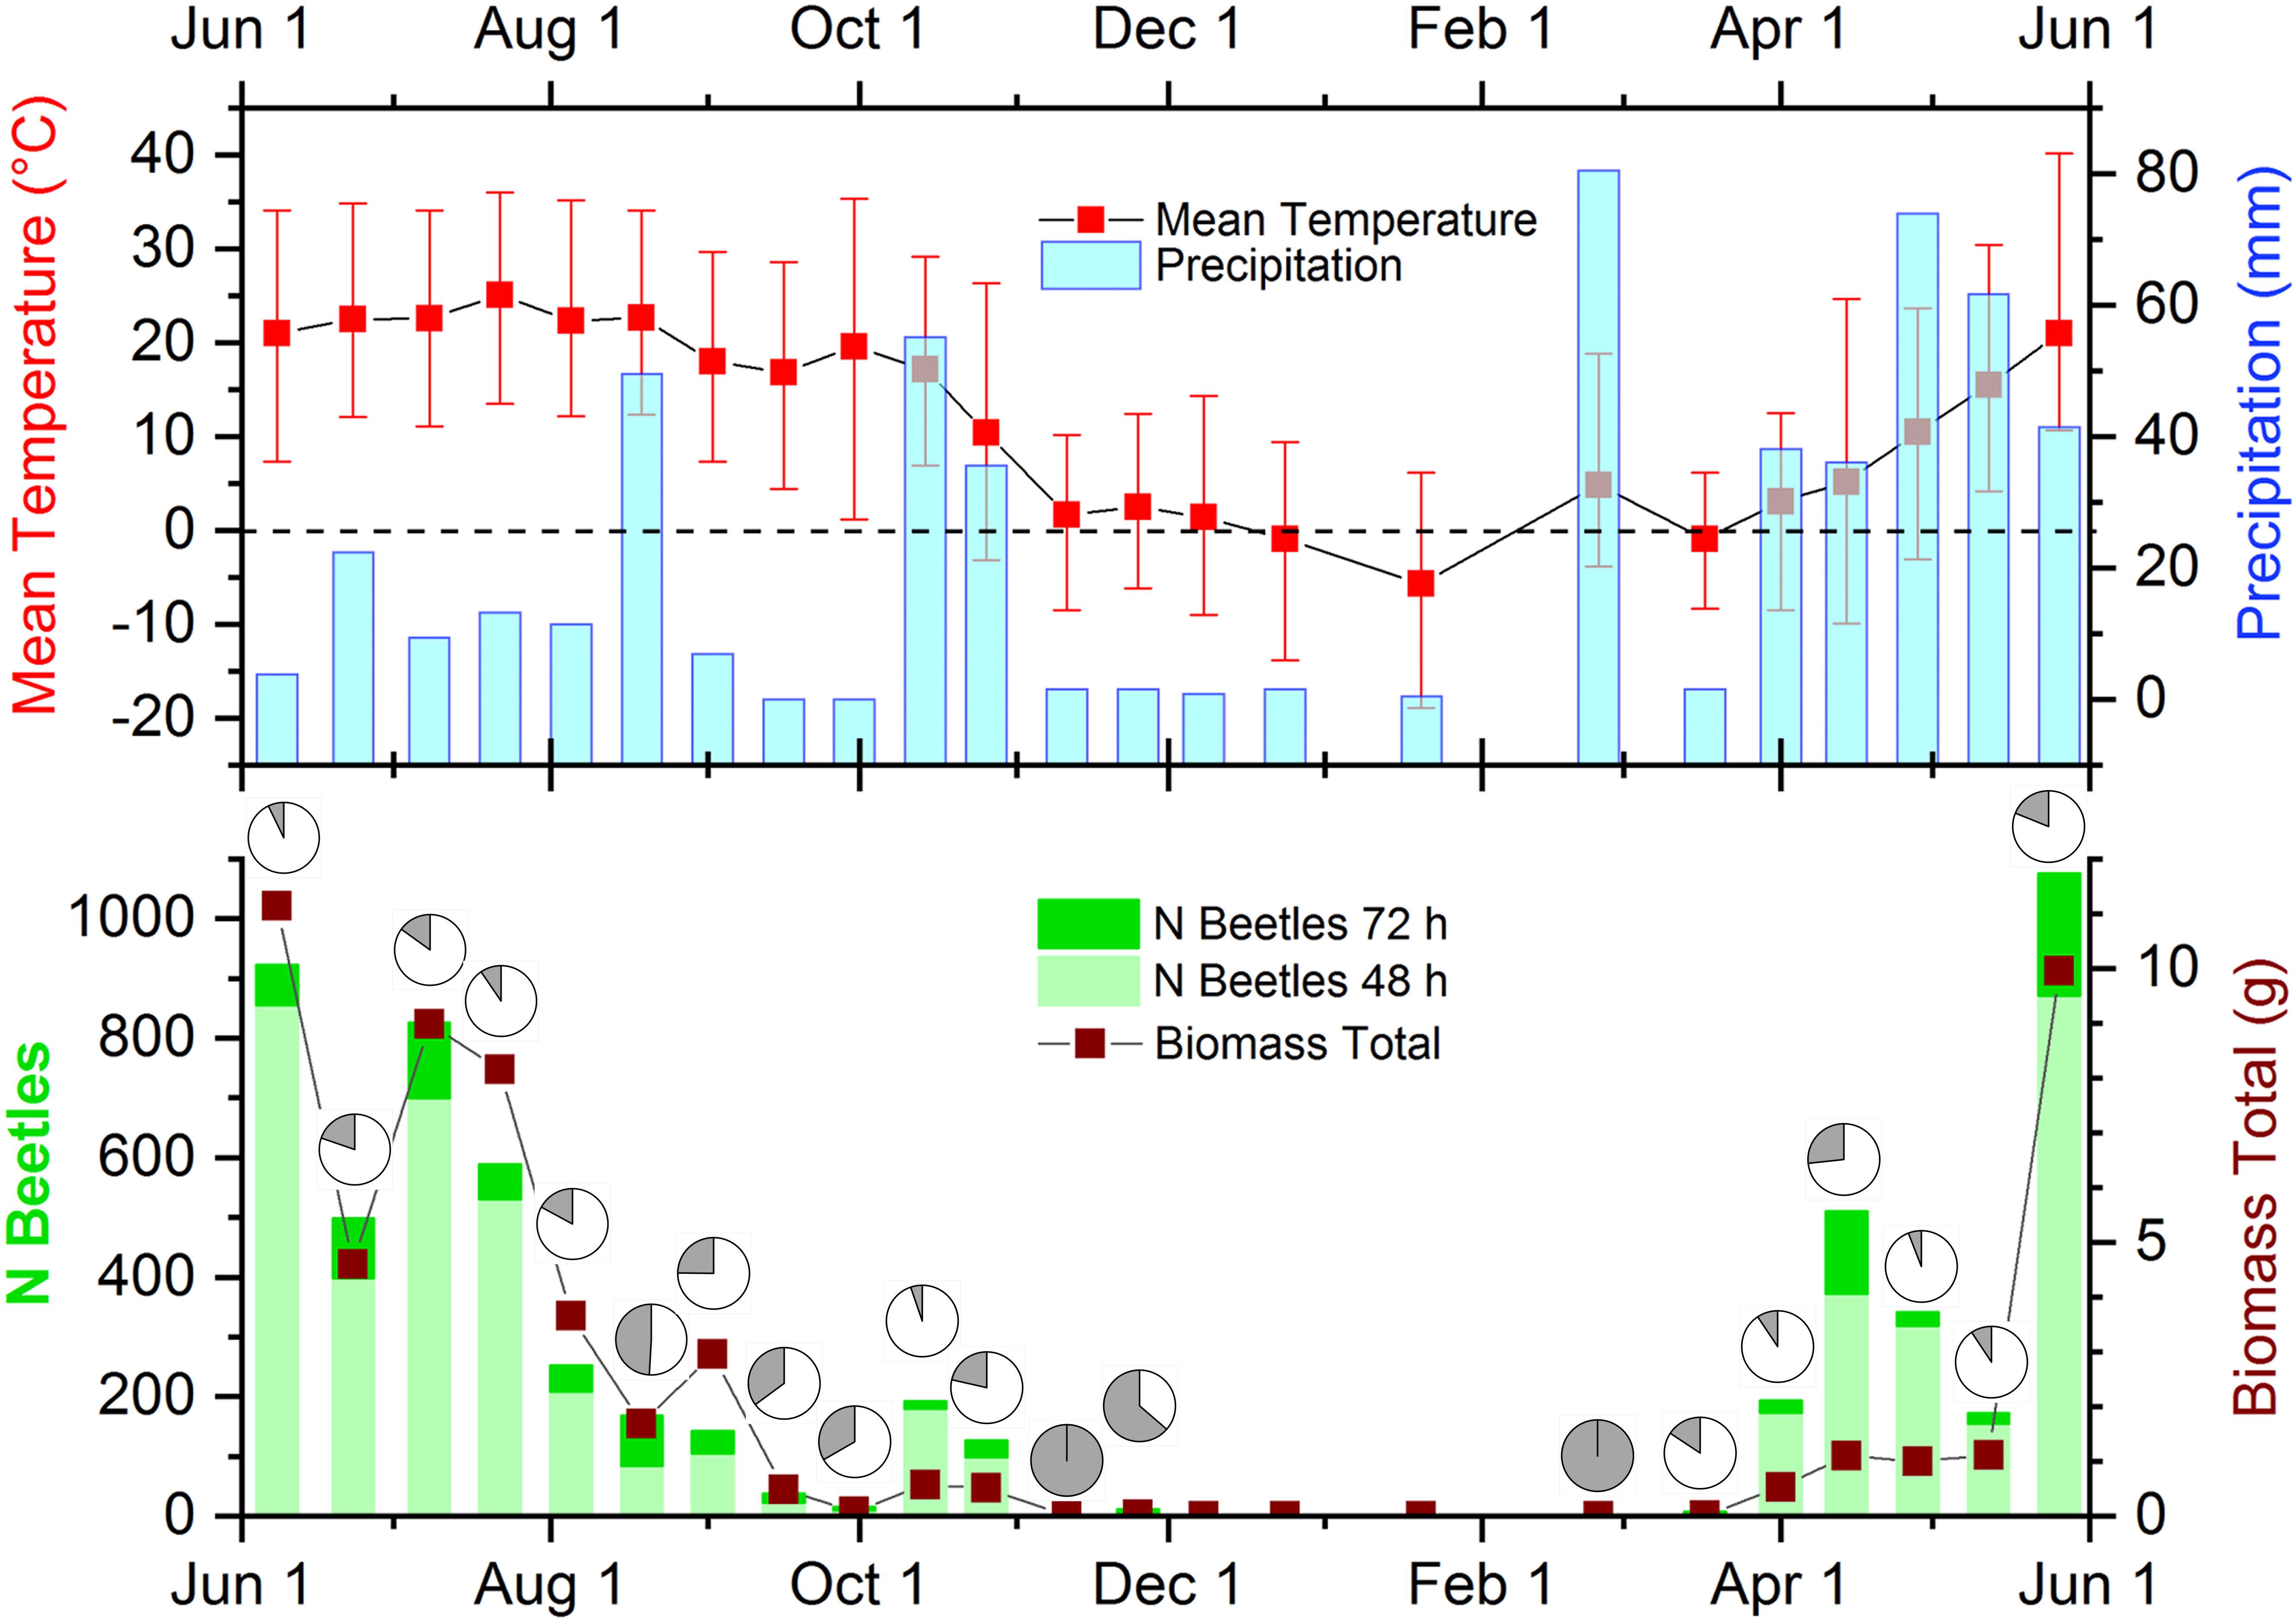
Figure 2. Weather data, beetle abundance in both successional samples, and biomass in the time course of the study. (Upper) Mean (red squares) and high and low temperatures (red error bars) and precipitation (blue columns) during the sampling days. The dashed line indicates the freezing point. (Lower) Beetle abundances as stacked columns with bright green indicating beetle abundances after 48 h exposure and dark green portions showing beetle numbers after 72 h of exposure. The wine-colored line and squares display beetle biomass collected on the sampling days. The dark sectors of the pie charts show the percentage of beetles sampled after 72-h of exposure in each biweekly sample. Image modified from Wassmer (2020).
During the period between May and September, species richness and diversities calculated from abundances and biomass were above the average for each month (Supplementary Figure S3). In March, April, October and November, diversities and species richness were much lower and none or only a few species occurred between December and February. Based on abundances, all metrics besides species richness gradually decreased from May to September but reached intermittent minima in August (Supplementary Figure S3A). The diversity metrics calculated from biomass followed the same trends, but June was more diverse than May (Supplementary Figure S3B). In addition, diversities based on biomass were consistently lower than diversities based on abundance.
Seasonal Changes in Beetle Distribution Over the Successional Stages
Numbers and percentages of total beetle abundances in 72-h exposed dung fluctuated throughout the year (Figure 2, lower panel). There was no obvious relationship between the weather conditions on sample days and the number or percentages of beetles found in the more aged dung samples (Figure 2, both panels). I calculated pairwise correlations between weather parameters (mean, minimum and maximum temperatures, and precipitation) and the numbers and percentages of beetles in 72-h exposed dung and found significant positive correlations between mean and maximum temperatures and the number of beetles in dung exposed for 72-h, as well as a significant negative correlation between minimum temperature and the percentage of beetles in the later successional sample (Table 1). However, after applying a cautious Bonferroni correction to adjust for multiple calculations by setting the significance threshold to p < 0.001, none of these correlations remained significant and the number of beetles in the 72-h sample showed only a significant correlation to the total number of beetles in both successional samples.
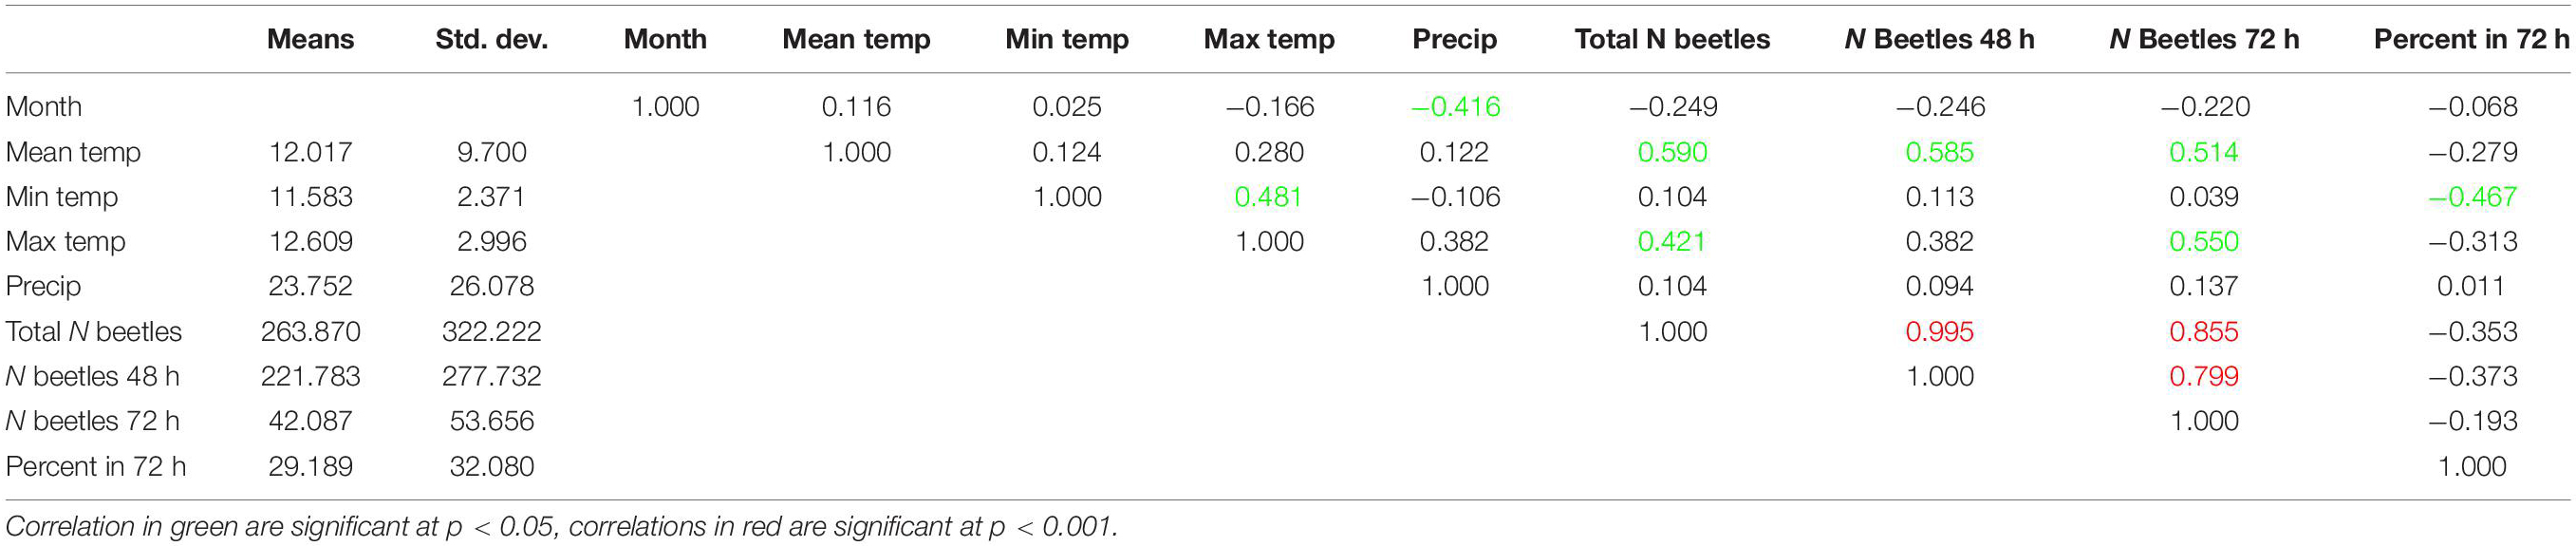
Table 1. Correlation matrix between key weather elements and the seasonal distribution of beetle abundances on the exposure classes.
The phenological patterns of many species showed a non-uniform distribution into the two exposure classes over the biweekly samples (Figures 4–8).
Monthly Dominance Structures Moved to Supplementary Materials 1.1
Supplementary Figures S1, S2 show the relative dominance structures of the species community (SC) for all months of the year (2 biweekly samples combined). Supplementary Figure S1 is based on numeric abundances, while Supplementary Figure S2 shows the dominance structures based on biomass.
Similarities Between the Sample Months
I used a UPGMA cluster analysis based on Renkonen’s index (also known as percent similarity) to detect similarities and dissimilarities between sampling months. Based on a minimum similarity of 40% between the sampling months, I was able to define six phenological periods structuring the dung beetle community in South-East Michigan (Supplementary Figure S4). Cluster #1 joined August and September in a late summer/early fall cluster with a similarity of 56.9%. This cluster was closest to cluster #2 (29.9%), which joined June and May with July in a late spring to mid-summer cluster at 52.2%. The months of early spring and late fall formed cluster #4 with 45.6% similarity, which was clearly separated from the late spring to early summer cluster #2 at only 4.5% similarity. November stood alone in cluster 3 with only 7.2% similarity to the early spring/late fall cluster #4. All winter months (December–February) were separated from all other clusters with (almost) zero similarity. Cluster 6 joined the empty samples of December and January, while cluster 5 included only February, which contained only one specimen of Cercyon haemorrhoidalis. The reliability of the cluster analysis was confirmed by a cophenetic correlation coefficient of 0.9774.
Phenological Niche Overlap and Seasonal Segregation
A UPGMA cluster analysis of the phenological niche overlaps between the more common species (5 or more specimen sampled) in the biweekly samples based on Pianka’s niche overlap index identified five clusters at a minimum similarity of 55% (Figure 3).
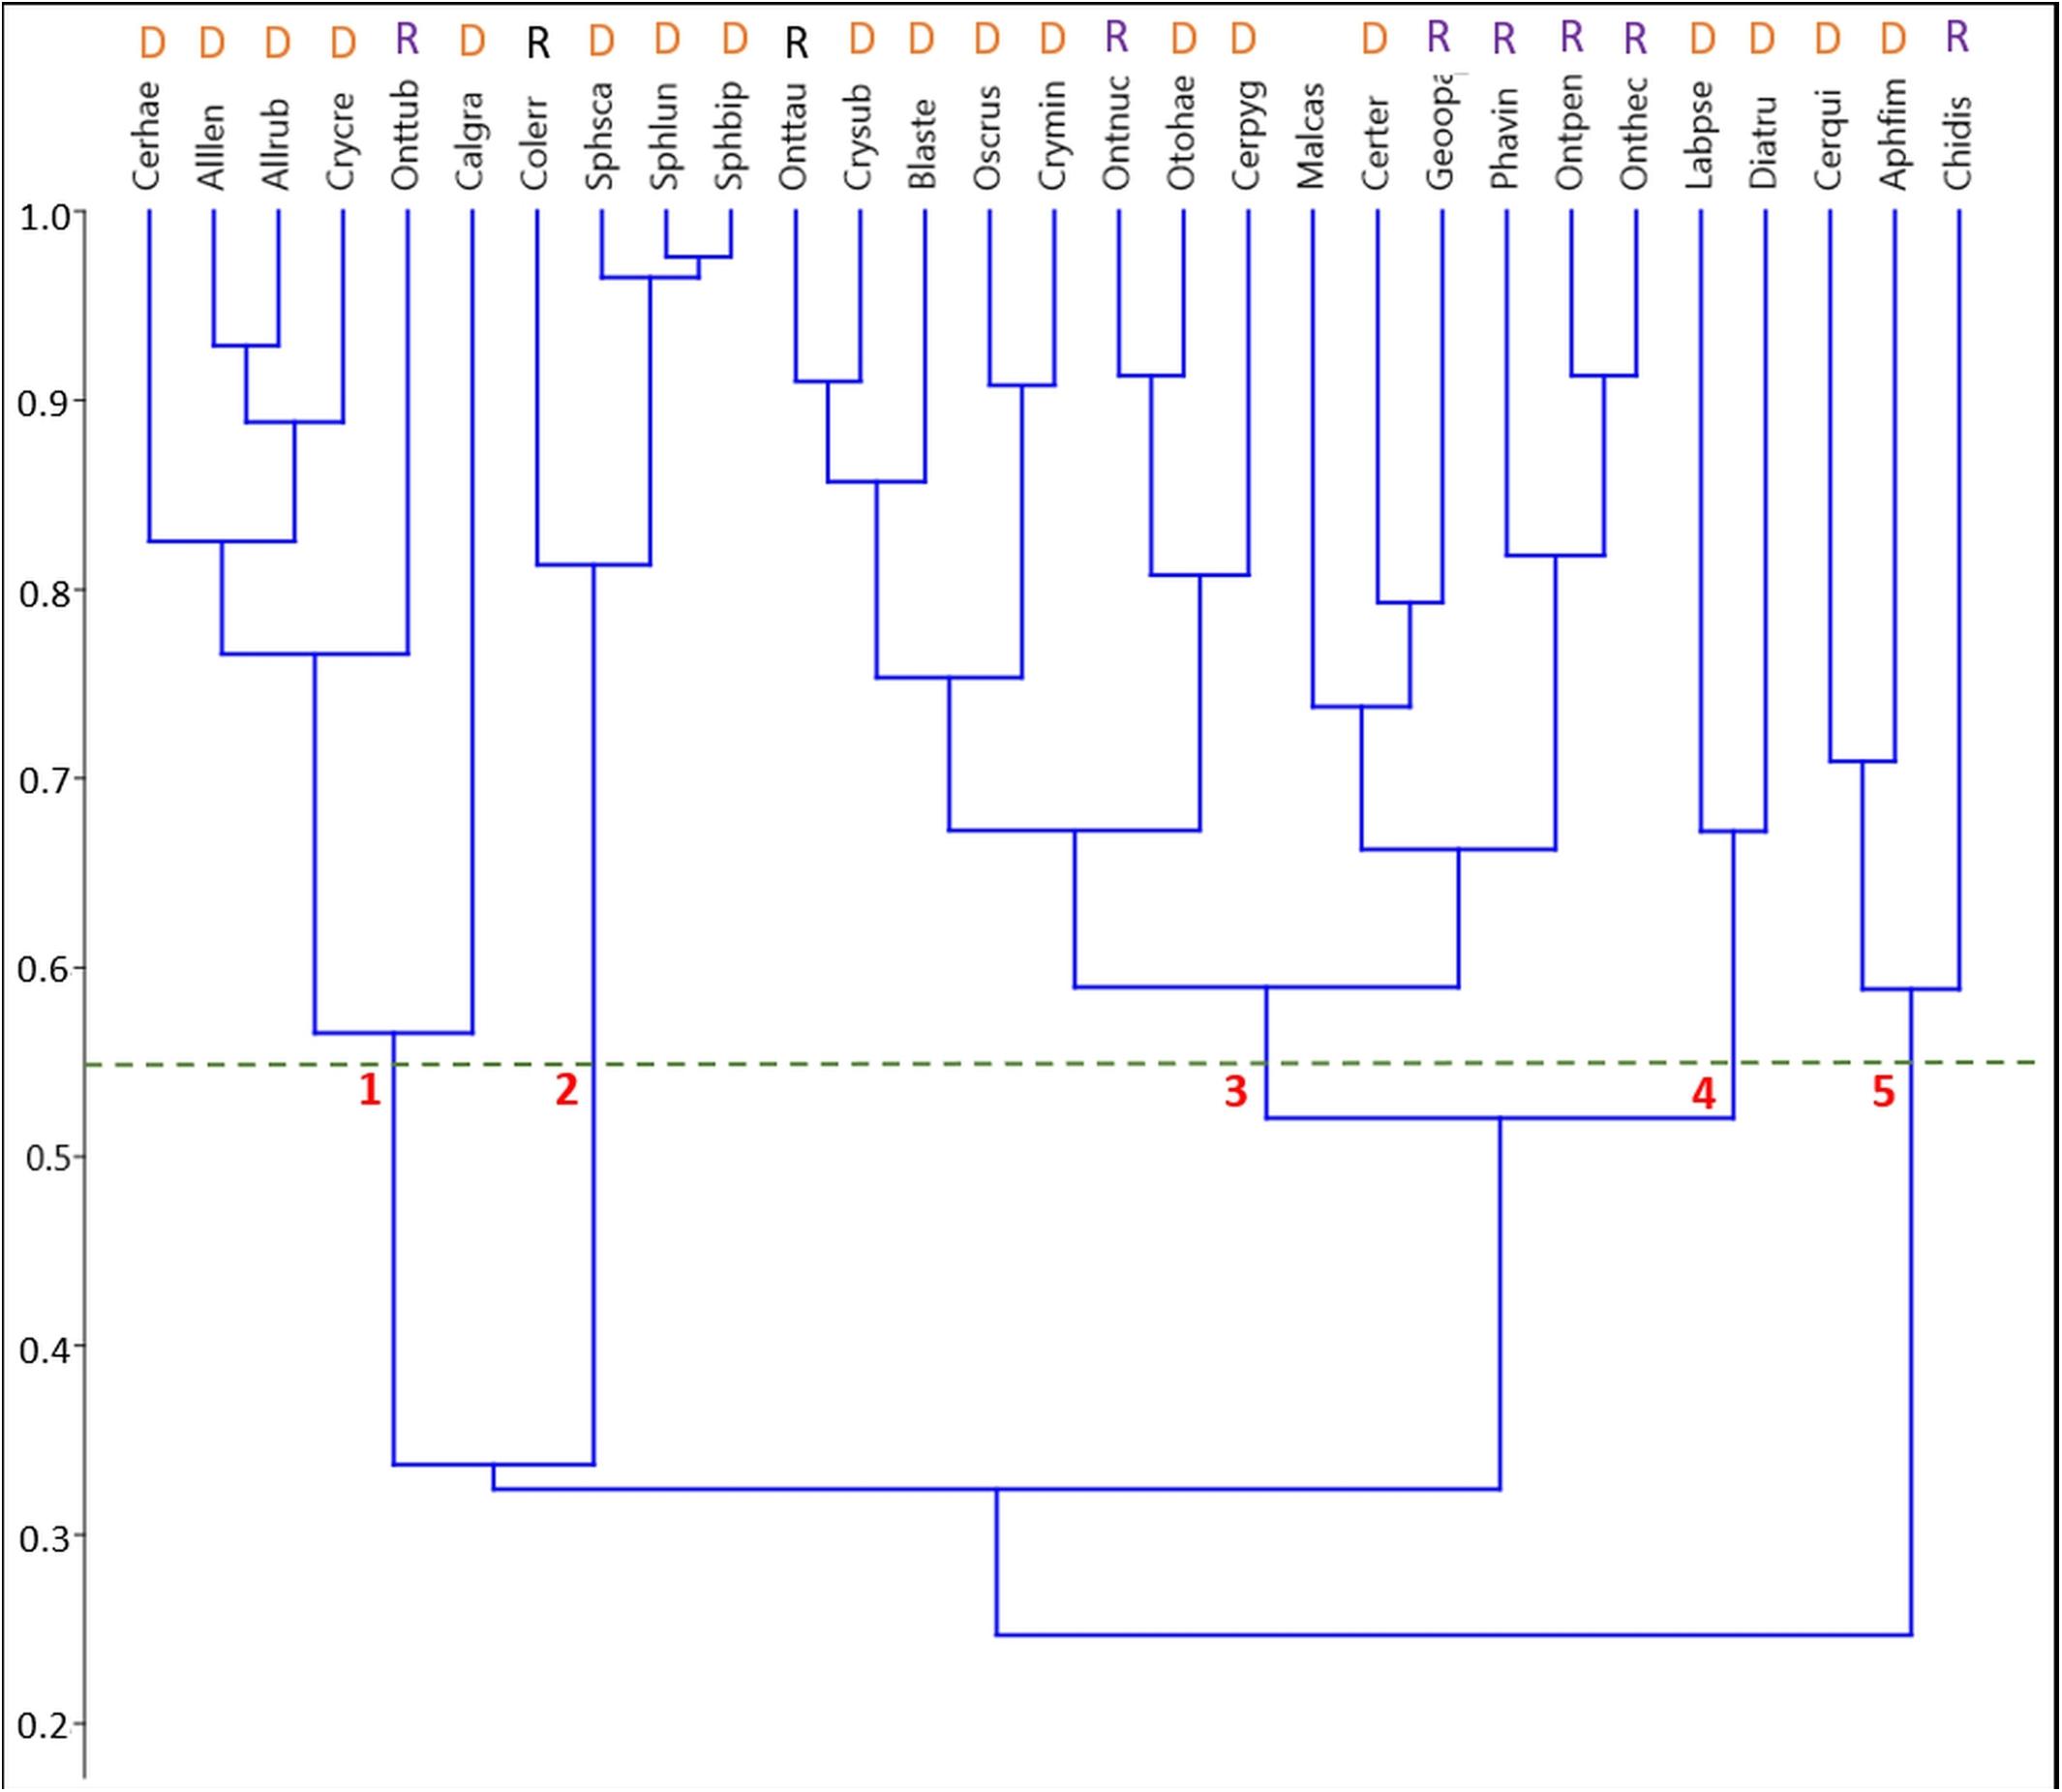
Figure 3. Pairwise species niche overlaps in the unpooled biweekly samples visualized by an unweighted paired-group cluster analysis (UPGMA) based on Pianka’s niche overlap index. Species abbreviations start with the first 3 letters of the genus followed by the first 3 letters of the specific epithet. Refer to Supplementary Table S1 for a list of all species in this study. At an overlap of 55%, 5 clusters are distinguishable comprising of 2, 3, 4, 6, and 14 species. Classification into functional groups: D, Dweller; R, Relocator.
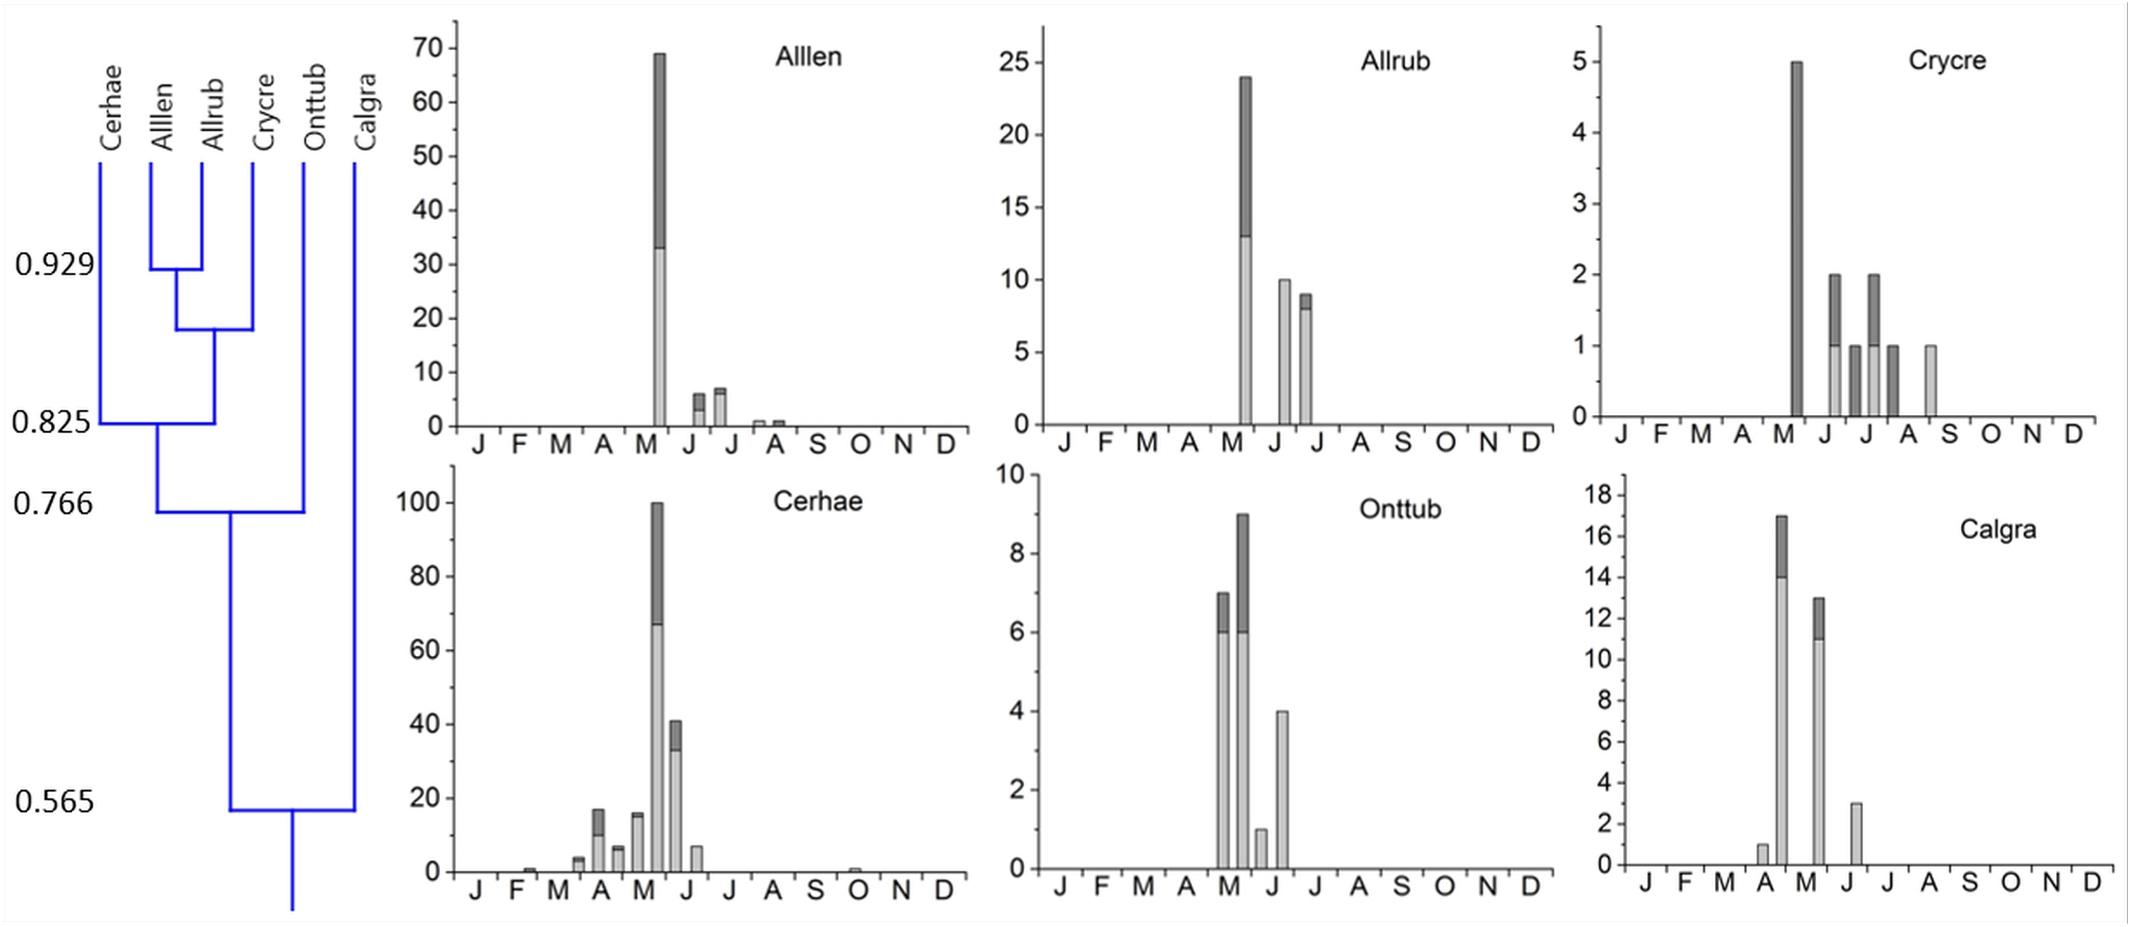
Figure 4. Phenological similarity of coprophilous beetles in cluster 1 based on a niche overlap of 55% as shown in Figure 3 and the small insert on the very left. The two subclusters were joined at 56.5% overlap. The 6 bar graphs to the right show the abundances of beetles in the biweekly samples. Light gray bar portions indicate beetle abundance after 48 h exposure while dark gray portions show beetle abundance after 72 h exposure. Species abbreviations: Alllen: Alloblackburneus lentus, Allrub: Alloblackburneus rubeolus, Crycre: Cryptopleurum crenatum, Cerhae: Cercyon haemorrhoidalis, Onttub: Onthophagus tuberculifrons, Calgra: Calamosternus granarius. The abscissae provide the first letters of the months of the year.
1. Cluster #1 included two subclusters. Five species occurred mainly from (late) spring throughout summer with one pronounced maximum in late May (Figure 6). This subcluster showed a 56.5% overlap with Calamosternus granarius, which occurred from April until June with a peak in late April. Cluster #1 was jointed to cluster 2 with only a 33.7% overlap (Figure 3).
2. Cluster #2 contained 4 species, the 3 Sphaeridium species and the relocating Aphodiinae Colobopterus erraticus with an 81.3% overlap, occurring from May until July and a single peak in early June (Figure 5). Clusters 1 and 2 were connected to clusters 3 and 4 by only 32.4% (Figure 3).
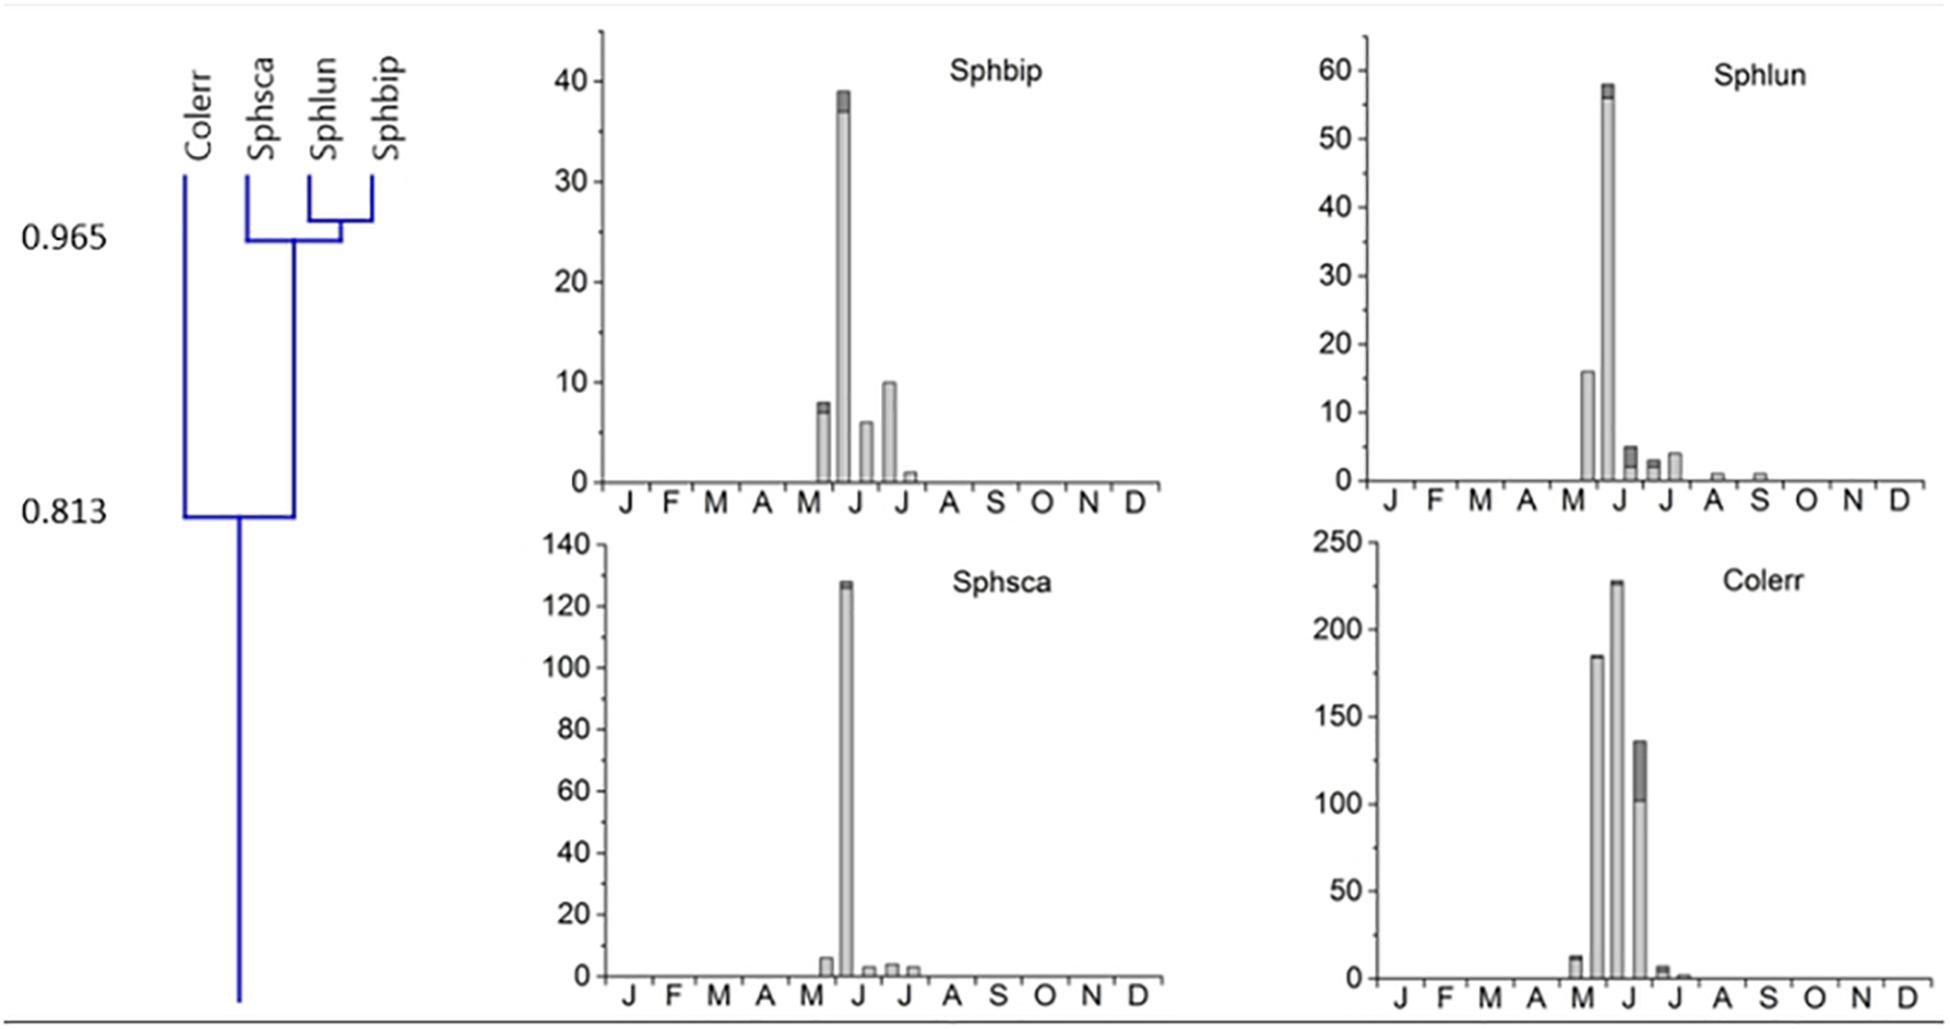
Figure 5. Phenological similarity of coprophilous beetles in cluster #2 based on Figure 3. The cluster is shown in the left panel. Cluster 2 was connected to cluster 1 with an overlap of only 33.7%. The 4 bar graphs to the right show the abundances of the beetle species in the biweekly samples. Light gray bar portions indicate beetle abundance after 48 h exposure while dark gray portions show beetle abundance after 72 h exposure. Species abbreviations: Sphbip: Sphaeridium bipustulatum, Sphlun: Sphaeridium lunatum, Sphsca: Sphaeridium scarabaeoides, Colerr: Colobopterus erraticus. The abscissa provides the first letters of the months of the year.
3. Cluster #3 was the largest cluster comprising of 14 species in two subclusters jointed at an overlap of 59% (Figure 6). The eight species in subcluster 1 were jointed at 67.2% and were found from May until September/October with a clear peak in May and/or July. Otophorus haemorrhoidalis reoccurred slightly in October and Cercyon pygmaeus showed an additional smaller peak in late August/September. Subcluster 2 contained 6 species with an overlap of 66.2% occurring from May/June until September/October and showing gaps in July/August or being concentrated in July/August (Figure 6). Onthophagus pennsylvanicus and to a less clear degree Phanaeus vindex showed two peaks in May and July. Cluster 3 connected to cluster 4 with an 52% overlap (Figure 3).
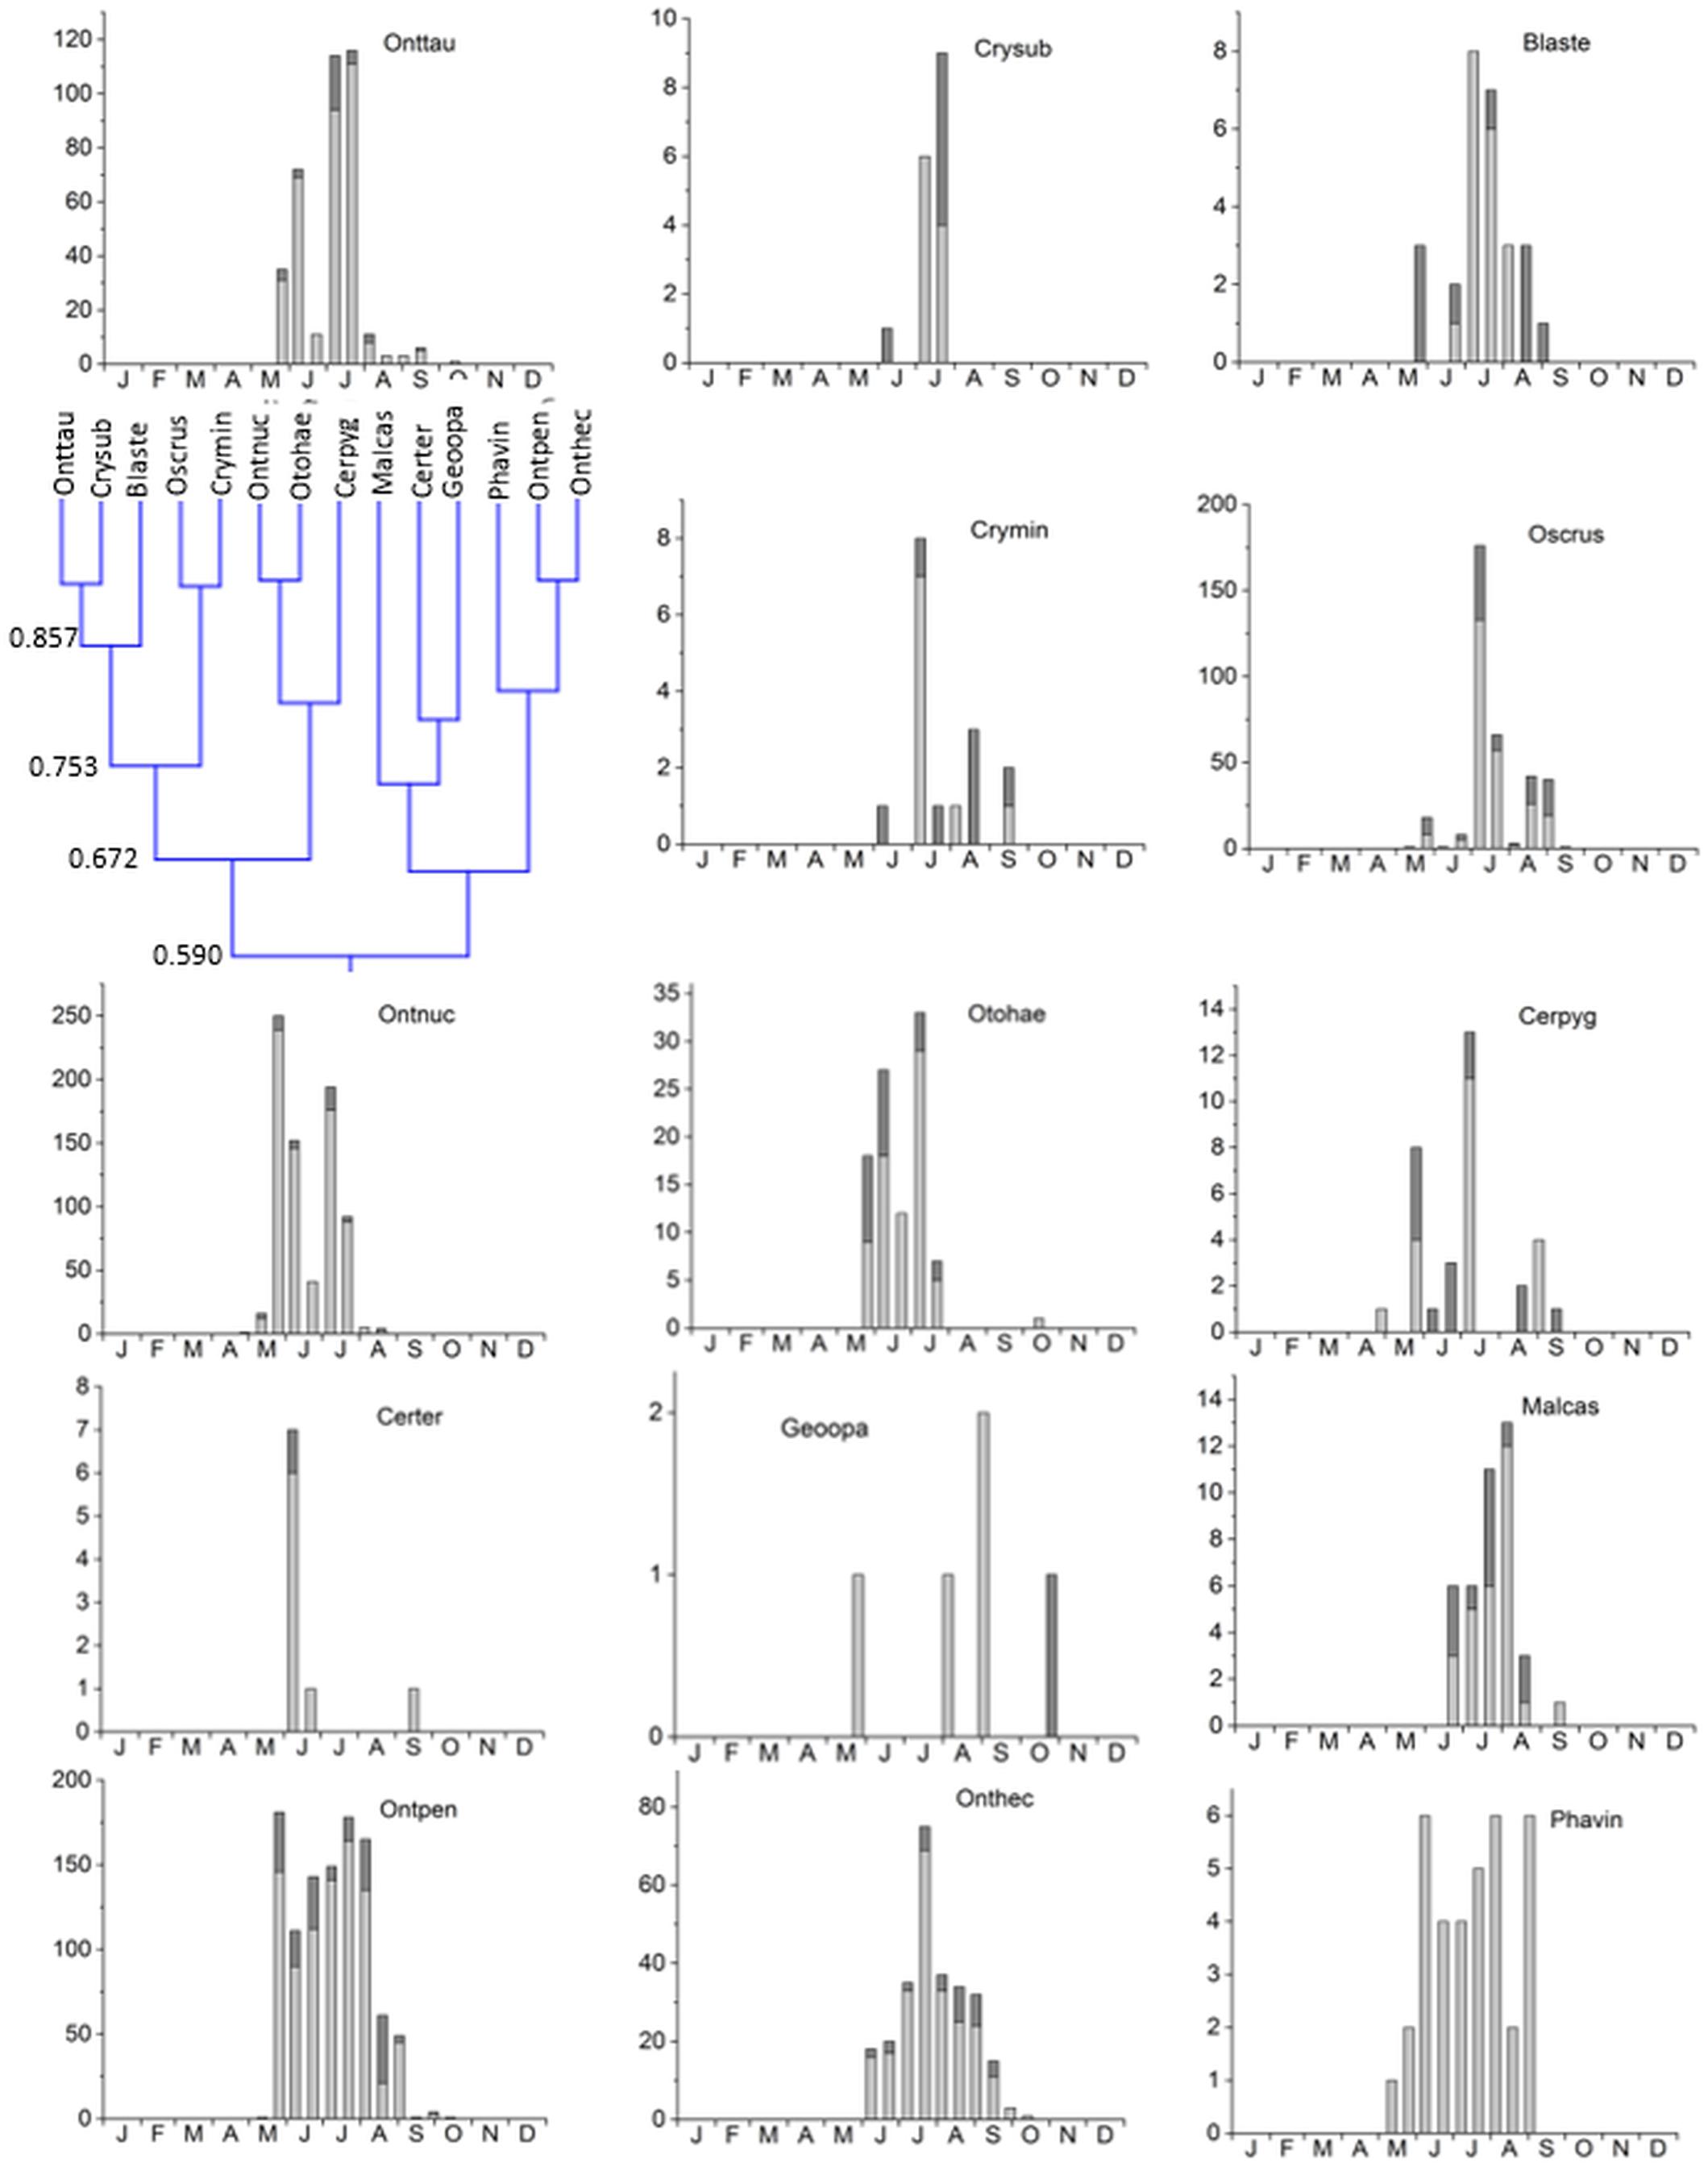
Figure 6. Phenological similarity of coprophilous beetles in cluster 3 based on Figure 3. The clusters and similarity values are shown in the left panel. The two subclusters showed an 59% overlap. The bar graphs show the abundances of the beetle species in the biweekly samples. Light gray bar portions indicate beetle abundance after 48 h exposure while dark gray portions show beetle abundance after 72 h exposure. Species abbreviations: Onttau: Onthophagus taurus, Crysub: Cryptopleurum subtile, Blaste: Blackburneus stercorosus, Crymin: Cryptopleurum minutum, Oscrus: Oscarinus rusicola, Ontnuc: Onthophagus nuchicornis, Otohae: Otophorus haemorrhoidalis, Cerpyg: Cercyon pygmaeus, Ontpen: Onthophagus pennsylvanicus, Onthec: Onthophagus hecate, Phavin: Phanaeus vindex. The abscissa provides the first letters of the months of the year.
4. Cluster #4 contained only two species, Labarrus pseudolividus, which occurred from the end of May until August, and reappeared briefly in small numbers in October, and Dialytes truncates occurring only from the end of August into the beginning of September (Figure 7). The two species in this cluster overlapped at 67.2%.
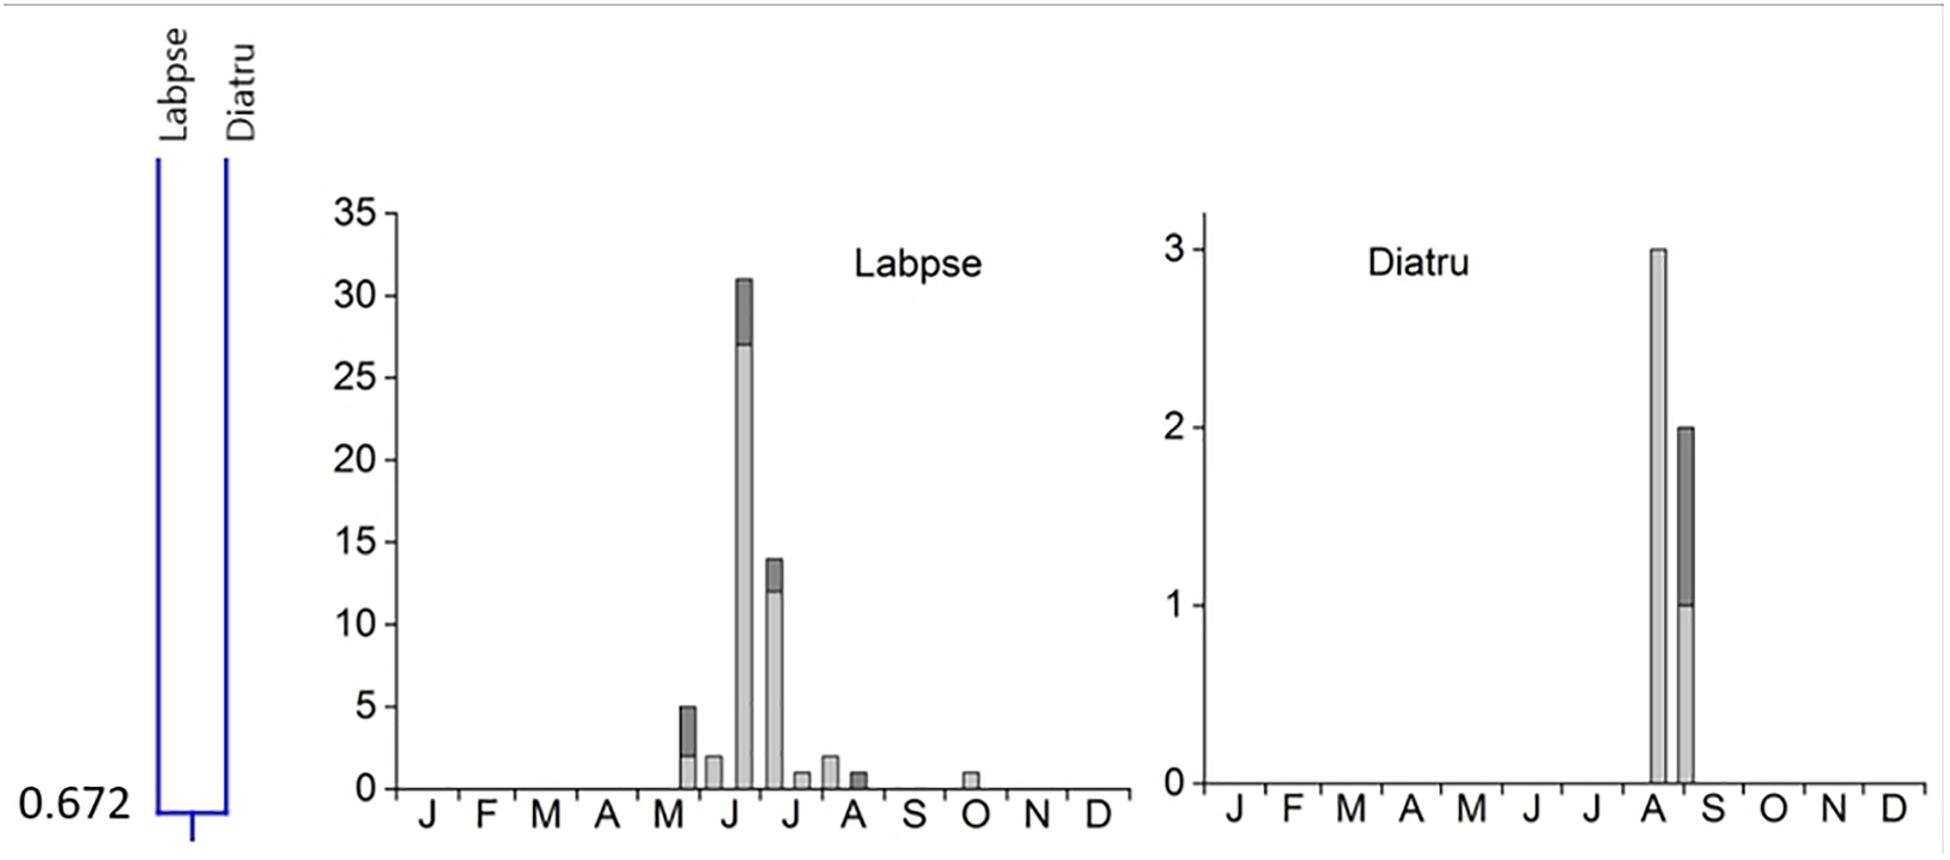
Figure 7. Phenological similarity of coprophilous beetles in cluster 4 based on Figure 3. The clusters and similarity values are shown in the left panel. The species overlapped at 67.2%. The 2 bar graphs show the abundances of the beetle species in the biweekly samples. Light gray bar portions indicate beetle abundance after 48 h exposure while dark gray portions show beetle abundance after 72 h exposure. Species abbreviations: Labpse: Labarrus pseudolividus, Diatru: Dialytes truncates. The abscissa provides the first letters of the months of the year.
5. Cluster #5 included 3 species in two subclusters (Figure 8). Cercyon quisquilius and Aphodius fimetarius were overlapping at 70.9% and occurred from mid-April until the beginning of October. They peaked in mid-April and again between May and July – A. fimetarius also in September. The second subcluster included only one species, Chilothorax distinctus, which occurred from March until May and September until November and was the only species with a clear summer gap in the phenology pattern. The two subcluster showed an 58.9% overlap. Cluster 5 connect to clusters 1–4 only by an overlap of 24.7% (Figure 3).
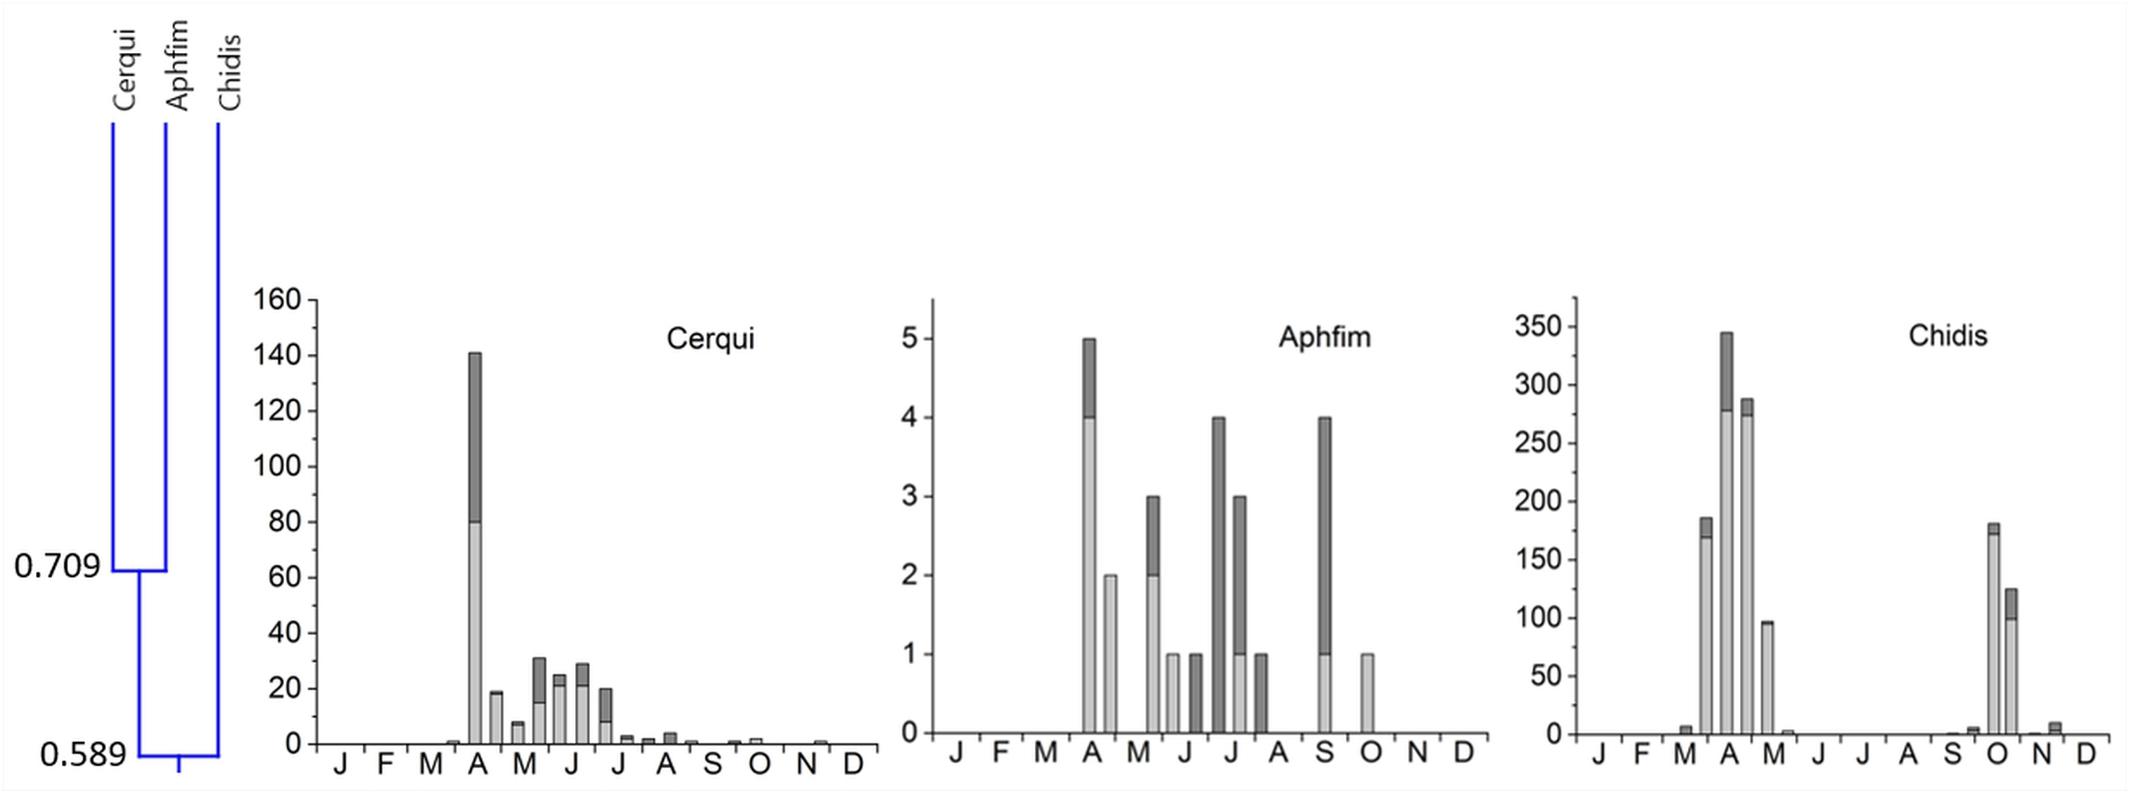
Figure 8. Phenological similarity of coprophilous beetles in cluster 5 based on Figure 3. The cluster and similarity values are shown in the left panel. Cluster 5 connected to clusters 1–4 by an overlap of only 24.7%. The 3 bar graphs to the right show the abundances of the beetle species in the biweekly samples. Light gray bar portions indicate beetle abundance after 48 h exposure while dark gray portions show beetle abundance after 72 h exposure. Species abbreviations: Cerqui: Cercyon quisquilius, Aphfim: Aphodius fimetarius, Chidis: Chilothorax distinctus. The abscissa provides the first letters of the months of the year.
An analysis of niche overlap based on the ROSARIO null model for continuous temporal data (Castro-Arellano et al., 2010) suggested a higher mean overlap (observed mean = 0.38692) than expected by chance in 10,000 randomization; the mean of simulated indices was 0.15346 ± 0.01113 [p (observed ≤ expected) < 0.0001] suggesting a significant overlap of the community. The reliability of the cluster analysis was confirmed by a cophenetic correlation coefficient of 0.720.
Phenological Segregation in Functional Groups
The phenological patterns of relocators (Sladecek et al., 2013) with the highest biomass showed considerable seasonal segregation (Figure 9). While Chilothorax distinctus did barely overlap with any other relocator, the other species showed overlap during some months but also periods of seasonal segregation or their maxima at different periods of time. The average niche overlap of these species was about 50.8%.
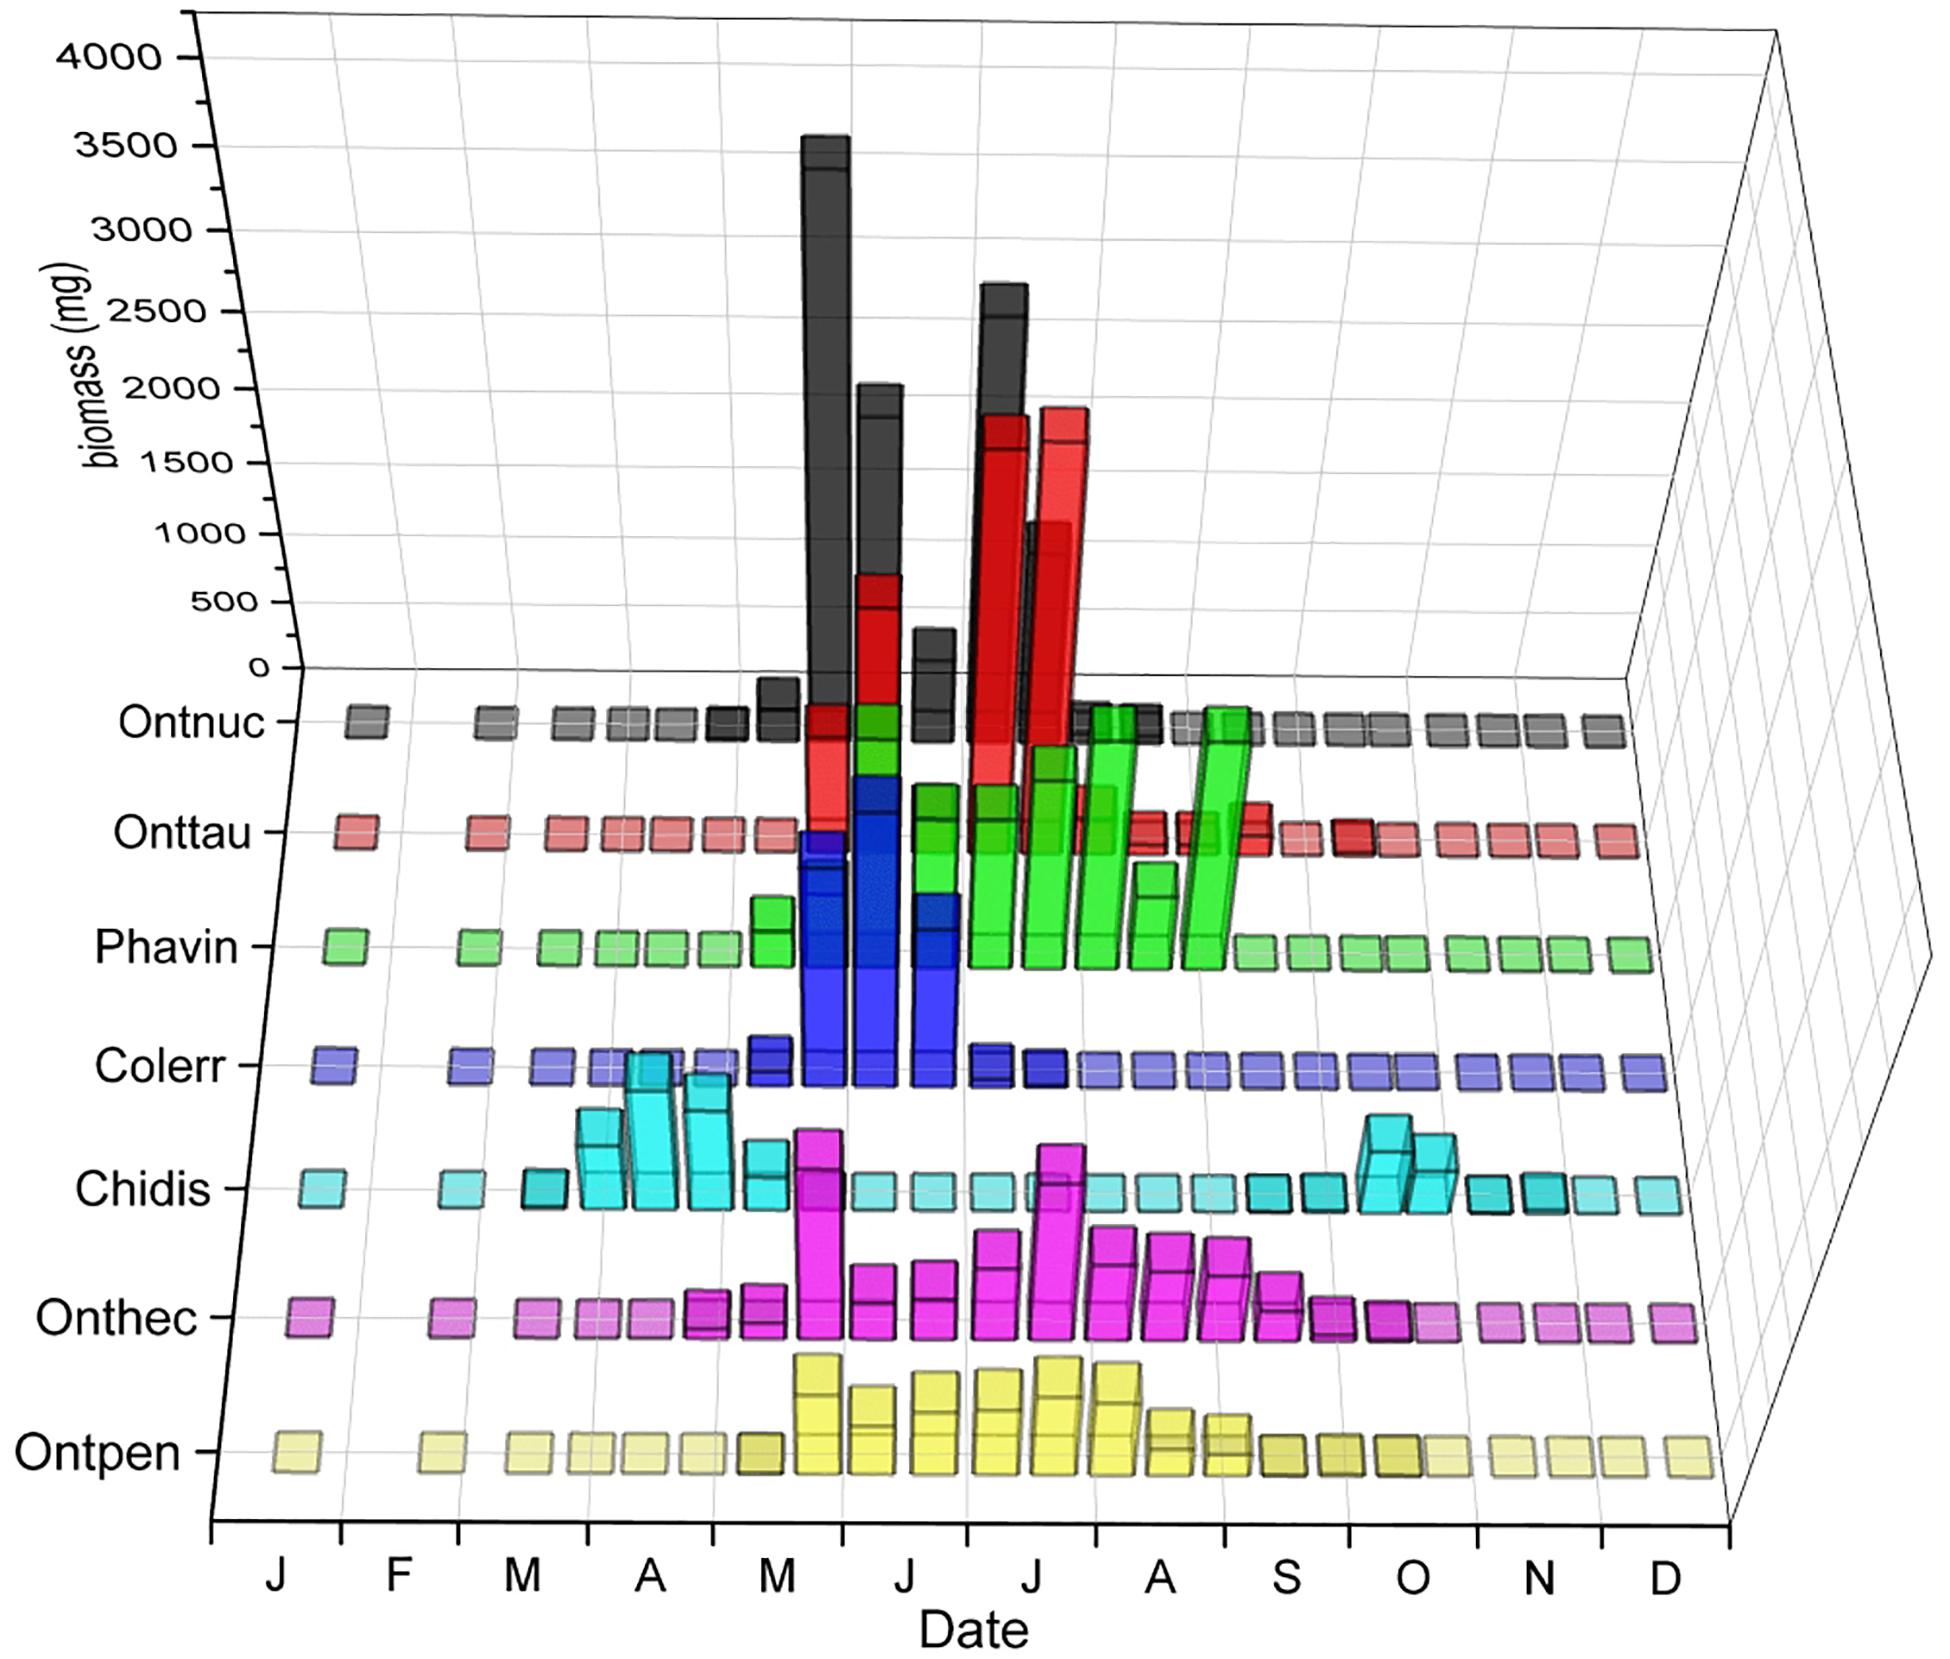
Figure 9. Seasonal segregation of relocators with the highest biomass including the paracoprid Scarabaeinae Phanaeus vindex and four of the five species of the genus Onthophagus, as well as two Aphodiinae species, Chilothorax distinctus and Colobopterus erraticus that oviposit in the soil away from the dung pat. The x-axis provides the first letters of the months of the year. The ordinate displays the biomass of beetles in the biweekly samples in mg. The z-axis shows the abbreviated species names – from front to back: Ontpen: O. pennsylvanicus, Onthec: O. hecate, Phavin: Phanaeus vindex, Onttau: O. taurus, Ontnuc: O. nuchicornis.
Mean overlap between all relocators was about 48.4% compared to the mean overlap between all species of 38.6% (Table 2). While C. distinctus barely overlapped with any other relocator (mean overlap of only 2.7%), the other species showed overlap during some months but also periods of seasonal segregation when their maxima occurred at different periods of time (Figure 9). For example, the biomass of Colobopterus erraticus and Phanaeus vindex was quite high in both June samples during minima of both Onthophagus pennsylvanicus and Onthophagus hecate and for one of the June samples also Onthophagus taurus and Onthophagus nuchicornis. In addition, P. vindex had maxima in late August and late September, when all other species had lower biomass or were declining. However, the mean overlap of just the Onthophagus species in this study was 66.2% (Table 2). Native and introduced Onthophagus species overlapped at about 64.7% – slightly below the mean overlap between all six Onthophagus species (66.2%) and much higher than the mean species overlap of 39.2% overlap in this study (Table 2). The only two Aphodiinae relocators C. distinctus and C. erraticus overlapped only by 1% (Table 2).
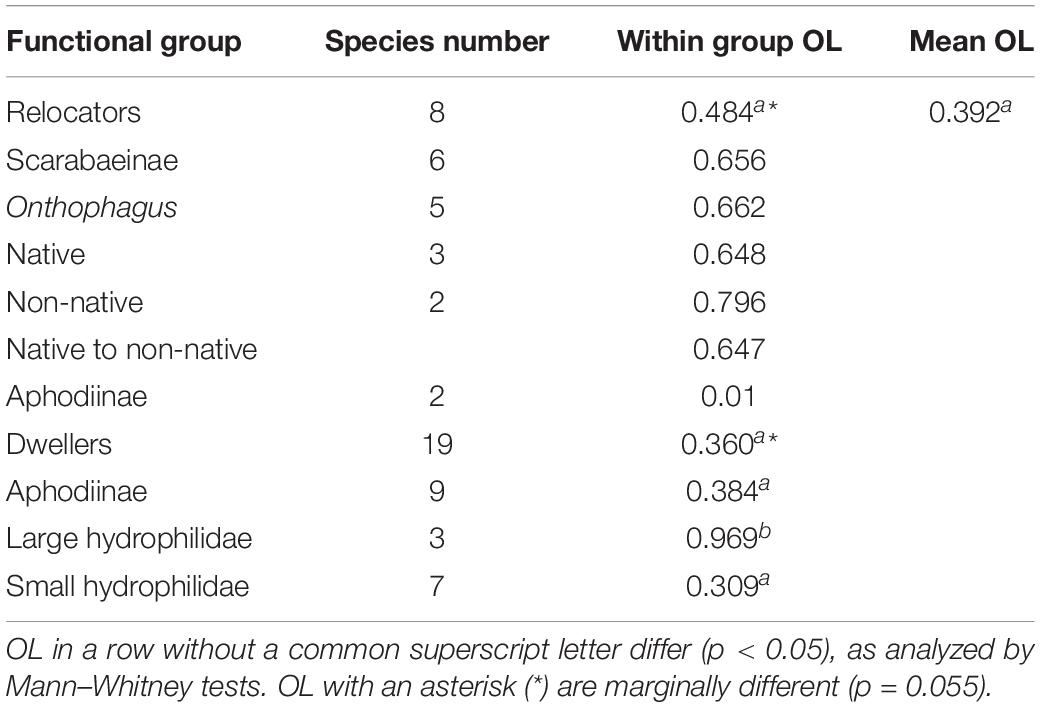
Table 2. Mean niche overlaps (OL) in various functional groups of coprophilous beetles.
The phenology of the nine dwellers with the highest biomass (4 Aphodiinae and 5 Hydrophilidae) overlapped on average by just 39.9% (Figure 10 and Table 2) which is almost the same as the average species overlap of 39.2%. Unlike the relocators, no dweller species was completely segregated from any other species by their phenology (Figure 10) but the overlap between all dweller species (N = 19, 36%) was considerably lower than for relocators (N = 8, 48.3%, Table 2) although only marginally significant (Mann–Whitney U = 1850.5, n1 = 171, n2 = 28, P = 0.055, two-tailed). Most species showed one or several gaps in their phenology when other species were present, and the temporal location of peak abundances did rarely coincide between any two species but never for more than two species (Figure 10).

Figure 10. Seasonal segregation of dwellers (endocoprids) with the highest biomass including 4 species of Aphodiinae and 5 species of Hydrophilidae. The abscissa provides the first letters of the months of the year. The ordinate displays the biomass of beetles in the biweekly samples in mg and is broken between 375 and 1,125 to adjust for the high biomass of Sphaeridium scarabaeoides in early June. The z-axis shows the abbreviated species names – from front to back: Aphfim: Aphodius fimetarius, Calgra: Calamosternus granarius, Cerqui: Cercyon quisquilius, Otohae: Otophorus haemorrhoidalis, Sphbip: Sphaeridium bipustulatum, Sphlun: Sphaeridium lunatum, Oscrus: Oscarinus rusicola, Sphsca: Sphaeridium scarabaeoides.
Aphodiinae dwellers overlapped on average by 38.4%, small hydrophilid dwellers by 30.9%, and large Hydrophilid dwellers of the genus Sphaeridium overlapped by 96.9% – compared to the mean species overlap of 39.2% for all species (Table 2).
Discussion
Seasonal Climatic Changes Are Reflected in Beetle Abundances, Biomass, and Biodiversity
Coprophilous Scarabaeoidea and Hydrophilidae were abundant between June and the beginning of September (Figure 2, lower panel). This corresponds well to mean temperatures above 10°C (Figure 2 upper panel), as previously suggested by Bertone et al. (2005) for the Piedmont region of North Carolina. In contrast to their observations, low precipitation at maximum temperatures of more than 30°C did not lead to reduced beetle counts in the current study. The difference cannot be attributed to differences in the sampling technique as previously suggested (Wassmer, 2014) as the current study used a similar sampling technique as the study from North Carolina. Instead the difference is more likely due to the geographically more Northern location of the current study site (approx. 710 km), which determines local weather beyond the two parameters under analysis (Supplementary Figure S3).
The lack of any dung beetles from November until March (winter gap) coincides with daily mean temperatures around and below the freezing point (Figure 2, upper panel). The time course of the major weather parameters (temperature and precipitation) and beetle abundances in the current study matched almost perfectly the pattern that I found in a previous study located less than 10 miles away (Wassmer, 2014). In the current study, beetle biomass followed the same general time course but showed a higher biomass than abundance peak at the beginning of September due to the large Scarabaeinae Phanaeus vindex. Small abundance peaks in October were matched by even smaller biomass peaks due to the high abundance of the small Aphodiinae Chilothorax distinctus. In SW-Germany, the winter gap in beetle abundances and biomass started also in November but ended earlier in mid-March with already high abundances and biomass in contrast to both studies from Michigan (Wassmer, 1994). At least some beetles were found during every winter month in SW-Germany, even during the most extreme weather in January. The winter gap was even interrupted by a distinct peak in abundances at the beginning of December. Due to the vicinity of the Great Lakes, the climate in Adrian, Michigan is less continental and similar to SW-Germany with ample precipitation in all months and comparable monthly mean temperatures. However, between November and March mean temperatures in Adrian are approx. 3°C lower than in SW-Germany (Supplementary Figure S3). This seemingly small difference most probably causes the dramatic severity of a 5-month phenological winter gap in the Great Lakes region (Supplementary Figure S3). In the current study from Michigan, biodiversity and species richness showed high values from May until September and substantial lower values from October until April (Supplementary Figure S3). In contrary to this, biodiversity and species richness indicated a 2 months longer productive season from April until October in SW-Germany (Wassmer, 1994), which can again be explained by the much harsher winter climate in the Great Lakes region of North America adding two additional months of average low temperatures below freezing (Supplementary Figure S3).
Seasonal Changes in Beetle Distribution Over the Successional Stages
Numbers and percentages of total beetle abundances in the later successional stage collected after 72-h fluctuated throughout the year (Figure 2, lower panel) but were not significantly correlated to temperature or precipitation but only to the total number of beetles collected in both successional stages (Supplementary Table S1).
The combined successional and phenological patterns of individual species (Figures 6–10) can only be compared to two previous studies presenting data on both temporal niche dimensions. Menéndez and Gutiérrez (1999) reported the successional mean occurrences (SMO) for several species and genera collected in May and again in July for a mountainous area in northern Spain (Picos de Europa). The SMO of C. erraticus dropped from 3.00 to 1.00, indicating a 3 times higher preference of this species for fresh dung in July compared to May. My data from SE-Michigan show the opposite with more beetles found in older dung between the end of June and July (Figure 5). For A. fimetarius, the Spanish study reports an increase of the SMO from 3.0 in May to 7.95 in July, which agrees well to my results showing an already relatively high percentage of the species occurring in older dung in April and May increasing to about double the proportion in July, August and September (Figure 8). The last species present in both studies, O. haemorrhoidalis, went from a SMO of 8.90 in May to 5.64 in July. In the present study, this species was much less abundant in older dung in May but was collected in even less proportions from aged dung in July thus generally showing the same trend as in Spain (Figure 6). In addition to these three Aphodiinae species, the study by Menéndez and Gutiérrez (1999) also provides information on the genera Sphaeridium and Cercyon. The SMO for Sphaeridium changed from 2.7 in May to 1.8 in July, which agrees to my data for Sphaeridium scarabaeoides and Sphaeridium bipustulatum, whereas in my current study Sphaeridium lunatum increased its preference for more aged dung in July (Figure 5). However, these differences are miniscule as all three species show the highest overall preference for the freshest dung in the current SC (Wassmer, 2020). The genus Cercyon was more heterogenous in the current study than in the study by Menéndez and Gutiérrez (1999), in which the genus went from a SMO of 4.1 in May to 2.5 in July. However, I also found a decrease from spring to summer in the current study for the most abundant species C. haemorrhoidalis (Figure 4), C. pygmaeus (Figure 6), and C. quisquilius (Figure 8).
Hanski (1980a) provides data about changes in the SMOs from mid-April to mid-September for the following Hydrophilidae in England and S-Finland that also occurred in the current study from SE-Michigan: Sphaeridium scarabaeoides and S. lunatum, as well as the following Cercyon species, C. haemorrhoidalis, C. pygmaeus, and C. quisquilius. All species showed a reduction of the SMO in July/August to at least half of the May value. This corresponds generally well to the data in the current study. The author explains this reduction by the increasing afternoon temperatures in July (and August). While in the current study for some species the number of beetles in the later successional sample slightly decrease from May to July (Figures 6–10), there is no overall trend in beetle numbers or percentages for all species (Figure 2). Neither the number nor percentage of beetles in the later successional sample were inversely correlated with high temperature. Instead, numbers were positively correlated with daily mean and maximum temperatures and percentages were inversely correlated with minimum temperature (Table 1). However, these correlations were below the Bonferroni-corrected significance levels of p < 0.001.
Similarities Between Sample Months
A UPGMA cluster analysis based on Renkonen’s index (percent similarity) identified six clusters representing related phenological periods structuring the dung beetle community in South-East Michigan (Figure 3): late summer until early fall, late spring and early to mid-summer, early spring and late fall, November, and two clusters for the winter months (December–February). Unfortunately, I am not aware of any New World studies using this kind of analysis. Therefore, I can only compare these results to European studies. Using the same similarity measure, Wassmer (1994) described four clusters in a year-long study from SW-Germany: midwinter (January), late fall to early spring but excluding January, late spring to early summer, and midsummer to mid fall. There are some similarities to the current study, especially the late spring to summer groups but in Adrian, this group was split and midfall joined with early and midspring. In addition, the thinly populated late winter samples in the present study were separated from the other winter months that had no beetles. In a whole-year study of a Northern Tunisian pasture, Errouissi et al. (2009) found four phenological groups using a cluster analysis based on the Bray–Curtis dissimilarity, late fall until early spring, midspring to early summer, midsummer to early autumn, and an isolated midfall (October), which corresponds quite well to the four groups in SW-Germany. Almost the same was also found by Agoglitta et al. (2012) in their year-long study from W-Tuscany, Italy using non-metric multidimensional scaling. However, the authors also found transitional months between the summer and winter seasons, March/April and October, respectively, to be different from both summer and winter and close to each other according to the temporal distance axes. In the Maremma Regional Park, the summer and winter seasons clearly fell into two groups that were not further explained. In another study by the same research group studying coprophilous beetles in horse manure from a mountainous region in central-eastern Italy between February and November, Agoglitta et al. (2010) found five clusters at 40% dissimilarity, 3 of which correspond well to the clusters identified for Michigan, August–September, June–July, and February. From the comparison of these few studies, it seems possible that the similarities and differences between the locations were due to climatic differences, especially Mediterranean climates compared to warm-temperate climates. However, it is also possible that different phenological groupings can be influenced by differences in the ecology of the coprophilous beetles in each area.
Phenological Niche Overlap
A UPGMA cluster analysis based on phenological niche overlaps (Pianka’s index) identified five clusters at a niche overlap of 55% (Figure 3) falling within three broader phenological guilds:
(1) Spring to early summer species.
(2) End of spring to autumn species.
(3) Early spring to late autumn species and species with a summer gap – seasonally bimodal species.
I will focus my discussion below on the broader ecological implications of the results of the phenological cluster analysis. However, in the Supplementary Materials, section 1.2 “Species-centered discussion of the phenological niche overlap”, I provide comparisons of the phenological profiles of all 29 analyzed species with the literature for the following geographic areas: S-Michigan (Wassmer, 2014), N-Michigan (Rounds and Floate, 2012), Wisconsin (Kriska and Young, 2002), NE-Iowa (Worthington and Larsen, 2010), S-Alberta (Floate and Gill, 1998; Kadiri et al., 2014; Bezanson, 2019), S-Quebec (Matheson, 1987; Levesque and Levesque, 1995), coastal Maryland (Simons et al., 2018), E-Maryland (Price et al., 2012), New Jersey (Price, 2004), Arkansas (Fiene et al., 2011), North Carolina (Bertone et al., 2005), and South Carolina (Hinson, 2011). Reference locations in the Old World were SW-Germany (Wassmer, 1994), Spain (Romero-Alcaraz et al., 1997, 2001) and England (Hanski, 1980b). Additional references are cited in the excerpts.
Spring to Early Summer Species
This phenological guild included clusters #1 and #2 (Figures 5–7). If the species within this phenological guild are truly adapted to the current climatic conditions between spring and early summer at middle latitudes and express little climatic plasticity (Valladares et al., 2014), it can be predicted – as I previously did (Wassmer, 2014) – that more northern populations should emerge from winter later and extend their seasonal reach into the milder summer months, whereas southern populations should appear earlier in spring and disappear earlier in summer. Increasing average temperatures due to the climate crisis should move these species to higher latitudes and elevations (Chen et al., 2011; Dortel et al., 2013; Menéndez et al., 2014; Birkett et al., 2018) and/or advance their phenology into early spring or even the late winter months at their present ranges (Visser and Both, 2005; Forrest, 2016).
The comparison of most of the species within clusters #1 and #2 with the results of studies at more southern and northern locations Supplementary Materials, section 1.2.1 “Spring to early summer species” fits generally well into the predicted patterns for the latitudinal range of the species and therefore supports these predictions. While there is plenty of evidence for a poleward range shift of many plant and animal species (e.g., Parmesan and Yohe, 2003; Lenoir and Svenning, 2013; Mathiasson and Rehan, 2019; Loehle, 2020) and for phenological shifts at the same latitude (Thackeray et al., 2016; Cohen et al., 2018), there are no such studies yet for coprophilous beetles. Therefore, my predictions for latitudinal and phenological shifts cannot be verified yet.
End of Spring to Early Autumn Species
This phenological guild included clusters #3 and #4 (Figures 5, 8, 9). Cluster #3 was the largest cluster comprising of 14 species occurring between early May and the end of September (Figures 5, 8). This supercluster split into four subclusters with at least 70% overlap between the included species. Cluster #4 contained only two species jointed by an overlap of 67.2%.
If – as I previously predicted (Wassmer, 2014), the species occurring only in a unimodal (or possible overlapping bimodal pattern) between the end of spring and autumn are truly adapted to a single time period from late spring/early summer to autumn in the middle latitudes and express little climatic plasticity, it can also be predicted for this phenological guild that more northern populations should emerge later but might not extend their range into late autumn due to the possibility of early frost thus effectively having a shorter phenophase. In contrast, southern populations should appear earlier in spring and disappear earlier in summer in areas with summer drought – or extend their phenophase from early spring to late autumn in areas without summer drought. Increasing average temperatures due to the climate crisis should also move these species to higher latitudes and elevations and/or advance their phenology into early spring or even the late winter months at their present ranges. If summer droughts occur, this phenological guild might become bimodal with a spring and autumn phase and bivoltine if their diapausal stage(s) is/are capable of surviving hot and dry summers and their larvae develop fast enough under these climatic conditions (Forrest, 2016; Kong et al., 2019).
The comparison of many of the species within clusters #3 and #4 with the results of studies at more southern and northern locations Supplementary Materials, section 1.2.2 “End of spring to early autumn species” fits generally well into the predicted patterns for the latitudinal range of the species and therefore provides evidence for the validity of these predictions. Due to the lack of comparable studies for poleward range shift and phenological shifts in coprophilous beetles, my predictions for these shifts cannot be verified yet.
Early Spring to Late Autumn Species and Species With a Summer Gap
This phenological guild included only cluster #5 consisting of three introduced species, the Aphodiinae A. fimetarius, the Hydrophilidae C. quisquilius, which overlapped at 70.9% and occurred from mid-spring until the mid-fall, and the Aphodiinae C. distinctus, which occurred in spring and fall and overlapped with the two other species by only 58.9% (Figures 5, 10). If – as I predicted before Wassmer, 2014) – the observed phenology of the above species at middle latitudes is flexible or if the species are phenologically polymorphic, beetles at more northern latitudes should occur later in spring or at about the same time in summer, and extend their seasonal range into the less extreme summer months, eventually into autumn, and disappear earlier in autumn due to the chance of earlier winter storms. At more southern locations with severe summer droughts, these species should, on the contrary, occur earlier in spring, disappear earlier in summer and reappear later in autumn and stay around until late autumn or even throughout the winter, connecting to the spring without a winter gap. In areas without extreme summer heat and drought, this phenological guild might occur year-round. At their present ranges, rising average temperatures due to the climate crisis should once more move these species to higher latitudes and elevations and/or advance their phenology into the late winter months or throughout the winter. If summer droughts occur, this phenological guild might become increasingly bimodal with a spring and autumn phase if their diapausal stage(s) is/are capable of surviving hot and dry summers or the species might become bivoltine if their larvae develop fast enough under these climatic conditions (Forrest, 2016; Kong et al., 2019). In areas without severe heat and drought over the summer, these species might lack any seasonality and occur year-round in several overlapping generations.
The comparison of the species within cluster #5 with the results of studies at more southern and northern locations Supplementary Materials, section 1.2.3 “Early spring to late autumn species and species with a summer gap” fits well into the predicted patterns for the latitudinal range of the species and therefore provides evidence for the validity of these predictions. Due to the lack of comparison studies for coprophilous beetles, the same reservations as for the previous two guilds apply for the predictions of a poleward range shift and for phenological shifts.
Influence of Other Factors Affecting the Occurrence and Phenology of Coprophilous Species
The above outlined three phenological guilds and the comparison to the phenological patterns reported from other North American and European sites are helpful to understand previous changes in the geographical ranges of coprophilous beetle species and allow to estimate future dynamics, especially the viability of local populations and the spreading of introduced and potentially invasive species under the effects of the man-made climate crisis. However, such projections carry a high degree of uncertainty as globally and locally rising temperatures are not the only drivers of future dynamics. The next two sub sections discuss some of the other important drivers determining the future dynamics.
The climate crisis and thermal tolerance of coprophilous beetles
In addition to the expected temperature rise of 1.7–3.3°C in the Great Lakes region by 2050 and 3.3–6.1°C by the end of this century and a up to 50 days longer frost-free season (Great Lakes Integrated Sciences + Assessments, 2019 based on RCP8.5 and RegCM4), the Great Lakes region already receives 14% more precipitation (compared to pre-1950 levels) and is expected to receive even more precipitation, but not necessarily during all seasons (summer to be drier, Great Lakes Integrated Sciences + Assessments, 2019). Predicting the effects of increasing and erratic precipitation on the phenological and spatial ranges of species in concert with rising temperatures is even more difficult and was not yet been attempted much in coprophilous beetles (Liberal et al., 2011; Guerra Alonso et al., 2020).
In addition to the difficulties in considering the combined effects of multiple climatic parameters, we are just beginning to connect the spatial distributions (elevation and latitude) and the seasonal distribution (phenology) to the thermal tolerance of coprophilous beetles. Birkett et al. (2018) found that the differences in thermal limits among species measured in the lab matched the abundance patterns along the elevation gradient in the field. The same can be expected to underlie the latitudinal distribution of species (Deutsch et al., 2008) and was confirmed by a literature study for the lower lethal temperatures (Addo-Bediako et al., 2000). In addition, species with larger elevational and latitudinal ranges (spatial generalists) show a wider range of thermal tolerance than spatial specialists with a narrow elevational and latitudinal range. Furthermore, Sheldon and Tewksbury (2014) showed that both thermal tolerance and elevational range size of a species increase with the range of the species’ phenological spread. Seasonally widespread species (phenological generalists) as in the early spring to late autumn guild (see section “Early Spring to Late Autumn Species and Species With a Summer Gap”) can be expected to be more resilient to climate change than specialists with a narrow phenological spread (early spring to summer phenological guild, see section “Spring to Early Summer Species”). However, we still do not know enough about the degree of physiological, developmental, and behavioral plasticity and/or (local) adaptation to ambient temperatures for each species or different populations of the same species. These mechanisms could widely affect a species’ (or population’s) vulnerability or resilience against temperature changes (Nyamukondiwa et al., 2018; Terblanche and Hoffmann, 2020) that are seen as a major driver for the alarming world-wide decline of insects (Sánchez-Bayo and Wyckhuys, 2019; Cardoso et al., 2020; Dornelas and Daskalova, 2020; Klink et al., 2020; Montgomery et al., 2020). There is, in conclusion, solid evidence that climate change modifies phenological patterns directly or via species interactions.
Habitat loss and habitat fragmentation
The by far strongest driver of the world-wide insect decline is habitat loss, which is often accompanied by habitat fragmentation while both drivers are reducing connectivity (Cardoso et al., 2020). In the context of this study, it is important to consider that from the 1950s on, agriculture in many countries changed drastically under the increasing pressure to intensify production. The trend might be most severe in the United States, where beef and especially dairy farms shifted almost entirely from a pasture-based production system to confinement feeding operations (Blayney, 2004; Clay et al., 2020). In 2014, 59% of dairy operations in the United States used confinement, 7% used pasture grazing, and 26% used a combination of both strategies (USDA, 2016). This led to a substantial reduction in the pastured acreage and by this to habitat loss and a severe resource shortage for coprophilous beetles. In many areas including SE-Michigan, pastures are now rare fragmented landscape patches embedded in a matrix of unsuitable habitat with substantial distances between pastures subjecting most coprophilous beetles to a very low connectivity (Figure 1). Resource scarcity was found to be most severe for beetles specialized to feed on the dung of large ruminants (Roslin, 2001; Foster et al., 2020), which are unable to substitute their food base with wildlife excrements or other decomposing organic matter. This group includes many of the native coprophilous Scarabaeoidea that transitioned from native wildlife to the abundant food source provided by the introduction of European livestock (Tiberg and Floate, 2011) as well as many of the introduced species (Roslin, 2000). In addition, pasture specialists are more vulnerable to habitat loss than species that can survive in other patches such as forests (Roslin, 2000, 2001). Furthermore, habitat fragmentation threatens species with low dispersal ability for which small body size is a good proxy (Roslin, 2000; da Silva and Hernández, 2015; Foster et al., 2020). Only a few studies yet used Mark-Release-Recapture methods to determine how far coprophilous beetles commonly (or exceptionally) travel. In all studies, most recorded travels occurred within the same pasture and measured only 50–200 m with the longest occasional travels (usually less than 1%) in the realm of 800–1,500 m (Roslin, 2000; Arellano et al., 2008; da Silva and Hernández, 2015). Larger species are often traveling further than smaller species (Roslin, 2000; da Silva and Hernández, 2015; Foster et al., 2020) and diurnal species fly further than nocturnal species (da Silva and Hernández, 2015).
It has been difficult or impossible to decide what aspects of land use change and the resulting landscape mosaic are most detrimental for SCs of coprophilous beetles as many factors are threatening SCs and populations of individual species simultaneously. In a study of dung beetle assemblages in the fragmented Lacandona rainforest in Mexico, Sánchez-de-Jesús et al. (2016) found that the size of remaining forest patches, the overall landscape size and the matrix composition were most responsible for the decline of rainforest species. The authors therefore suggested protecting the largest still remaining forests, increasing the size of smaller forest patches, and improving the matrix quality as the most effective conservation measures. Many cost-effective management strategies in the tropics involve a land-sharing approach allowing agriculture to coexist with forests like silvopasture (Kremen and Merenlender, 2018; England et al., 2020) or multistrata agroforestry (Abbas et al., 2017; Kremen and Merenlender, 2018). Interestingly, similar strategies of land-sharing could offer a solution to the still ongoing decline of pastureland in North America and Europe (Soga et al., 2014; Kremen, 2015; Grass et al., 2019; Case et al., 2020). In their analysis of the drivers of the global decline of insects, Cardoso et al. (2020) stressed that the relative importance of habitat loss and fragmentation depends on the mobility of the insect species and the degree of habitat fragmentation with habitat quality being the main driver of insect species occurrence (and extinctions) in less fragmented landscapes. However, another recent review finds overwhelming support for the habitat amount hypothesis, which states that species richness is more strongly and positively correlated to the amount of habitat than to patch size or isolation (Watling et al., 2020). Despite being undoubtedly a major – if not the major driver of insect extinctions, there is no direct evidence yet if and how landscape processes can influence phenological patterns.
Seasonal Segregation in the Relocator and Dweller Guilds
Seasonal Segregation in the Relocator Guild
The phenological patterns of relocators (Sladecek et al., 2013) with the highest biomass showed considerable seasonal segregation (Figure 9). The mean overlap between all relocators (N = 8) of 48.4% was substantially lower than the mean overlap of 55.8% between 6 relocating Onthophagus species in SW-Germany (Wassmer, 1994). However, if calculating the mean overlap of just the 6 Onthophagus species in this study, the mean overlap was 66.2% compared to 55.8% in Germany. The differences in numbers between the studies could be partially attributed to the use of different niche overlap metrics [Pianka’s niche overlap index in the current study (Pianka, 1973) vs. weighted Colwell and Futuyma niche overlap (Colwell and Futuyma, 1971) in Wassmer, 1994] and by not comparing all the same species at both locations. A high overlap between “Scarabaeinae relocators” was also found by Errouissi et al. (2009) on pastures in Tunisia, by Jay-Robert et al. (2008a) for “soil diggers” in the French Mediterranean, by Jay-Robert et al. (2008b) for “Scarabaeinae tunnelers” in mountain pastures of the Southern Alps, and by Palestrini et al. (1998) for Onthophagus species in low-altitude areas of the Italian Alps.
Native and introduced Onthophagus species overlapped by about 64.7% – slightly lower than the mean overlap between all six Onthophagus species (66.2%) and much higher than the mean species overlap of 39.2% overlap in this study (Table 2). This should most probably cause substantial competition, especially during late spring and mid-summer (Figure 9). However, except for O. tuberculifrons, native species extended their phenology into late summer and early fall when introduced species were less abundant or disappeared. With a phenological overlap of 91.3%, competition should be even more severe between the native O. hecate and O. pennsylvanicus. However, due to their substantial size difference (17.2 mg for O. hecate vs. 3.8 mg for O. pennsylvanicus) competition is likely reduced to tolerable levels by resource partitioning (Hernández et al., 2011; Nervo et al., 2014). This assumption is supported by the fact that the two small native Onthophagus species of similar size, O. pennsylvanicus and O. tuberculifrons showed the 2nd-lowest seasonal overlap of all Onthophagus species pairs of only 48.9%.
Seasonal Segregation in the Dweller Guild
The phenology of the nine dwellers with the highest biomass in Figure 10 (4 Aphodiinae and 5 Sphaeridiinae) overlapped on average by just 39.9%, which is almost the same as the average species overlap of 39.2% (Table 2). No dweller species was completely segregated from any other dweller species, but most species showed one or several gaps in their phenology when other species were more abundant, and the temporal location of peak abundances did only correlate between two species or not at all (Figure 10). All nine Aphodiinae dweller in this study overlapped by an average of 38.4%, all small hydrophilid dwellers of the genera Cercyon and Cryptopleurum overlapped by 30.9%, and the three large Hydrophilidae dwellers of the genus Sphaeridium overlapped by 96.9% (Table 2). In my previous study from SW-Germany (Wassmer, 1994), the 16 Aphodiinae species overlapped on average by 26.1% (significantly less than between groups), eight small Hydrophilidae dweller species of the genus Cercyon overlapped by 37.7% (not significantly different from the mean overlap between genera) and the same three large Hydrophilidae dweller species of the genus Sphaeridium overlapped by 70.8% (significantly higher than between genera). The differences in numbers between the studies could again be caused by different niche overlap metrics (see above under section “Seasonal Segregation in the Relocator Guild”) and by not having all of the same species within the guilds at both locations. However, in contrast to the dwellers of the family Hydrophilidae that show proportionally comparable overlaps, the overlap between Aphodiinae dwellers seems to differ more substantially between the two locations with just average overlap in the current study (38.4%, Table 2) and the lowest overlap of any guild of just 26.1% in SW-Germany (Wassmer, 1994). However, the 16 Aphodiinae in SW-Germany included C. distinctus, C. erraticus, M. prodromus and Chilothorax sticticus, which are now considered relocators (Sladecek et al., 2013) and could have obscured the results for “real” dwellers. Adding the relocators C. distinctus and C. erraticus that both locations shared, reduces the overlap to 33.4%, which makes the percentages for Aphodiinae dwellers in this study more similar to the results from SW-Germany but still not significantly different from the average overlap. It is possible that the difference in the mean overlap of Aphodiinae species at the two locations was caused by the substantially different composition of Aphodiinae species in the two studies (only 8.82 percent similarity) and climatic differences (Supplementary Figure S3).
The significant difference in mean niche overlaps between large and small hydrophilid dwellers at both locations (96.9% and 70.8% vs. 30.9% and 37.7%) are intriguing and indicate a profound ecological difference suggesting severe phenological competition between Sphaeridium species and much lower phenological competition between small Hydrophilidae. Interestingly, the three Sphaeridium species also showed the strongest preference of all coprophilous beetles for freshly deposited cow dung in the recently published sister study of this investigation (Wassmer, 2020). The fast colonization of freshly deposited dung pats by Sphaeridium and its rapid larval development was interpreted as an adaptation to the life cycle of its larvae’s dipteran prey, which develop in only about 5 days from eggs to adults (Otronen and Hanski, 1983; Sowig et al., 1997; Archangelsky, 1999). In the current study, the phenological niche of Sphaeridium was quite narrow ranging only from the second part of May until July (Figure 5). This timing coincides with the peak occurrence of their Dipteran prey species (Sladecek et al., 2017). The evidence from both parts of this study indicates that the temporal organization of both succession and phenology in Sphaeridium optimizes prey access for their larvae.
In contrast to Sphaeridium, small Hydrophilidae dwellers of the genera Cercyon and Cryptopleurum were regularly found in older dung (Wassmer, 2020) and their phenological patterns (clusters 1, 3 and 5, Figures 5, 6, 8) were distinctly different from Sphaeridium (cluster 2, Figures 5, 7) and did not coincide with the peak distribution of coprophilous Diptera (Sladecek et al., 2017). These small dwellers are more than 20 times smaller than Sphaeridium and therefore need much less of much smaller prey and as they stay longer in dung pats, they are less dependent on rapidly developing prey species. Hence, they do not need to match with the increasing or peaking abundance of dipteran prey allowing them to spread over seasons with less dipteran colonization.
Comparison Between the Relocator and Dweller Guilds
The overlap between all dweller species (N = 19, 36%) was considerably lower than for all relocators (N = 8, 48.3%) but only marginally significant (Mann–Whitney U = 1850.5, n1 = 171, n2 = 28, P = 0.055, two-tailed, Table 2). Despite slightly different labels and groupings, e.g., relocators vs. dwellers (Sladecek et al., 2013), Scarabaeidae tunnelers vs. Aphodiinae dwellers (Errouissi et al., 2009), soil diggers vs. Scarabaeinae tunnelers vs. Aphodiinae (Jay-Robert et al., 2008a) or Onthophagus vs. Aphodius species (Palestrini et al., 1998), most studies report a general trend of relocators showing a higher seasonal overlap compared to dwellers, which likely causes more severe competition between relocators than dwellers. It is possible that the higher phenological overlap is tolerable for relocators as they quickly remove dung away from the pats and into the soil thus excluding further competition. This requires that relocators arrive early at a freshly deposited dung pat before the resource gets too dry to be easily relocated and before substantial competition from other coprophagous beetles and Diptera occurs (Menéndez and Gutiérrez, 1999; Sladecek et al., 2013; Wassmer, 2020). On the other hand, it also makes sense that the phenological niche overlaps between dwellers are lower than those of relocators as dwellers are not able to relocate and exclude the needed resources from competition and therefore need to reduce competition by seasonal segregation.
A recent study investigated the influence of experimental warming on the ecosystem services of dung decomposition and the stimulation of plant productivity provided by coprophilous beetles including both relocators (tunnelers) and dwellers (Slade and Roslin, 2016). The authors showed that the specific activities of both guilds were needed to compensate for the effects of the simulated climate change stressing the importance of the conservation of intact SCs of coprophilous beetles that include both guilds.
Conclusion
The present study provides quantitative details about the seasonal patterns of a diverse coprophilous beetle community from Southern Michigan including the winter months. The SC fell into five phenological clusters fitting into three phenological guilds that I compared to the phenological patterns reported from other North American and European sites. These comparisons were helpful to understand previous changes in the geographical ranges of coprophilous beetle species and to a certain extend predict future dynamics, especially about the viability of local populations and the spreading of introduced and potentially invasive species facilitated by the effects of the man-made climate crisis. I discussed other factors that influence the spatial and temporal occurrence of coprophilous beetles and concluded that any predictions about the future of specific populations and SCs should be treated with caution due to the multitude of yet insufficiently known factors. Finally, the phenologies of single species were grouped into relocators and dwellers, the two major functional groups of coprophilous beetles. Similarities and differences between the seasonal overlaps of the guilds were compared to a study from SW-Germany and to the temporal occurrence of the guilds during the heterotrophic succession of dung pats. This revealed profound ecological differences between relocators and dwellers and between large and small relocators of the genus Onthophagus and between small and large Hydrophilidae dwellers.
Future studies could focus on some of the phenological clusters that might be more suited to expand under the changing climate or are more prone to go extinct or be invaded by introduced species. Another avenue worth to be further developed is a systematic study of the influence of body size on the niche overlaps within phenological and functional guilds or their subgroups. It would also be helpful to close the massive knowledge gaps about the larval development and dung and habitat specialization of all coprophilous species to be able to group them less arbitrarily into functional and phenological groups and to allow more reliable predictions about the viability of populations and SCs. This information should be extremely useful for the development of more successful conservation strategies in a world of ongoing habitat loss and man-made climate crisis.
Data Availability Statement
The raw data supporting the conclusions of this article will be made available by the authors, without undue reservation.
Author Contributions
TW conceived, designed, performed the data collection, analyzed the data, and wrote and edited the manuscript.
Funding
This research was funded by the Biology Department of Siena Heights University.
Conflict of Interest
The author declares that the research was conducted in the absence of any commercial or financial relationships that could be construed as a potential conflict of interest.
Acknowledgments
First of all, I want to thank Matt Carpenter and Mac Pettit to allow me on their farms, and Matt Carpenter for collecting fresh dung, and for transportation to and from Mac Pettit’s farm to collect dung during the absence of his herd on Carpenter farm. Paul Skelley from the Florida State Collection of Arthropods helped with the identification of Alloblackburneus and Blackburneus species and Paul Largo with the ID of Ataenius, Maladera, Xenochodaeus, and Anomala.
Supplementary Material
The Supplementary Material for this article can be found online at: https://www.frontiersin.org/articles/10.3389/fevo.2020.563532/full#supplementary-material
References
Abbas, F., Hammad, H. M., Fahad, S., Cerdá, A., Rizwan, M., Farhad, W., et al. (2017). Agroforestry: a sustainable environmental practice for carbon sequestration under the climate change scenarios-a review. Environ. Sci. Pollut. Res. Int. 24, 11177–11191. doi: 10.1007/s11356-017-8687-0
Abot, A., Puker, A., Taira, T., Rodrigues, S., Korasaki, V., and Oliveira, H. (2012). Abundance and diversity of coprophagous beetles (Coleoptera: Scarabaeidae) caught with a light trap in a pasture area of the Brazilian Cerrado. Stud. Neotrop. Fauna Environ. 47, 53–60. doi: 10.1080/01650521.2012.662846
Addo-Bediako, A., Chown, S. L., and Gaston, K. J. (2000). Thermal tolerance, climatic variability and latitude. Proc. R. Soc. Lond. B Biol. Sci. 267, 739–745. doi: 10.1098/rspb.2000.1065
Agoglitta, R., Moreno, C. E., Zunino, M., Bonsignori, G., and Dellacasa, M. (2012). Cumulative annual dung beetle diversity in Mediterranean seasonal environments. Ecol. Res. 27, 387–395. doi: 10.1007/s11284-011-0910-8
Agoglitta, R., Rossini, M., and Zunino, M. (2010). El monitero del cambio climatico y los coleopteros Scarabaeoidea coprophagos (Coleoptera: Scarabaeoidea): Propuesta preliminar. Bol. SEA 46, 181–187.
Albrecht, M., and Gotelli, N. J. (2001). Spatial and temporal niche partitioning in grassland ants. Oecologia 126, 134–141. doi: 10.1007/s004420000494
Alexander, J. M., and Levine, J. M. (2019). Earlier phenology of a nonnative plant increases impacts on native competitors. Proc. Natl. Acad. Sci. U.S.A. 116, 6199–6204. doi: 10.1073/pnas.1820569116
Alvarado, F., Dáttilo, W., and Escobar, F. (2019). Linking dung beetle diversity and its ecological function in a gradient of livestock intensification management in the Neotropical region. Appl. Soil Ecol. 143, 173–180. doi: 10.1016/j.apsoil.2019.06.016
Anderson, J. R. (1975). Integrated Control of Flies and the Role of Dung-InhabitIng Insects in the Natural Recycling of Dung in Pastoral-Wildlands Ecosystems. Browns Valley, CA: University of California, Agriculture and Natural Resources.
Anlas, S., Fikacek, M., and Tezcan, S. (2008). Notes on the seasonal dynamics of the coprophagous Hydrophilidae (Coleoptera) in western Turkey, with first record of Megasternum concinnum for Turkish fauna. Linz. Biol. Beitr. 40, 409–417.
Anlas, S., Keith, D., and Tezcan, S. (2011). Notes on the seasonal dynamics of some coprophagous Scarabaeoidea (Coleoptera) species in Manisa province, western Anatolia. Turk. Entomol. Derg. 35, 447–460.
Archangelsky, M. (1999). Adaptations of immature stages of Sphaeridiinae (Staphyliniformia, Hydrophiloidea: Hydrophilidae) and state of knowledge of preimaginal Hydrophilidae. Coleopt. Bull. 53, 64–79.
Arellano, L., León-Cortés, J. L., and Ovaskainen, O. (2008). Patterns of abundance and movement in relation to landscape structure: a study of a common scarab (Canthon cyanellus cyanellus) in Southern Mexico. Landsc. Ecol. 23, 69–78. doi: 10.1007/s10980-007-9165-8
Arriaga-Varela, E., Seidel, M., Deler-Hernández, A., Senderov, V., and Fikácek, M. (2017). A review of the Cercyon Leach (Coleoptera, Hydrophilidae, Sphaeridiinae) of the Greater Antilles. ZooKeys 681, 39–93. doi: 10.3897/zookeys.681.12522
Bertone, M., Green, J., Washburn, S., Poore, M., Sorenson, C., and Watson, D. W. (2005). Seasonal activity and species composition of dung beetles (Coleoptera : Scarabaeidae and Geotrupidae) inhabiting cattle pastures in North Carolina. Ann. Entomol. Soc. Am. 98, 309–321. doi: 10.1603/0013-8746(2005)098[0309:saasco]2.0.co;2
Bertone, M. A. (2004). Dung Beetles (Coleoptera: Scarabaeidae and Geotrupidae) of North Carolina Cattle Pastures and Their Implications for Pasture Improvement. Master of Science M. Sc. Raleigh, NC: North Carolina State University.
Beynon, S. A., Mann, D. J., Slade, E. M., and Lewis, O. T. (2012). Species-rich dung beetle communities buffer ecosystem services in perturbed agro-ecosystems. J. Appl. Ecol. 49, 1365–1372. doi: 10.1111/j.1365-2664.2012.02210.x
Beynon, S. A., Wainwright, W. A., and Christie, M. (2015). The application of an ecosystem services framework to estimate the economic value of dung beetles to the U.K. cattle industry. Ecol. Entomol. 40, 124–135. doi: 10.1111/een.12240
Bezanson, G. (2019). Assessing the Effect of Habitat, Location and Bait Treatment on Dung Beetle (Coleoptera: Scarabaeidae) in Southern Alberta, Canada. M. Sc. Thesis. Lethbridge, AB: University of Lethbridge.
Birkett, A. J., Blackburn, G. A., and Menéndez, R. (2018). Linking species thermal tolerance to elevational range shifts in upland dung beetles. Ecography 41, 1510–1519. doi: 10.1111/ecog.03458
Blayney, D. (2004). The Changing Landscape of U.S. Milk Production. Washington, DC: United States Department of Agriculture, Economic Research Service.
Bradford, J. B., Betancourt, J. L., Butterfield, B. J., Munson, S. M., and Wood, T. E. (2018). Anticipatory natural resource science and management for a changing future. Front. Ecol. Environ. 16:295–303. doi: 10.1002/fee.1806
Brown, C. J., O’Connor, M. I., Poloczanska, E. S., Schoeman, D. S., Buckley, L. B., Burrows, M. T., et al. (2016). Ecological and methodological drivers of species’ distribution and phenology responses to climate change. Glob. Change Biol. 22, 1548–1560. doi: 10.1111/gcb.13184
Browning, D. M., Crimmins, T. M., James, D. K., Spiegal, S., Levi, M. R., Anderson, J. P., et al. (2018). Synchronous species responses reveal phenological guilds: implications for management. Ecosphere 9:e02395. doi: 10.1002/ecs2.2395
Buse, J., Šlachta, M., Sladecek, F. X. J., Pung, M., Wagner, T., and Entling, M. H. (2015). Relative importance of pasture size and grazing continuity for the long-term conservation of European dung beetles. Biol. Conserv. 187, 112–119. doi: 10.1016/j.biocon.2015.04.011
Cardoso, P., Barton, P. S., Birkhofer, K., Chichorro, F., Deacon, C., Fartmann, T., et al. (2020). Scientists’ warning to humanity on insect extinctions. Biol. Conserv. 242:108426. doi: 10.1016/j.biocon.2020.108426
Carter, S. K., and Rudolf, V. H. W. (2019). Shifts in phenological mean and synchrony interact to shape competitive outcomes. Ecology 100:e02826. doi: 10.1002/ecy.2826
Carvalho, R. L., Andersen, A. N., Anjos, D. V., Pacheco, R., Chagas, L., and Vasconcelos, H. L. (2020). Understanding what bioindicators are actually indicating: linking disturbance responses to ecological traits of dung beetles and ants. Ecol. Indic. 108:105764. doi: 10.1016/j.ecolind.2019.105764
Case, B. S., Pannell, J. L., Stanley, M. C., Norton, D. A., Brugman, A., Funaki, M., et al. (2020). The roles of non-production vegetation in agroecosystems: a research framework for filling process knowledge gaps in a social-ecological context. People Nat. 2, 292–304. doi: 10.1002/pan3.10093
Castro-Arellano, I., Lacher, T. E. Jr., Willig, M. R., and Rangel, T. F. (2010). Assessment of assemblage-wide temporal niche segregation using null models. Methods Ecol. Evol. 1, 311–318. doi: 10.1111/j.2041-210X.2010.00031.x
Chen, I. C., Hill, J. K., Ohlemüller, R., Roy, D. B., and Thomas, C. D. (2011). Rapid range shifts of species associated with high levels of climate warming. Science 333:1024. doi: 10.1126/science.1206432
Chmielewski, F.-M. (2003). “Phenology and agriculture,” in Phenology: An Integrative Environmental Science Tasks for Vegetation Science, ed. M. D. Schwartz (Dordrecht: Springer), 505–522. doi: 10.1007/978-94-007-0632-3_31
Chmura, H. E., Kharouba, H. M., Ashander, J., Ehlman, S. M., Rivest, E. B., and Yang, L. H. (2019). The mechanisms of phenology: the patterns and processes of phenological shifts. Ecol. Monogr. 89:e01337. doi: 10.1002/ecm.1337
Christensen, C. M., and Dobson, R. C. (1976). Biological and ecological studies on Aphodius distinctus (Mueller) (Coleoptera: Scarabaeidae). Am. Midl. Nat. 95, 242–249. doi: 10.2307/2424257
Chuine, I. (2010). Why does phenology drive species distribution? Philos. Trans. R. Soc. B Biol. Sci. 365, 3149–3160. doi: 10.1098/rstb.2010.0142
Clay, N., Garnett, T., and Lorimer, J. (2020). Dairy intensification: drivers, impacts and alternatives. Ambio 49, 35–48. doi: 10.1007/s13280-019-01177-y
Cohen, J. M., Lajeunesse, M. J., and Rohr, J. R. (2018). A global synthesis of animal phenological responses to climate change. Nat. Clim. Change 8, 224–228. doi: 10.1038/s41558-018-0067-3
Colautti, R. I., Ågren, J., and Anderson, J. T. (2017). Phenological shifts of native and invasive species under climate change: insights from the Boechera–Lythrum model. Philos. Trans. R. Soc. Lond. B Biol. Sci. 372:20160032. doi: 10.1098/rstb.2016.0032
Colwell, R. K., and Futuyma, D. J. (1971). On the measurement of niche breadth and overlap. Ecology 52, 567–576. doi: 10.2307/1934144
Conover, D., Dubeux, J., and Martini, X. (2019). Phenology, distribution, and diversity of dung beetles (Coleoptera: Scarabaeidae) in north Florida’s pastures and forests. Environ. Entomol. 48, 847–855. doi: 10.1093/ee/nvz068
da Silva, P. G., and Hernández, M. I. M. (2015). Spatial patterns of movement of dung beetle species in a tropical forest suggest a new trap spacing for dung beetle biodiversity studies. PLoS One 10:e0126112. doi: 10.1371/journal.pone.0126112
Damien, M., and Tougeron, K. (2019). Prey–predator phenological mismatch under climate change. Curr. Opin. Insect Sci. 35, 60–68. doi: 10.1016/j.cois.2019.07.002
Dellacasa, M., Dellacasa, G., and Gordon, R. D. (2011). Systematic revision of the American taxa belonging to the genera Alloblackburneus Bordat, 2009, and Blackburneus Schmidt, 1913, with description of seven new species (Coleoptera: Scarabaeidae: Aphodiinae). Insecta Mundi 0204, 1–52. doi: 10.11646/zootaxa.2230.1.1
Denny, E. G., Gerst, K. L., Miller-Rushing, A. J., Tierney, G. L., Crimmins, T. M., Enquist, C. A. F., et al. (2014). Standardized phenology monitoring methods to track plant and animal activity for science and resource management applications. Int. J. Biometeorol. 58, 591–601. doi: 10.1007/s00484-014-0789-5
Deutsch, C. A., Tewksbury, J. J., Huey, R. B., Sheldon, K. S., Ghalambor, C. K., Haak, D. C., et al. (2008). Impacts of climate warming on terrestrial ectotherms across latitude. Proc. Natl. Acad. Sci. U.S.A. 105, 6668–6672. doi: 10.1073/pnas.0709472105
Dornelas, M., and Daskalova, G. N. (2020). Nuanced changes in insect abundance. Science 368, 368–369. doi: 10.1126/science.abb6861
Dortel, E., Thuiller, W., Lobo, J. M., Bohbot, H., Lumaret, J. P., and Jay-Robert, P. (2013). Potential effects of climate change on the distribution of Scarabaeidae dung beetles in Western Europe. J. Insect Conserv. 17, 1059–1070. doi: 10.1007/s10841-013-9590-8
Doube, B. M. (1990). A functional classification for analysis of the structure of dung beetle assemblages. Ecol. Entomol. 15, 371–383. doi: 10.1111/j.1365-2311.1990.tb00820.x
Doughty, C. E., Roman, J., Faurby, S., Wolf, A., Haque, A., Bakker, E. S., et al. (2016). Global nutrient transport in a world of giants. Proc. Natl. Acad. Sci. U.S.A. 113, 868–873. doi: 10.1073/pnas.1502549112
Edmonds, W. (1994). Revision of Phanaeus Macleay, a New World genus of scarabaeine dung beetles (Coleoptera: Scarabaeidae, Scarabaeinae). Contrib. Sci. Nat. Hist. Museum Los Angeles County 443, 1–105. doi: 10.11646/zootaxa.139.1.1
England, J. R., O’Grady, A. P., Fleming, A., Marais, Z., and Mendham, D. (2020). Trees on farms to support natural capital: an evidence-based review for grazed dairy systems. Sci. Total Environ. 704:135345. doi: 10.1016/j.scitotenv.2019.135345
Enquist, C. A. F., Kellermann, J. L., Gerst, K. L., and Miller-Rushing, A. J. (2014). Phenology research for natural resource management in the United States. Int. J. Biometeorol. 58, 579–589. doi: 10.1007/s00484-013-0772-6
Errouissi, F., Labidi, I., and Nouira, S. (2009). Seasonal occurrence and local coexistence within scarabaeid dung beetle guilds (Coleoptera: Scarabaeoidea) in Tunisian pasture. Eur. J. Entomol. 106, 85–94. doi: 10.14411/eje.2009.013
Escobar, F., Halffter, G., Solis, A., Halffter, V., and Navarrete, D. (2008). Temporal shifts in dung beetle community structure within a protected area of tropical wet forest: a 35-year study and its implications for long-term conservation. J. Appl. Ecol. 45, 1584–1592. doi: 10.1111/j.1365-2664.2008.01551.x
Evans, K. S., Mamo, M., Wingeyer, A., Schacht, W. H., Eskridge, K. M., Bradshaw, J., et al. (2019). Dung beetles increase greenhouse gas fluxes from dung pats in a North temperate grassland. J. Environ. Qual. 48, 537–548. doi: 10.2134/jeq2018.03.0111
Favila, M. E., and Halffter, G. (1997). The use of indicator groups for measuring biodiversity as related to community structure and function. Acta Zool. Mex. Nueva Ser. 72, 1–25. doi: 10.21829/azm.1997.72721734
Fiene, J. G., Connior, M. B., Androw, R., Baldwin, B., and McKay, T. (2011). Surveys of Arkansas dung beetles (Coleoptera: Scarabaeidae and Geotrupidae): phenologies, mass occurrences, state and distributional records. Am. Midl. Nat. 165, 319–337. doi: 10.1674/0003-0031-165.2.319
Fincher, G. T. (1972). Notes on the biology of Phanaeus vindex (Coleoptera: Scarabaeidae). J. Ga. Entomol. Soc. 7, 128–133.
Floate, K. D. (2011). “Arthropods in cattle dung on Canada’s grasslands,” in Arthropods of Canadian Grasslands, Vol. 2, ed. K. D. Floate (Ottawa, ON: Biological Survey of Canada), 371.
Floate, K. D., and Gill, B. D. (1998). Seasonal activity of dung beetles (Coleoptera : Scarabaeidae) associated with cattle dung in southern Alberta and their geographic distribution in Canada. Can. Entomol. 130, 131–151. doi: 10.4039/Ent130131-2
Forrest, J., and Miller-Rushing, A. J. (2010). Toward a synthetic understanding of the role of phenology in ecology and evolution. Philos. Trans. R. Soc. Lond. B Biol. Sci. 365, 3101–3112. doi: 10.1098/rstb.2010.0145
Forrest, J. R. (2016). Complex responses of insect phenology to climate change. Curr. Opin. Insect Sci. 17, 49–54. doi: 10.1016/j.cois.2016.07.002
Foster, C. W., Kelly, C., Rainey, J. J., and Holloway, G. J. (2020). Effects of urbanisation and landscape heterogeneity mediated by feeding guild and body size in a community of coprophilous beetles. Urban Ecosyst. doi: 10.1007/s11252-020-00997-1
Franco-Cisterna, M., Ramos-Jiliberto, R., de Espanés, P. M., and Vázquez, D. P. (2020). Phenological shifts drive biodiversity loss in plant–pollinator networks. bioRxiv doi: 10.1101/2020.04.03.023457
Fretwell, S. D. (1972). Populations in a Seasonal Environment. Princeton, NJ: Princeton University Press.
Giraldo, C., Escobar, F., Chara, J. D., and Calle, Z. (2011). The adoption of silvopastoral systems promotes the recovery of ecological processes regulated by dung beetles in the Colombian Andes. Insect Conserv. Divers. 4, 115–122. doi: 10.1111/j.1752-4598.2010.00112.x
Gittings, T., and Giller, P. S. (1997). Life history traits and resource utilisation in an assemblage of north temperate Aphodius dung beetles (Coleoptera: Scarabaeidae). Ecography 20, 55–66. doi: 10.1111/j.1600-0587.1997.tb00347.x
Gordon, R. D., and Skelley, P. E. (2007). A Monograph of the Aphodiini Inhabiting the United States and Canada : (Coleoptera : Scarabaeidae : Aphodiinae). Gainesville, FL: The American Entomological Institute.
Grass, I., Loos, J., Baensch, S., Batáry, P., Librán-Embid, F., Ficiciyan, A., et al. (2019). Land-sharing/-sparing connectivity landscapes for ecosystem services and biodiversity conservation. People Nat. 1, 262–272. doi: 10.1002/pan3.21
Great Lakes Integrated Sciences + Assessments (2019). Climate Change in the Great Lakes Region. Available online at: http://glisa.umich.edu/media/files/GLISA%202%20Pager%202019.pdf (accessed on 22 July 2020)
Guerra Alonso, C. B., Zurita, G. A., and Bellocq, M. I. (2020). Dung beetles response to livestock management in three different regional contexts. Sci. Rep. 10:3702. doi: 10.1038/s41598-020-60575-5
Hanski, I. (1980b). Spatial variation in the timing of the seasonal occurrence in coprophagous beetles. Oikos 34, 311–321. doi: 10.2307/3544290
Hernández, M. I. M., Monteiro, L. R., and Favila, M. E. (2011). The role of body size and shape in understanding competitive interactions within a community of Neotropical dung beetles. J. Insect Sci. 11, 13–13. doi: 10.1673/031.011.0113
Hinson, K. R. (2011). Species Diversity and Seasonal Abundance of Scarabaeoidea at Four Locations in South Carolina. Master of Science in Entomology M. Sc. Clemson, SC: Clemson University.
Hoebeke, E. R., and Beucke, K. (1997). Adventive Onthophagus (Coleoptera: Scarabaeidae) in North America: geographic ranges, diagnoses, and new distributional records. Entomol. News 108, 345–362.
Jay-Robert, P., Errouissi, F., and Lumaret, J. P. (2008a). Temporal coexistence of dung-dweller and soil-digger dung beetles (Coleoptera, Scarabaeoidea) in contrasting Mediterranean habitats. Bull. Entomol. Res. 98, 303–316. doi: 10.1017/S0007485307005615
Jay-Robert, P., Lumaret, J.-P., and Lebreton, J.-D. (2008b). Spatial and temporal variation of mountain dung beetle assemblages and their relationships with environmental factors (Aphodiinae: Geotrupinae: Scarabaeinae). Ann. Entomol. Soc. Am. 101, 58–69. doi: 10.1603/0013-8746(2008)101[58:satvom]2.0.co;2
Jay-Robert, P., Niogret, J., Errouissi, F., Labarussias, M., Paoletti, E., Luis, M. V., et al. (2008c). Relative efficiency of extensive grazing vs. wild ungulates management for dung beetle conservation in a heterogeneous landscape from Southern Europe (Scarabaeinae, Aphodiinae, Geotrupinae). Biol. Conserv. 141, 2879–2887. doi: 10.1016/j.biocon.2008.09.001
Kadiri, N., Lumaret, J. P., and Floate, K. D. (2014). Functional diversity and seasonal activity of dung beetles (Coleoptera: Scarabaeoidea) on native grasslands in southern Alberta, Canada. Can. Entomol. 146, 291–305. doi: 10.4039/tce.2013.75
Kharouba, H. M., Ehrlén, J., Gelman, A., Bolmgren, K., Allen, J. M., Travers, S. E., et al. (2018). Global shifts in the phenological synchrony of species interactions over recent decades. Proc. Natl. Acad. Sci. U.S.A. 115, 5211–5216. doi: 10.1073/pnas.1714511115
Klink, R., van Bowler, D. E., Gongalsky, K. B., Swengel, A. B., Gentile, A., and Chase, J. M. (2020). Meta-analysis reveals declines in terrestrial but increases in freshwater insect abundances. Science 368, 417–420. doi: 10.1126/science.aax9931
Kong, J. D., Hoffmann, A. A., and Kearney, M. R. (2019). Linking thermal adaptation and life-history theory explains latitudinal patterns of voltinism. Philos. Trans. R. Soc. B Biol. Sci. 374:20180547. doi: 10.1098/rstb.2018.0547
Kremen, C. (2015). Reframing the land-sparing/land-sharing debate for biodiversity conservation. Ann. N. Y. Acad. Sci. 1355, 52–76. doi: 10.1111/nyas.12845
Kremen, C., and Merenlender, A. M. (2018). Landscapes that work for biodiversity and people. Science 362:eaau6020. doi: 10.1126/science.aau6020
Kriska, N. L., and Young, D. K. (2002). An annotated checklist of Wisconsin Scarabaeoidea (Coleoptera). Insecta Mundi 16, 31–48.
Larsen, T. H., and Forsyth, A. (2005). Trap spacing and transect design for dung beetle biodiversity studies. Biotropica 37, 322–325. doi: 10.1111/j.1744-7429.2005.00042.x
Lenoir, J., and Svenning, J.-C. (2013). “Latitudinal and elevational range shifts under contemporary climate change,” in Encyclopedia of Biodiversity, 2nd Edn, ed. S. A. Levin (Waltham, MA: Academic Press), 599–611. doi: 10.1016/B978-0-12-384719-5.00375-0
Levesque, C., and Levesque, G. Y. (1995). Abundance and flight activity of some Histeridae, Hydrophilidae and Scarabaeidae (Coleoptera) in southern Quebec, Canada. Great Lakes Entomol. 28, 71–80.
Liberal, C. N., de Farias, ÂM. I., Meiado, M. V., Filgueiras, B. K. C., and Iannuzzi, L. (2011). How habitat change and rainfall affect dung beetle diversity in Caatinga, a Brazilian semi-arid ecosystem. J. Insect Sci. 11:114. doi: 10.1673/031.011.11401
Lobo, J. M. (1994). A southern distribution for the introduced dung beetle Aphodius (Otophorus) haemorrhoidalis (L., 1758). J. N. Y. Entomol. Soc. 102, 385–386.
Loehle, C. (2020). Quantifying species’ geographic range changes: conceptual and statistical issues. Ecosphere 11:e03070. doi: 10.1002/ecs2.3070
Manning, P., and Cutler, G. C. (2018). Ecosystem functioning is more strongly impaired by reducing dung beetle abundance than by reducing species richness. Agric. Ecosyst. Environ. 264, 9–14. doi: 10.1016/j.agee.2018.05.002
Matheson, M. M. (1987). Insects Associated With Cattle Dung in southern Quebec. Master of Science. Montreal, QC: McGill University.
Mathiasson, M. E., and Rehan, S. M. (2019). Status changes in the wild bees of north-eastern North America over 125 years revealed through museum specimens. Insect Conserv. Divers. 12, 278–288. doi: 10.1111/icad.12347
McGeoch, M. A., Rensburg, B. J. V., and Botes, A. (2002). The verification and application of bioindicators: a case study of dung beetles in a savanna ecosystem. J. Appl. Ecol. 39, 661–672. doi: 10.1046/j.1365-2664.2002.00743.x
Menéndez, R., González-Megías, A., Jay-Robert, P., and Marquéz-Ferrando, R. (2014). Climate change and elevational range shifts: evidence from dung beetles in two European mountain ranges. Glob. Ecol. Biogeogr. 23, 646–657. doi: 10.1111/geb.12142
Menéndez, R., and Gutiérrez, D. (1999). Heterotrophic succession within dung-inhabiting beetle communities in northern Spain. Acta Oecol. 20, 527–535. doi: 10.1016/S1146-609X(00)86620-5
Menendez, R., and Gutierrez, D. (2004). Shifts in habitat associations of dung beetles in northern Spain: climate change implications. Ecoscience 11, 329–337. doi: 10.1080/11956860.2004.11682840
Michigan Agriculture Environmental Assurance Program (2019). Michigan Agriculture Environmental Assurance Program | Promoting stewardship. Available online at: https://maeap.org/ (accessed on 26 July 2020).
Miraldo, A., Krell, F.-T., SmalÉN, M., Angus, R. B., and Roslin, T. (2014). Making the cryptic visible – resolving the species complex of Aphodius fimetarius (Linnaeus) and Aphodius pedellus (de Geer) (Coleoptera: Scarabaeidae) by three complementary methods. Syst. Entomol. 39, 531–547. doi: 10.1111/syen.12079
Mohr, C. O. (1943). Cattle droppings as ecological units. Ecol. Monogr. 13, 275–298. doi: 10.2307/1943223
Montgomery, G. A., Dunn, R. R., Fox, R., Jongejans, E., Leather, S. R., Saunders, M. E., et al. (2020). Is the insect apocalypse upon us? How to find out. Biol. Conserv. 241:108327. doi: 10.1016/j.biocon.2019.108327
Moore, D. S., Notz, W., and Fligner, M. A. (2013). The Basic Practice of Statistics. New York, NY: W.H. Freeman.
Morellato, L. P. C., Alberton, B., Alvarado, S. T., Borges, B., Buisson, E., Camargo, M. G. G., et al. (2016). Linking plant phenology to conservation biology. Biol. Conserv. 195, 60–72. doi: 10.1016/j.biocon.2015.12.033
Morente-López, J., Lara-Romero, C., Ornosa, C., and Iriondo, J. M. (2018). Phenology drives species interactions and modularity in a plant - flower visitor network. Sci. Rep. 8:9386. doi: 10.1038/s41598-018-27725-2
Nervo, B., Tocco, C., Caprio, E., Palestrini, C., and Rolando, A. (2014). The effects of body mass on dung removal efficiency in dung beetles. PLoS One 9:e107699. doi: 10.1371/journal.pone.0107699
Nichols, E., Spector, S., Louzada, J., Larsen, T., Amezquita, S., and Favila, M. E. (2008). Ecological functions and ecosystem services provided by Scarabaeinae dung beetles. Biol. Conserv. 141, 1461–1474. doi: 10.1016/j.biocon.2008.04.011
Niemczyk, H. D., and Wegner, G. S. (1979). Life-history and control of the black Turfgrass Ataenius. Ohio Rep. Res. Dev. 64, 85–88.
Nyamukondiwa, C., Chidawanyika, F., Machekano, H., Mutamiswa, R., Sands, B., Mgidiswa, N., et al. (2018). Climate variability differentially impacts thermal fitness traits in three coprophagic beetle species. PLoS One 13:e0198610. doi: 10.1371/journal.pone.0198610
Otronen, M., and Hanski, I. (1983). Movement patterns in Sphaeridium - differences between species, sexes, and feeding and breeding individuals. J. Anim. Ecol. 52, 663–680. doi: 10.2307/4446
Palestrini, C., Barbero, E., and Rolando, A. (1998). Intra-and interspecific aggregation among dung beetles (Coleoptera : Scarabaeoidea) in an Alpine pasture. J. Zool. 245, 101–109. doi: 10.1017/s0952836998005123
Parmesan, C., and Yohe, G. (2003). A globally coherent fingerprint of climate change impacts across natural systems. Nature 421, 37–42. doi: 10.1038/nature01286
Perrin, W., Moretti, M., Vergnes, A., Borcard, D., and Jay-Robert, P. (2020). Response of dung beetle assemblages to grazing intensity in two distinct bioclimatic contexts. Agric. Ecosyst. Environ. 289:106740. doi: 10.1016/j.agee.2019.106740
Pianka, E. R. (1973). The structure of lizard communities. Annu. Rev. Ecol. Syst. 4, 53–74. doi: 10.1146/annurev.es.04.110173.000413
Piccini, I., Arnieri, F., Caprio, E., Nervo, B., Pelissetti, S., Palestrini, C., et al. (2017). Greenhouse gas emissions from dung pats vary with dung beetle species and with assemblage composition. PLoS One 12:e0178077. doi: 10.1371/journal.pone.0178077
Piccini, I., Caprio, E., Palestrini, C., and Rolando, A. (2020). Ecosystem functioning in relation to species identity, density, and biomass in two tunneller dung beetles. Ecol. Entomol. 45, 311–320. doi: 10.1111/een.12802
Piccini, I., Nervo, B., Forshage, M., Celi, L., Palestrini, C., Rolando, A., et al. (2018). Dung beetles as drivers of ecosystem multifunctionality: are response and effect traits interwoven? Sci. Total Environ. 616-617, 1440–1448. doi: 10.1016/j.scitotenv.2017.10.171
Price, D. L. (2004). Species diversity and seasonal abundance of scarabaeoid dung beetles (Coleoptera : Scarabaeidae, Geotrupidae and Trogidae) attracted to cow dung in central New Jersey. J. N. Y. Entomol. Soc. 112, 334–347. doi: 10.1664/0028-7199(2004)112[0334:sdasao]2.0.co;2
Price, D. L., Brenneman, L. M., and Johnston, R. E. (2012). Dung beetle (Coleoptera: Scarabaeidae and Geotrupidae) communities of Eastern Maryland. Proc. Entomol. Soc. Wash. 114, 142–151. doi: 10.4289/0013-8797.114.1.142
Raine, E. H., and Slade, E. M. (2019). Dung beetle–mammal associations: methods, research trends and future directions. Proc. R. Soc. B Biol. Sci. 286:20182002. doi: 10.1098/rspb.2018.2002
Rangel, T. F., Castro-Arellano, I., and Willig, M. R. (2010). TimeOverlap. Storrs, CT: University of Connecticut Available online at: https://hydrodictyon.eeb.uconn.edu/people/willig/Research/activity%20pattern.html
Ratcliffe, B. C., and Paulsen, M. J. (2008). The Scarabaeoid Beetles of Nebraska (Coleoptera: Scarabaeoidea). Lincoln: University of Nebraska State Museum.
Renkonen, O. (1938). Statisch-ökologische Untersuchungen über die terrestrische Käferwelt der finnischen Bruchmoore. Ann. Bot. Soc. Zool. Bot. Fenn. “Vanamo” 6, 1–231.
Renner, S. S., and Zohner, C. M. (2018). Climate change and phenological mismatch in trophic interactions among plants, insects, and vertebrates. Annu. Rev. Ecol. Evol. Syst. 49, 165–182. doi: 10.1146/annurev-ecolsys-110617-062535
Rojewski, C. (1983). Observations on the nesting behaviour of A. erraticus (L.) (Coleoptera, Scarabaeidae). Pol. Pismo Entomol. 53, 271–279.
Romero-Alcaraz, E., Sanchez-Pinero, F., and Avila, J. M. (2001). Patterns of small and large-scale spatial distribution of coprophilous Sphaeridiinae (Coleoptera, Hydrophilidae) in south-western Iberian Peninsula. Rev. Ecol. 56, 37–51.
Romero-Alcaraz, E., Sánchez-Pinero, J., and Ávila, M. (1997). Los Sphaeridiinae (Coleóptera: Hydrophilidae) en una zona del suroeste ibérico. I: composición faunística y fenología. Boln. Asoc. Esp. Ent. 21, 221–235.
Rosemartin, A. H., Crimmins, T. M., Enquist, C. A. F., Gerst, K. L., Kellermann, J. L., Posthumus, E. E., et al. (2014). Organizing phenological data resources to inform natural resource conservation. Biol. Conserv. 173, 90–97. doi: 10.1016/j.biocon.2013.07.003
Roslin, T. (2000). Dung beetle movements at two spatial scales. Oikos 91, 323–335. doi: 10.1034/j.1600-0706.2000.910213.x
Roslin, T. (2001). Large-scale spatial ecology of dung beetles. Ecography 24, 511–524. doi: 10.1111/j.1600-0587.2001.tb00486.x
Rounds, R. J., and Floate, K. D. (2012). Diversity and seasonal phenology of coprophagous beetles at Lake City, Michigan, USA, with a new state record for Onthophagus taurus (Schreber) (Coleoptera: Scarabaeidae). Coleopt. Bull. 66, 169–172. doi: 10.1649/072.066.0217
Rudolf, V. H. W. (2019). The role of seasonal timing and phenological shifts for species coexistence. Ecol. Lett. 22, 1324–1338. doi: 10.1111/ele.13277
Ruml, M., and Vulić, T. (2005). Importance of phenological observations and predictions in agriculture. J. Agric. Sci. Belgrade 50, 217–225. doi: 10.2298/jas0502217r
Sánchez-Bayo, F., and Wyckhuys, K. A. G. (2019). Worldwide decline of the entomofauna: a review of its drivers. Biol. Conserv. 232, 8–27. doi: 10.1016/j.biocon.2019.01.020
Sánchez-de-Jesús, H. A., Arroyo-Rodríguez, V., Andresen, E., and Escobar, F. (2016). Forest loss and matrix composition are the major drivers shaping dung beetle assemblages in a fragmented rainforest. Landsc. Ecol. 31, 843–854. doi: 10.1007/s10980-015-0293-2
Scranton, K., and Amarasekare, P. (2017). Predicting phenological shifts in a changing climate. Proc. Natl. Acad. Sci. U.S.A. 114, 13212–13217. doi: 10.1073/pnas.1711221114
Sears, M. K. (1978). Damage to golf course fairways by Aphodius granarius (L.) (Coleoptera: Scarabaeidae). Proc. Entomol. Soc. Ont. 109:48.
S̨enyüz, Y., Darılmaz, M. C., and Dindar, K. (2017). A study on the genus Sphaeridium Fabricus, 1775 (Coleoptera: Hydrophilidae) in Kütahya Province, Western Turkey. Trak. Univ. J. Nat. Sci. 18, 167–173. doi: 10.23902/trkjnat.345242
Sergey, K. R., Fenglong, J., and Martin, F. (2017). A review of the Asian species of the Cercyon unipunctatus group (Coleoptera: Hydrophilidae: Sphaeridiinae). Acta Entomol. Mus. Natl. Pragae 57, 535–576. doi: 10.1515/aemnp-2017-0089
Sheldon, K. S., and Tewksbury, J. J. (2014). The impact of seasonality in temperature on thermal tolerance and elevational range size. Ecology 95, 2134–2143. doi: 10.1890/13-1703.1
Shubeck, P. P., Downie, N. M., Winzel, R. L., and Peck, S. B. (1977). Species composition of carrion beetles in a mixed-oak forest. William L. Hutcheson Meml. For. Bull. 4, 12–17.
Siegel, S., and Castellan, N. J. (1988). Nonparametric Statistics for the Behavioral Sciences. New York, NY: McGraw-Hill.
Simons, P., Molina, M., Hagadorn, M. A., and Price, D. L. (2018). Monitoring of dung beetle (Scarabaeidae and Geotrupidae) activity along Maryland’s coastal plain. Northeast. Nat. 25, 87–100. doi: 10.1656/045.025.0108
Šlachta, M., Frelich, J., and Tonka, T. (2009). Application of dung-baited pitfall trapping in monitoring study on diversity of coprophagous beetles (Coleoptera: Scarabaeidae, Geotrupidae, Hydrophilidae) in cattle pastures. J Agrobiol. 26, 83–99.
Slade, E. M., Riutta, T., Roslin, T., and Tuomisto, H. L. (2016). The role of dung beetles in reducing greenhouse gas emissions from cattle farming. Sci. Rep. 6: 18140. doi: 10.1038/srep18140
Slade, E. M., and Roslin, T. (2016). Dung beetle species interactions and multifunctionality are affected by an experimentally warmed climate. Oikos 125, 1607–1616. doi: 10.1111/oik.03207
Sladecek, F. X. J., Hrcek, J., Klimes, P., and Konvicka, M. (2013). Interplay of succession and seasonality reflects resource utilization in an ephemeral habitat. Acta Oecol. 46, 17–24. doi: 10.1016/j.actao.2012.10.012
Sladecek, F. X. J., Segar, S. T., Lee, C., Wall, R., and Konvicka, M. (2017). Temporal segregation between dung-Inhabiting beetle and fly species. PLoS One 12:e0170426. doi: 10.1371/journal.pone.0170426
Smetana, A. (1978). Revision of the Subfamily Sphaeridiinae of America North of Mexico (Coleoptera : Hydrophilidae). Ottawa, ON: Entomological Society of Canada.
Smith, R. L., and Smith, T. M. (2001). Ecology & Field Biology. San Francisco, CA: Benjamin Cummings.
Smitley, D. R., Davis, T. W., and Rothwell, N. L. (1998). Spatial distribution of Ataenius spretulus, Aphodius granarius (Coleoptera : Scarabaeidae), and predaceous insects across golf course fairways and roughs. Environ. Entomol. 27, 1336–1349. doi: 10.1093/ee/27.6.1336
Sokal, R. R., and Rohlf, F. J. (1962). The comparison of dendrograms by objective methods. Taxon 11, 33–40. doi: 10.2307/1217208
Soga, M., Yamaura, Y., Koike, S., and Gaston, K. J. (2014). Land sharing vs. land sparing: does the compact city reconcile urban development and biodiversity conservation? J. Appl. Ecol. 51, 1378–1386. doi: 10.1111/1365-2664.12280
Sowig, P., Himmelsbach, R., and Himmelsbach, W. (1997). Predator-prey relationship between insect larvae: growth of Sphaeridium larvae (Coleoptera : Hydrophilidae) under time constraints through predation on Musca autumnalis maggots (Diptera : Muscidae). Can. J. Zool. Rev. Can. Zool. 75, 2069–2076. doi: 10.1139/Z97-841
Terblanche, J. S., and Hoffmann, A. A. (2020). Validating measurements of acclimation for climate change adaptation. Curr. Opin. Insect Sci. 41, 7–16. doi: 10.1016/j.cois.2020.04.005
Thackeray, S. J., Henrys, P. A., Hemming, D., Bell, J. R., Botham, M. S., Burthe, S., et al. (2016). Phenological sensitivity to climate across taxa and trophic levels. Nature 535, 241–245. doi: 10.1038/nature18608
Tiberg, K., and Floate, K. D. (2011). Where went the dung-breeding insects of the American bison? Can. Entomol. 143, 470–478. doi: 10.4039/N11-024
Tinerella, P. P., and Fauske, G. M. (1999). Occurrence of Onthophagus nuchicornis (Coleoptera: Scarabaeidae) in North Dakota. Entomol. News 110, 22–26.
Tonelli, M., Verdú, J. R., and Zunino, M. (2019). Grazing abandonment and dung beetle assemblage composition: reproductive behaviour has something to say. Ecol. Indic. 96, 361–367. doi: 10.1016/j.ecolind.2018.09.010
USDA (2016). Dairy 2014. Dairy Cattle Management Practices in the United States, 2014. Fort Collins, CO: United States Department of Agriculture.
Valladares, F., Matesanz, S., Guilhaumon, F., Araújo, M. B., Balaguer, L., Benito-Garzón, M., et al. (2014). The effects of phenotypic plasticity and local adaptation on forecasts of species range shifts under climate change. Ecol. Lett. 17, 1351–1364. doi: 10.1111/ele.12348
van den Heuvel, J., Saastamoinen, M., Brakefield, P. M., Kirkwood, T. B. L., Zwaan, B. J., and Shanley, D. P. (2013). The predictive adaptive response: modeling the life-history evolution of the butterfly Bicyclus anynana in seasonal environments. Am. Nat. 181, E28–E42. doi: 10.1086/668818
van den Pol-van Dasselaar, A., Hennessy, D., and Isselstein, J. (2020). Grazing of dairy cows in europe—an in-depth analysis based on the perception of grassland experts. Sustainability 12:1098. doi: 10.3390/su12031098
Visser, M. E., and Both, C. (2005). Shifts in phenology due to global climate change: the need for a yardstick. Proc. Biol. Sci. 272, 2561–2569. doi: 10.1098/rspb.2005.3356
Vitner, J. (1998). Reproductive biology of the central European Aphodius species with large scutellum (Coleoptera: Scarabaeidae: Aphodiinae). Acta Soc. Zool. Bohem. 62, 227–253.
Wallace, A. R. (1876). The Geographical Distribution of Animals: With a Study of the Relations of Living and Extinct Faunas as Elucidating the Past Changes of the Earth’s Surface. London: Macmillan and CO.
Wassmer, T. (1994). Seasonality of coprophagous beetles in the Kaiserstuhl area near Freiburg (SW-Germany) including the winter months. Acta Oecol. 15, 607–631.
Wassmer, T. (2014). Seasonal occurrence (phenology) of coprophilous beetles (Coleoptera: Scarabaeidae and Hydrophilidae) from cattle and sheep farms in southeastern Michigan, USA. Coleopt. Bull. 68, 603–618. doi: 10.1649/072.068.0327
Wassmer, T. (2020). Attractiveness of Cattle Dung to Coprophilous Beetles (Coleoptera: Scarabaeoidea and Sphaeridiinae) and their segregation during the initial stages of the heterotrophic succession on a pasture in Southeast Michigan. J. Insect Sci. 20:13. doi: 10.1093/jisesa/ieaa040
Watling, J. I., Arroyo-Rodríguez, V., Pfeifer, M., Baeten, L., Banks-Leite, C., Cisneros, L. M., et al. (2020). Support for the habitat amount hypothesis from a global synthesis of species density studies. Ecol. Lett. 23, 674–681. doi: 10.1111/ele.13471
Waßmer, T. (1995). Mistkäfer (Scarabaeidae und Hydrophilidae) als Bioindikatoren für die naturschützerische Bewertung von Weidebiotopen. Z. Für Ökol. Naturschutz 4, 135–142.
Wilsey, B. J., Martin, L. M., and Kaul, A. D. (2018). Phenology differences between native and novel exotic-dominated grasslands rival the effects of climate change. J. Appl. Ecol. 55, 863–873. doi: 10.1111/1365-2664.12971
Wingo, C. W., Thomas, G. D., Clark, G. N., and Morgan, C. E. (1974). Succession and abundance of insects in pasture manure: relationship to face fly survival. Ann. Entomol. Soc. Am. 67, 386–390. doi: 10.1093/aesa/67.3.386
Wolf, A. A., Zavaleta, E. S., and Selmants, P. C. (2017). Flowering phenology shifts in response to biodiversity loss. Proc. Natl. Acad. Sci. U.S.A. 114, 3463–3468. doi: 10.1073/pnas.1608357114
Wolkovich, E. M., and Cleland, E. E. (2014). Phenological niches and the future of invaded ecosystems with climate change. AoB Plants 6:lu013. doi: 10.1093/aobpla/plu013
Woodruff, R. E. (1973). The Scarab Beetles of Florida (Coleoptera: Scarabaeidae). Gainesville, FL: Florida Department. of Agriculture and Consumer Services, Division of Plant Industry.
Worthington, R. J., and Larsen, K. J. (2010). An annotated checklist of scarab beetles (Coleoptera: Scarabaeidae) from Northeastern Iowa. Great Lakes Entomol. 43, 77–90.
Wu, X., Duffy, J. E., Reich, P. B., and Sun, S. (2011). A brown-world cascade in the dung decomposer food web of an alpine meadow: effects of predator interactions and warming. Ecol. Monogr. 81, 313–328. doi: 10.1890/10-0808.1
Keywords: seasonality, climate change, invasive species, habitat loss, Sphaeridium, Cercyon, Onthophagus, Phanaeus
Citation: Wassmer T (2020) Phenological Patterns and Seasonal Segregation of Coprophilous Beetles (Coleoptera: Scarabaeoidea and Hydrophilidae) on a Cattle Farm in SE-Michigan, United States Throughout the Year. Front. Ecol. Evol. 8:563532. doi: 10.3389/fevo.2020.563532
Received: 19 May 2020; Accepted: 17 August 2020;
Published: 08 September 2020.
Edited by:
Shannon J. McCauley, University of Toronto Mississauga, CanadaReviewed by:
Fredy Alexander Alvarado, Federal University of Paraíba, BrazilGimo Daniel, National Museum, South Africa
Copyright © 2020 Wassmer. This is an open-access article distributed under the terms of the Creative Commons Attribution License (CC BY). The use, distribution or reproduction in other forums is permitted, provided the original author(s) and the copyright owner(s) are credited and that the original publication in this journal is cited, in accordance with accepted academic practice. No use, distribution or reproduction is permitted which does not comply with these terms.
*Correspondence: Thomas Wassmer, twassmer@sienaheights.edu; tom@wassmer.org