Effective Vertical Transport of Particulate Organic Carbon in the Western North Pacific Subarctic Region
 Makio C. Honda
- Japan Agency for Marine-Earth Science and Technology, Yokosuka, Japan
To quantify the biological carbon pump in the Northwestern Pacific and project future changes induced by multiple stressors, a comparative biogeochemistry study of subarctic-eutrophic and subtropical-oligotrophic regions, the K2S1 project, was conducted between 2010 and 2014. The present study uses data collected during the K2S1 project to re-examine the biological carbon pump in subarctic and subtropical regions of the northwestern Pacific with a focus on the factors governing the attenuation of the downward fluxes of particulate organic carbon (POC). Seasonal and time-series observations made during the K2S1 project revealed that primary productivity and the POC flux in the upper 200 m at subtropical-oligotrophic station S1 were comparable to or slightly higher than those at subarctic-eutrophic station K2, but the POC flux at a depth of ∼5000 m at K2 was 2–3 times that at S1. Based on these observations, the index of vertical attenuation (exponent b of the “Martin curve”) was estimated to be 0.64 at K2 and 0.90 at S1. The downward transport of POC was therefore more efficient at the subarctic station than at the subtropical station. Sinking particles were ballasted mainly by biogenic opal (Opal) at K2 and by CaCO3 at S1. The results of a multiple linear regression analysis of sediment trap data indicated that among potential ballast materials, Opal was most strongly correlated with POC at K2. Thus, Opal might contribute to the more effective vertical transport of POC in the western North Pacific Subarctic region. In addition, lower water temperatures and dissolved oxygen concentrations in the twilight zone (200–1000 m depth) at K2 likely slowed microbial decomposition of organic carbon and may also have contributed to the smaller attenuation of the downward POC flux. However, seasonal observations indicated that the carbon demand of zooplankton (prokaryotes) in the water column at K2 was ∼2.5 (1.5) times that at S1. These results were inconsistent with the lower rate of attenuation of POC fluxes at K2. Moreover, the carbon demand at the two stations inferred from the POC fluxes and the carbon fluxes associated with diurnal migration by zooplankton exceeded the carbon supply, especially at K2. Other sources of carbon, such as slowly sinking and suspended POC, might account for this mismatch.
Introduction
The biological carbon pump (BCP) is a crucial mechanism by which atmospheric CO2 is taken up by the ocean and transported to the ocean interior. Without the BCP, the pre-industrial atmospheric CO2 concentration (∼280 ppm) would have risen to ∼460 ppm (Volk and Hoffert, 1985). At present, the particulate organic carbon (POC) flux from the surface layer of the ocean to the ocean interior has been estimated to be 4–13 Pg-C year–1 (Lima et al., 2014). To evaluate the efficiency of the BCP, it is necessary to quantify the vertical attenuation of the POC flux with depth because the deeper that POC is transported, the longer the CO2 will be isolated from the atmosphere. Thus, an increase in the efficiency of the BCP has the potential to cause an increase of ocean carbon sequestration of atmospheric CO2 that would result in a negative feedback on global warming. The vertical attenuation of the POC flux has been investigated since the 1980s (e.g., Suess, 1980; Betzer et al., 1984; Berger et al., 1987; Pace et al., 1987), and Martin et al. (1987) have proposed the following power law function to describe POC flux attenuation:
where z is water depth (m), and POCF(z) and POCF(100) are the POC fluxes at depths of z m and 100 m, respectively. Although other functions, such as an exponential curve, have also been proposed and validated (Gloege et al., 2017; Cael and Bisson, 2018 and references in these papers), this power law function, commonly known as the “Martin curve,” has been used very frequently in discussions of the BCP, and the exponent b in this equation has been used as an index of BCP efficiency (e.g., Berelson, 2001): the larger the exponent b, the higher the vertical attenuation rate of the POC flux and the lower the BCP efficiency. Moreover, numerical simulations have shown that a change in the value of b would significantly change the atmospheric CO2 concentration (Yamanaka and Tajika, 1996; Kwon et al., 2009; Wilson et al., 2019).
The vertical attenuation rate of the POC flux is very dependent on the sinking velocity and decomposition rate of POC in the water column. Because POC is labile and has little negative buoyancy, it must be aggregated with relatively heavy materials called ballast to settle gravitationally in the ocean. Materials that may serve as ballast include biogenic opal (hereinafter Opal), CaCO3, and aluminosilicates. Ittekkot (1993) have hypothesized that the drastic decrease from ∼280 to ∼200 ppm of atmospheric CO2 that occurred during the last glacial maximum (e.g., Lorius et al., 1990) was caused by an increase of the input of aeolian dust (aluminosilicate ballast) to the ocean, which strengthened the BCP. Francois et al. (2002); Klaas and Archer (2002), who compiled and analyzed global sediment trap data, have suggested that CaCO3, which has the largest density among possible ballast materials, is globally the most important and effective facilitator of vertical POC transport, because the transfer efficiency (the ratio of the POC flux in the deep sea to that at the bottom of the surface mixed layer) is higher in subtropical and tropical areas where CaCO3 is a major component of marine snow. Moreover, reported sinking velocities of CaCO3-rich particles are high (Fisher and Karakas, 2009; Sukigara et al., 2019). Numerical simulations that take into account these findings have indicated that future ocean acidification will reduce the efficiency of the BCP by decreasing ocean calcification (Heinze, 2004). In addition, the POC export ratio (the ratio of the POC flux from an upper layer [a fixed depth such as 100 m, or the euphotic zone or mixed layer] to net primary productivity) in subtropical and tropical areas is low because high temperatures in the upper layer increase POC decomposition rates (e.g., Laws et al., 2000). The result might be a higher transfer efficiency and a strong positive correlation between POC and CaCO3 in these low-latitude areas (Francois et al., 2002; Henson et al., 2012): labile POC, which is fresher and easier for microbes to break down, decomposes in the upper layer, and relatively refractory POC is transported to the ocean interior in low-latitude areas.
On the basis of observations that revealed a large increase of POC fluxes in high-latitude areas during diatom blooms and on the fact that diatoms are much bigger than coccolithophorids (Buesseler, 1998; Buesseler et al., 2007, 2008), Honda and Watanabe (2010) have proposed that Opal, rather than CaCO3, is crucial as ballast for effective POC vertical transport in subarctic regions. Weber et al. (2016) have also reported a strong negative correlation between transfer efficiency and the picoplankton fraction of plankton as well as higher transfer efficiencies in high-latitude areas, where large phytoplankton such as diatoms predominate. They have also calculated that the fraction of vertically transported CO2 that has been sequestered in the ocean interior for at least 100 years is higher in high-latitude (polar and subpolar) regions than in low-latitude regions.
In contrast, Bach et al. (2019) conducted a mesocosm experiment to study how the plankton community structure affected sinking velocities and reported that during more productive periods the sinking velocity of aggregated particles was not necessarily higher, because the aggregated particles produced then were very fluffy; rather, the settling velocity was higher when the phytoplankton were dominated by small cells. In addition, Henson et al. (2012) have revisited the global sediment trap data and have reported that the POC flux is negatively correlated with the Opal export flux and uncorrelated with the CaCO3 export flux.
Key factors affecting the rate of biological decomposition of sinking POC in the water column are water temperature and the dissolved oxygen (DO) concentration: the lower the water temperature and the DO concentration, the slower the biological respiration rate and, consequently, the POC flux decomposition rate (e.g., Marsay et al., 2015; DeVries and Weber, 2017; Laufkötter et al., 2017; Pavia et al., 2019). For example, Marsay et al. (2015) have analyzed POC flux data from neutrally buoyant sediment traps in the upper 500 m of the water column and have found a significant positive correlation between the exponent b in Eq. (1) and water temperature (i.e., the POC flux was attenuated more rapidly when the water was warmer). In addition, Bach et al. (2019) have found that POC decomposition rates are high (low) when diatoms and Synechococcus (harmful algae) are the dominant phytoplankton because of increased (decreased) zooplankton abundance and the consequent increase (decrease) in grazing pressure. Using radiochemical observations (234Th-based POC flux observations), Pavia et al. (2019) found that the exponent b of the Martin curve was significantly smaller in the low-oxygen (hypoxic) eastern Pacific equatorial zone than in other areas; that is, vertical attenuation of the POC flux was smaller in the hypoxic area. They also pointed out that a more hypoxic ocean in the future would lead to a lower attenuation of the POC flux and therefore increased BCP efficiency and could thereby be a negative feedback on global warming. McDonnell et al. (2015) have reported that vertical transport of POC is more effective in the Antarctic, where the sinking velocity is higher and the biological respiration rate is lower than in the subtropical Atlantic. Henson et al. (2019) have also reported a high export ratio during the early bloom period, when primary productivity is low, and a low export ratio during the late bloom period, when primary productivity is high. They attributed the low export ratio during the late bloom to grazing pressure by microzooplankton and bacteria.
Despite these many investigations of the BCP, the factors governing the vertical attenuation of POC flux are still under debate. Observations in subarctic regions have shown that the transfer efficiency between depths of 1000 and 2000 m is relatively low and that between the bottom of the euphotic zone and a depth of 1000 m it is relatively high (Marsay et al., 2015). Marsay et al. (2015) have therefore proposed that the Martin curve does not appropriately express the vertical attenuation of POC flux in all regions and that a different equation should instead be developed for each region. Gloege et al. (2017) have discussed parameterization of the vertical attenuation of POC flux and have reported that vertical attenuation of the POC flux in the “twilight zone” (from the base of the euphotic zone to 1000 m) can be parameterized well not only by a power law model (Martin curve) but also by an exponential model (Banse, 1990) and a ballast model (Armstrong et al., 2002). However, the exponential model tends to underestimate the POC flux in the “midnight” zone (depths greater than 1000 m). Cael and Bisson (2018) have reported that the exponential model (power law model) tends to underestimate (overestimate) the POC flux in the upper layer, and vice versa in the deep layer. However, the abilities of both models to describe POC fluxes were comparable statistically when they were applied to the POC flux dataset from the eastern Pacific that was used to propose the “Martin curve” (Martin et al., 1987). In a long-term study in the northeastern Pacific, Smith et al. (2018) observed a sudden increase of the POC flux accompanied by an unusually high transfer efficiency; they have suggested that because the Martin curve cannot express such a sudden increase, it may sometimes underestimate BCP strength. In addition, contrary to previous findings, some studies have reported a significantly higher transfer efficiency, especially to the deep sea, in subtropical regions than in subarctic regions (Henson et al., 2012; Marsay et al., 2015; DeVries and Weber, 2017). This pattern may be attributable to small temperature and DO concentration differences in the deep sea between high-latitude and low-latitude regions, as well as to a higher sinking velocity in subtropical regions, where CaCO3 is a major component of deep-sea marine snow. Moreover, it is also possible that POC is more refractory in low-latitude areas than in high-latitude areas (Henson et al., 2012; Marsay et al., 2015; DeVries and Weber, 2017).
The K2S1 project (Honda et al., 2017) was conducted between 2010 and 2014 to quantify the strength of the BCP in subarctic-eutrophic and subtropical-oligotrophic regions of the western North Pacific and to provide information that would enable the projection of future changes caused by multiple stressors, such as ocean warming, acidification, and hypoxia. In this study, the BCP in subarctic and subtropical regions of the western Pacific was revisited with a focus on the factors governing the vertical attenuation of POC fluxes.
K2S1 Project
The time-series study, “Study of Change in Ecosystem and Material Cycles Caused by Climate Change and its Feedback: K2S1 Project,” was designed to collect essential baseline data about marine ecosystems and the strength of the BCP to facilitate projection of changes of material cycles due to biological activity. This comparative study of the marine ecosystem and its biogeochemistry was conducted during 2010–2014 at two time-series stations, one in the western Pacific subarctic gyre (station K2: 47°N, 160°E) and the other in the subtropics (station S1: 30°N, 145°E), two oceanographic regions that differ physically, chemically, and biologically (Figure 1). In addition, during seasonal scientific cruises of the RV Mirai (Japan Agency for Marine-Earth Science and Technology) during 2010–2014, physical, chemical, and biological parameters were measured, and time-series observations were made with a mooring system. Analyses of satellite data and numerical simulations were also carried out as part of the K2S1 project.
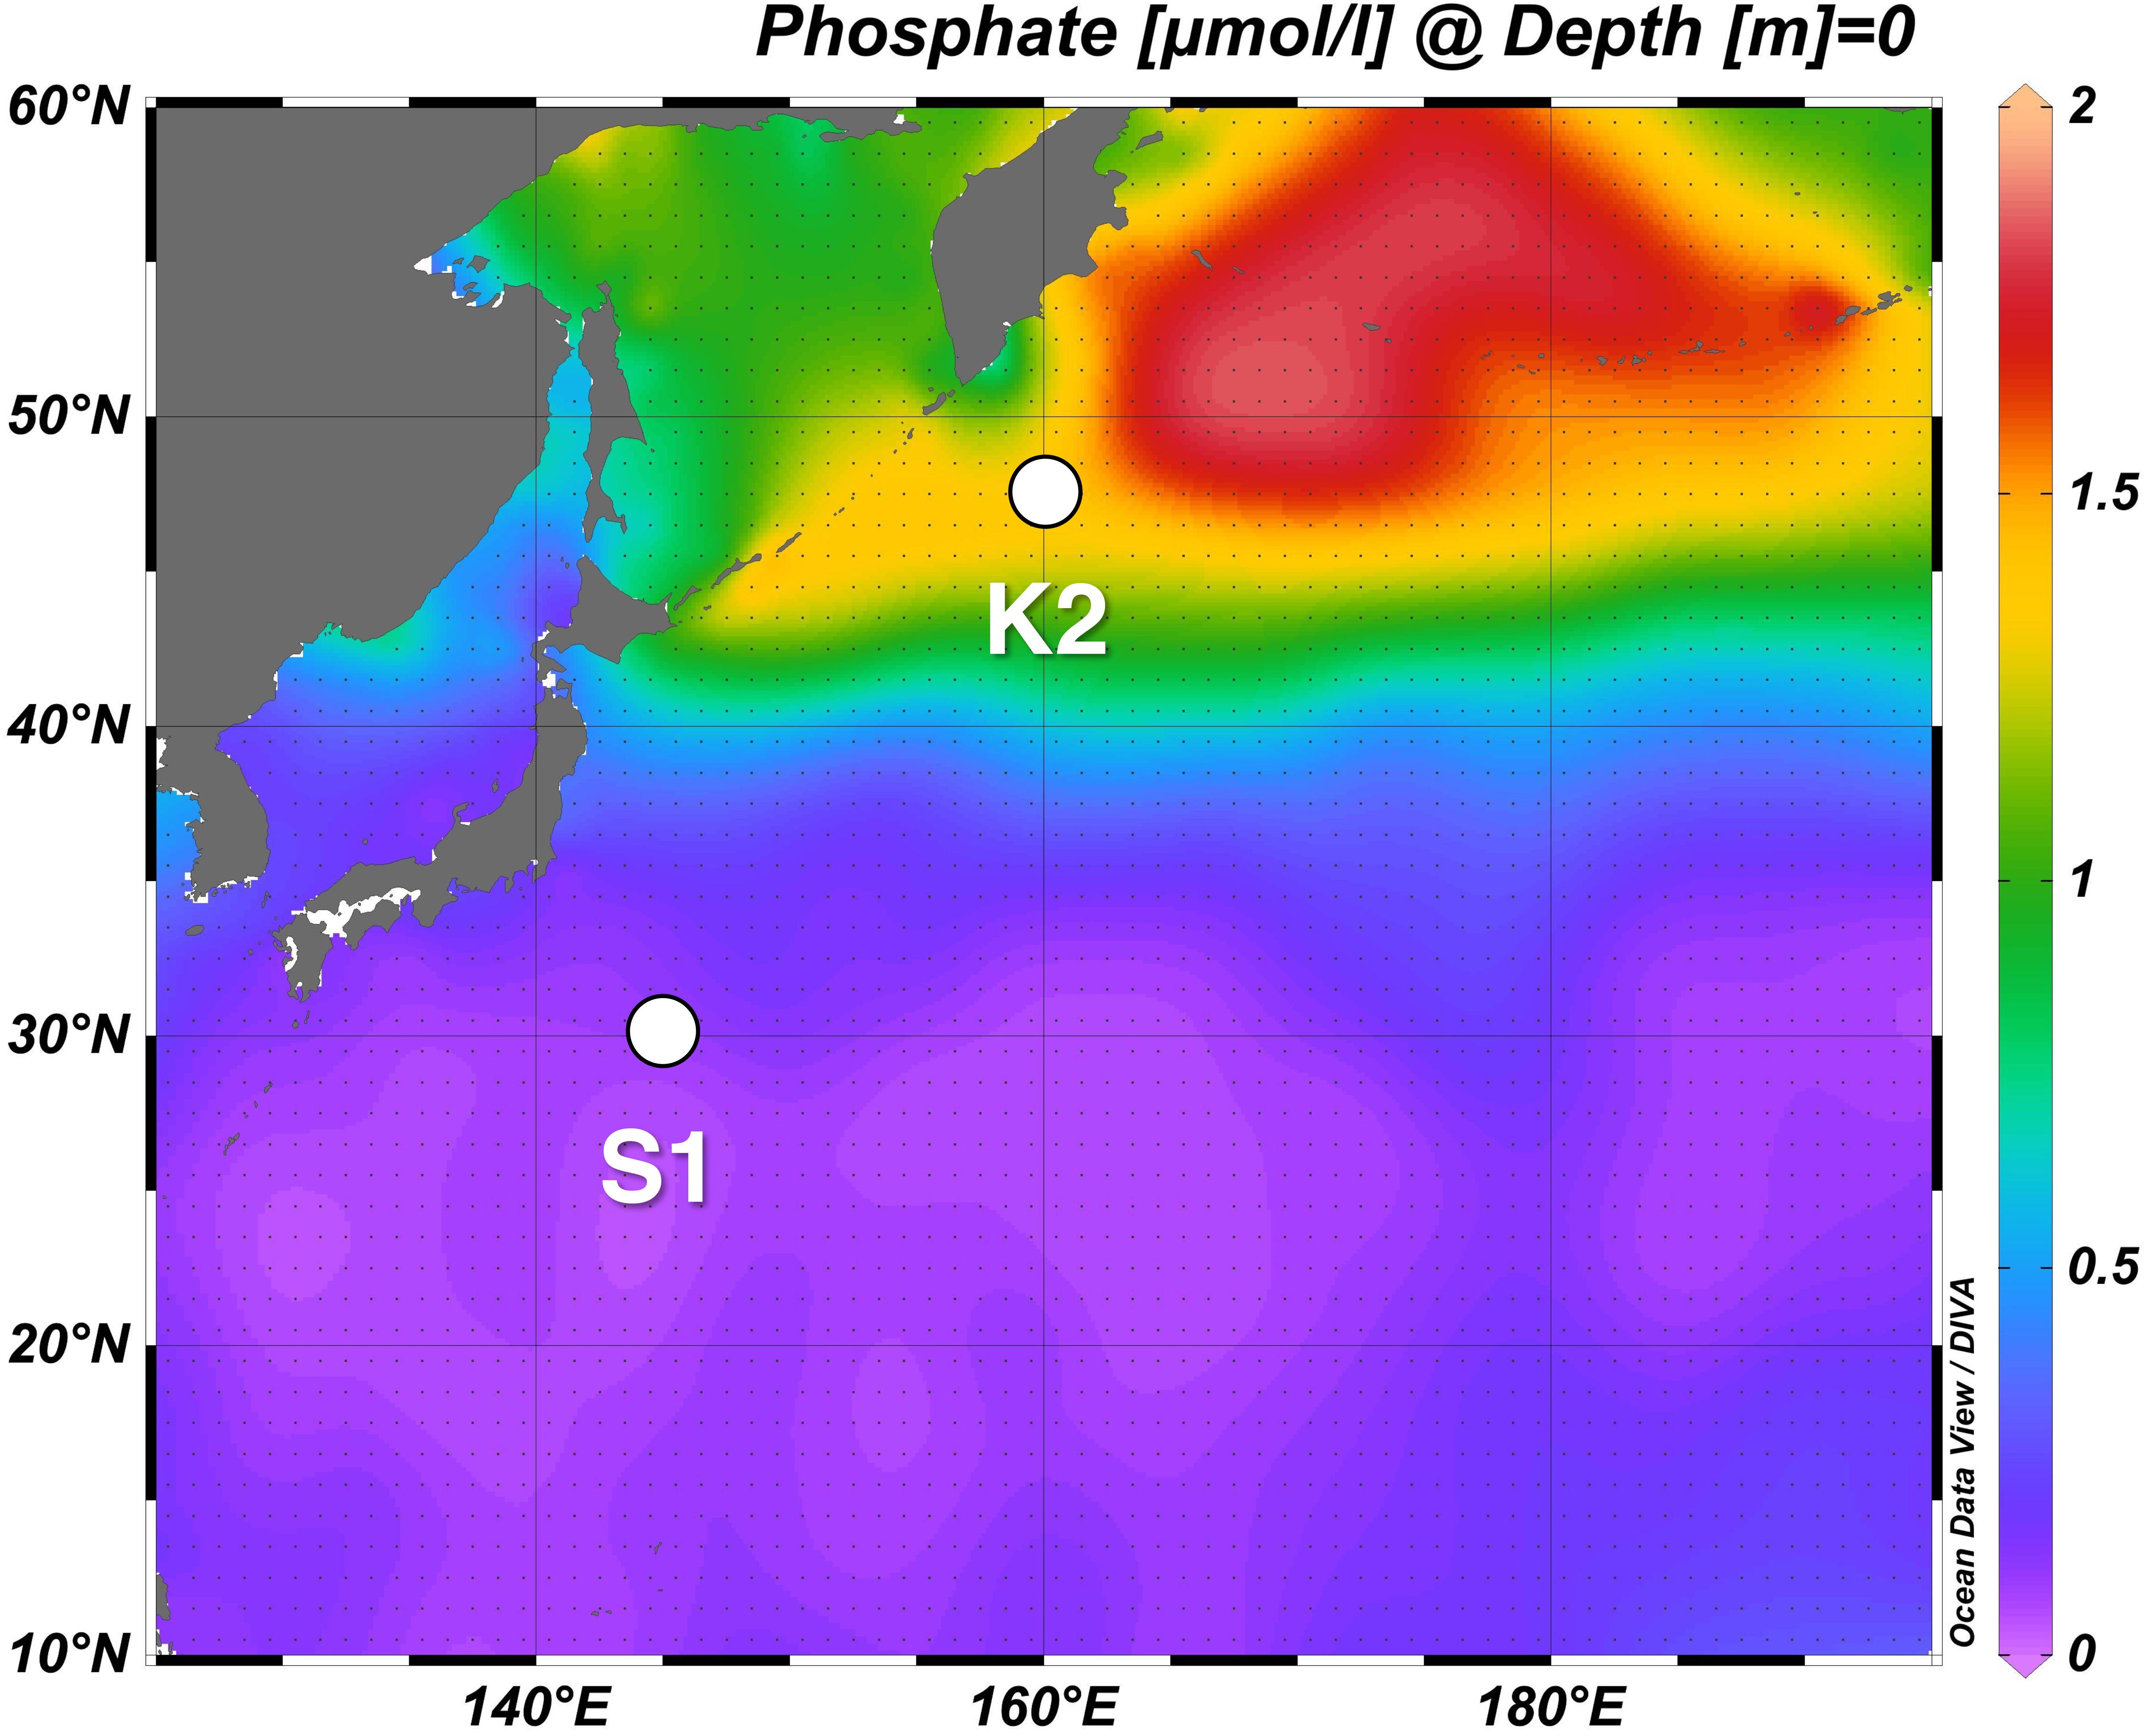
Figure 1. Western North Pacific time-series stations K2 and S1. The background is the horizontal distribution of annual mean of surface phosphate concentration based on World Ocean Atlas data of Garcia et al. (2010) (https://www.nodc.noaa.gov/OC5/WOA09/pr_woa09.html).
The following major differences in the oceanography of the two regions were identified during the K2S1 project:
(a) Surface water temperature was usually ∼15°C lower at station K2 than at station S1.
(b) Surface waters at Station K2 were eutrophic, and those at station S1 were oligotrophic: at station K2, the nitrate + nitrite concentrations (NOx) ranged from ∼10 μM in summer to ∼25 μM in winter, whereas at station S1, NOx was at most ∼3 μM, even in winter, and it was less than 0.5 μM or undetectable in summer.
(c) Diatoms predominated among the phytoplankton at station K2, whereas at station S1, smaller phytoplankton such as Prochlorococcus predominated during most seasons.
Honda et al. (2017) have provided a detailed summary of the K2S1 project, including the physical, chemical, and biological settings of the sites. All data collected during the project are available online in the “K2S1 project database”1.
Materials and Methods
In this section, observations related to the biological carbon pump are described.
Primary Productivity Measurement
Primary productivity was estimated during seasonal cruises of the RV Mirai between 2010 and 2013 (Matsumoto et al., 2016; Honda et al., 2017) based on the incorporation of 13C-labeled inorganic carbon into POC during 24-h incubations from dawn to the next dawn. Incubations were conducted either in situ or on-deck using water samples from eight depths that were selected at appropriate intervals between light levels of ∼100 and 0.1% of photosynthetically active radiation (PAR) at the surface. After the incubation, the water samples were filtered through a pre-combusted GF/F filter, and inorganic carbon was removed by fuming with HCl. The 13C content of the particulate fraction was measured with an automatic nitrogen-and-carbon analyzer–mass spectrometer (EUROPA20-20, SerCon, Ltd., United Kingdom). Water-column-integrated values of primary production (IPP) were computed between the surface and the 0.1% light depth to facilitate comparison of settling particulate carbon fluxes measured with sediment traps (see section “Particle Flux Observations”).
Particle Flux Observations
Settling particles in the upper 200 m were collected by using drifting sediment traps (DSTs: Honda et al., 2015). The sediment traps, which were traditional, surface-tethered cylindrical particle interceptor traps (Knauer et al., 1979), were deployed at nominal depths of 60, 100, 150, and 200 m for a few days during several cruises (Figure 2). After recovery, the water in the sample cups from each depth was filtered through pre-weighed Nuclepore filters for later determination of the total mass flux (TMF) and trace element contents, and through pre-combusted GF/F filters for later determination of particulate organic carbon, inorganic carbon, and nitrogen contents. Swimmers visible by the naked eye were removed from the filtered residues with tweezers. The Nuclepore filters and the GF/F filters were kept in a freezer (∼−10°C) until analysis in an on-shore laboratory.
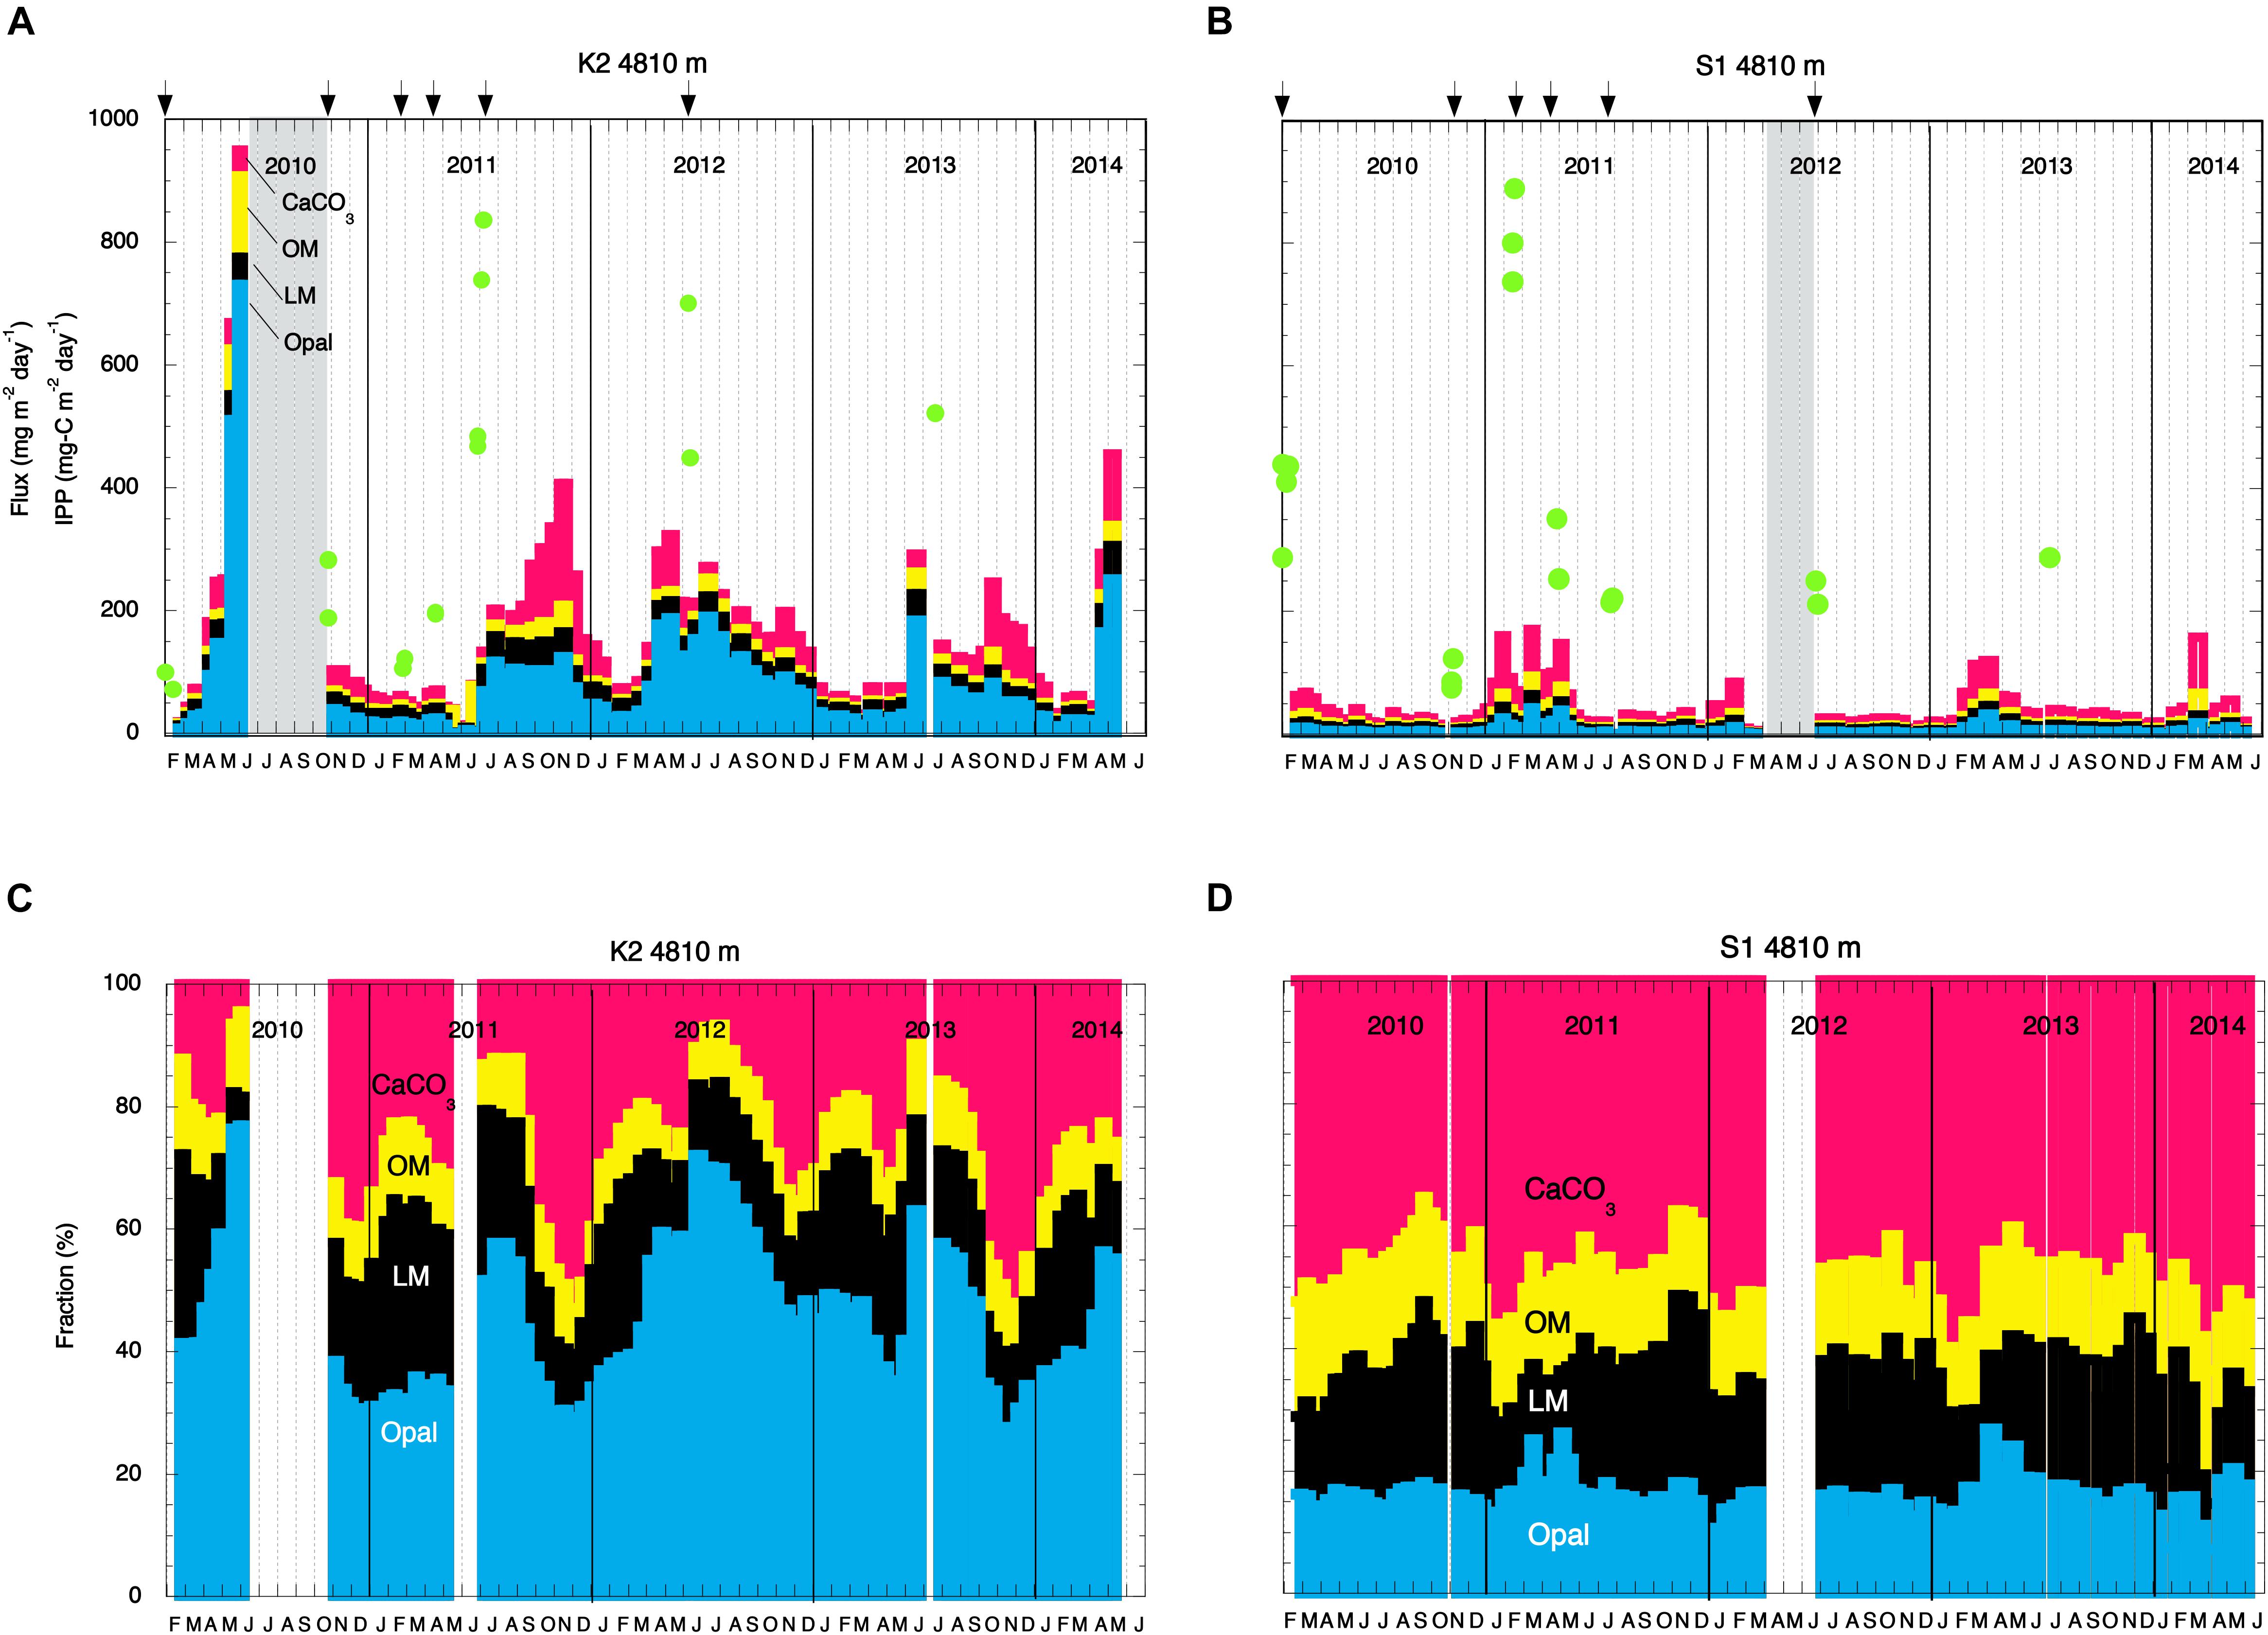
Figure 2. Seasonal and interannual variability of the total mass flux at 4810 m and the chemical compositions of collected particles. Mass fluxes at panels (A) station K2 and (B) station S1 and chemical compositions of collected particles at panels (C) station K2 and (D) station S1 between February 2010 and May 2014. Red, yellow, black, and blue shading denotes CaCO3, organic materials (OM), lithogenic materials (LM), and biogenic opal (Opal), respectively. In panels (A,B), green circles indicate integrated primary productivity (IPP), and arrows indicate the dates of drifting sediment trap (DST) deployments.
Settling particles below 200 m were collected in bottom-tethered moored time-series sediment traps (MSTs). Conical, time-series sediment traps (Nichiyu-Giken-Kogyo SMD26S-6000, Saitama, Japan and McLane Mark VII-21, MA, United States) were deployed at 200, 500, and 4810 m and turned around annually between February 2010 and June 2014 (Figure 1). The sampling interval varied from 6 to 18 days. Before deployment, the collecting cups were filled with a seawater-based buffered 10% formalin solution as a preservative, and the salinity was adjusted to ∼39 by the addition of NaCl. After recovery of the sediment traps, the samples were stored in a refrigerator at 4°C until chemical and biological analysis in a shore-based laboratory. In the laboratory, the collected particles were water-sieved through 1-mm nylon mesh, and any remaining swimmers <1 mm were removed with tweezers.
The major components of the settling particles collected by the DSTs and MSTs were measured and analyzed as follows: Concentrations of organic carbon, inorganic carbon, and nitrogen were measured with an elemental analyzer (Thermo Fisher Scientific Flash2000, Waltham, MA, United States). Concentrations of Al, Si, Ca, and trace elements such as Fe and Ti were measured with an inductively coupled plasma emission mass spectrometer (PerkinElmer Optima 3300DV, Waltham, MA, United States). Details of the sample pre-treatments and analyses are given by Honda et al. (2002, 2013). The following equations were used to estimate the concentrations of organic materials (OM), Opal (SiO2⋅0.4H2O), CaCO3, and lithogenic materials (LM). The coefficients in the equations are based on the Redfield ratio (Redfield et al., 1963) and the crustal ratio (Taylor, 1964):
The sum of OM, Opal, CaCO3, and LM was generally within ± 15% of 100%. Therefore, the contents of these four components were summed and normalized to 100% to express the chemical composition of the settling particles. All flux data and chemical composition data are available online in the “K2S1 database” (see http://ebcrpa.jamstec.go.jp/k2s1/en/).
In this study, the fluxes and characteristics of settling particles collected by MSTs at 200 and 500 m were not included in the analysis. At both stations, sinking particles at 200 m were collected by both MSTs and DSTs, and the fluxes of POC collected by MSTs were several times lower than those collected by DSTs during the same period (Honda et al., 2015). However, POC fluxes based on DST data were comparable to POC flux estimated by a budget analysis of dissolved carbon and nutrients in the upper layer (Wakita et al., 2016). Laws et al. (1989) reported that conical sediment traps at a depth of 200 m underestimated fluxes (by a factor of 30–40) compared to cylindrical traps. Therefore, POC fluxes and other fluxes at 200 m collected by DSTs are likely to be realistic. Sinking particles collected at 500 m by the MSTs might also have been under-trapped. The trapping efficiency at 500 m at K2 has been estimated on the basis of excess 210Pb flux measurements to be only ∼24%, although there is uncertainty because of the assumption of a steady state and the use of a one-dimensional model (Honda and Kawakami, 2014). In addition, sinking particles were collected at 500 m by DST in mid-June 2012, when the TMF was ∼360 mg m–2 day–1; in contrast, the TMFs before and after this period based on data collected at 500 m by MST were ∼127 and ∼230 mg m–2 day–1, respectively (K2S1 database: see text footnote 1). In contrast, based on radiochemical analysis, it has been reported that the trapping efficiency of MSTs at depths greater than 1250 m, where external disturbances due to factors such as hydrodynamics and “swimmers” are weak, is close to 100% (Yu et al., 2001). Thus, to allow direct comparison of the K2 and S1 datasets, only data based on settling particles collected at 4810 m by MSTs and data based on settling particles collected in the upper 200 m by DSTs were used in this study on the assumption that the trapping efficiencies of the two types of sediment traps were close to 100% at those depths.
Because the sampling frequency differed between the DSTs and the MSTs, there is concern about the representativeness of the DST and MST data as metrics of annual means, especially at K2, because the DST observations there were limited, and the MST data indicated that there were large, interannual differences, such as an unusually high POC flux in 2010. It is likely, however, that the DST and MST data are representative of annual means for the following reasons:
(1) The annual mean of the observed POC flux at 150 m (∼49 mg-C m–2 day–1) was very similar to the POC flux estimated from the dissolved carbon and nutrient budget (∼47 mg-C m–2 day–1: Wakita et al., 2016; Honda et al., 2017).
(2) When the annual mean POC flux at 4810 m was estimated without the unusually high POC flux at 4810 m in 2010, the annual mean decreased by only 11% (from 5.5 to 4.9 mg-C m–2 day–1), and the “exponent b” increased only from 0.64 to 0.67, which was still smaller than the corresponding value of ∼0.89 at S1 (described later).
(3) Comparison of my “exponent b” with previously reported values of the “exponent b” for POC flux in the western Pacific subarctic gyre (Honda et al., 2002; Buesseler et al., 2007) indicates that my data are comparable to those previously reported exponents (described later).
Because of the use of annual means at respective depths (Table 1), the time-lag problem (e.g., Giering et al., 2014; Henson et al., 2015) and seasonal and interannual differences do not affect the results.
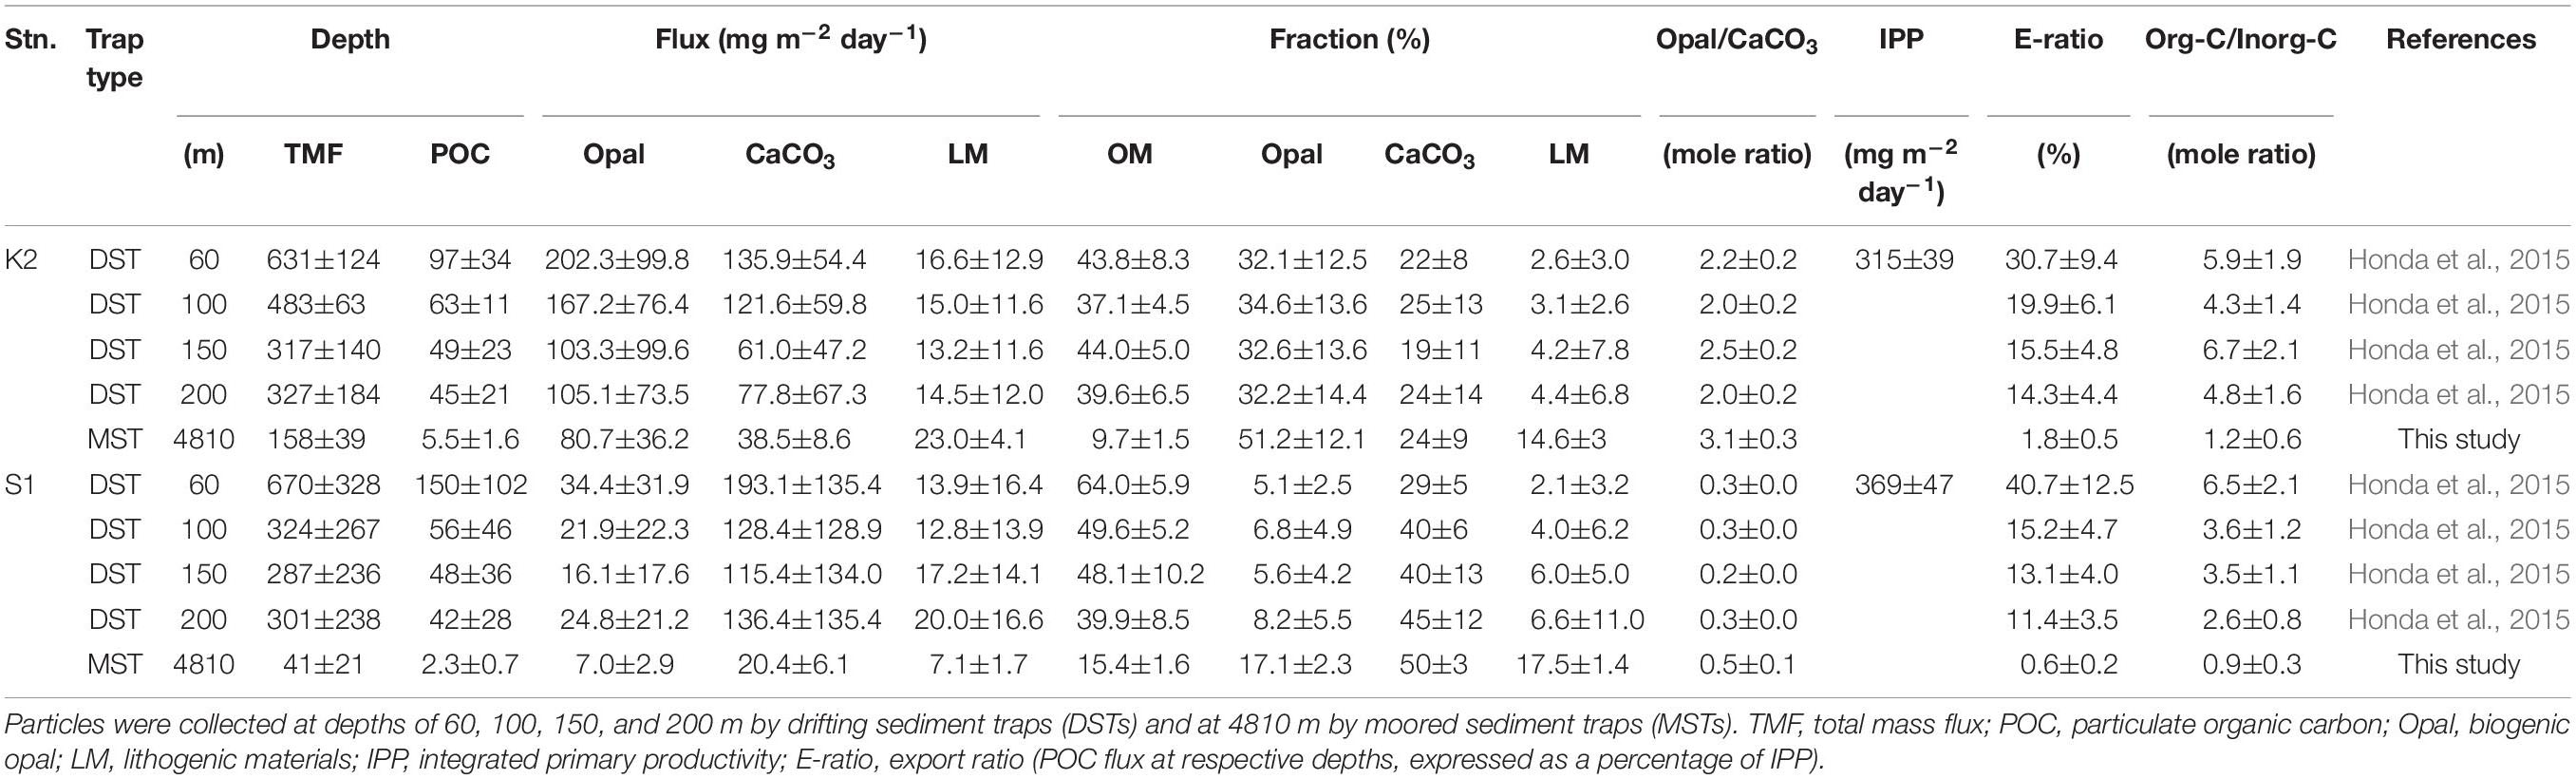
Table 1. Average fluxes and chemical compositions of settling particles during the K2S1 project.
Results
Primary Productivity
Details of the primary-production observations have been reported elsewhere (Matsumoto et al., 2016; Honda et al., 2017). Briefly, at subarctic-eutrophic station K2, the maximum IPP of ∼850 mg-C m–2 day–1 was observed in early summer (July 2011), and the minimum IPP of ∼100 mg-C m–2 day–1 was observed in winter (February 2010) (Figure 2A). At subtropical-oligotrophic station S1, the IPP was higher in winter (late January 2010, ∼500 mg-C m–2 day–1; February 2011, ∼900 mg-C m–2 day–1) and lower in summer (∼250 mg-C m–2 day–1 in July of both 2011 and 2012) and autumn (November 2010, ∼100 mg-C m–2 day–1) (Figure 2B). One scientific highlight of the K2S1project is the discovery that the average IPP (± standard deviation) at S1, the oligotrophic station (369 ± 47 mg-C m–2 day–1), was comparable to or slightly higher than that at K2, the eutrophic station (315 ± 39 mg-C m–2 day–1) (Table 1). On the basis of observations and numerical simulations, Honda et al. (2018) have proposed that one of the “missing” nutrient sources that might account for the higher IPP at station S1 is upwelling driven by mesoscale cyclonic eddies.
Fluxes and Chemical Compositions of Settling Particles in the Upper 200 M
The seasonal variability of the fluxes of settling particles and their chemical composition in the upper 200 m based on DST data have been reported by Honda et al. (2015). Those data indicate that the average Opal fluxes during 2010–2012 at station K2 ranged from ∼105 mg m–2 day–1 at 200 m to ∼202 mg m–2 day–1 at 60 m, and they were about 5–7 times the fluxes at station S1 at comparable depths (Table 1). However, CaCO3 fluxes at comparable depths were higher at station S1 (115–193 mg m–2 day–1) than at station K2 (61–136 mg m–2 day–1). As a result, the mole ratio of Opal to CaCO3 (Opal/CaCO3(mole)) was an order of magnitude higher at station K2 than at station S1. The TMF, POC flux, and export ratio (an index of BCP efficiency and equal to the POC flux at respective depths, expressed as a percentage of IPP), however, were comparable at comparable depths at both stations (K2: ∼14–31%, S1: ∼11–41%, see Table 1). The OM content of the settling particles was also comparable at the two stations; at both stations it accounted for ∼40–60% of the particles collected by DST. The similarity of the export fluxes and export ratios in the upper 200 m at stations K2 and S1 is inconsistent with previous reports of higher export fluxes and export ratios in subarctic regions (e.g., Henson et al., 2012).
Fluxes and Chemical Compositions of Settling Particles in the Deep Sea
The fluxes of settling particles and their chemical compositions based on data collected at 4810 m by MSTs showed remarkable seasonal and interannual variability (Figure 2). At station K2, the largest annual TMF maximum of ∼950 mg m–2 day–1 was observed in May 2010; in other years, the annual TMF maximum was at most 500 mg m–2 day–1 (Figure 2A). The TMF tended to increase in late spring (May and June) and in autumn at station K2. In contrast, at station S1, the annual TMF maximum was at most 200 mg m–2 day–1, and the TMF tended to increase in late winter and in spring (Figure 2B). The earlier occurrence of the annual TMF maximum at station S1 (winter/spring at S1 versus late spring/summer at K2) is consistent with the earlier occurrence of the annual IPP maximum there (winter at S1 versus late spring at K2). The average TMF at station K2, ∼158 mg m–2 day–1, was four times the average TMF at station S1 (∼41 mg m–2 day–1) (Table 1). The POC flux at K2 averaged ∼6 mg-C m–2 day–1, ∼3 times the average POC flux at station S1 (∼2 mg-C m–2 day–1). The export ratio at 4810 m of K2 (1.8%) was also ∼3 times that at station S1. At station K2, although the Opal fraction varied seasonally (higher in summer and lower in winter) and the CaCO3 fraction increased in winter, the dominant component of the settling particles was Opal (average, ∼51%) (Figure 2C and Table 1). In contrast, at station S1 the seasonal variability in the chemical composition of settling particles was small, and CaCO3 was the dominant component year-round (average, ∼50%, Figure 2D and Table 1).
Discussion
Vertical Changes in the Organic and Inorganic Carbon Fluxes
On the assumptions (1) that the DST trapping efficiency in the upper 200 m and the MST trapping efficiency at 4810 m were both 100% and (2) that the averaged organic carbon fluxes (Table 1) represented the average annual POC fluxes, we directly compared the POC fluxes in the upper 200 and at 4810 m between the sites (Figure 3A). Because the POC flux at 4810 m was higher at K2 than at S1, whereas the POC fluxes in the upper 200 m were comparable at both stations, the value of the exponent b estimated by fitting Eq. (1), the Martin curve, to the POC flux–depth relationship at each station was 0.64 (n = 5, r2 = 0.99, p < 0.001) at K2 and 0.90 (n = 5, r2 = 0.92, p < 0.001) at S1. When the exponent b was estimated with the upper POC flux (average flux +1σ) (the lower POC flux: average flux −1σ) at the respective depths at both stations, the exponent b was estimated to be 0.65 with an r2 of 0.95 (0.63 with an r2 of 0.94) at K2 and 0.97 with an r2 of 0.95 (0.66 with an r2 of 0.69) at S1. It is noteworthy that the effect of the choice of water depth for measuring the export flux of POC (e.g., a fixed depth such as 100 m, base of seasonal euphotic zone, or base of seasonal or annual maximum mixed layer) on the POC flux vertical attenuation or transfer efficiency has been a subject of debate (Buesseler and Boyd, 2009; Palevsky and Doney, 2018). The exponent b calculated using the MST-derived POC flux and the DST-derived POC flux at the base of the euphotic zone, at the depth of the seasonal mixed layer, at a fixed depth of 100 m, and at the annual maximum depth of the mixed layer (K2: 150 m, S1: 200 m) were also estimated separately. However, variations of the estimated exponent b were small: 0.64–0.67 for K2 and 0.86–0.93 for S1. The estimated exponent b for the POC flux at K2 in this study (∼0.64) is comparable to previous estimates: 0.51 ± 0.05 for POC fluxes observed with neutral buoyancy sediment traps at 150, 300, and 500 m in late spring and early summer at station K2 (Buesseler et al., 2007), and ∼0.63 for the POC fluxes observed with DSTs at 13 depths between 60 and 400 m, and with MSTs at 1000, 3000, and 5000 m in the middle of spring and late autumn at the former western North Pacific subarctic time-series station KNOT (Honda et al., 2002). It has also been reported that the exponent b is larger at the central Pacific subtropical station ALOHA (1.33 ± 0.15) than at station K2 (Buesseler et al., 2007). Thus, it can be said that the vertical attenuation of the POC flux was significantly smaller at station K2 than at station S1. In other words, POC was transported vertically more efficiently at station K2 than at station S1.
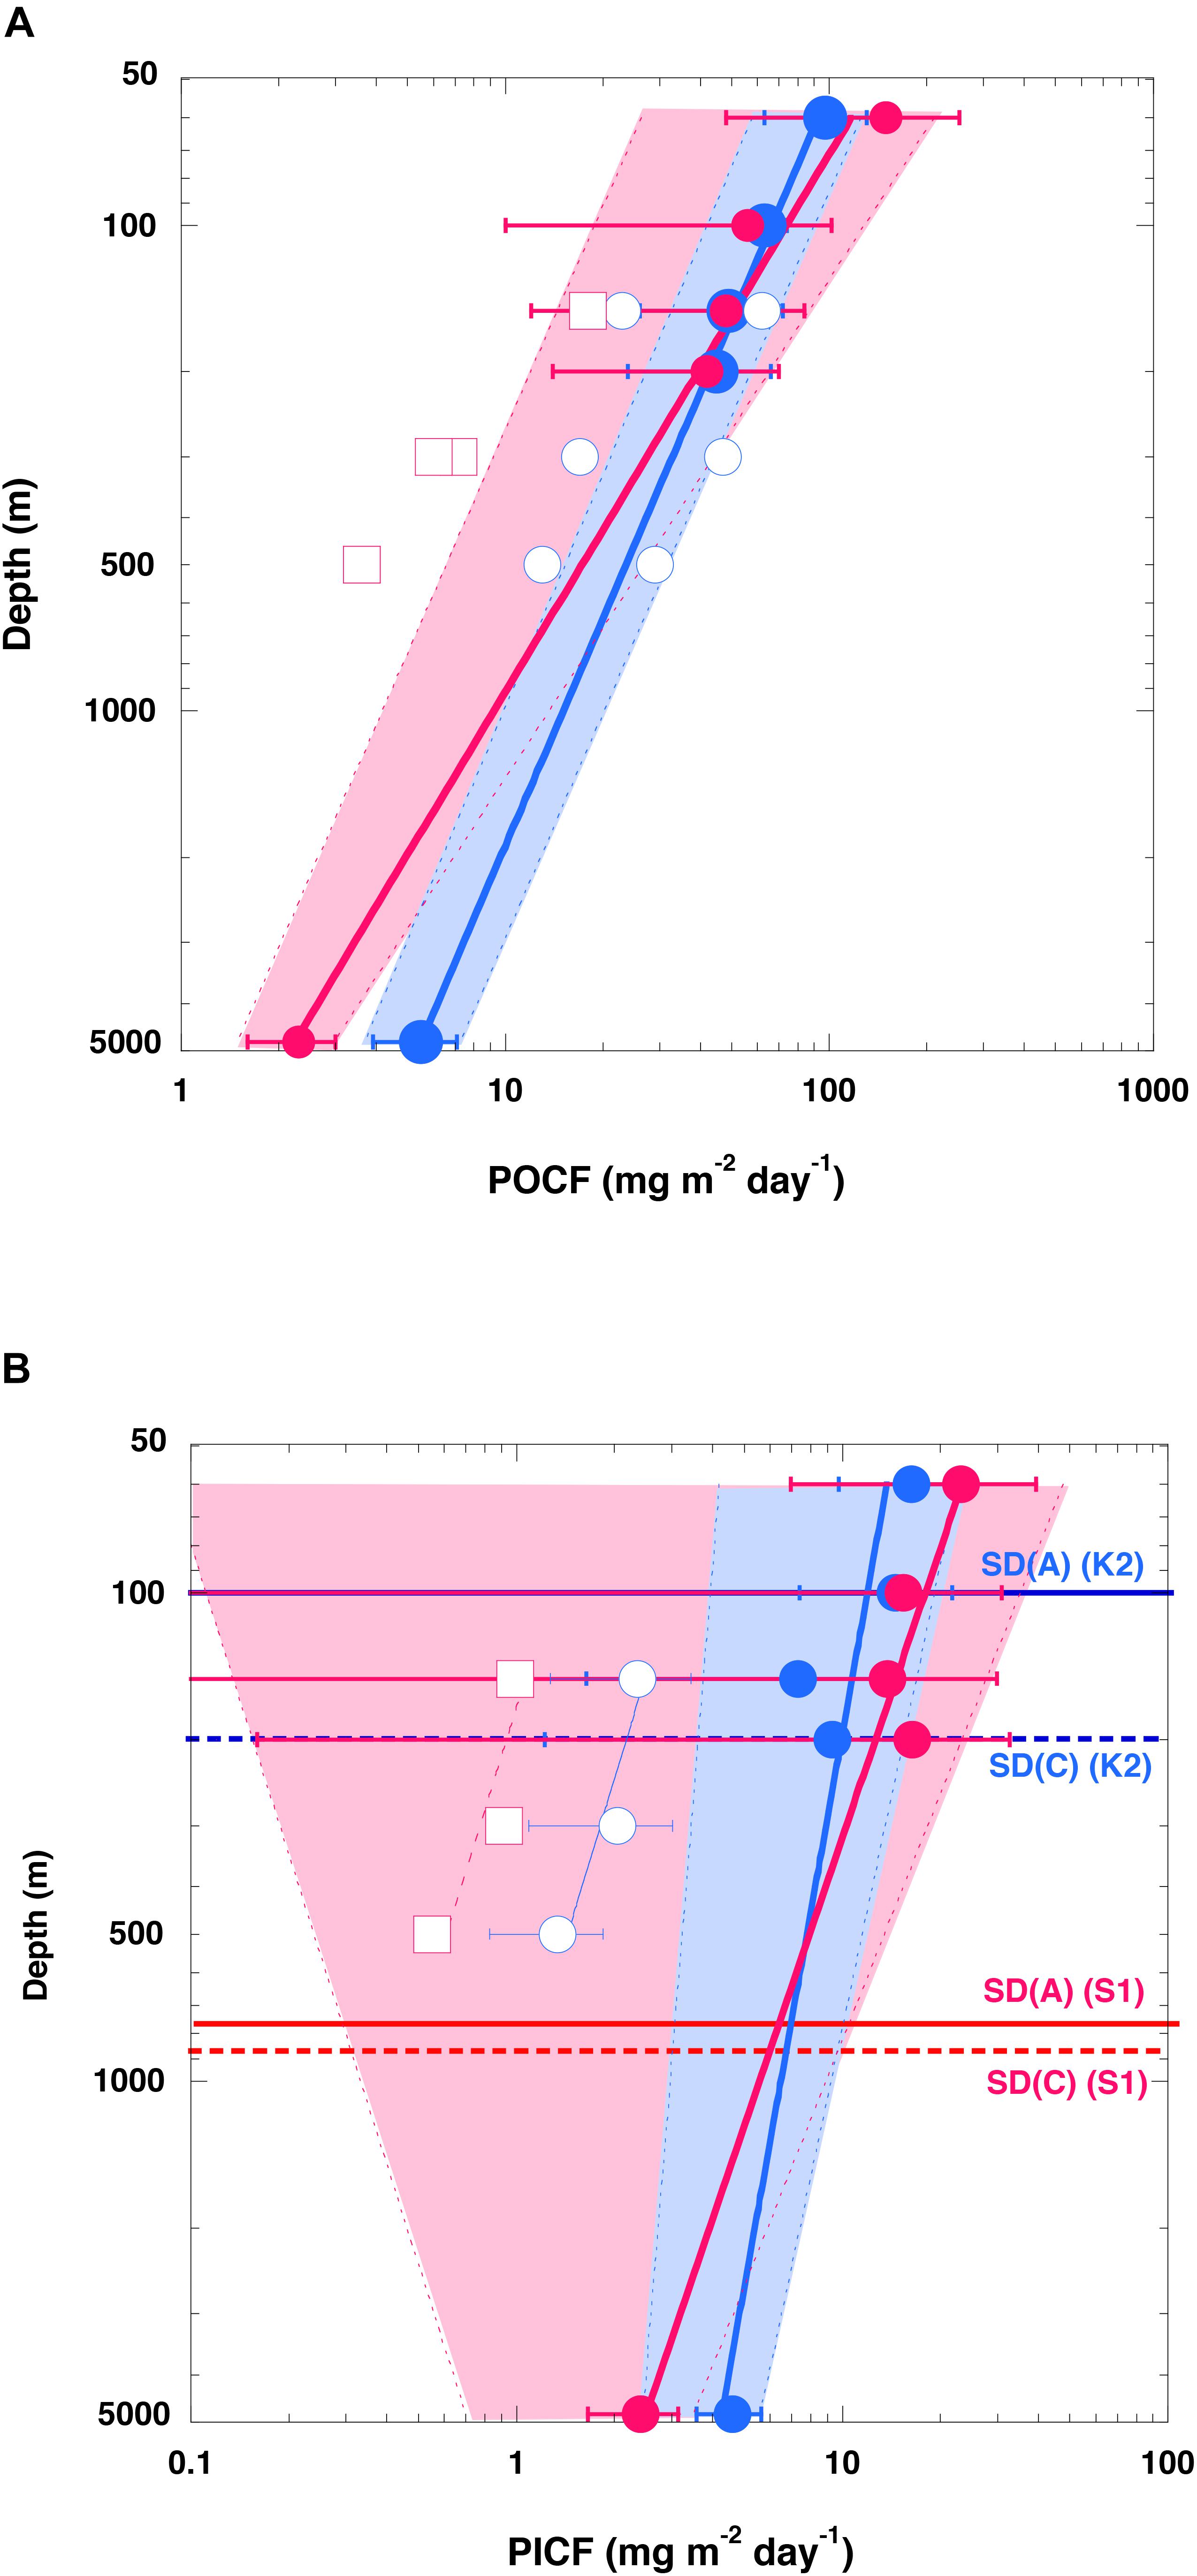
Figure 3. Vertical profiles of carbon fluxes. (A) Particulate organic carbon (POC) fluxes (POCF) and (B) particulate inorganic carbon (PIC) fluxes (PICF) at K2 (blue) and S1 (red). Please note that the scale of both axes is logarithmic. Error bars show the standard deviation (1σ). The solid curves are regression curves (power law functions) fitted to upper-level flux data (at 60, 100, 150, and 200 m) and deep flux data (at 4810 m) at each station. Hatched areas for K2 (blue) and S1 (red) are deviations from regression curves fit to the lower flux (average –1σ) and the upper flux (average +1σ) of POC at respective depths. Open blue circles (red squares) are (A) POCFs and (B) PICFs observed by neutrally buoyant sediment traps at 150, 300, and 500 m at station K2 (ALOHA) previously reported by Buesseler et al. (2007) (data are based on their Table 1). The horizontal solid and dotted lines in panel (B) labeled SD(A) and SD(C), respectively, are the saturation depths of aragonite and calcite, respectively, at the respective stations.
As described in the introduction, the choice of which empirical equation (power law model, exponential model, and so on) to parameterize the vertical attenuation of POC fluxes has been a subject of debate. In this study, I also tried to parameterize the vertical attenuation of the POC flux with an exponential model. However, the r2 statistic was lower for the exponential model than for the power law model: r2 = ∼0.67 (K2) and ∼0.41 (S1) for the exponential model whereas r2 ≥ 0.99 (K2) and ∼0.91 (S1) for the power law model. Moreover, the exponential model results in a rate of vertical attenuation of POC fluxes that is constant throughout the water column. Based on the likely decrease of biological activity and/or increase of sinking velocity with increasing depth (see section “Effects of Lower Water Temperature and Lower Oxygen Concentration”), the constant rate of vertical attenuation of POC fluxes assumed by the exponential model seems unlikely. Thus, the power law model (Martin curve) is likely more appropriate for parameterizing the vertical attenuation of POC fluxes at K2 and S1, even though the lack of POC flux data in the deep ocean does not rule out the possibility that there are some deviations from the shape of the Martin curve in that part of the water column.
It is noteworthy that the value of the exponent b for the flux of particulate inorganic carbon (PIC) (i.e., carbon in CaCO3) was also smaller at station K2 than at station S1 (K2: ∼0.19, r2 = 0.76; S1: ∼0.51, r2 = 0.91) (Figure 3B), even if the exponent b for the PIC flux, like that for the POC flux, was estimated in different ways and although its variability was slightly larger (0.17–0.28 for K2, 0.45–0.60 for S1). The saturation depths of the aragonite and calcite polymorphs of CaCO3 (where the saturation state Ω = 1) have been estimated to be at depths of around 100–200 m at station K2 and 600–800 m at station S1 (Honda et al., 2017; Figure 3B). The seawater at station K2 is therefore more corrosive with respect to CaCO3. In addition, preservation of settling POC might be less efficient at station K2 because biological grazing pressure is higher there than at station S1 (vide infra). Nevertheless, the vertical attenuation of PIC was smaller at station K2 than at station S1. This higher export flux and higher transfer efficiency in the deep sea in the subarctic region (station K2) than in the subtropical region (station S1) are inconsistent with previous reports of higher transport efficiencies in subtropical regions (e.g., Francois et al., 2002; Henson et al., 2012). Instead, the here reported higher transfer efficiency for the subarctic region (K2) compared to the subtropical region (S1) supports former observational and modeling studies featuring the found pattern (Marsay et al., 2015; Weber et al., 2016; DeVries and Weber, 2017; Cram et al., 2018; Maerz et al., 2020). In the next section, mechanisms related to the preservation of the POC flux and settling particles in the water column are discussed.
Correlations Between POC and Ballast Materials
Because settling particles are, in general, aggregates of various kinds of particles, the POC flux is usually positively correlated with the Opal, CaCO3, and LM fluxes (Figures 4A,B). However, which of these three materials plays the most important role in ballasting the vertical transport of light and labile POC is still being debated. By conducting multiple linear regression analyses (MLRAs) of global sediment trap data, Francois et al. (2002); Klaas and Archer (2002) have determined that CaCO3 is the dominant ballast material for POC on a global scale. In the western Pacific, including the Japan Sea, however, Otosaka and Noriki (2005) have reported that Opal is the dominant ballast material. Moreover, because the MLRA used a global sediment trap dataset consisting of annually averaged data, spatiotemporal variation of the Si/C ratio of primary production might have been missed; as a result, the conclusion that Opal is unimportant as ballast for POC transport might be inaccurate (Passow and De La Rocha, 2006; Boyd and Trull, 2007). Honda and Watanabe (2010), who conducted an MLRA of seasonal time-series of settling-particle data from individual sediment trap collecting cups, have reported that Opal is the dominant ballast material for vertical POC transport in the western Pacific subarctic gyre, including station K2. In accord with Honda and Watanabe (2010), we used an MLRA to fit the sediment trap data at a depth of 4810 m at K2 and S1 to the following equation to estimate the carrying coefficients (CCs) of Opal (A), CaCO3 (B), and LM (C):
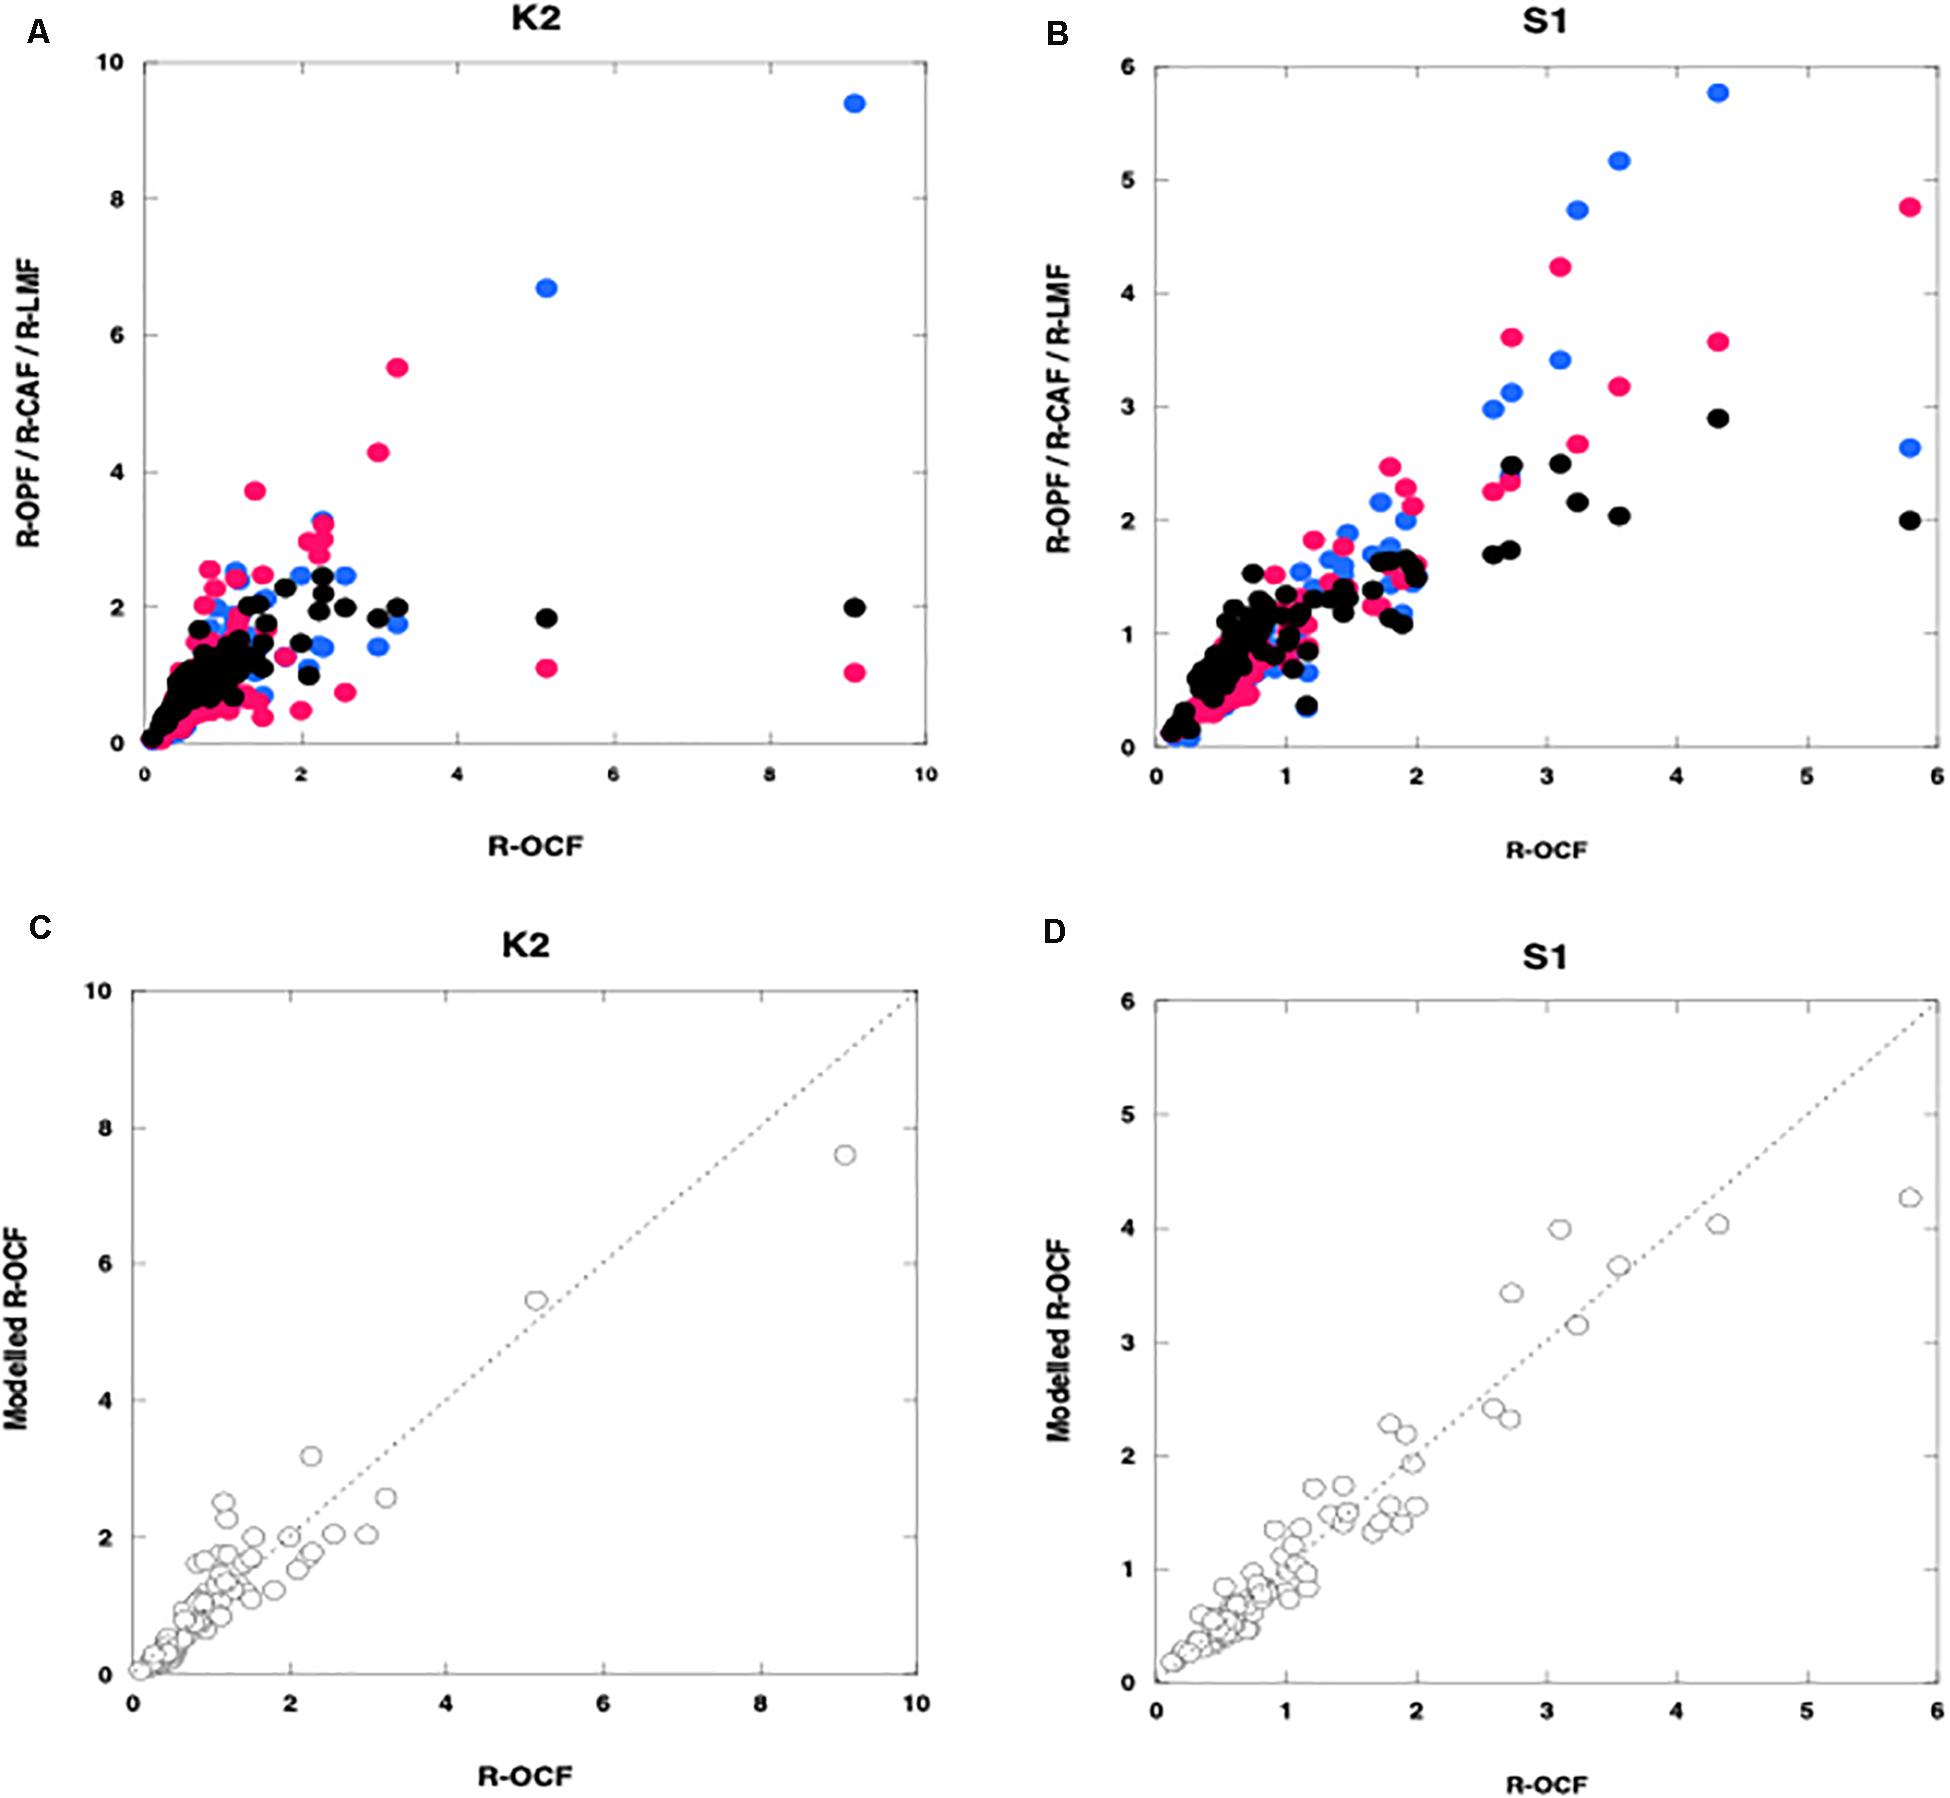
Figure 4. Relationships between the relative organic carbon flux (R-OCF) and other variables. (A,B) are relative fluxes of Opal (R-OPF: blue), CaCO3 (R-CAF: red), and lithogenic materials (R-LMF: black); (C,D) are modeled organic carbon: open circles) (obtained by using carrying coefficients estimated by multiple linear regression analysis) at K2 (A,C) and S1 (B,D). Broken lines in panels (C,D) are regression lines for panel (C) K2 (n = 89, r2 = 0.89, p < 0.001) and (D) S1 (n = 94, r2 = 0.92, p < 0.001).
where ROC, ROpal, RCaCO3, and RLM are the relative fluxes of OC, Opal, CaCO3, and LM, respectively (i.e., the flux of each material relative to its average flux). Because we used relative fluxes in Eq. (6), each CC indicated the fraction of the POC flux carried by or associated with the corresponding ballast material (A + B + C + D = 1). The parameter D represents the residual ROC flux, that is, the fraction of the ROC not associated with any ballast material. The MLR equations at each site were as follows:
K2:
S1:
Figures 4C,D shows the relationship between the observed relative POC fluxes (R-OCFs) and the modeled relative POC fluxes, that is, the relative fluxes calculated by using the MLRA equations. At K2, A was equal to 0.79. Thus, consistent with the results reported by Otosaka and Noriki (2005); Honda and Watanabe (2010), this result indicates that ∼80% of the POC was ballasted by or associated with Opal. It is thus likely that Opal plays a pivotal role in the vertical transport of POC flux to the ocean interior in the western Pacific subarctic gyre, even though CaCO3, because it is denser than Opal, might be expected to function better as ballast. Although the composition of the collected Opal was not quantitatively determined, diatoms are likely the main source of the opal, because diatoms are the dominant phytoplankton group in the western Pacific subarctic gyre. Diatoms are among the producers of transparent exopolymer particles (TEP), which aggregate with small suspended particles to form macroscopic, settling particles (e.g., Passow et al., 2001; Simon et al., 2002 and references in their paper). Qualitatively speaking, a sediment trap sample containing many diatoms is very sticky or mushy. Thus, owing to their large size, their tendency to aggregate with small particles, and their stickiness, diatoms might surround labile materials such as POC and even CaCO3 and could serve to protect them from biological degradation and chemical reactions, as reported previously (Mayer, 1994; Armstrong et al., 2002). Hansen et al. (1996) also found that fecal pellets formed from a diet of diatoms were more recalcitrant to microbial degradation.
At S1, B (= 0.79) was the largest CC. This result indicates that ∼80% of the POC was ballasted by or associated with CaCO3, which is produced not only by phytoplankton such as coccolithophores but also by zooplankton such as foraminifera. Thus, in the western Pacific subtropical region, as in many other ocean regions (Francois et al., 2002; Klaas and Archer, 2002), CaCO3 might function as ballast for POC. Observations of carbonate chemistry made during the K2S1 project have confirmed that ocean acidification is ongoing at both K2 and S1 but that the shoaling rate of the CaCO3 saturation depth is higher at S1 than at K2 (Honda et al., 2017). Although the effects of ocean acidification on the ocean ecosystem and biogeochemistry are still being debated (e.g., Doney et al., 2009), ocean acidification might reduce the production of CaCO3. Whereas a decrease in CaCO3 production could increase alkalinity and decrease the production of CO2 associated with calcification, a decrease in the supply of CaCO3 ballast could cause the POC flux to decrease and surface pCO2 to increase, especially in subtropical regions (e.g., Heinze, 2004; Kwon et al., 2009).
Effects of Lower Water Temperature and Lower Oxygen Concentration
Seasonal observations during the K2S1 project have shown that water temperatures were much lower at K2 than at S1: ∼15°C lower at the surface, ∼18°C lower at 100 m (the depth of the cold subsurface dicothermal layer at K2; Dodimead et al., 1963; Favorite et al., 1976), ∼8°C lower at 500 m, and ∼1.5°C lower at 1000 m (Figure 5A). The rates of metabolic processes, including the rates at which microbial organisms respire, consume oxygen, and decompose POC, generally decrease with decreasing temperature and vice versa. The Q10 is a well-known index used to express the sensitivity of metabolic processes to a temperature increase of 10°C, and the Q10 value of microbial metabolism typically ranges from 2 to 3 (Quinlan, 1981).
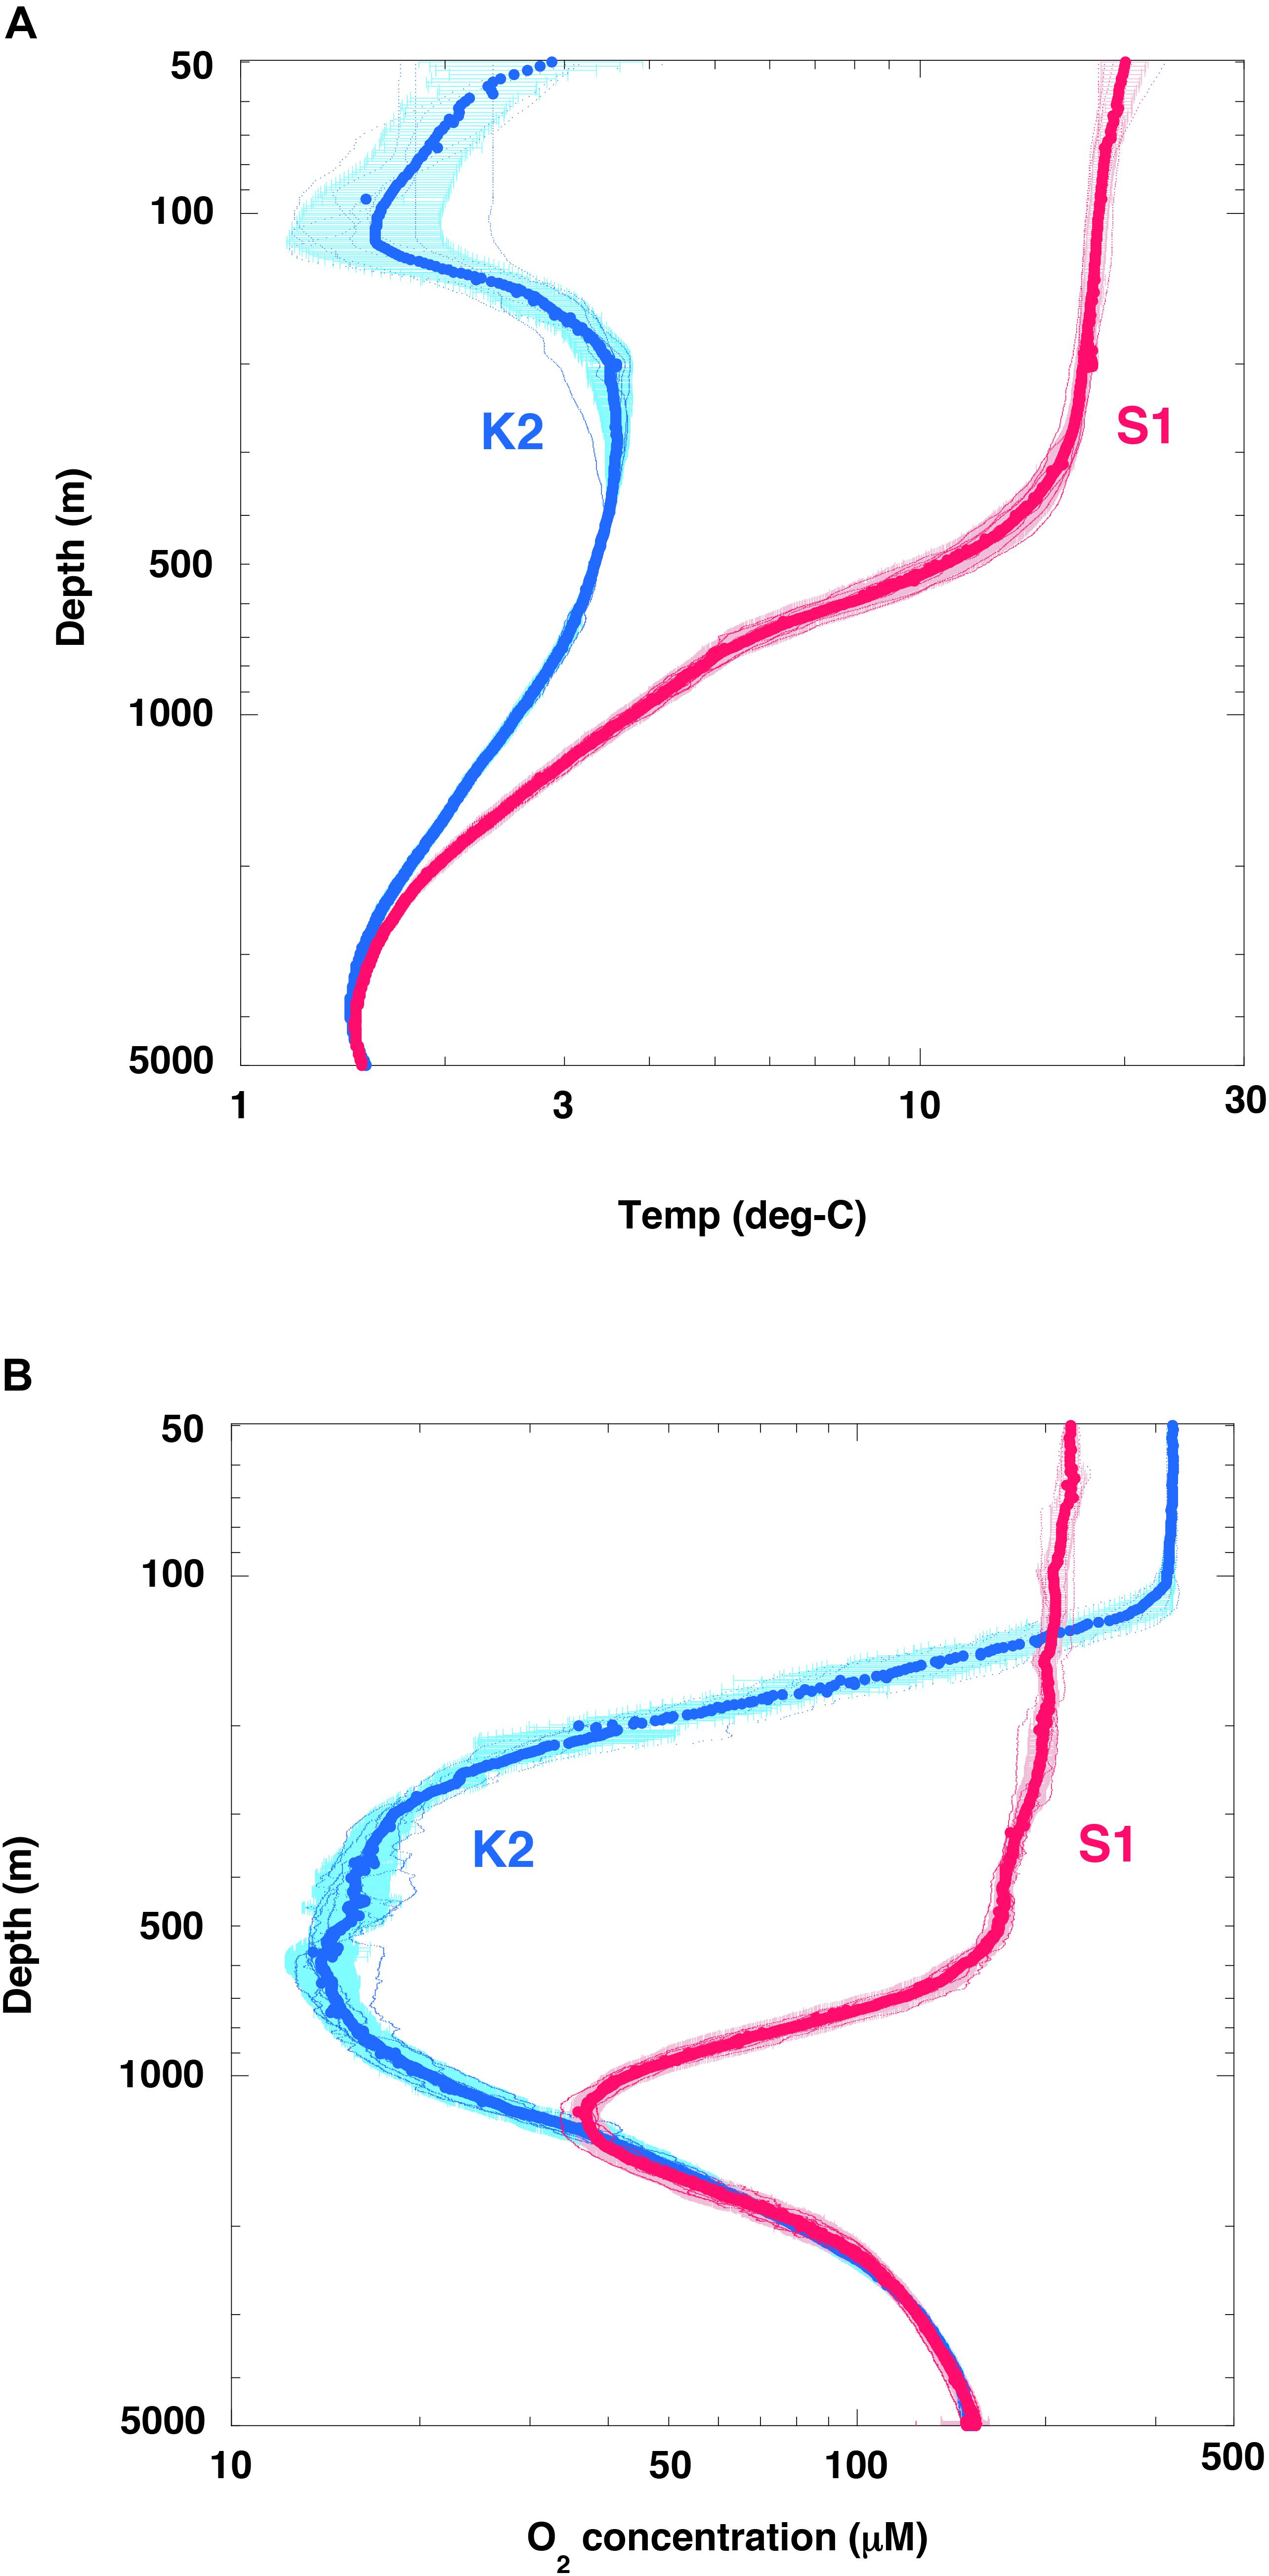
Figure 5. Seasonal vertical profiles of temperature and dissolved oxygen. (A) Temperature and (B) dissolved oxygen (O2) at stations K2 (small blue dots) and S1 (small red dots). Large circles for respective stations are averages of each 1-m interval with standard deviation (1σ). Note that the scales of both axes are logarithmic.
In addition, it is possible that the rate of POC decomposition was affected by dissolved oxygen (O2) concentrations. The O2 concentration in the upper 100 m was generally higher at station K2 than at station S1 (Figure 5B), because the solubility of atmospheric oxygen in the surface ocean layer is higher at low temperatures. In the twilight zone, however, the O2 concentration was significantly lower at station K2 than at station S1. A sufficiently low O2 concentration would be expected to cause rates of microbial respiration and POC decomposition to decrease. For example, DeVries and Weber (2017) have reported that the rate of POC decomposition decreases by 70% and 20% when the O2 concentration is reduced to 50 μM and 20 μM, respectively. In addition, based on an on-deck incubation experiment in the Arabian Sea, Keil et al. (2016) have reported that an O2 concentration of 20 μM is the threshold for O2 effects on respiration; aerobic rates of POC decomposition in their experiments dropped to 0% for a few days at O2 concentrations below 1 μM. Pavia et al. (2019) have reported that the exponent b of Eq. (1) is small (low rate of attenuation of POC flux) in the eastern tropical Pacific, an hypoxic area with O2 < 20 μM, a finding supported by numerical simulation results (Cram et al., 2018). The oxygen sensitivity of the respiration rate thus has the potential to affect the rate of POC decomposition in water columns that include oxygen minimum zones, in which the O2 concentration may become low enough to slow aerobic rates of particle degradation. A half-saturation constant, [KO2], has been proposed as an index of the O2 dependence of POC decomposition rates (e.g., DeVries and Weber, 2017), and [KO2] values ranging from 4 to 30 μM have been suggested (Ploug, 2001; Kalvelage et al., 2015; Keil et al., 2016; DeVries and Weber, 2017; Laufkötter et al., 2017).
In this study, the rate of attenuation of the POC flux [R(T, O)] due to remineralization was estimated at K2 and S1 by using the following equation proposed by Cram et al. (2018):
where T and O2 are the observed water temperature and dissolved oxygen concentration, respectively (Figures 5A,B). Cr (day–1) is the base remineralization rate of POC at a reference temperature (Tref). On the basis of incubation experiments, Iversen and Ploug (2013) have proposed that the carbon-specific respiration rates are 0.12 ± 0.03 day–1 at 15°C and 0.03 ± 0.01 day–1 at 4°C, and they applied these rates to an analysis of the vertical attenuation of POC fluxes observed by sediment traps in the world ocean. In this study, their carbon-specific respiration rate was used as the Cr at Tref: 0.12 ± 0.03 day–1 at 15°C or 0.03 ± 0.01 day–1 at 4°C. Use of these numbers indicated that the Q10 was 3.5 on average with a range from 2.1 to 6.2 (Figure 6A). The [O2]/([KO2] + [O2]) ratio is a metric of the intensity of the dependence of the rate of POC remineralization on the O2 concentration: the smaller [KO2], the smaller the O2 dependence (Figure 6B). [KO2] = 0 means that the O2 concentration does not affect POC remineralization rates.
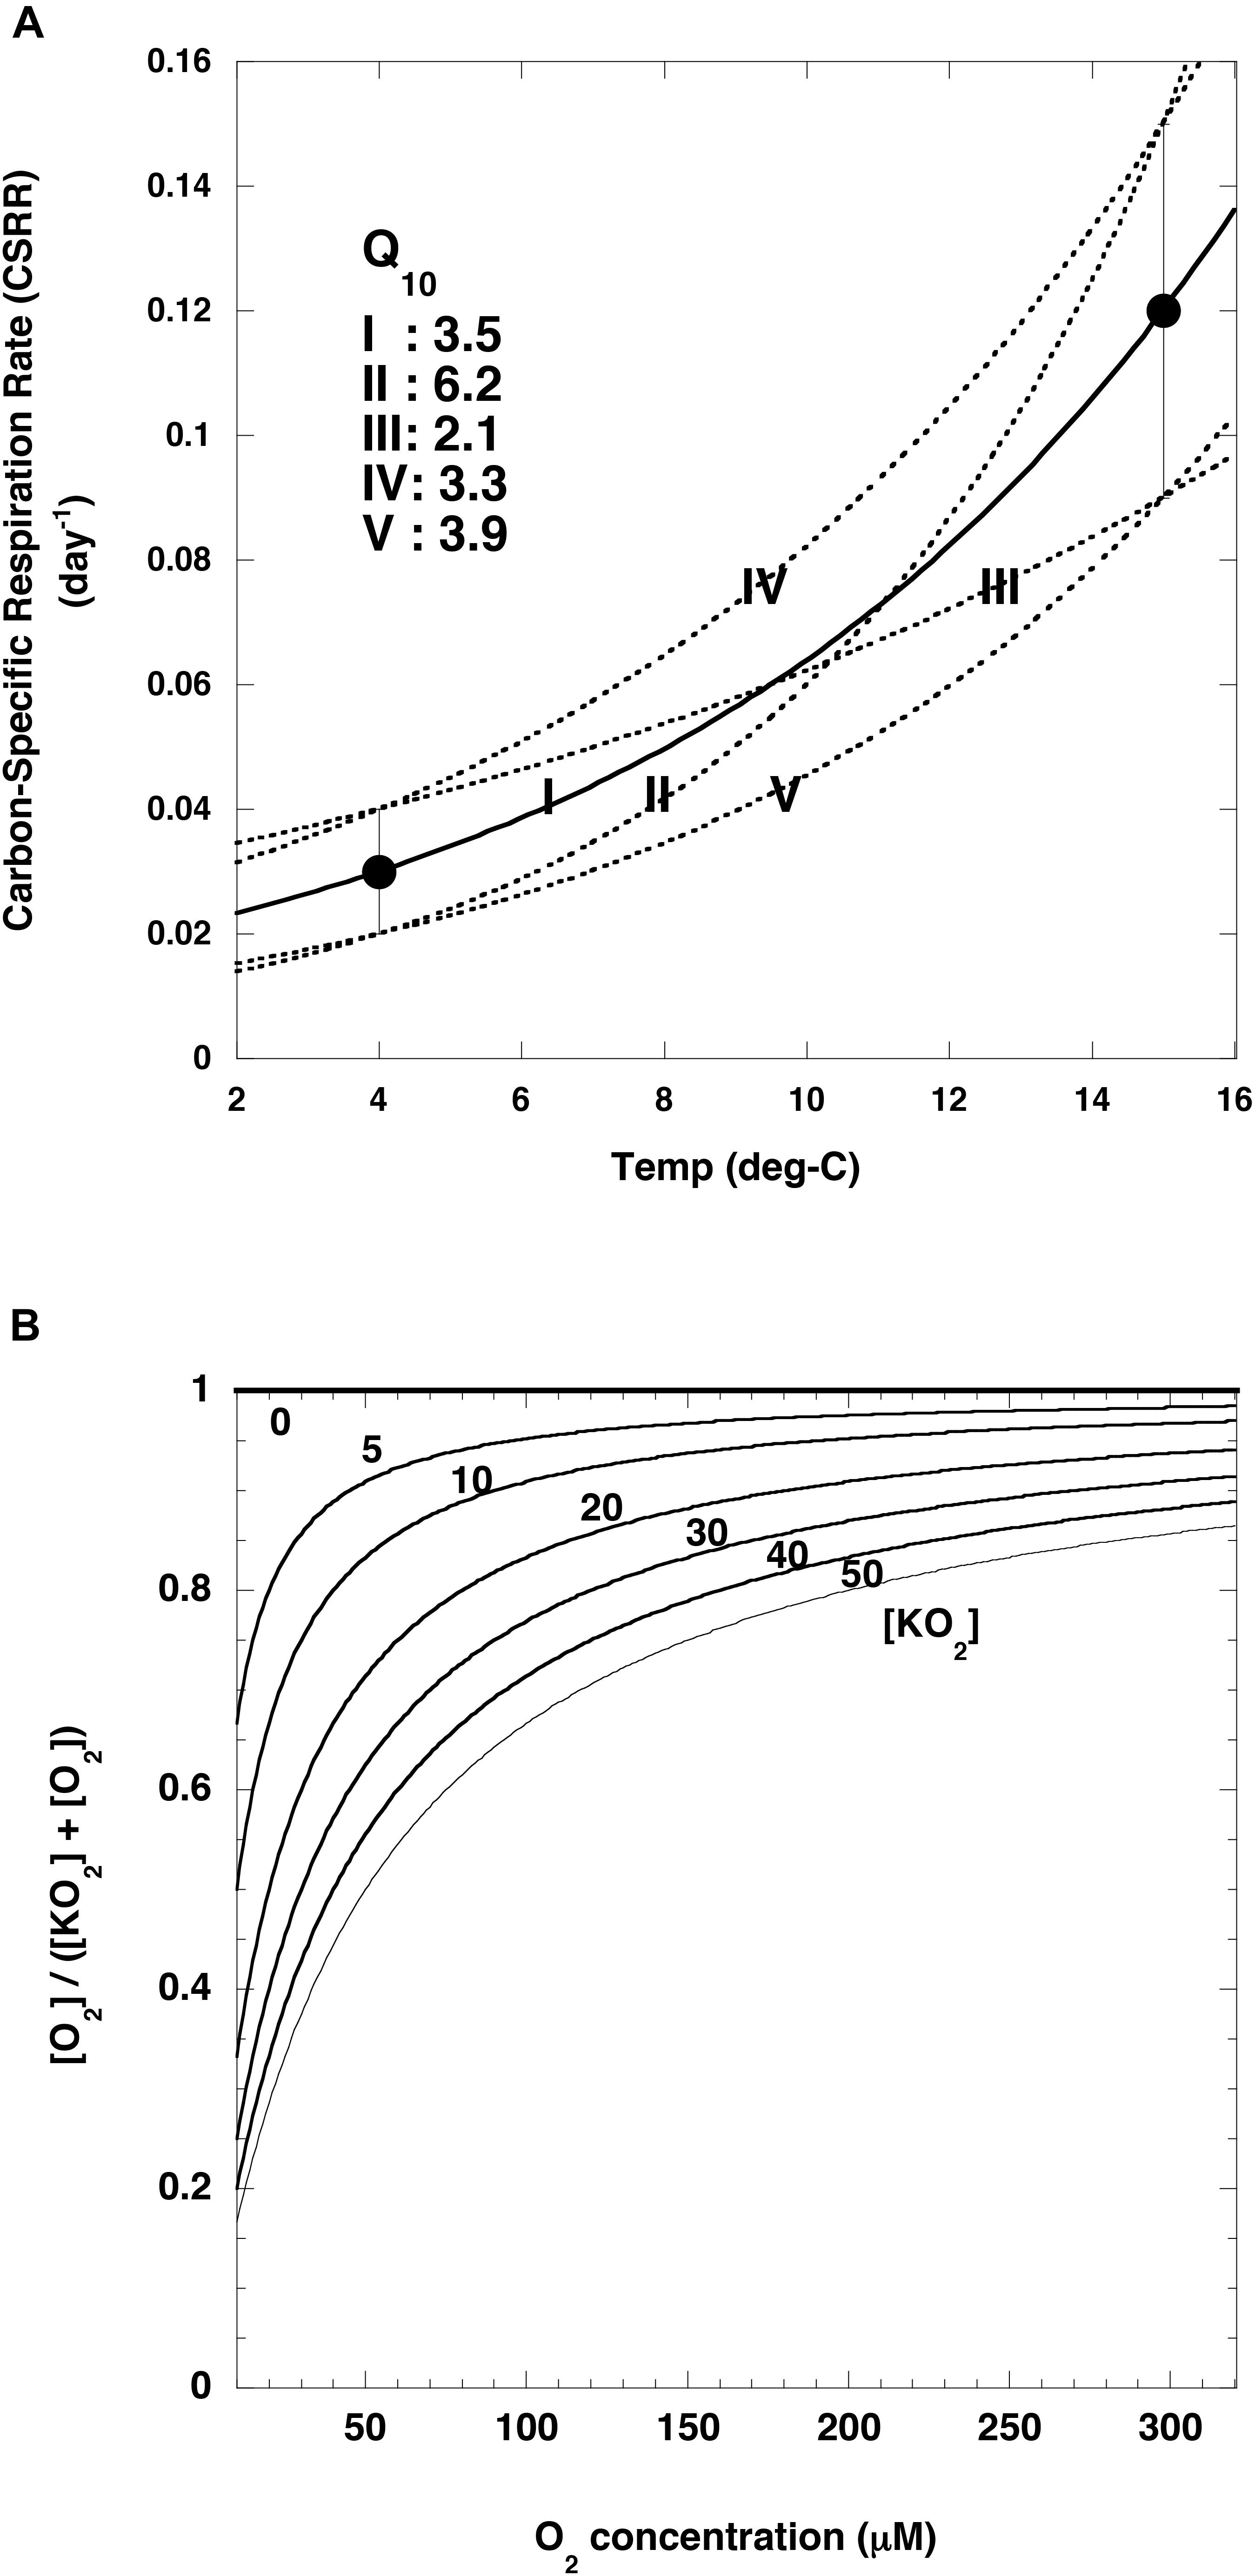
Figure 6. Relationships between variables and temperature or oxygen concentrations. (A) Carbon-specific respiration rates (black circles) reported by Iversen and Ploug (2013) and temperature. Curves are regression curves (exponential functions) fit to various combinations of data (I: average-average, II: lower value (average –1σ)-upper value (average +1σ), III: upper value-lower value, IV: upper value-upper value, V: lower value-lower value). Based on these exponential curves, the following Q10 values were estimated for these datasets (I: 3.5, II: 6.2, III: 2.1, IV: 3.3, V: 3.9). Cr at reference temperature of 4°C in Eq (9) (see text) for I, II, III, IV and V are 0.03, 0.02, 0.04, 0.04 and 0.02 day– 1, respectively. (B) Relationship between O2 concentration and [O2]/([KO2] + [O2]) for various [KO2] values (0–50 μM).
The estimated (Cr)(Q10(T–Tref)/10) (hereinafter Cr(T)) at K2 was nearly constant (2–3% day–1 on average) throughout the water column (Figure 7A) (note: the original rate [day–1] was converted to [% day–1] by multiplying the original rate by 100%). I attributed this small rate of change to the small change in water temperature throughout the water column at K2 (1–4°C, Figure 5A). In contrast, the Cr(T) at 100 m at S1 was estimated to be ∼19% day–1 on average, and it decreased with depth. At around 1000 m, the Cr(T) values at both stations were comparable, and they were nearly constant below 1000 m. The [O2]/([KO2] + [O2]) ratio at around 100 m at K2 was about 0.9 (Figure 7B), and it decreased with depth. The minimum [O2]/([KO2] + [O2]) ratio of 0.5 occurred at a depth of ∼600 m. This pattern is attributable to the O2 minimum at that depth (∼12 μM, Figure 5B). The [O2]/([KO2] + [O2]) ratio at S1 was estimated to be ∼0.9 in the upper 600 m and below 3000 m. Between these depths, the [O2]/([KO2] + [O2]) ratio decreased (Figure 5B) and reached a minimum (∼0.7) at around 1000 m. A comparison of the Cr(T) values and [O2]/([KO2] + [O2]) ratios between the two stations revealed that the Cr(T) was on average ∼8 times higher at around 100 m and more than twice as high in the upper 600 m at S1 than at K2, whereas the [O2]/([KO2] + [O2]) ratio was slightly higher in the twilight zone (200–1000 m) and at most twice as high at around 600 m at S1 than at K2 (Figure 7C). These analyses indicated that the rate of respiration of POC in the upper ∼600 m was significantly higher at S1 than at K2. This difference could be attributed mainly to the higher water temperature at S1; the rates of respiration of POC below ∼1500 m were comparable at both stations.
Figure 7. Vertical profiles of variables related to respiration. (A) (Cr)(Q10(T– Tref)/10) (hereinafter Cr(T)), (B) ([O2]/[KO2] + [O2]) at K2 (blue) and S1 (red). Values in panels (A,B) are averages of values estimated with various Q10 values and various [KO2] in Figure 6 with standard deviation (1σ). (C) Vertical profiles of ratios at S1 and K2 of Cr(T) (label: Temp) and ([O2]/([KO2] + [O2]) (label: O2). Note that only edge of error bars or standard deviation for respective values are shown in respective figures.
Using these relationships, I estimated the vertical profiles of R(T, O) (note: the original rate [day–1] was converted to [% day–1] by multiplying the original rate by 100%) at K2 and S1 (Figure 8A). The error bounds (1σ) of the R(T,O) values were large, ∼40%, because Cr(Tref of 4°C), Q10 and [KO2] ranged from 0.02 and 0.04, 2.1 to 6.5 and 0 to 50 μM, respectively (Figures 6A,B). The variation with depth of R(T,O) at K2 was small, and the average of R(T,O) throughout the water column was ∼2.5% day–1. The small depth dependence could be attributed to the small range of temperatures throughout the water column (Figure 5A). At depths of 300–1000 m, where O2 concentrations were less than 20 μM, R(T,O) decreased slightly to ∼1% day–1. At S1, the R(T, O) between 100 and 200 m was estimated to be ∼16 (15–17)% day–1 on average, ∼8 times the corresponding rate at K2. This difference could be attributed mainly to the higher temperature at S1 versus K2. The R(T, O) at S1 decreased with increasing depth, and below 1500 m it became comparable to the corresponding R(T, O) at K2.
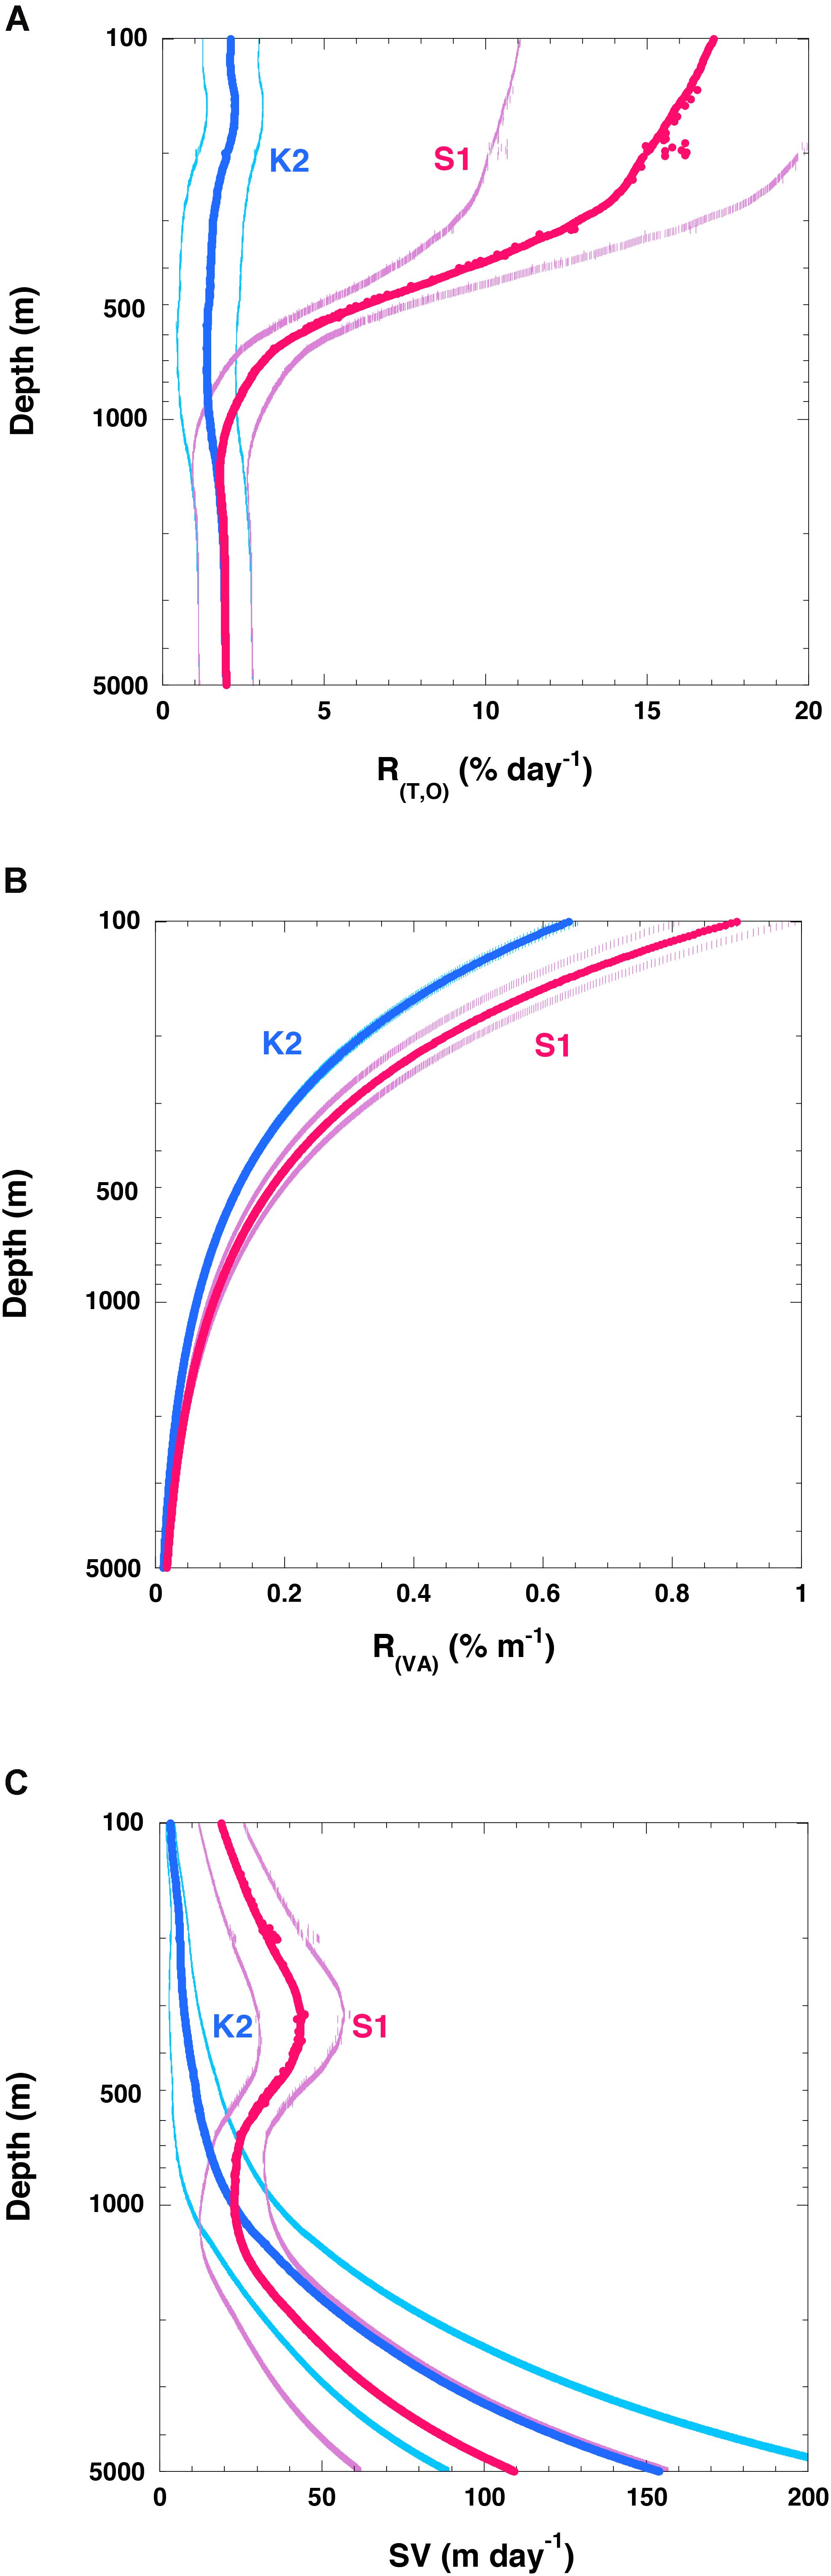
Figure 8. Vertical profiles of variables related to attenuation of particle fluxes. (A) R(T, O) (rate of respiration of POC flux:% day– 1), (B) vertical attenuation rate of POC flux (R(VA):% m– 1) at K2 (blue) and S1 (red), and (C) POC sinking velocity (SV) at K2 (blue) and S1 (red). The values in panels (A,C) are averages for each 1-m interval with standard deviations (1σ). Error bars in panel (B) are 2% (10%) of respective values for K2 (S1) based on data in Figure 3. Note that only edge of error bars or standard deviation for respective values are shown in respective figures.
To determine whether these R(T,O) rates were reasonable, I compared them to the attenuation rate of the POC flux (R(VA):% m–1). Although some deviations from the shape of the Martin curve could not be ruled out at depths below 200 m because of limited POC flux data, values of R(VA) at z m (R(VA) (z)) were estimated using the Martin curve with the exponent b proposed in this study (K2: 0.64, S1: 0.90) as follows:
At K2 and S1, the R(VA) values at 200 m were ∼0.3 and ∼0.5% m–1, respectively (Figure 8B), and they decreased with increasing depth. At 1000 (5000) m, the R(VA) values at K2 and S1 were ∼0.05 (0.02) and 0.1 (0.02)% m–1, respectively:
The R(VA) rate was determined from the R(T,O) rates and the sinking velocity of the POC or particles (SV) as follows:
It should be noted that R(VA)/100 is inversely related to the Remineralization Length Scale (RLS: RLS = SV/R(T,O)), which has been used as an index of biological carbon pump efficiency (e.g., Cram et al., 2018).
I used R(T,O) (Figure 8A) and R(VA) (Figure 8B) to estimate SV (Figure 8C). At K2, the average SV at 200 m was estimated to be ∼6 m day–1, and the SV increased with increasing depth. The SV became roughly 25 m day–1 at ∼1000 m and roughly 150 m day–1 at ∼5000 m. At S1, the average SV at 200 m was estimated to be ∼40 m day–1, and the SV increased to roughly 45 m day–1 at ∼350 m. The SV then decreased with increasing depth, and at around 1000 m the SV was ∼25 m day–1, comparable to the SV at the same depth at K2. At depths greater than 1000 m, the SVs at S1 were estimated to be smaller than those at K2, and they increased with depth again. This pattern is attributable to the fact that the R(VA) was still larger at S1 than at K2 at depths greater than 1000 m, whereas R(T,O) values were comparable at both stations. At 5000 m, the average SV was estimated to be ∼110 m day–1. An increase of SV with depth has previously been reported (Berelson, 2002; Honda et al., 2009, 2013; Villa-Alfageme et al., 2016). My estimate that the SV was larger at S1 than at K2 in the upper 500 m is consistent with the results of previous studies (Honda et al., 2013; Sukigara et al., 2019) and thus seems reasonable. However, the absolute values of the SVs estimated in this study seem somewhat low compared to previous estimates: 72 m day–1 between 60 and 1000 m, and 136 m day–1 between 1000 and 4810 m at K2 (Honda et al., 2009); 26–71 m day–1 at K2 and 22–46 m day–1 at S1 in the upper 500 m, and >180 m day–1 below 500 m at both stations (Honda et al., 2013); and ∼30 m day–1 at K2 and ∼60 m day–1 at S1 at depths of 100–200 m (Sukigara et al., 2019). The low SVs estimated in this study might be attributable to the low Cr values used, 0.12 ± 0.03 day–1 at 15°C and 0.03 ± 0.01 day–1 at 4°C, based on the report of Iversen and Ploug (2013). For comparison, McDonnell et al. (2015) reported an average Cr of 0.5 (0.5–1.5) day–1 for POC flux at the Atlantic subtropical station BATS, and DeVries and Weber (2017) used a Cr of 0.32 ± 0.15 day–1 for fast-sinking POC and of 0.16 ± 0.06 day–1 for slow-sinking POC in their numerical simulation of the vertical attenuation of the global POC flux. In this study, metabolic rates were assumed to depend only on water temperature and O2 concentration. Although many papers have discussed the hydraulic pressure effect on prokaryote production (reviewed by Nagata et al., 2010; Tamburini et al., 2013), I did not consider the hydraulic pressure effect on Cr and Q10 because no appropriate parameterization of its effect that could have been applied to this study has been proposed.
In addition, I did not take into account the biomass and rate of production of zooplankton and prokaryotes. The K2S1 project (Honda et al., 2017) has revealed that the biomasses of metazoan zooplankton (hereinafter ZP) and prokaryotes are ∼7 times and ∼1.5 times higher at K2 than at S1, respectively, and the carbon demands of ZP and prokaryotes at K2 were estimated to be ∼2.5 times and ∼1.4 times the corresponding demands at S1 (Table 2). This pattern is inconsistent with the smaller POC remineralization rate at K2 than at S1. The ZP carbon demand per unit biomass at S1 has been estimated to be ∼2.8 times (7/2.5) the corresponding demand at K2. In contrast, based on Figure 8A, the average R(T,O) at S1 in the twilight zone (100–1000 m) was estimated to be ∼4.4 times the average R(T,O) at K2. Thus, the estimated R(T,O) at K2, without consideration of the effect of ZP, might be underestimated relative to the R(T,O) at S1.
Table 2. Biomasses of metazoan zooplankton (ZP) and prokaryotes, estimated biological carbon demands of ZP and prokaryotes, and carbon supplies estimated from differences of POC fluxes, DOC fluxes, and ZP excretion.
Moreover, it has been reported that the total carbon demands of ZP and prokaryotes tend to exceed the total carbon supply by remineralization of sinking POC and the excretion of dissolved organic carbon (DOC) by ZP, especially at K2 (Table 2). A similar mismatch between the carbon supply and demand has also been observed in other ocean basins. In a recent review, Boyd et al. (2019) proposed that, besides the particle flux due to gravitational settling, other carbon transport mechanisms may contribute to the carbon supply. They call such mechanisms “particle injection pumps”: the supply of suspended particles to the ocean interior by, for example, eddy-induced subduction or the seasonal deepening of the mixed layer. In addition, slowly sinking particles (Giering et al., 2014) or suspended particles in the mesopelagic layer (Briggs et al., 2020), some of which are transported laterally (Lam and Bishop, 2008) and are difficult to observe with sediment trap measurements, might help to meet the biological carbon demand in the ocean interior. A discrepancy between the remineralization of sinking POC and biomass/carbon demand is therefore possible, and quantification of the relationship between these is strongly recommended in future studies.
Conclusion
Measurements of the fluxes of sinking particles at the western Pacific subarctic-eutrophic time-series station K2 and the subtropical-oligotrophic station S1 during the K2S1 project showed that the vertical attenuation of POC fluxes was smaller at subarctic station K2 than at subtropical station S1. In other words, POC was transported vertically more efficiently at station K2 than at station S1. The more efficient transport at K2 might be due to protection of the POC by diatoms from degradation and to the lower microbial metabolic rates in the twilight zone at K2 due to the lower temperatures and O2 concentrations at K2. However, the carbon supplied by POC, DOC, and ZP to the ocean interior was insufficient to satisfy the observed biological carbon demand there, especially at station K2. The reason for this mismatch is still an open question.
Data Availability Statement
Publicly available datasets were analyzed in this study. This data can be found here: http://ebcrpa.jamstec.go.jp/k2s1/en/.
Author Contributions
MH designed the research and wrote the manuscript with great support from all concerned in the K2S1 project.
Funding
This work was financially supported by Grants-in-Aid for Scientific Research (KAKENHI JP18H04144 and JP19H05667) funded by the Ministry of Education, Culture, Sports, Science, and Technology-Japan (MEXT).
Conflict of Interest
The authors declare that the research was conducted in the absence of any commercial or financial relationships that could be construed as a potential conflict of interest.
Acknowledgments
The author acknowledges all scientists, students, marine technicians, and ship crews who participated in the K2S1 project. Without their hard work, this research would never have been completed. Dr. Mario Uchimiya of the University of Georgia provided prokaryote data and valuable comments concerning the discussion of prokaryote biomass and production. The author deeply appreciate reviewers for their constructive and suggestive comments, TF as handling editor and guest editors of special issue, including Drs. Maureen H. Conte, Rut P. Pamies, and Gerhard J. Herndl.
Footnotes
References
Armstrong, R. A., Lee, C., Hedges, J. I., Honjo, S., and Wakeham, S. G. (2002). A new, mechanistic model for organic carbon fluxes in the ocean based on the quantitative association of POC with ballast minerals. Deep Sea Res. Part II 49, 219–236. doi: 10.1016/S0967-0645(01)00101-1
Bach, L. T., Stange, P., Taucher, J., Achterberg, E. P., Algueró−Muñiz, M., Horn, H., et al. (2019). The influence of plankton community structure on sinking velocity and remineralization rate of marine aggregates. Global Biogeochem. Cycles 33, 971–994. doi: 10.1029/2019GB006256
Banse, K. (1990). New views on the degradation and disposition of organic particles as collected by sediment traps in the open ocean. Deep Sea Res. Part A 37, 1177–1195. doi: 10.1016/0198-0149(90)90058-4
Berelson, W. L. (2002). Particle settling rates increase with depth in the ocean. Deep Sea Res. II 49, 237–251. doi: 10.1016/s0967-0645(01)00102-3
Berelson, W. M. (2001). The flux of particulate organic carbon into the ocean interior.: a comparison of four U.S. JGOFS regional studies. Oceanography 14, 59–64.
Berger, W. H., Fischer, K., Lai, C., and Wu, G. (1987). “Ocean carbon flux: global maps of primary production and export production,” in Biogeochemical Cycling and Fluxes between the Deep Euphotic Zone and Other Oceanic Realms, Vol. 3, ed. C. Agegian (Silver Spring, MD: NOAA), 87–30.
Betzer, P. R., Shower, W. L., Laws, E. A., Winn, C. D., Ditullio, G. R., and Kroopnick, P. M. (1984). Primary productivity and particle fluxes on a transect of the equator at 153°W in the Pacific Ocean. Deep Sea Res. 31, 1–11. doi: 10.1016/0198-0149(84)90068-2
Boyd, P. W., Claustre, H., Levy, M., Siegel, D. A., and Weber, T. (2019). Multi-faceted particle pumps drive carbon sequestration in the ocean. Nature 568, 327–335. doi: 10.1038/s41586-019-1098-2
Boyd, P. W., and Trull, T. W. (2007). Understanding the export of biogenic particles in oceanic waters: is there consensus? Prog. Oceanogr. 72, 276–312. doi: 10.1016/j.pocean.2006.10.007
Briggs, N., Dall’Olmo, G., and Claustre, H. (2020). Major role of particle fragmentation in regulating biological sequestration of CO2 by the oceans. Science 367, 791–793. doi: 10.1126/science.aay1790
Buesseler, K. O. (1998). The decoupling of production and particulate export in the surface ocean. Global Biogeochem. Cycles 12, 297–310. doi: 10.1029/97GB03366
Buesseler, K. O., and Boyd, P. W. (2009). Shedding light on processes that control particle export and flux attenuation in the twilight zone of the open ocean. Limnol. Oceanogr. 54, 1210–1232. doi: 10.4319/lo.2009.54.4.1210
Buesseler, K. O., Lamborg, C. H., Boyd, P. W., Lam, P. J., Trull, T. W., Bidigare, R., et al. (2007). Revisiting carbon flux through the ocean’s twilight zone. Science 316, 567–570. doi: 10.1126/science.1137959
Buesseler, K. O., Trull, T. W., Steinberg, D. K., Silver, M. W., Siegel, D. A., Saitoh, S. I., et al. (2008). VERTIGO (VERtical Transport In the Global Ocean): a study of particle sources and flux attenuation in the North Pacific. Deep Sea Res. Part II 55, 1522–1539. doi: 10.1016/j.dsr2.2008.04.024
Cael, B. B., and Bisson, K. (2018). Particle flux parameterizations: quantitative and mechanistic similarities and differences. Front. Mar. Sci. 5:395. doi: 10.3389/fmars.2018.00395
Cram, J. A., Weber, T., Leung, S. W., McDonnell, A. M. P., Liang, J.-H., and Deutsch, C. (2018). The role of particle size, ballast, temperature, and oxygen in the sinking flux to the deep sea. Global Biogeochem. Cycles 32, 858–876. doi: 10.1029/2017GB005710
DeVries, T., and Weber, T. (2017). The export and fate of organic matter in the ocean: new constraints from combining satellite and oceanographic tracer observations. Global Biogeochem. Cycles 31, 535–555. doi: 10.1002/2016GB005551
Dodimead, A. J., Favorite, F., and Hirano, T. (1963). Winter oceanographic conditions in the central Subarctic Pacific. Bull. Int. North Pacific Comm. 13, 1–195.
Doney, S., Fabry, V. J., Feely, R. A., and Kleypas, J. A. (2009). Ocean acidification: the other CO2 problem. Annu. Rev. Mar. Sci. 2009, 169–192.
Favorite, F., Dodimead, A. J., and Nasu, K. (1976). Oceanography of the subarctic Pacific region. Bull. Int. North Pacific Comm. 33, 1–187.
Fisher, G., and Karakas, G. (2009). Sinking rates and ballast composition of particles in the Atlantic Ocean: implications for the organic carbon fluxes to the deep ocean. Biogeosciences 6, 85–102. doi: 10.5194/bg-6-85-2009
Francois, R., Honjo, S., Krishfield, R., and Manganini, S. (2002). Factors controlling the flux of organic carbon to the bathypelagic zone of the ocean. Global Biogeochem. Cycles 16:1087. doi: 10.1029/2001GB001722
Garcia, H. E., Locarnini, R. A., Boyer, T. P., Antonov, J. I., Zweng, M. M., Baranova, O. K., et al. (2010). World Ocean Atlas 2009, Volume 4: Nutrients (Phosphate, Nitrate, Silicate). ed. S. Levitus (Washington, DC: U.S. Government Printing Office), 398.
Giering, S. L. C., Sanders, R., Lampitt, R. S., Anderson, T. R., Tamburini, C., Boutrif, M., et al. (2014). Reconciliation of the carbon budget in the ocean’s twilight zone. Nature 507, 480–483. doi: 10.1038/nature13123
Gloege, L., McKinley, G. A., Mouw, C. B., and Clochetto, A. R. (2017). Global evaluation of particulate organic carbon flux parameterizations and implications for atmospheric pCO2. Global Biogeochemical Cycles 31, 1192–1215. doi: 10.1002/2016GB005535
Hansen, B., Fotel, F. L., Jensen, N. J., and Madsen, S. D. (1996). Bacteria associated with a marine planktonic copepod in culture. II. Degradation of fecal pellets produced on a diatom, a nanoflagellate or a dinoflagellate diet. J. Plankton Res. 18, 275–288. doi: 10.1093/plankt/18.2.275
Heinze, C. (2004). Simulating oceanic CaCO3 export production in the greenhouse. Geophys. Res. Lett. 31:6308. doi: 10.1029/2004GL020613
Henson, S., Le Moigne, F., and Giering, S. (2019). Drivers of carbon export efficiency in the global ocean. Global Biogeochem. Cycles 33, 891–903. doi: 10.1029/2018GB006158
Henson, S. A., Sanders, R., and Madsen, E. (2012). Global patterns in efficiency of particulate organic carbon export and transfer to the deep ocean. Global Biogeochem. Cycles 26:GB1028.
Henson, S. A., Yool, A., and Sanders, R. (2015). Variability in efficiency of particulate organic carbon export: a model study. Global Biogeochem. Cycles 29, 33–45. doi: 10.1002/2014GB004965
Honda, M. C., Imai, K., Nojiri, Y., Hoshi, F., Sugawara, T., and Kusakabe, M. (2002). The biological pump in the northwestern North Pacific based on fluxes and major components of particulate matter obtained by sediment trap experiments (1997–2000). Deep Sea Res. II 49, 5595–5625. doi: 10.1016/s0967-0645(02)00201-1
Honda, M. C., and Kawakami, H. (2014). Sinking velocity of particulate radiocesium in the northwestern North Pacific. Geophys. Res. Lett. 41, 3959–3965. doi: 10.1002/2014GL060126
Honda, M. C., Kawakami, H., Matsumoto, K., Wakita, M., Fujiki, T., Mino, Y., et al. (2015). Comparison of sinking particles in the upper 200 m between subarctic station K2 and subtropical station S1 based on drifting sediment trap experiments. J. Oceanogr. 72, 373–386. doi: 10.1007/s10872-015-0280-x
Honda, M. C., Kawakami, H., Watanabe, S., and Saino, T. (2013). Concentration and vertical flux of Fukushima-derived radiocesium in sinking particles from two sites in the Northwestern Pacific Ocean. Biogeoscience 10, 3525–3534. doi: 10.5194/bg-10-3525-2013
Honda, M. C., Sasai, Y., Siswanto, E., Kuwano-Yoshida, A., Aiki, H., and Cronin, M. F. (2018). Impact of cyclonic eddies and typhoons on biogeochemistry in the oligotrophic ocean based on biogeochemical / physical / meteorological time-series at station KEO. Prog. Earth Planet. Sci. 5:42. doi: 10.1186/s40645-018-0196-3
Honda, M. C., Sasaoka, K., Kawakami, H., Matsumoto, K., Watanabe, S., and Dickey, T. (2009). Application of underwater optical data to estimation of primary productivity. Deep Sea Res. I 56, 2281–2292. doi: 10.1016/j.dsr.2009.08.009
Honda, M. C., Wakita, M., Matsumoto, K., Fujiki, T., Siswanto, E., Sasaoka, K., et al. (2017). Comparison of carbon cycle between the western Pacific subarctic and subtropical time-series stations: highlights of the K2S1 project. J. Oceanogr. 73, 647–667. doi: 10.1007/s10872-017-0423-3
Honda, M. C., and Watanabe, S. (2010). Importance of biogenic opal as ballast of particulate organic carbon (POC) transport and existence of mineral ballast-associated and residual POC in the Western Pacific Subarctic Gyre. Geophys. Res. Lett. 37:L02605. doi: 10.1029/2009GL041521
Ittekkot, V. (1993). The abiotically driven biological pump in the ocean and short-term fluctuations in the atmospheric CO2 content. Global Planet. Change 8, 17–25. doi: 10.1016/0921-8181(93)90060-2
Iversen, M. H., and Ploug, H. (2013). Temperature effects on carbon-specific respiration rate and sinking velocity of diatom aggregates – potential implications for deep ocean export processes. Biogeosciences 10, 4073–4085. doi: 10.5194/bg-10-4073-2013
Kalvelage, T., Lavik, G., Jensen, M. M., Revsbech, N. P., Löscher, C., Schunck, H., et al. (2015). Aerobic microbial respiration in oceanic oxygen minimum zones. PLoS One 10:e0133526. doi: 10.1371/journal.pone.0133526
Keil, R. G., Neibauer, J. A., and Devol, A. H. (2016). A multiproxy approach to understanding the “enhanced” flux of organic matter through the oxygen-deficient waters of the Arabian Sea. Biogeosciences 13, 2077–2092. doi: 10.5194/bg-13-2077-2016
Klaas, C., and Archer, D. E. (2002). Association of sinking organic matter with various types of mineral ballast in the deep sea: implications for the rain ratio. Global Biogeochem. Cycles 16:1116. doi: 10.1029/2001GB001765
Knauer, G. A., Martin, J. H., and Bruland, K. W. (1979). Fluxes of particulate carbon, nitrogen, and phosphorus in the upper water column of the northeast Pacific. Deep Sea Res. 26, 97–108. doi: 10.1016/0198-0149(79)90089-x
Kobari, T., Nakamura, R., Unno, K., Kitamura, M., Yanabe, K., Nagafuku, H., et al. (2016). Seasonal variability in carbon demand and flux by mesozooplankton communities at subarctic and subtropical sites in the western North Pacific Ocean. J. Oceanogr. 72, 403–418. doi: 10.1007/s10872-015-0348-7
Kwon, E. Y., Primeau, F., and Sarmiento, J. L. (2009). The impact of remineralization depth on the air–sea carbon balance. Nature Geosci. 2, 630–635. doi: 10.1038/ngeo612
Lam, P. J., and Bishop, J. K. B. (2008). The continental margin is a key source of iron to the HNLC North Pacific Ocean. Geophys. Res. Lett. 35:L07608. doi: 10.1029/2008GL033294
Laufkötter, C., John, J. G., Stock, C. A., and Dunne, J. P. (2017). Temperature and oxygen dependence of the remineralization of organic matter. Global Biogeochem. Cycles 31, 1038–1050. doi: 10.1002/2017GB005643
Laws, E. A., DiTullio, G. R., Betzer, P. R., Karl, D. M., and Carder, K. L. (1989). Autrophic production and elemental fluxes at 26°N, 155°W in the North Pacific subtropical gyre. Deep Sea Res. 36, 103–120. doi: 10.1016/0198-0149(89)90021-6
Laws, E. A., Falkowski, P. G., Smith, W. O. Jr., Ducklow, H., and McCarthy, J. J. (2000). Temperature effects on export production in the open ocean. Global Biogeochem. Cycles 14, 1231–1246. doi: 10.1029/1999gb001229
Lima, I. D., Lam, P. J., and Doney, S. C. (2014). Dynamics of particulate organic carbon flux in a global ocean model. Biogeosciences 11, 1177–1198. doi: 10.5194/bg-11-1177-2014
Lorius, C., Jouzel, J., Raynaud, D., Hansen, J., and Treut, H. L. (1990). The Ice-core record: climate sensitivity and future greenhouse warming. Nature 347, 139–145. doi: 10.1038/347139a0
Maerz, J., Six, K. D., Stemmler, I., Ahmerkamp, S., and Ilyina, T. (2020). Microstructure and composition of marine aggregates as co-determinants for vertical particulate organic carbon transfer in the global ocean. Biogeosciences 17, 1765–1803. doi: 10.5194/bg-17-1765-2020
Marsay, C. M., Sanders, R. J., Henson, S. A., Pabortsava, K., Achterberg, E. P., and Lampit, R. C. (2015). Attenuation of sinking particulate organic carbon flux through the mesopelagic ocean. Proc. Natl. Acad. Sci. U.S.A. 112, 1089–1094. doi: 10.1073/pnas.1415311112
Martin, J. H., Knauer, G. A., Karl, D. M., and Broenkow, W. W. (1987). VERTEX: carbon cycling in the northeast Pacific. Deep Sea Res. 34, 267–285. doi: 10.1016/0198-0149(87)90086-0
Matsumoto, K., Abe, O., Fujiki, T., Sukigara, C., and Mino, Y. (2016). Primary productivity at the time-series stations in the northwestern Pacific Ocean: is the subtropical station unproductive? J. Oceanogr. 72, 359–371. doi: 10.1007/s10872-016-0354-4
Mayer, L. M. (1994). Surface area control of organic carbon accumulation in continental shelf sediments. Geochim. Cosmochim. Acta 58, 1271–1284. doi: 10.1016/0016-7037(94)90381-6
McDonnell, A. M. P., Boyd, P. W., and Buesseler, K. O. (2015). Effects of sinking velocities and microbial respiration rates on the attenuation of particulate carbon fluxes through the mesopelagic zone. Global Biogeochem. Cycles 29, d175–d193. doi: 10.1002/2014GB004935
Nagata, T., Tamburini, C., Aristegui, J., Baltar, F., Bochdansky, A. B., Fonda-Umani, S., et al. (2010). Emerging concepts on microbial processes in the bathypelagic ocean-ecology, biogeochemistry, and genomics. Deep Sea Res II 57, 1519–1536. doi: 10.1016/j.dsr2.2010.02.019
Otosaka, S., and Noriki, S. (2005). Relationship between composition of settling particles and organic carbon flux in the western North Pacific and the Japan Sea. J. Oceanogr. 61, 25–40. doi: 10.1007/s10872-005-0017-3
Pace, M. L., Knauer, G. A., Karl, D. M., and Martin, J. H. (1987). Primary production and vertical flux in the eastern Pacific Ocean. Nature 325, 803–804. doi: 10.1038/325803a0
Palevsky, H. I., and Doney, S. (2018). How choice of depth horizon influences the estimated spatial patterns and global magnitude of ocean carbon export flux. Geophys. Res. Lett. 45, 4171–4179. doi: 10.1029/2017GL076498
Passow, U., and De La Rocha, C. L. (2006). Accumulation of mineral ballast on organic aggregates. Global Biogeochem. Cycles 20:GB1013. doi: 10.1029/2005GB002579
Passow, U., Shipe, R. F., Murray, A., Pak, D. K., Brzezinski, M. A., and Alldredge, A. L. (2001). The origin of transparent exopolymer particles (TEP) and their role in the sedimentation of particulate matter. Cont. Shelf Res. 21, 327–346. doi: 10.1016/s0278-4343(00)00101-1
Pavia, F. J., Anderson, R. F., Lam, P. J., Cael, B. B., Vivancos, S. M., Fleisher, M. Q., et al. (2019). Shallow particulate organic carbon regeneration in the South Pacific Ocean. Proc. Natl. Acad. Sci. U.S.A. 116, 9753–9758. doi: 10.1073/pnas.1901863116
Ploug, H. (2001). Small-scale oxygen fluxes and remineralization in sinking aggregates. Limnol. Oceanogr. 46, 1624–1631. doi: 10.4319/lo.2001.46.7.1624
Quinlan, A. V. (1981). The thermal sensitivity of generic Michaelis-Menten processes without catalyst denaturation or inhibition. J. Thermal Biol. 6, 103–114. doi: 10.1016/0306-4565(81)90061-9
Redfield, A. C., Ketchum, B. H., and Richards, F. A. (1963). “The influence of organisms on the composition of seawater,” in The Sea, Vol. 2, ed. M. N. Hill (New York, NY: Interscience), 26–77.
Simon, M., Grossart, H.-P., Schweitzer, B., and Ploug, H. (2002). Microbial ecology of organic aggregates in aquatic ecosystems. Aquat. Microb. Ecol. 28, 175–211. doi: 10.3354/ame028175
Smith, K. L. Jr., Ruhl, H. A., Huffard, C. L., Messie, M., and Kahru, M. (2018). Episodic organic carbon fluxes from surface ocean to abyssal depths during long-term monitoring in NE Pacific. Proc. Natl. Acad. Sci. U.S.A. 115, 12235–12240. doi: 10.1073/pnas.1814559115
Suess, E. (1980). Particle organic carbon flux in the ocean surface productivity and oxygen utilization. Nature 288, 260–263. doi: 10.1038/288260a0
Sukigara, C., Mino, Y., Kawakami, H., Honda, M. C., Fujiki, T., Matsumoto, K., et al. (2019). Sinking dynamics of particulate matter in the subarctic and subtropical regions of the western North Pacific. Deep Sea Res. I 144, 17–27. doi: 10.1016/j.dsr.2018.11.004
Tamburini, C., Boutrif, M., Garel, M., Colwell, R. R., and Deming, J. W. (2013). Prokaryotic responses to hydrostatic pressure in the ocean – review. Environ. Microbiol. 15, 1262–1274. doi: 10.1111/1462-2920.12084
Taylor, S. R. (1964). Abundance of chemical elements in the continental crust: a new table. Geochim. Cosmochim. Acta 28, 1273–1285. doi: 10.1016/0016-7037(64)90129-2
Uchimiya, M., Fukuda, H., Wakita, M., Kitamura, M., Kawakami, H., Honda, M. C., et al. (2018). Balancing organic carbon supply and consumption in the ocean’s interior: evidence from repeated biogeochemical observations conducted in the subarctic and subtropical western North Pacific. Limnol. Oceanogr. 63, 2015–2027. doi: 10.1002/lno.10821
Villa-Alfageme, M., de Soto, F. C., Ceballos, E., Giering, L. C., Le Moigne, F. A. C., Henson, S., et al. (2016). Geographical, seasonal, and depth variation in sinking particle speeds in the North Atlantic. Geophys, Res. Lett. 43, 8609–8616. doi: 10.1002/2016GL069233
Volk, T., and Hoffert, M. I. (1985). “Ocean carbon pumps: analysis of relative strengths and efficiencies in ocean-driven atmospheric CO2 changes,” in The Carbon Cycle and Atmospheric CO2: Natural Variations Archean to Present, 32. Geophysical Monograph, eds E. T. Sundquist and W. S. Broecker (Washington, DC: American Geophysical Union), 99–110. doi: 10.1029/gm032p0099
Wakita, M., Honda, M. C., Matsumoto, K., Fujiki, T., Kawakami, H., Yasunaka, S., et al. (2016). Biological organic carbon export estimated from carbon budget in the surface water of western subarctic and subtropical North Pacific Ocean. J. Oceanogr. 72, 665–685. doi: 10.1007/s10872-016-0379-8
Weber, T., Cram, J. A., Leung, S. W., DeVries, T., and Deutsch, C. (2016). Deep ocean nutrients imply large latitudinal variation in particle transfer efficiency. Proc. Natl. Acad. Sci. U.S.A. 31, 8606–8611. doi: 10.1073/pnas.1604414113
Wilson, J. D., Barker, S., Edwards, N., Holden, P. B., and Ridgwell, A. (2019). Sensitivity of atmospheric CO2 to regional variability in particulate organic matter remineralization depths. Biogeosciences 16, 2923–2936. doi: 10.5194/bg-16-2923-2019
Yamanaka, Y., and Tajika, E. (1996). The role of the vertical fluxes of particulate organic matter and calcite in the oceanic carbon cycle: studies using an ocean biogeochemical general circulation model. Global Biogeochem. Cycles 10, 361–382. doi: 10.1029/96gb00634
Keywords: biological carbon pump, K2S1 project, sediment trap, vertical attenuation, biogenic opal, metabolism, mismatch between carbon supply and demand
Citation: Honda MC (2020) Effective Vertical Transport of Particulate Organic Carbon in the Western North Pacific Subarctic Region. Front. Earth Sci. 8:366. doi: 10.3389/feart.2020.00366
Received: 02 April 2020; Accepted: 07 August 2020;
Published: 08 September 2020.
Edited by:
Timothy Ferdelman, Max Planck Institute for Marine Microbiology (MPG), GermanyReviewed by:
Frank Dehairs, Vrije University Brussel, BelgiumJoeran Maerz, Max Planck Institute for Meteorology, Germany
Copyright © 2020 Honda. This is an open-access article distributed under the terms of the Creative Commons Attribution License (CC BY). The use, distribution or reproduction in other forums is permitted, provided the original author(s) and the copyright owner(s) are credited and that the original publication in this journal is cited, in accordance with accepted academic practice. No use, distribution or reproduction is permitted which does not comply with these terms.
*Correspondence: Makio C. Honda, hondam@jamstec.go.jp