Multiscale Integration of High-Resolution Spaceborne and Drone-Based Imagery for a High-Accuracy Digital Elevation Model Over Tristan da Cunha
 Dietmar J. Backes
 Felix Norman Teferle
- Geodesy and Geospatial Engineering, Institute of Civil and Environmental Engineering, University of Luxembourg, Luxembourg City, Luxembourg
Very high-resolution (VHR) optical Earth observation (EO) satellites as well as low-altitude and easy-to-use unmanned aerial systems (UAS/drones) provide ever-improving data sources for the generation of detailed 3-dimensional (3D) data using digital photogrammetric methods with dense image matching. Today both data sources represent cost-effective alternatives to dedicated airborne sensors, especially for remote regions. The latest generation of EO satellites can collect VHR imagery up to 0.30 m ground sample distance (GSD) of even the most remote location from different viewing angles many times per year. Consequently, well-chosen scenes from growing image archives enable the generation of high-resolution digital elevation models (DEMs). Furthermore, low-cost and easy to use drones can be quickly deployed in remote regions to capture blocks of images of local areas. Dense point clouds derived from these methods provide an invaluable data source to fill the gap between globally available low-resolution DEMs and highly accurate terrestrial surveys. Here we investigate the use of archived VHR satellite imagery with approx. 0.5 m GSD as well as low-altitude drone-based imagery with average GSD of better than 0.03 m to generate high-quality DEMs using photogrammetric tools over Tristan da Cunha, a remote island in the South Atlantic Ocean which lies beyond the reach of current commercial manned airborne mapping platforms. This study explores the potentials and limitations to combine this heterogeneous data sources to generate improved DEMs in terms of accuracy and resolution. A cross-validation between low-altitude airborne and spaceborne data sets describes the fit between both optical data sets. No co-registration error, scale difference or distortions were detected, and a quantitative cloud-to-cloud comparison showed an average distance of 0.26 m between both point clouds. Both point clouds were merged applying a conventional georeferenced approach. The merged DEM preserves the rich detail from the drone-based survey and provides an accurate 3D representation of the entire study area. It provides the most detailed model of the island to date, suitable to support practical and scientific applications. This study demonstrates that combination archived VHR satellite and low-altitude drone-based imagery provide inexpensive alternatives to generate high-quality DEMs.
Introduction
Today digital elevation data at medium spatial resolution, e.g., 30 m GSD, are freely available at almost global scale from the Shuttle Radar Topography Mission (SRTM) and the Advanced Spaceborne Thermal Emission and Reflection Radiometer (ASTER) Global Digital Elevation Map (GDEM). Conventionally, high-resolution topographic data (bellow 0.5 m GSD) are captured by dedicated mapping cameras and LiDAR sensors deployed on manned aircraft. Although these technologies became very effective during the last decades, they are still costly and can be difficult to deploy in remote and hard-to-reach regions. High-resolution DEMs derived from VHR satellite images and drone-based data can provide a valuable alternative where airborne data are not available.
The definition of the terms low-, medium- or high-resolution varies between scientific disciplines with respect to the deployed platform and sensors (e.g., spaceborne, high-, medium- or low-altitude airborne) as well as derived data products (images, DEMs and point clouds). Furthermore, technical progress in sensor and computer technologies seem to shift the definitions toward smaller GSDs over time. In the scope of this study, we use the classification selected by Dowman et al. (2012) for satellite imagery and expand this definition to DEMs. The geometric resolution of low-resolution data is larger than 30 m GSD, medium resolution data ranges from 30 – 5 m GSD, high-resolution data ranges from 5 – 1 m GSD and very high-resolution data shows a spatial resolution of less than 1 m. Since the spatial resolution of low-altitude drone imagery, e.g., 0.03 m, is at least one magnitude higher than VHR satellite images (0.30 m) these data are referred to as drone-based data.
Earth Observation missions such as Landsat and Sentinel provide a free and frequently available source of remote sensing imagery at medium resolutions (Dowman et al., 2012), which enable numerous applications such as land cover mapping, environmental monitoring and change detection (Aschbacher and Milagro-Pérez, 2012; Ban et al., 2015). Most applications also require digital elevation data, which are usually provided by SRTM and ASTER GDEM. However, many studies have reported shortcomings regarding completeness, artifacts, elevation errors and co-registration problems in these data sets (Shortridge, 2006; Tighe and Chamberlain, 2009; Guth, 2010; Shortridge and Messina, 2011; Rexer and Hirt, 2014). To overcome this problem Robinson et al. (2014) proposed a quasi-global, void-free, multiscale smooth DEM fused from ASTER and SRTM data at 90 m GSD. Higher quality and resolution DEMs at 5 m GSD or better are only commercially available at relatively high costs, e.g., Airbus WorldDEM (based on Tandem-X) or Vricon DSM (Schumann et al., 2016).
The extraction of DEMs from satellite imagery has been studied and demonstrated for decades. With the launch of the Satellite pour l’Observation de la Terre (SPOT), it was possible to generate 3D digital elevation models from satellite imagery for the first time. Using a cross-track stereo configuration, satellite images were acquired from neighboring orbits form stereo-pairs that are covering a defined region of interest. Early research showed encouraging results and verified the suitability for topographic mapping applications (Gugan and Dowman, 1988; Dowman, 1989; Muller and Dowman, 1989; Theodossiou and Dowman, 1990). However, the cross-track stereo configuration bears many challenges regarding image geometry and temporal decorrelation that influence the quality of the extracted DEM. Despite algorithmic improvements of image matching and terrain extractions, as well as improved satellite coverage, the challenges identified at the time still apply. More recent missions deployed dedicated optical sensors which allowed the acquisition of in-track stereo images. SPOT5 High-resolution Stereo (HRS) and the Advanced Land Observing Satellite (ALOS) Panchromatic Remote-sensing Instrument for Stereo Mapping (PRISM) showed improved performance (Fraser, 1997; Michalis and Dowman, 2004; Rudowski, 2004). Today, fleets of highly agile optical remote sensing satellites can collect multispectral VHR imagery with up to 0.3 m GSD. Furthermore, rapid technological advances in orbit modeling and satellite altitude control enable a very accurate determination of the direct georeference. For example, WorldView scenes have an absolute positioning accuracy of less than 5 m circular error (Digital Globe, 2016). Many of these satellites are also able to collect in-track stereo-pairs that allow high-accuracy DEM extraction. The generation of DEMs from VHR spaceborne stereo images over urban areas has been investigated by Gong and Fritsch (2016).
With the launch of the next generation of VHR optical satellites, it has also been recognized that the differences in characteristics between airborne and spaceborne images are decreasing (Dowman et al., 2012 p. 107; Chen et al., 2016). Thus, the quality of DEMs derived from satellite images ought to increase toward the quality of DEMs derived from airborne mapping sensors. It is expected that fleets of increasingly efficient satellites will collect vast amounts of image data, which will enable the extraction of detailed DEMs in almost any part of the world with increasing temporal frequency.
In this study, we report on DEMs derived by digital photogrammetric methods using three comprehensive geospatial software suites capable of processing VHR imagery. They all support common spaceborne sensor models and data formats, providing preprocessing capabilities, triangulation modules as well as surface reconstruction using dense image matching (DIM) algorithms to extract high-resolution digital surface models (DSMs). In “dense” reconstruction, one elevation is generated per pixel by matching epipolar constraint images. Energy based methods, which aim to find the best global solution (Pierrot-Deseilligny and Paparoditis, 2006; Hirschmuller, 2008; Strecha et al., 2010; Bulatov et al., 2011) produce the best results to date whereby semi-global matching (SGM) by Hirschmuller (2008) has been widely adopted in recent years. Digital surface models extracted by these methods usually include fine details, but they are also more prone to noise. Multiple overlapping satellite images can be treated as so-called multi-view stereo (MVS) configuration, which can increase the reliability of the extracted elevation models.
At the same time, low-cost, consumer-grade drones or unmanned aerial systems (UAS) have become a powerful and flexible tool to collect large blocks of images suitable to generate highly detailed point clouds, mesh models, DEMs and orthophotos with a geometric resolution of a few centimeters. Such systems are only able to cover small areas due to their limited flying time and usually deploy low-precision navigational sensors and consumer-grade cameras (Colomina and Molina, 2014). The limited endurance and data quality requirements need to be considered carefully during data capture and analysis. Many studies to investigate best practices and the accuracy potential of drone surveys have been conducted (Haala et al., 2012; Day et al., 2016; Gerke and Przybilla, 2016; Cramer et al., 2017; Gindraux et al., 2017). However, as drone technology continues to improve, e.g., the introduction of real-time kinematic (RTK) systems, the capabilities and accuracy potential of drone surveys is still evolving. Post-processing is often done by so-called structure from motion (SfM) engines, which are usually employed as black-box systems. They allow minimal user input and are only providing final results as a point cloud or mesh model without quality control. Drone photogrammetry packages, such as Pix4D (Mapper or Engine), do provide more flexibility and detailed reports with photogrammetric quality metrics. Similar to highly efficient SfM engines and simultaneous location and mapping (SLAM) algorithms, highly automated digital photogrammetric methods have advanced rapidly during recent years. However, “the names of SLAM, SfM and photogrammetry do mean different things, notwithstanding the presence of conceptual and algorithmic overlaps. It should be acknowledged unequivocally that neither SLAM nor SfM encompasses the full process of metric-quality image-based 3D measurement, object reconstruction and mapping that is today’s highly automated photogrammetry” (Fraser, 2018).
Over the last decade, numerous scientific studies have exploited free medium data sources. However, many applications, e.g., landslide and flood modeling, would benefit from even higher quality DEMs that provide better resolution with a higher level of detail and improved positional accuracy. This study explores the potential to combine existing VHR satellite and low low-altitude drone imagery to generate high-resolution DEMs on a practical example, the remote island of Tristan da Cunha. After the introduction of the study site and the available data sets, an applied workflow to generate and merge DEMs is described in the method section. The results are introduced and analyzed in detail. A discussion revisits best practice procedures, tools and methodologies, reflects on challanges and its applicability to similar study sites. The conclusion summarizes the results and shows future perspectives.
Study Site and Data Set
Amongst a number of important research installations, Tristan da Cunha hosts a recently established continuous Global Navigation Satellite System (GNSS) station and tide gauges in support of global reference frame and sea-level studies. The installation of these sensors provided an opportunity to conduct a local survey to map the local area around the harbor of Edinburgh of the Seven Seas and enable this study.
The acquired data set consists of freely available topographic mapping data (approx. 1/10,000), a large stack of archived VHR satellite imagery from Maxar/DigitalGlobe, a low-altitude drone survey as well as geodetic ground truth data (Table 1). While the topographic mapping data and the satellite images provide full coverage of the island, the drone-based images and geodetic ground truth only cover a limited local area around the harbor (Figure 1).
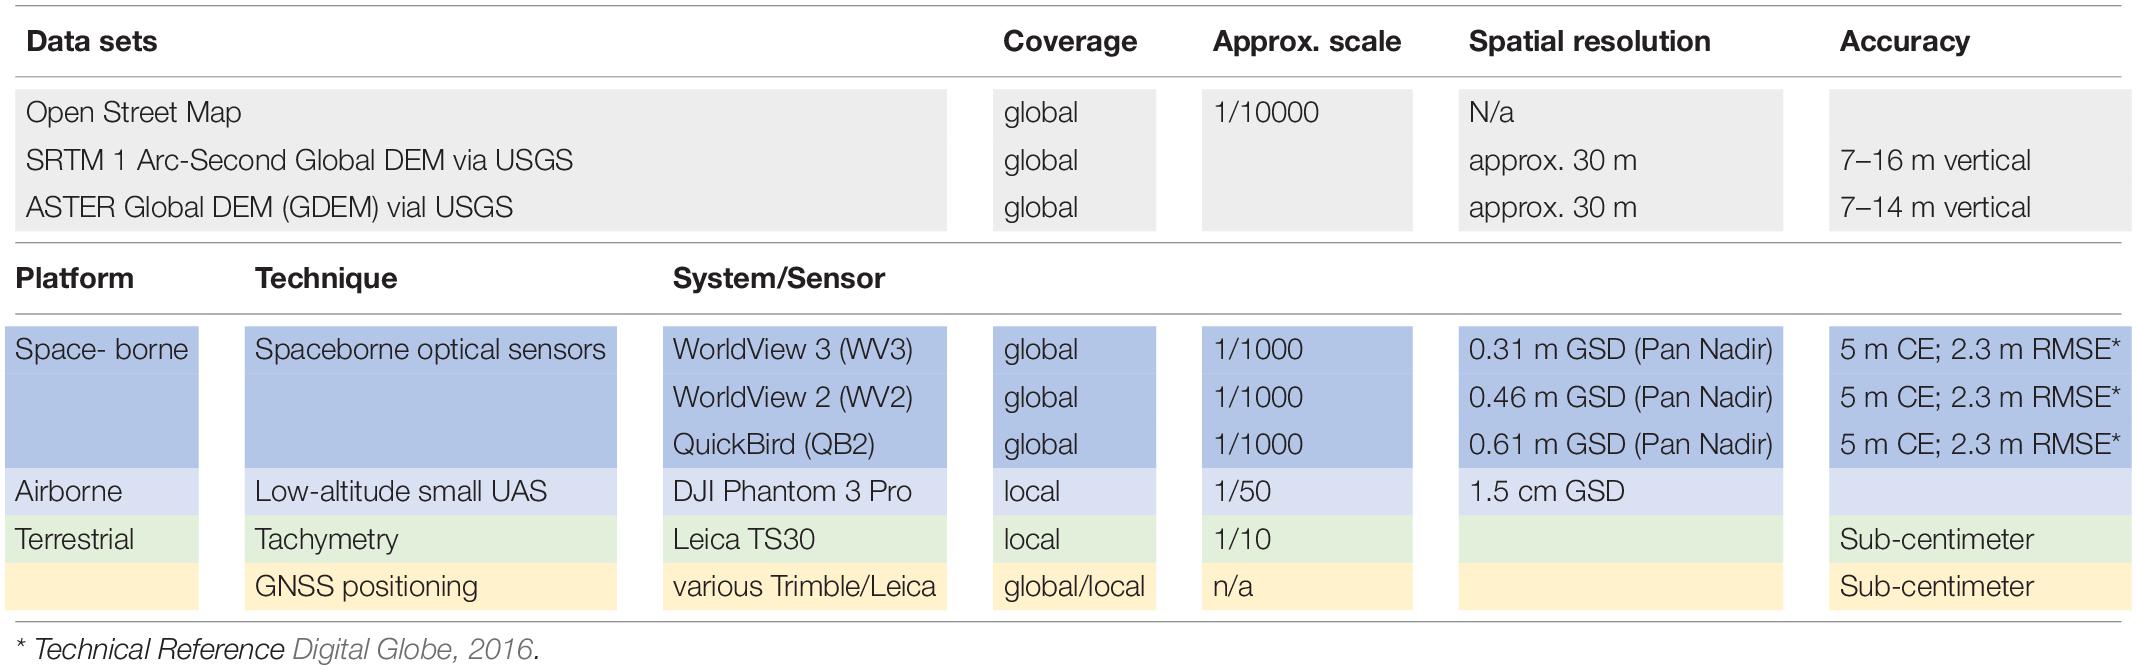
Table 1. Available data sets and sources with spatial resolution, coverage and accuracy.
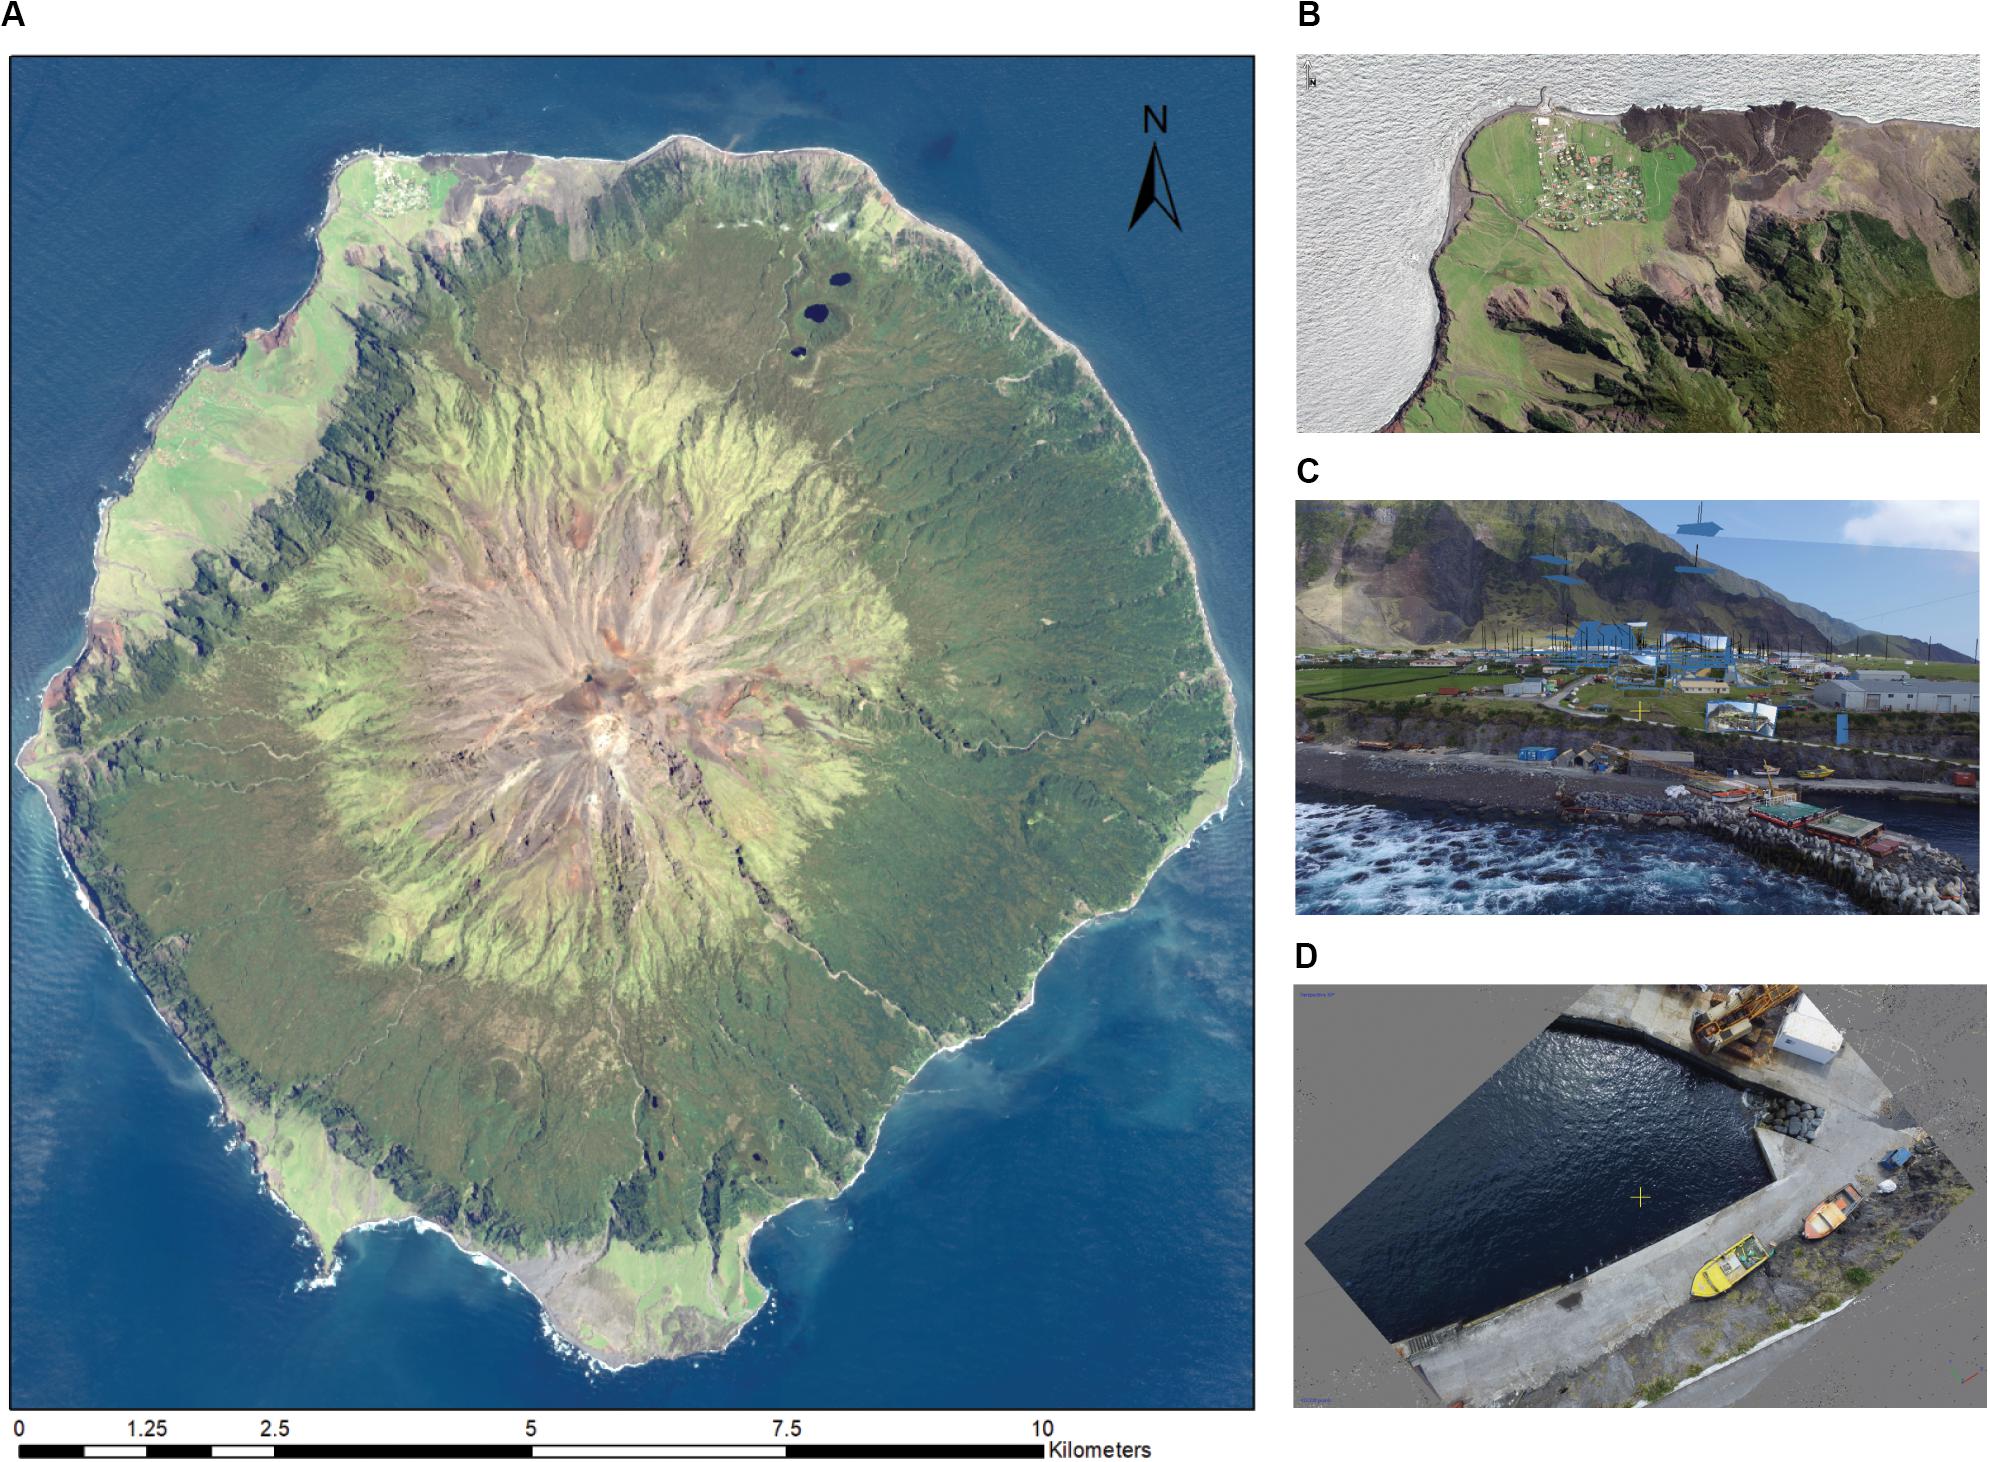
Figure 1. (A) Satellite image of Tristan da Cunha courtesy of the DigitalGlobe Foundation. (B) Zoom to Edinburgh of the Seven Seas. (C) Perspective view based on drone imagery. (D) Low-altitude drone image.
Tristan da Cunha
The small volcanic island of Tristan da Cunha is known as one of the most remote locations on the Earth. It is located at 37° 04′ S and 12° 19′ W in the South Atlantic Ocean approximately 1950 km west of Cape Town, South Africa, and 2900 km east of Buenos Aires, Argentina. Tristan da Cunha has a circular shape with a diameter of 10-12 km, covers a surface of 96 km2 and its highest point is Queen Mary’s Peak with 2062 m (Figure 1A). The last eruption of the volcano dates to 1961. The island is covered by low vegetation including grass and shrubs. Fertile but narrow coastal plains on the north-western and southern regions are followed by steep slopes that rise to approximately 500 – 800 m above the sea level. At this height the topographic gradient flattens to form a high plateau before rising to the highest peak of the island, which has the classic conical shape of an active volcano. Tristan da Cunha is also home to a population of approximately 280 people, living in the settlement of Edinburgh of the Seven Seas at the north-western coastal plain (Figure 1B). The settlement is served by a small harbor which lies exposed to strong winds and rough seas. Woodworth (2020) provides a detailed overview on the development of the harbor and the local climatic conditions.
Due to its exposed location the island has a cold temperature oceanic climate with gusty winds and gale forces storms. A persistent cloud coverage provides regular precipitation in excess to 1500 mm at sea level and over 3000 m on the mountain. An increase in coastal erosion and the frequency of landslides have been reported by the local population, which raises concerns for sustaining its inhabitants in the long-term future. Since only medium-resolution elevation data exist, there is a need for accurate 3D mapping. However, its remote location and rough weather conditions provide exceptional challenges for terrestrial, aerial as well as spaceborne data acquisitions for mapping and environmental monitoring.
Global Low and Medium-Resolution Mapping Data
Open Street Map
A topographic map of the island was available via Open Street Map (OSM). Unfortunately, little metadata about currency, source and quality were obtainable. To evaluate the accuracy of the geolocation, OSM was compared to 6 control points derived from the GCN described in section “Low-Altitude Aerial Images.” Since these control points were only located around the small local harbor area, they only provide reference information to estimate the translations in Easting and Northing but no reliable rotation of the map. The OSM map is displaced by approximately 37 m in Easting and 69 m in Northing, as shown in Figure 5.
SRTM and Aster-GDEM
Shuttle Radar Topography Mission and ASTER-GDEM provide free medium resolution DEM at the Digital Terrain Elevation Data standard (DTED) level 2 standard with 1 arc-second or approximately 30 m. Both data sets were acquired via United States Geological Survey Earth Explorer (USGS, 2018). The SRTM 1 arc-second global DEM was declassified for public use in 2014 and offers almost worldwide coverage with a substantially increased level of detail (Figures 2A,B). Despite the promise of complete coverage with no voids, both products still show some data voids on the southern part of the island and close to the summit of Queen Mary’s Peak. The ASTER-GDEM was jointly developed by Japan’s Ministry of Economy, Trade, and Industry (METI) and the United States National Aeronautics and Space Administration (NASA) (Tachikawa et al., 2011). Its current version, which is available since 2011, benefits from many improvements compared to the first version, but still contains artifacts and elevation errors on a local scale (Tachikawa et al., 2011). The DEM over Tristan da Cunha shows a slightly better level of detail at 30 m GSD compared to SRTM. It does not include data voids but shows some noise (Figure 2C).
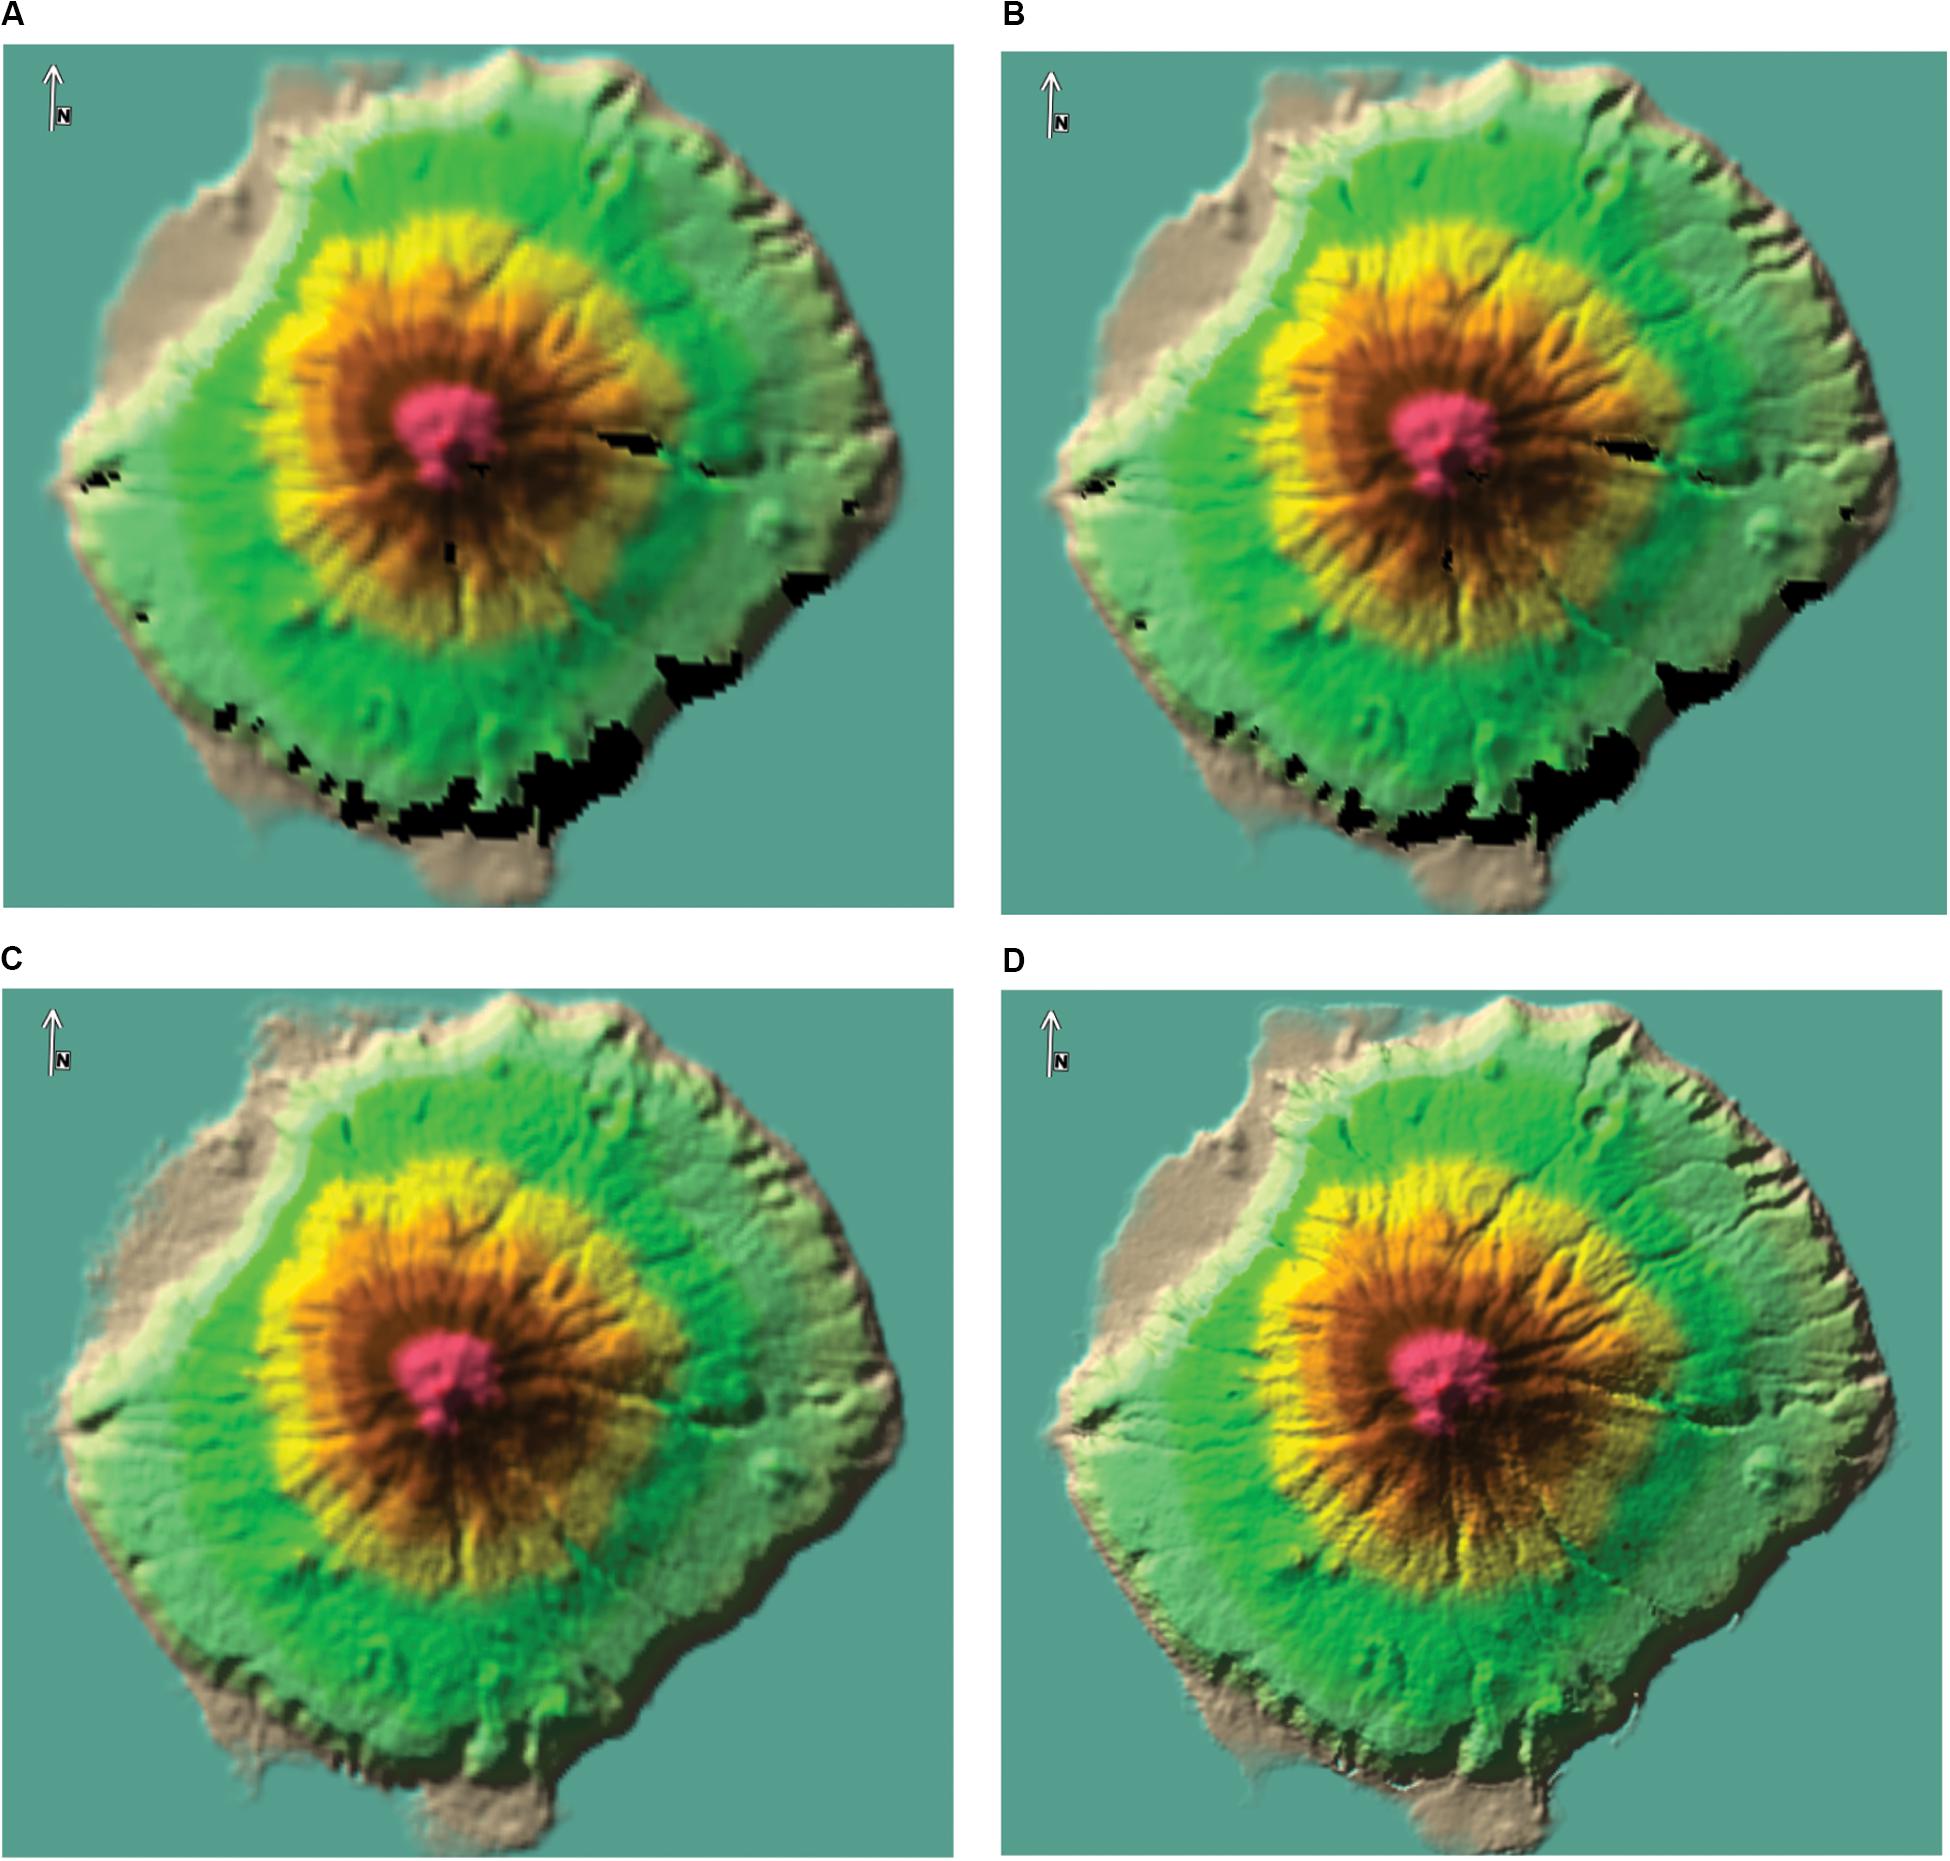
Figure 2. (A) SRTM DEM with 3″ GSD. (B) SRTM DEM with 1″ GSD. (C) ASTER-GDEM Version 2.0 with 1″ GSD. (D) mDEM with 1″ GSD.
To increase reliability and accuracy, both models were fused together using BAE Systems’ SocetGXP terrain-merge algorithm (Figure 2D). To increase reliability and accuracy, both models were merged. Following a statistical assessment of the co-registration between both models the Aster-GDEM was merged with the SRTM DEM which served as Reference DEM. After a fine registration with the removal of bias and outliers, both models are merged by combining and interpolating height values of corresponding raster cells. This was done using the BAE Systems SocetGXP terrain merge function. The merged model does not include data voids and shows a reduced level of noise compared to the Aster-GDEM but an increased level detail compared to the SRTM DEM. This medium resolution DEM (mDEM) at 30 m GSD was subsequently used as so-called ‘seed DEM’ in the stereo matching process using the VHR imagery.
VHR Optical Earth Observation Data
A comprehensive stack of VHR images was provided by DigitalGlobe which included multispectral images from QuickBird (QB), WorldView2 (WV2) and WorldView3 (WV3). Overall 64 basic and 32 Standard2A image products were delivered. While Standard2A image products are already geo-rectified using an unspecified coarse DEM, basic image products are only radiometrically corrected thus suitable for terrain extraction. A detailed overview of product specifications is given in DigitalGobe’s technical manual (Digital Globe, 2014, 2016). Table 2 provides a detailed overview of the basic satellite scenes used in this study. The scenes have spatial resolutions of up to 0.61 m for QuickBird and 0.31 m for WorldView Satellites and were acquired between February 2009 (QB) and July 2017 (WV3). Although many acquisitions include cloud coverage and atmospheric effects, a number of images were identified which provide excellent image quality over the complete extent of the island. The images have been acquired from a variety of viewing angles and are suitable for the extraction of DEMs. Figure 3 shows the “WV2 image stack” and gives an overview of the image quality.
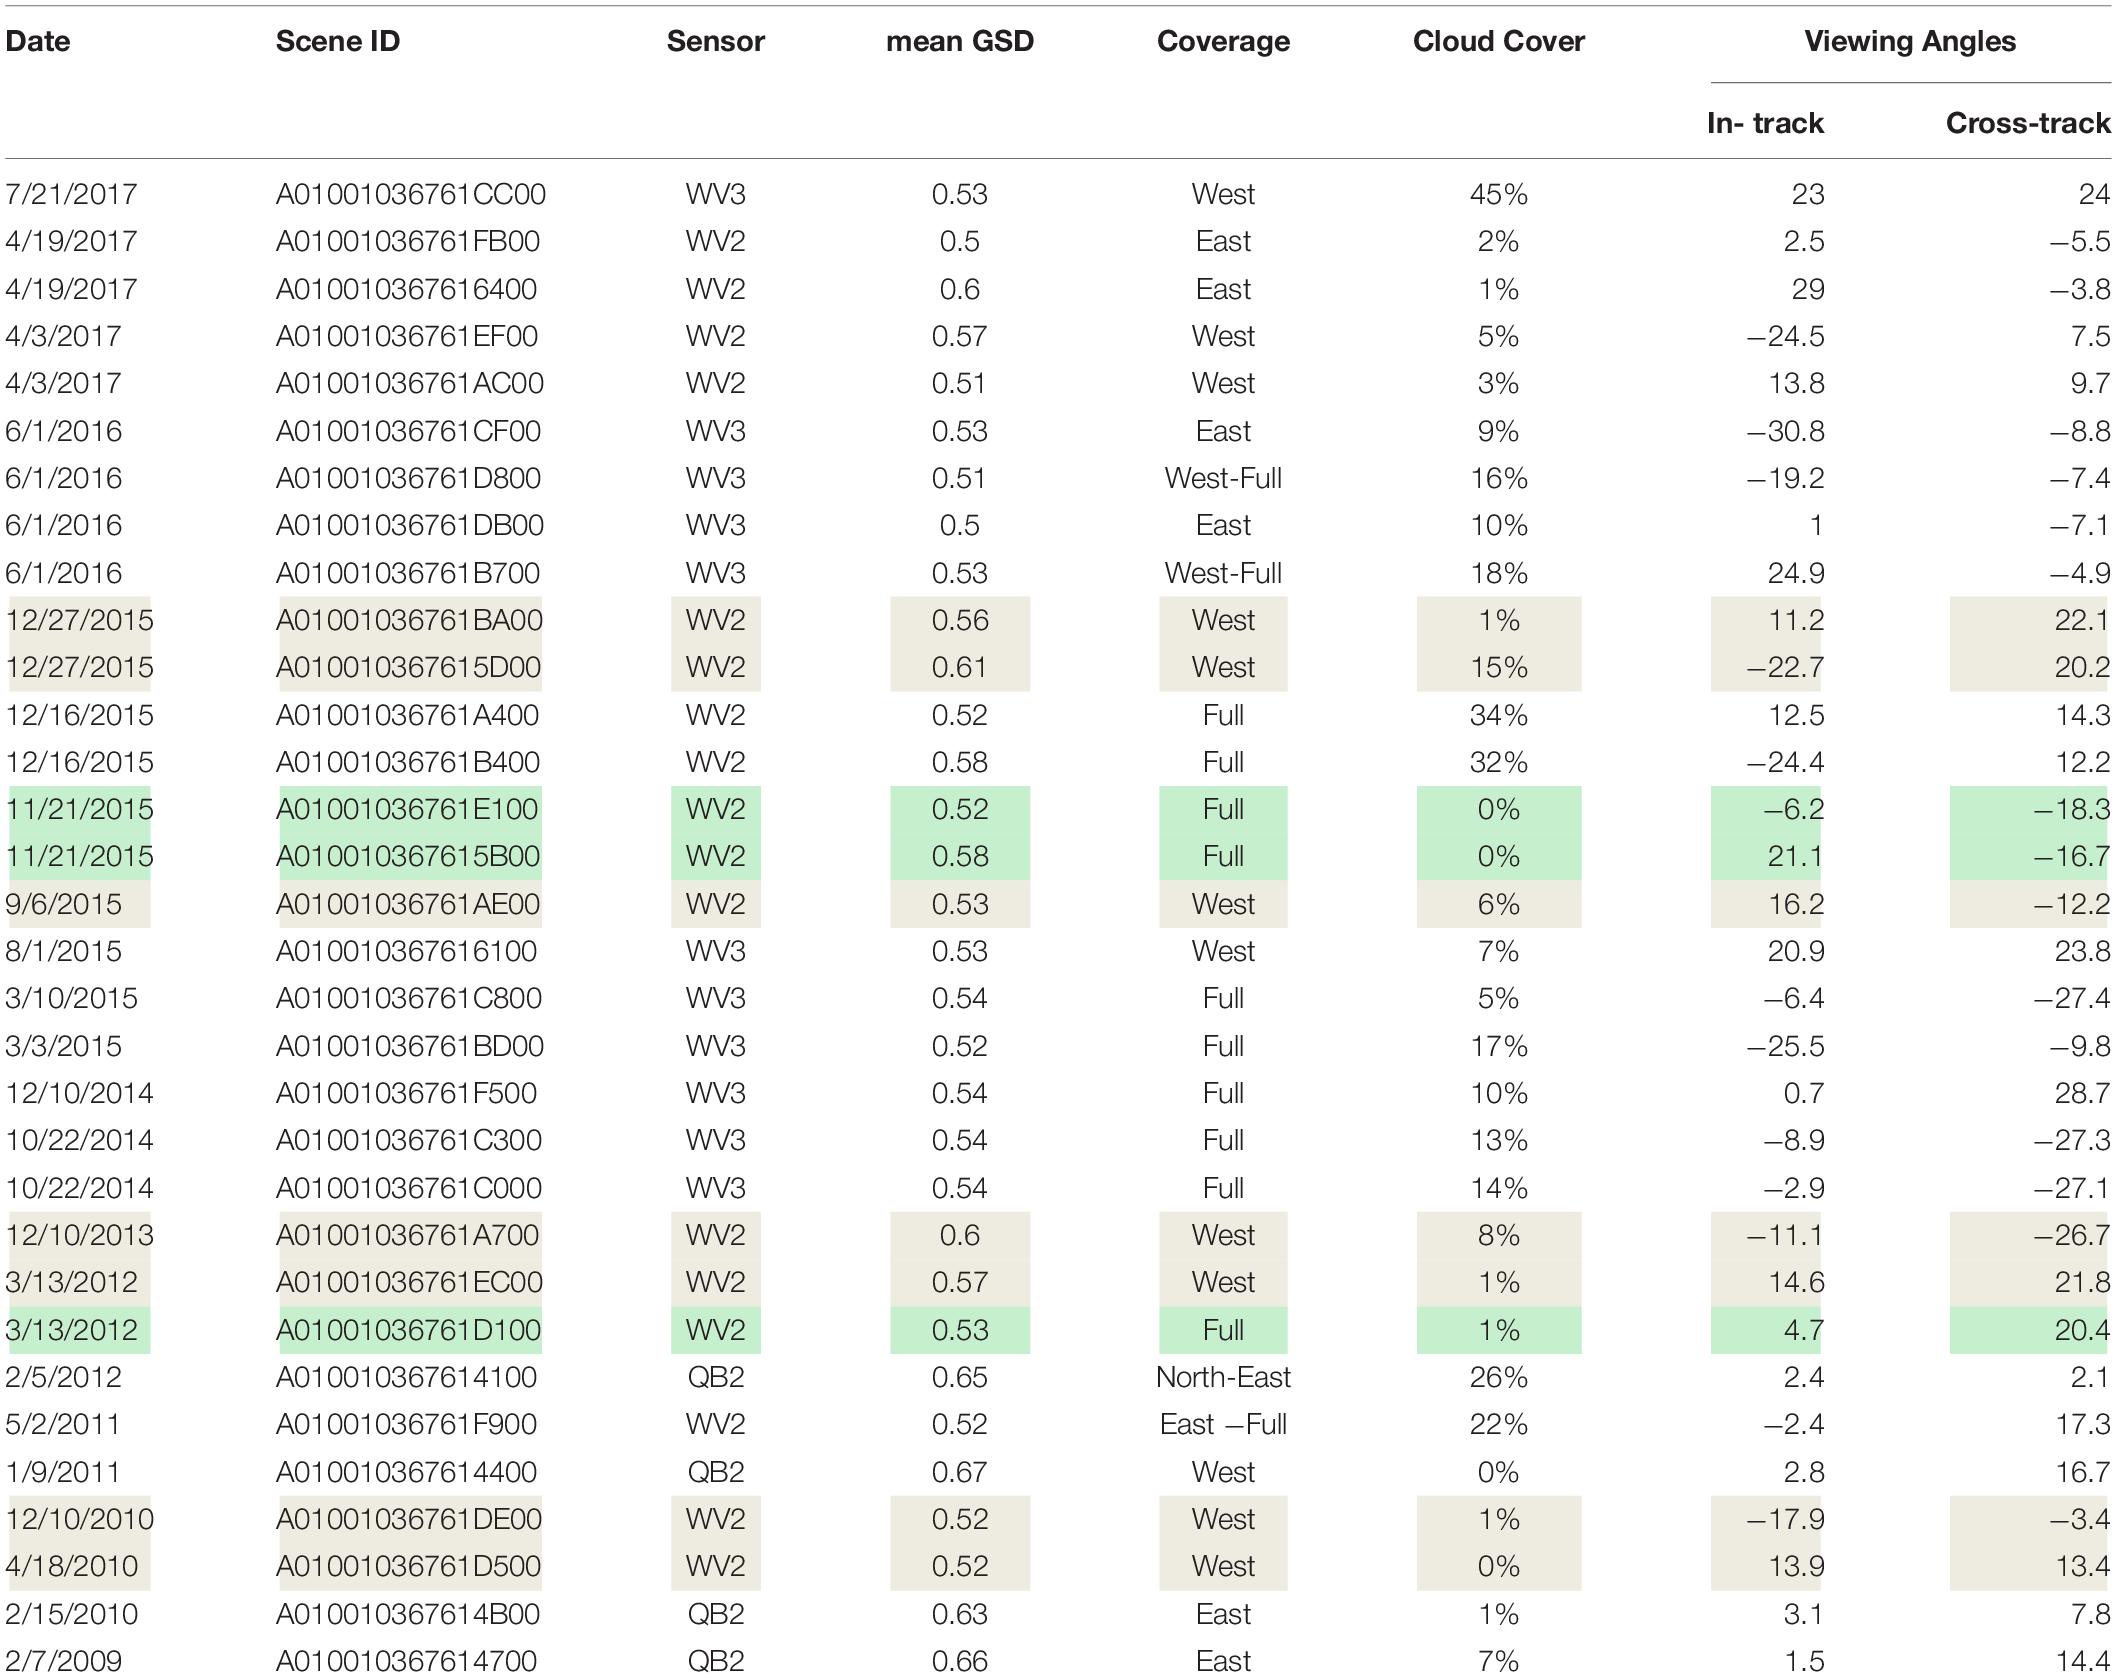
Table 2. DigitalGlobe basic image products, scenes of the prime image triplet are marked in green, scene of the MVS image stack marked in gray and green.
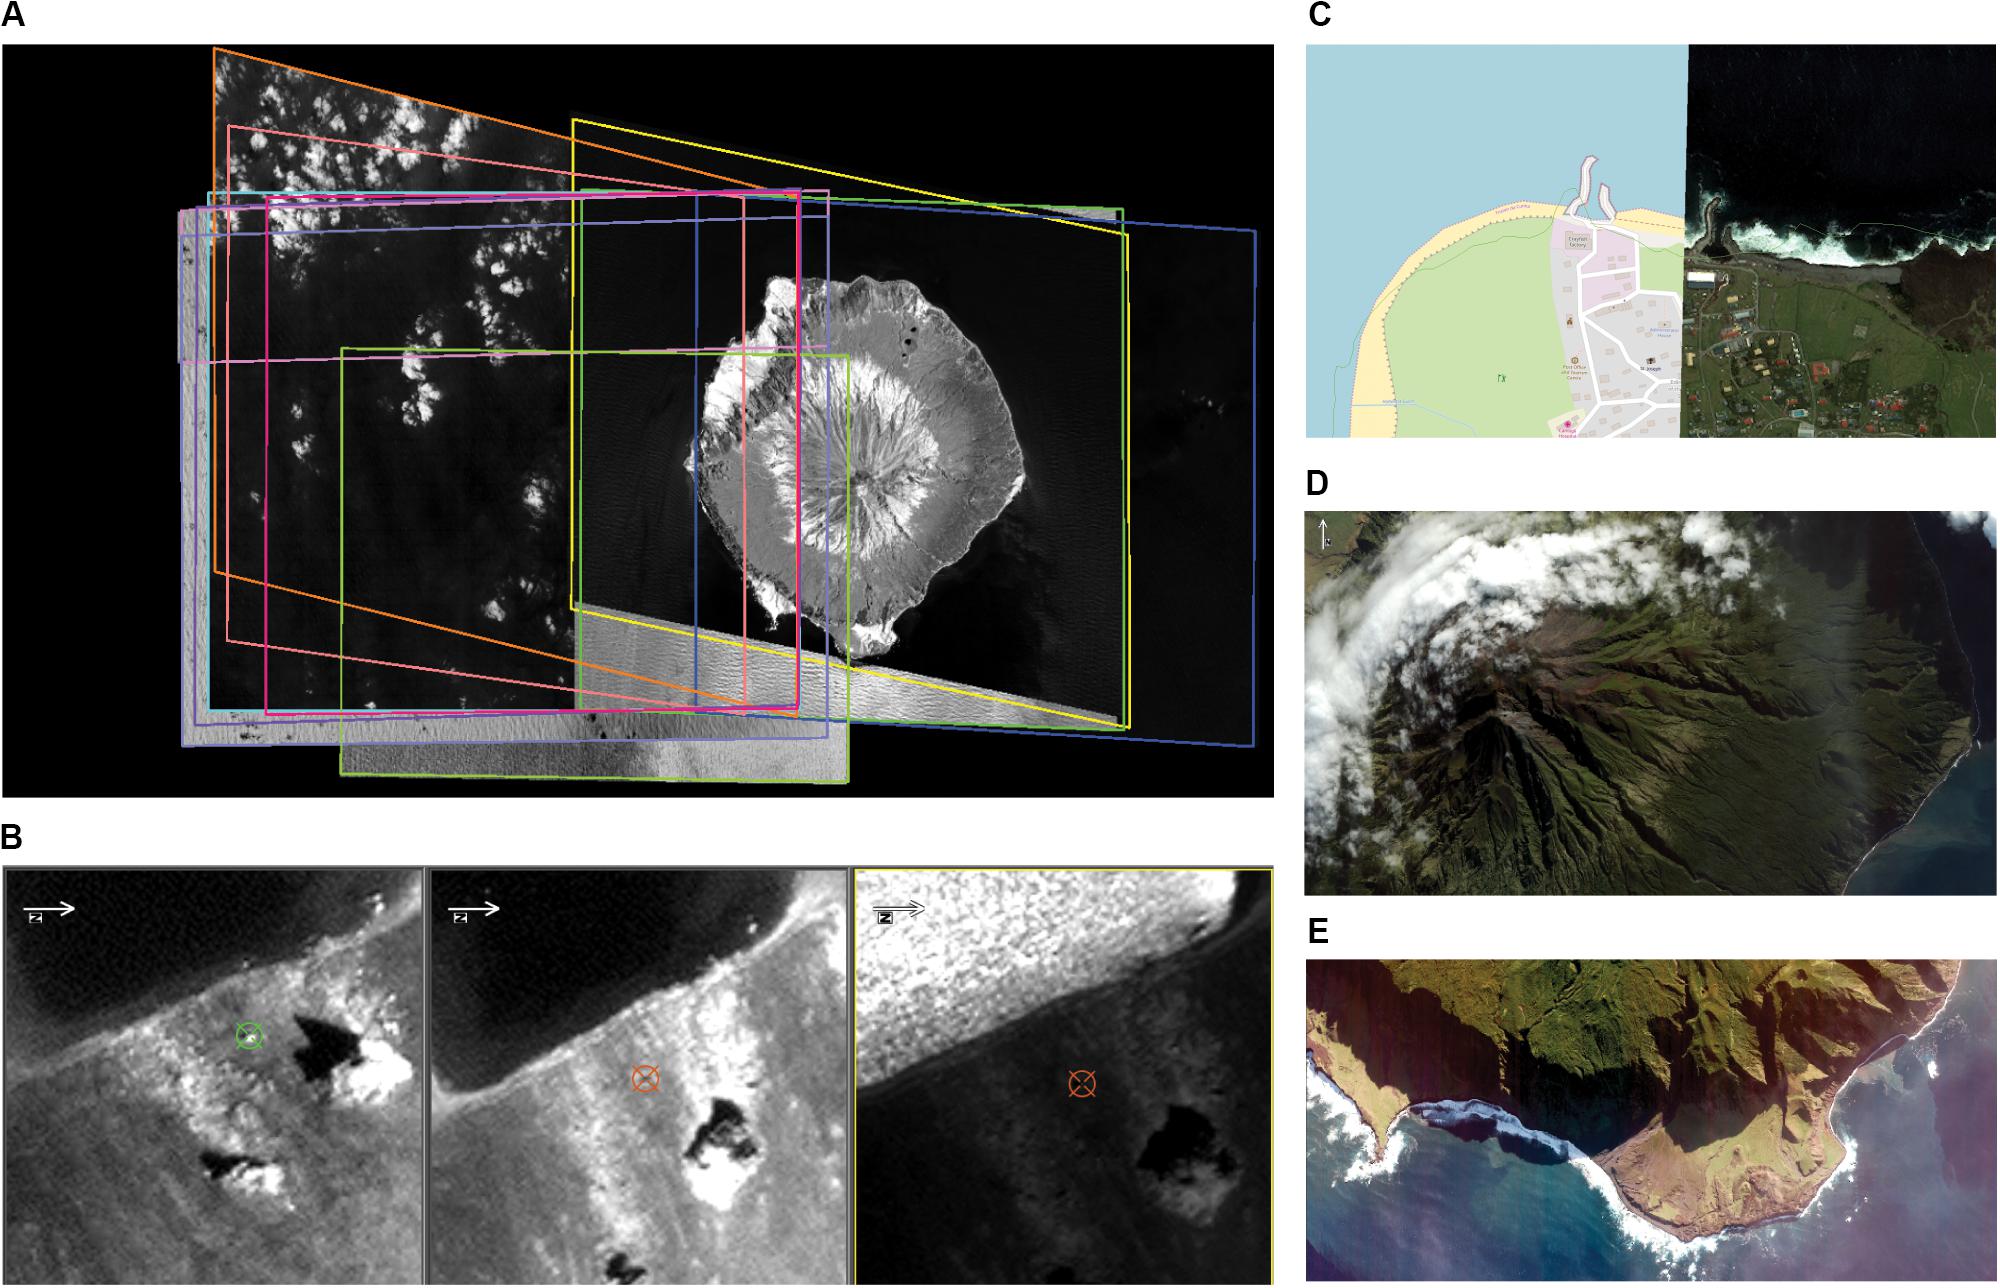
Figure 3. (A) WorldView 2 image stack. (B) Geometric resolution and feature definition. (C) Lack of co-registration between QB and OSM. (D) WorldView3 Scene showing clouds and haze. (E) WorldView3 scene showing shadow and haze.
Low-Altitude Aerial Images
An off-the-shelf DJI Phantom 3 Professional drone was used to acquire aerial photography around the harbor area and research installations. The mission aimed to collect drone imagery suitable to create detailed maps of a limited area covering the new GNSS and existing Doppler Orbitography Radiopositioning Integrated by Satellite (DORIS) stations, the new tide gauges in the harbor but also to collect panoramic photographs of the surrounding areas for documentation purposes.
Weather conditions permitted only 2 flight missions on October 8 and 18, 2017. Due to the harsh conditions with high wind speeds as well as the identified offsets in the base mapping data, both missions were executed as free flight missions in manual mode. A dense block of images was captured from a range of different flying heights covering the area of interest from different perspectives and viewing angles. Overall, 373 usable images were acquired which provide good overlapping coverage of the areas of interests as well as scenic panorama shots showing the region beyond the settlement of Edinburgh of the Seven Seas. Although not intended for 3D modeling, these images were subsequently added to the analysis. Figure 4 gives an overview of the acquired block of images. Ground control was provided by ten well-distributed targets (Figure 5) which were established by the geodetic survey.
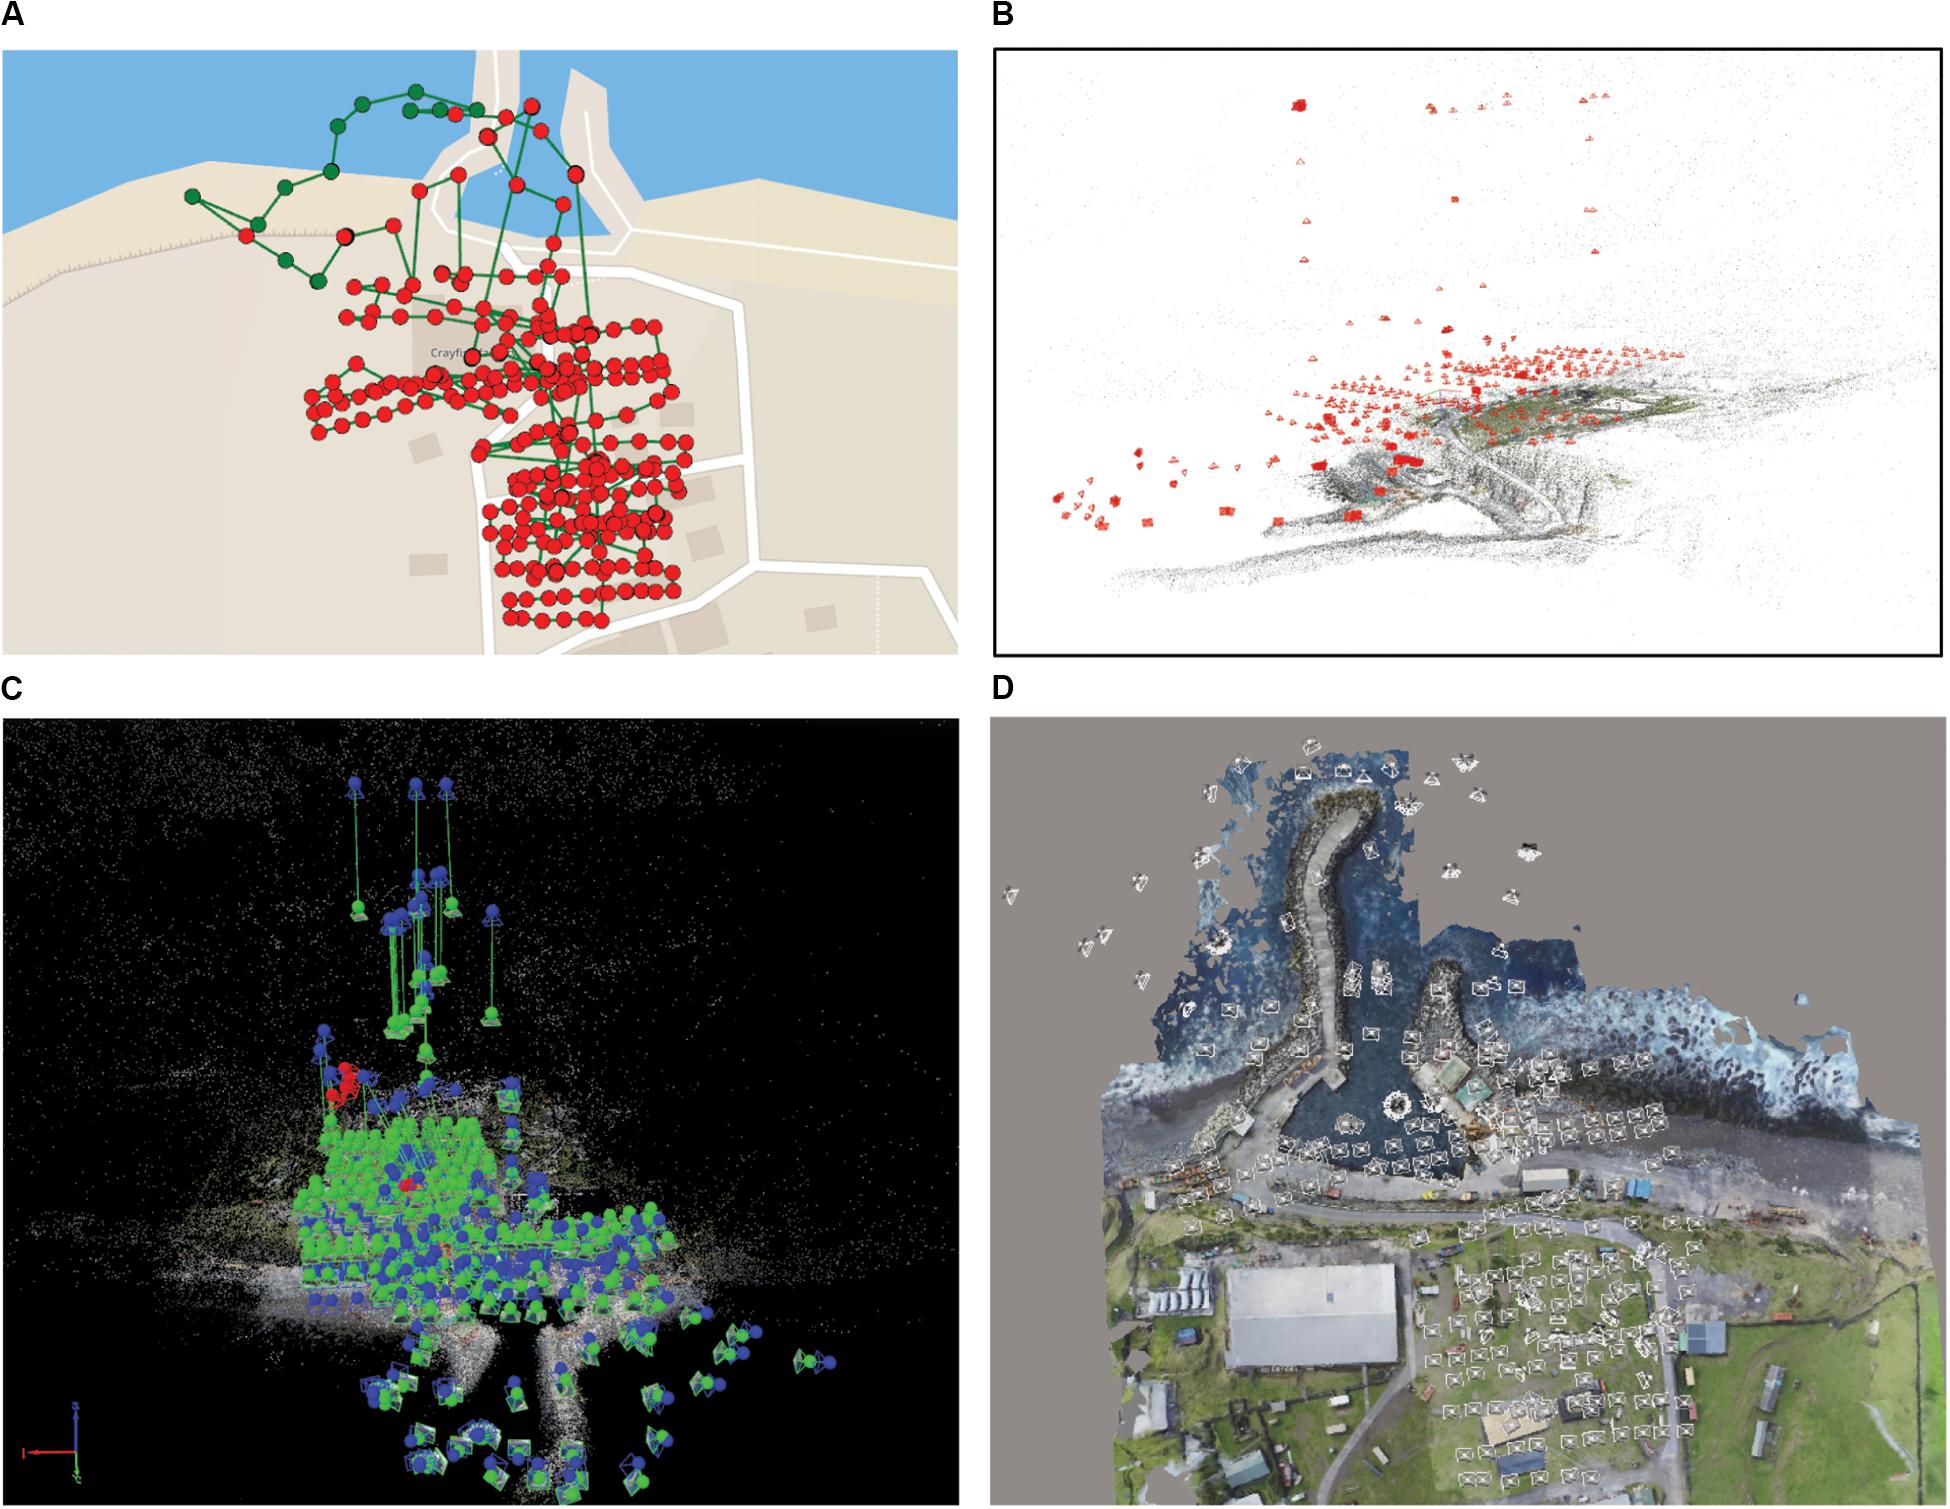
Figure 4. (A) Flight missions overlaid on OSM in 2D. (B) Perspective view shows different altitudes and image perspectives. (C) Image positions after bundle block adjustment. (D) Orthophoto with overlaid image positions.
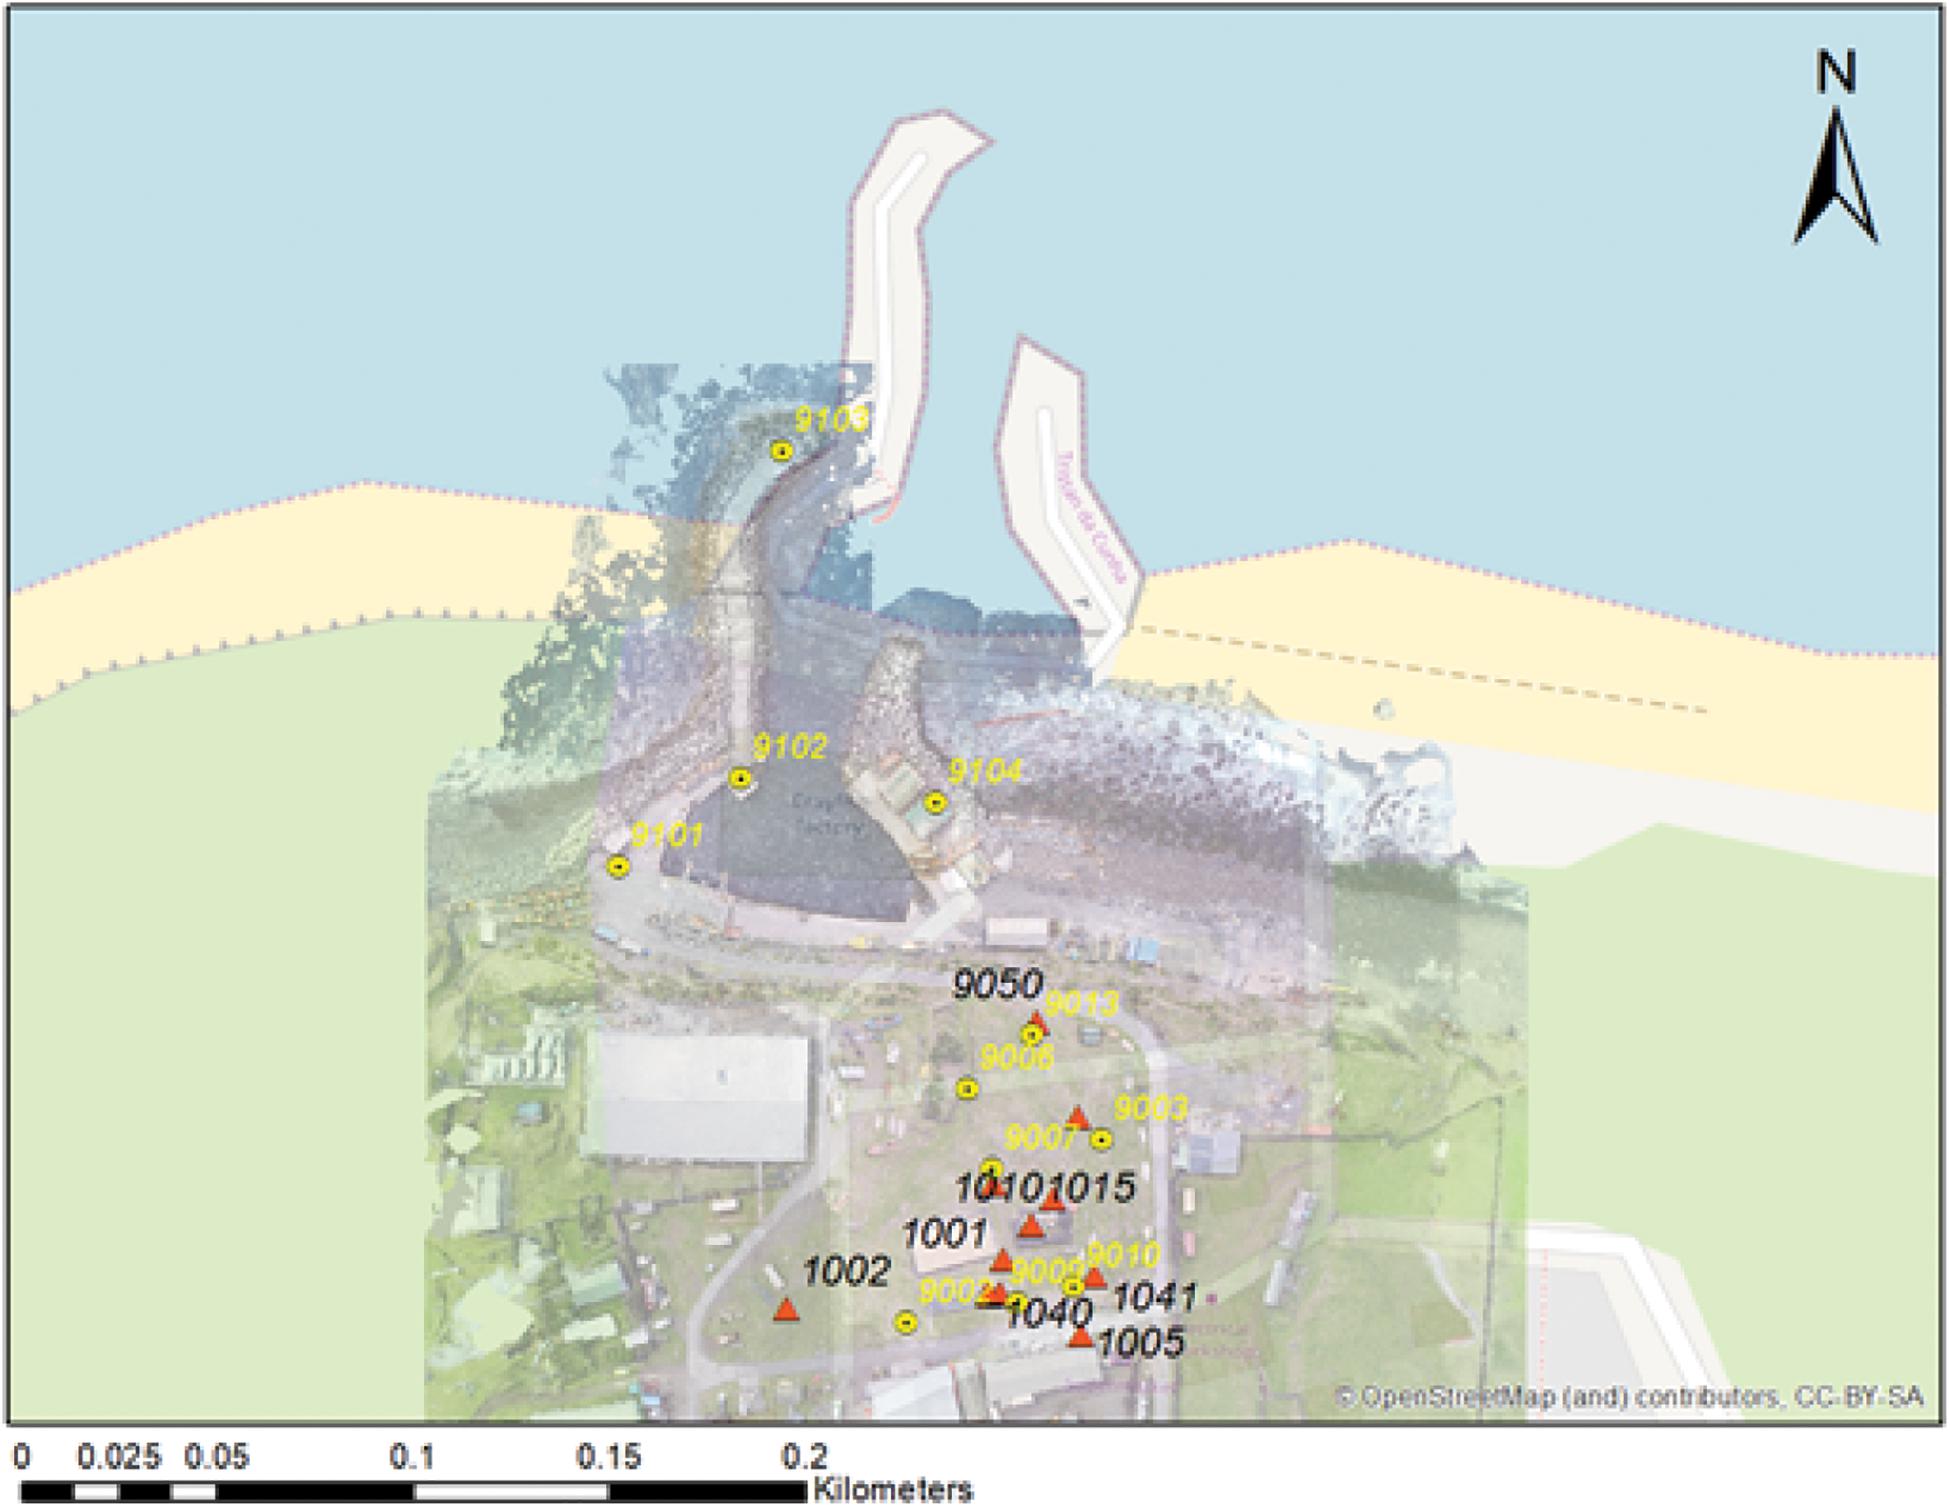
Figure 5. Geodetic control network (red triangles) with photogrammetric GCP (yellow circles) overlaid on OSM; the figure also shows the displacement of OSM compared to the GCN.
Geodetic Ground Control
A highly accurate ground control network (GCN) with sub-centimeter absolute positional accuracy, which was required for the sensor installations, was established around the area of the harbor and research installations. The geodetic survey, based on a combination of GNSS and total station observations, also provided Ground Control Points (G) to support the drone survey with sub-centimeter positional accuracy.
The continuous GNSS station TCTA (1035) and point 1003 were observed successively for 3 days. The coordinates were derived from the daily observation files using precise point positioning (PPP) and employing the Bernese GNSS Software V5.2 (Dach et al., 2015). The coordinates were then averaged over the 3 days. Subsequently Stations 1002, 1006 and 1005 were occupied for 2 h each, and their coordinates were obtained from static processing using Leica GeoOffice 8.0 in which the coordinates of TCTA were fixed to the values obtained from PPP. In all processings, precise IGS satellite orbit and clock products were used as well as individual absolute GNSS antenna calibrations.
A terrestrial survey was conducted using a high-precision total station (LeicaTS30) and a high-precision digital level (Leica DNA03). The primary aim of this survey was to establish the local GCN, which will enable the monitoring of the GNSS station TCTA, the tide gauges and the DORIS station. This highly precise GCN provided the basis to establish the control used for the aerial survey. Using the Leica TS30 total station, the coordinates of ten GCPs have been determined to an absolute accuracy of better than 1 cm in XYZ. Figure 5 depicts the location of the GCN as well as the GCPs.
Methodology
This study investigates the combination of archived VHR satellite and low-altitude drone imagery to generate high-resolution DEMs. The main perspective was to implement and verify rigorous photogrammetric workflows based on existing commercial off-the-shelf tools. Point clouds from both data sources are merged to provide a topographic representation of the entire study site while preserving the rich details captured by the drone survey over the central area of interest.
Throughout the study, all data sets were rigorously projected into Universal Transversal Mercator (UTM) Zone 28H (South) coordinates based on the World Geodetic System (WGS) 1984 datum. With the absence of local gravimetric data, the vertical datum was defined as WGS84 ellipsoidal heights.
Digital Terrain Extraction From Optical Satellite Imagery
Exploiting the VHR imagery, various DEMs, which cover the entire island, were extracted following photogrammetric methodologies with the intent to maximize spatial resolution, completeness and accuracy. In the scope of this study, we tested the performance of three geospatial software packages. Since the implementations of the photogrammetric workflows inside these packages differ in detail, all required processing steps are described and mapped to a general workflow shown in Figure 6.
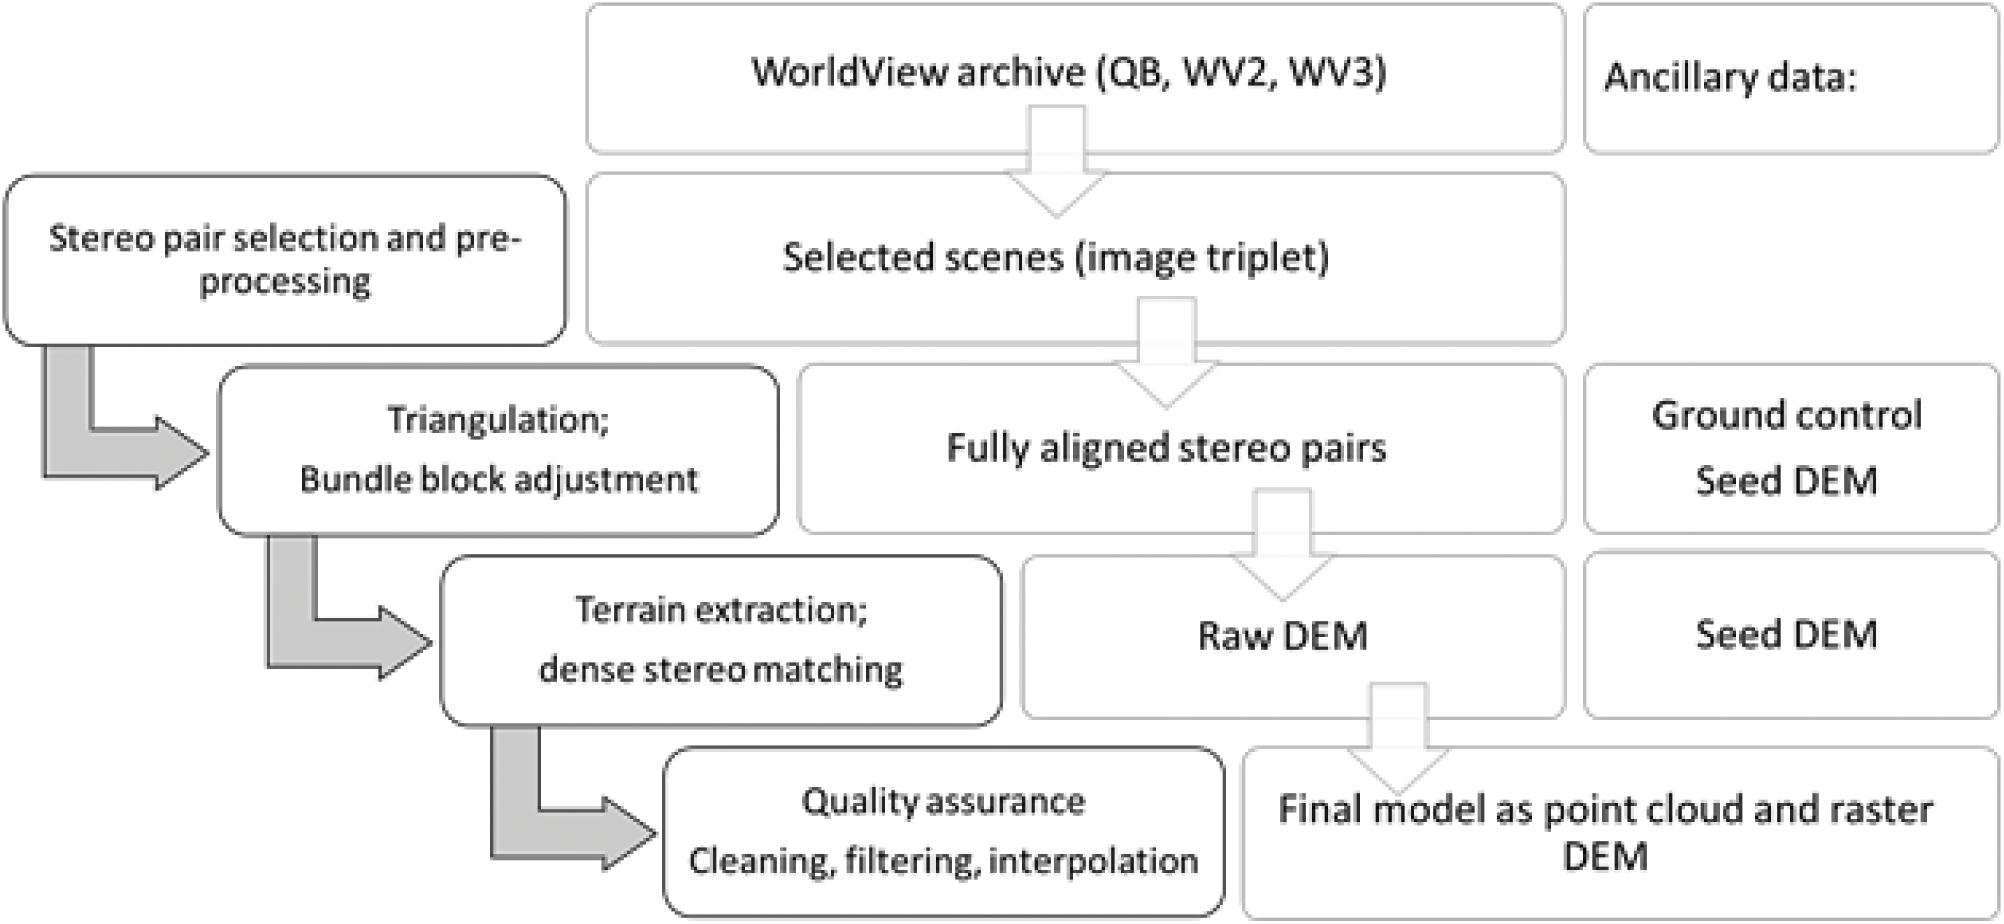
Figure 6. Generalized spaceborne photogrammetric workflow.
The initial data preparation includes the selection and preprocessing of the satellite scene. This is followed by a spaceborne triangulation using tie points as well as ground control. The results of the triangulation provide accurately georeferenced and well-oriented satellite scenes. The exact alignment between the scenes is crucial for the following terrain extraction steps. All software packages provide several image matching algorithms to generate DSMs as rasterized models, irregular triangular networks (TIN) or point clouds. A final verification and filtering process is required as the results of the matching process always contains artifacts and noise.
Most terrain extraction algorithms support the use of seed DEMs to improve computational efficiency and reduce the number of blunders. Usually, freely available low or medium resolution DEMs (e.g., DTED level 0) are used for this purpose. As higher quality seed DEMs increase performance, the mDEM (2.1) was used as initial seed DEM whenever possible. The general terrain extraction workflow followed a stepwise procedure. Using the mDEM with 30 m GSD as seed, a DEM with 10 m GSD was matched. In the next iteration this DEM was injected as a seed to extract a DEM with higher spatial resolution. Following this gradual approach, DEMs with 10, 5, 2 and 1 m GSD were extracted.
Image Verification and Preprocessing
The DigitalGlobe VHR image repository provided a rich data source to derive a high-resolution DEM of the island. However, temporal decorrelation (e.g., changes in landcover between image acquisitions), atmospheric effects that influence image quality (e.g., haze), cloud coverage, shadows, unfavorable viewing angles, differences in spatial resolution as well as partial coverage, are presenting challenges for the terrain extraction process. Thus, the choice of well-suited scenes and the adequate preprocessing have a direct impact on the quality of the derived DEMs.
The initial data verification step aimed to select the most suitable satellite scenes from the stack of 64 basic image products. A triplet of satellite scenes was identified which showed excellent image quality, covered the entire island almost cloud-free and provided good geometric conditions for DEM extraction. Using a MVS configuration based on a large stack of overlapping images is expected to increase the reliability of the extracted DEMs, but is more computationally expensive and relies on good and homogenous image quality. Additional 10 images were chosen over the area of the settlement, to investigate the difference in performance and quality between the image triplet and a MVS images stack.
The selection of satellite scenes from the repository followed the subsequent criteria in the given order:
1. Data currency and temporal decorrelation: Start with the most current data and the most advanced sensors. The time between the image acquisitions should be as short as possible but at least at similar times of the year.
2. Image quality: Scenes should cover the whole region of interest, show minimal or no cloud coverage and atmospheric distortion such as haze.
3. Viewing Geometry: Narrow viewing angles between images will degrade the height accuracy of the DEM, whereas wide viewing angles provide significant image distortions which typically cause problems for image correlation techniques. Hasegawa et al. (2000) concluded that a base to height ratio (B/H) of 0.5 to 0.9 provides optimal results for stereo matching.
Since the selected satellite scenes showed excellent image quality, extensive preprocessing which includes atmospheric correction, cloud masking as well as pan-sharpening was not required. In this study, only the panchromatic channel was used for DEM extraction.
BAE Systems – SocetGXP
SocetGXP includes a powerful photogrammetric toolset, which follows rigorous procedures and allows a high degree of flexibility and control. The software package emerged from SocetSET, which was initially developed by Helava as one of the first digital photogrammetric workstations. Today, the comprehensive software suite is mainly used by the geospatial intelligence community.
Since DigitalGlobe formats and sensor models are supported in SocetGXP the import of large scenes via the TIL file format was straightforward and contained the sensor orientation via rational polynomial coefficients (RPC). The subsequent triangulation was performed using manual well distributed and automatically measured tie-points. Since the GCN only covers a small area around the harbor area, only one GCP was derived as a single point of reference which only allows to detect and correct for a shift in position. The results of the bundle block adjustment were used to update the RPC information of the satellite scene.
SocetGXP includes 3 algorithms for DEM extraction optimized for various types of data and terrain. This study utilized the classical auto terrain extraction (ATE) module based on normalized cross-correlation (NCC) as well as the so-called next generation terrain extraction (NGATE) module, which provides an advanced algorithm that “combines area-matching and edge-matching, using each approach to guide the other and thus reduces blunders” (Walker, 2007). The theory and algorithms of NGATE have been described by Zhang (2006) and Zhang et al. (2006). In both methods the merged mDEM was utilized as a seed model.
Hexagon Geospatial–Erdas Imagine
The widely used Erdas Imagine package is a comprehensive geospatial software suite, which integrates GIS, remote sensing and photogrammetric functionalities. Similar to SocetGXP, DigitalGlobe’s sensor models and data formats are well supported.
The satellite scenes were triangulated as an image block. Since automatic tie point detection did not provide usable results, only well-distributed manually measured tie points where used in the triangulation. Similar to the analysis in SocetGXP, one GCP derived from the GCN provided control in 3 translations (X, Y, Z). Since the quality of the image alignment impacts the performance of stereo matching algorithms, the results of the triangulation were used to modify and improve the satellite orientation parameters (RPCs).
Hexagon Geospatial offers a range of terrain extraction modules optimized for different sensors or applications. This study examined the performance of the automatic terrain extraction module (ATE), the enhanced terrain extraction (eATE) and the SGM implementation by Tridicon. While the ATE module is based on an undisclosed feature-based image-matching algorithm, eATE provides a range of options to optimize matching and processing performance, reduce blunder, filter noise and classify the results. Here we used the NCC matching algorithm in combination with standard blunder detection based principal component analysis (PCA) and reverse matching. Filtering and classification were not applied and the results were provided as raster DEM and point cloud. The SGM module was initialized based on the results of the triangulation. Single stereo-pairs are matched to partial point clouds, which are merged subsequently to a combined point cloud.
PCI Geomatics – Geomatica OrthoEngine
PCI Geomatics provides a very efficient remote sensing software tool kit, which offers flexibility through an extensive library of algorithms accessible via a Python API. Using the Geomatica OrthoEngine module, digital elevation models from single stereo-pair were derived via different image matching algorithms, including NCC and SGM. Only one stereo-pair was selected, which was acquired on the same orbit and showed an almost perfect alignment. Epipolar images were generated as input for stereo matching using the NCC algorithm to produce a high-quality DEM.
Drone Photogrammetry
Generating 3D point clouds from image blocks using highly integrated SfM engines, is a mostly automatic process with few options for user inputs and control. In the scope of this study, we report on the results created with the drone photogrammetry packages Pix4D Mapper (4.2.25). Pix4D provides detailed data quality reports, which contain the results of the aerial triangulation, camera calibration, quality estimations of the 3D positioning as well as metadata of the derived 3D products.
To investigate the performance of the low-precession GNSS/INS sensors onboard the drone, an aerial triangulation was computed without any ground control points. Only the positions measured by the onboard GNSS receiver where used. In a first step only images of the “free flight image block” were included in the triangulation. To strengthen the geometry of the aerial image block further and to provide better coverage of occluded areas, the number of images was increased by adding the scenic images originally intended for documentation purposes in a second step. The final aerial triangulation included all 373 usable images. Subsequently the GCPs derived from the geodetic survey where introduced stepwise as checkpoints (CP) and ground control points.
Investigations on the stability of camera systems deployed on small drone systems by Cramer et al. (2017) and Gerke and Przybilla (2016) found that such lightweight cameras are often geometrically unstable and require frequent recalibration. Thus all triangulations included a self-calibration for the interior orientation of the drone camera.
Data Quality Control and Multiscale Data Integration
The accuracy and quality of the image orientation are given by the results of spaceborne or aerial triangulation. This includes the alignment of the images relative to each other as well as the positional accuracy. These parameters are also indicators for the relative and absolute accuracy of the derived DEM. As already mentioned ground truth was only available around the harbor area via the geodetic surveyed GCN which showed sub-centimeter absolute positional accuracy. For the drone survey nine well distributed photogrammetric targets provided adequate ground control. However, due to the small extent of the GCN in comparison to the overall island, the GCN could only provide a single point of reference for the spaceborne image block. One GCP and one additional CP of similar definition and positional accuracy were derived from the GCN to estimate and improve the positional accuracy of the directly georeferenced satellite scenes.
The generated DEMs were inspected for blunders, noise, completeness and, subsequently, cleaned and filtered. This was followed by cross-validation between derived spaceborne DEMs and the dense point clouds derived from the drone survey. Due to a lack of suitable reference data a thorough assessment as described by Höhle and Höhle (2009) or Höhle and Potuckova (2011) of the DEMs could not be conducted for this case study but would be highly desirable.
Finally, both models from spaceborne VHR photogrammetry (Figure 7A) as well as drone photogrammetry (Figure 7B) were merged based on the exact georeference provided by the GCN. The point clouds provided a flexible data format to merge such heterogeneous models, which differ in extent and scale. Two dense point cloud models derived by SGM at approximately 1 m and 0.5 m spacing were chosen as good representations for the entire island and merged with the rich point cloud from the drone photogrammetry. The latter covered the local area as well as the extended areas near the settlement (Figure 7B) for comparison. The final point cloud preserves fine local detail and provides a good overall representation of the area.
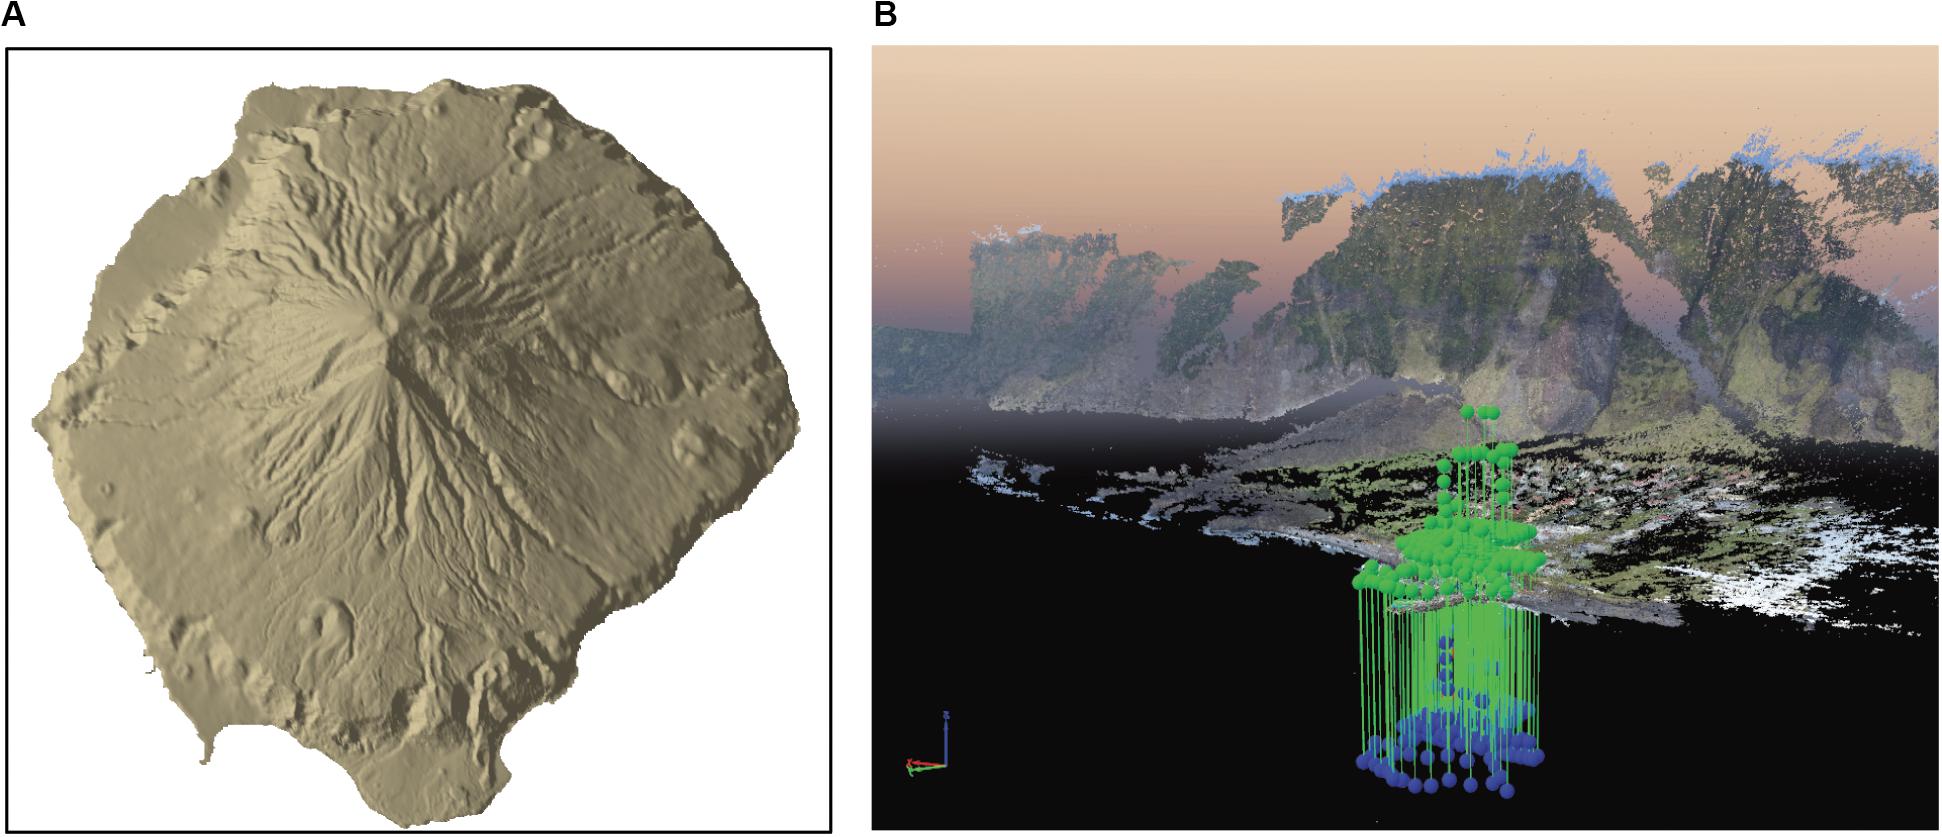
Figure 7. (A) Spaceborne DEM based on WV2 imagery with 2 m resolution generated in SocetGXP. (B) Point cloud from drone photogrammetry using Pix4D with a priori camera positions (blue spheres) and after bundle block adjustment using geodetic GCPs (green spheres).
Results and Analysis
This section reports on the achieved results of terrain extraction from satellite imagery and the drone photogrammetry. It provides a cross-validation and shows the fused model as a combined point cloud from spaceborne and low-altitude drone photogrammetry.
High-Resolution DEMs From Spaceborne Images
Following the described photogrammetric workflows high-resolution DEMs were extracted from VHR imagery using the three popular software packages. All results show a high level of completeness and a low noise level after blunder removal. The absolute positioning accuracy was verified using control points derived from the GCN.
VHR Image Verification, Selection and Preprocessing
Through the initial selection process, three satellite scenes (image triplet) were identified from the stack of archive data which provided excellent image quality, suitable viewing angles for stereo matching, low temporal decorrelation and full coverage of the area of interest. The selected scenes also showed a good pre-alignment from direct georeference. An image pair captured in November 2015 during the same orbit provided a cloud free view of the entire island. The B/H ratio was calculated to be approximately 0.6 which indicates ideal conditions for stereo matching. The third image was captured in March 2012 from a parallel orbit with a different viewing angle.
Spaceborne Triangulation
The Image triangulation was performed in SocetGXP and Erdas Imagine. Since the selected image triplet showed good pre-alignment via direct georeference an initial triangulation was performed using only tie points. To avoid unintended error extrapolation and wrapping effects to the final model, only one GCP and one CP from the GCN were included in the triangulation.
Triangulation in SocetGXP
Two separate triangulations were performed. The first triangulation included the image triplet over the full extent of the island. Overall 24 well-distributed tie points, as well as the GCP and CP, were chosen and measured in a semi-automatic mode. The result of the triangulation shows RMSE of 0.48 pixels for the image residuals and a shift of 0.17 m in X, 0.05 m in Y and 0.04 m in Z. Considering a GSD of approx. 0.5 m, which limits the precision to measure ground control points in images, this result shows agreement between satellite direct orientation data and the geodetic control points. The second triangulation was based on the stack of 10 WV2 images, which focused on the local area of Edinburgh of the Seven Seas. This time 60 tie points and the same control points as in the first triangulation were measured in order to provide sufficient tie points in the image stack. The result showed a similar RMSE of 0.63 pixels for the image residuals but a higher shift of 1.02 m in X, 1.56 m in Y and 0.31 m in Z.
Triangulation in Erdas imagine
For the triangulation in Erdas Imagine, 13 manually selected and well-distributed tie points were measured. The tie points were located in similar regions and the GCP was identical as for the triangulation in SocetGXP. The triangulation shows a RMSE of 0.08 pixels for the image residuals and a shift of 0.04 m in X, 0.08 m in Y and 0.12 m in Z. Therefore, the results are similar to those from SocetGXP. The CP provides a validation of the triangulation results, and showed a shift of 0.41 m in X, 0.48 m in Y and 1.18 m in Z.
Terrain Extraction
Table 3 provides an overview of the employed methods and resolution with a brief remark on the achieved results. All tested software suites include various terrain extraction algorithms. Choosing the appropriate methodology and optimizing input parameters remains a challenge and often relies on extensive user experience. Many of the terrain extraction modules do provide automatic blunder detection and noise reduction strategies, e.g., reverse matching, which show various degrees of performance and also add processing time.
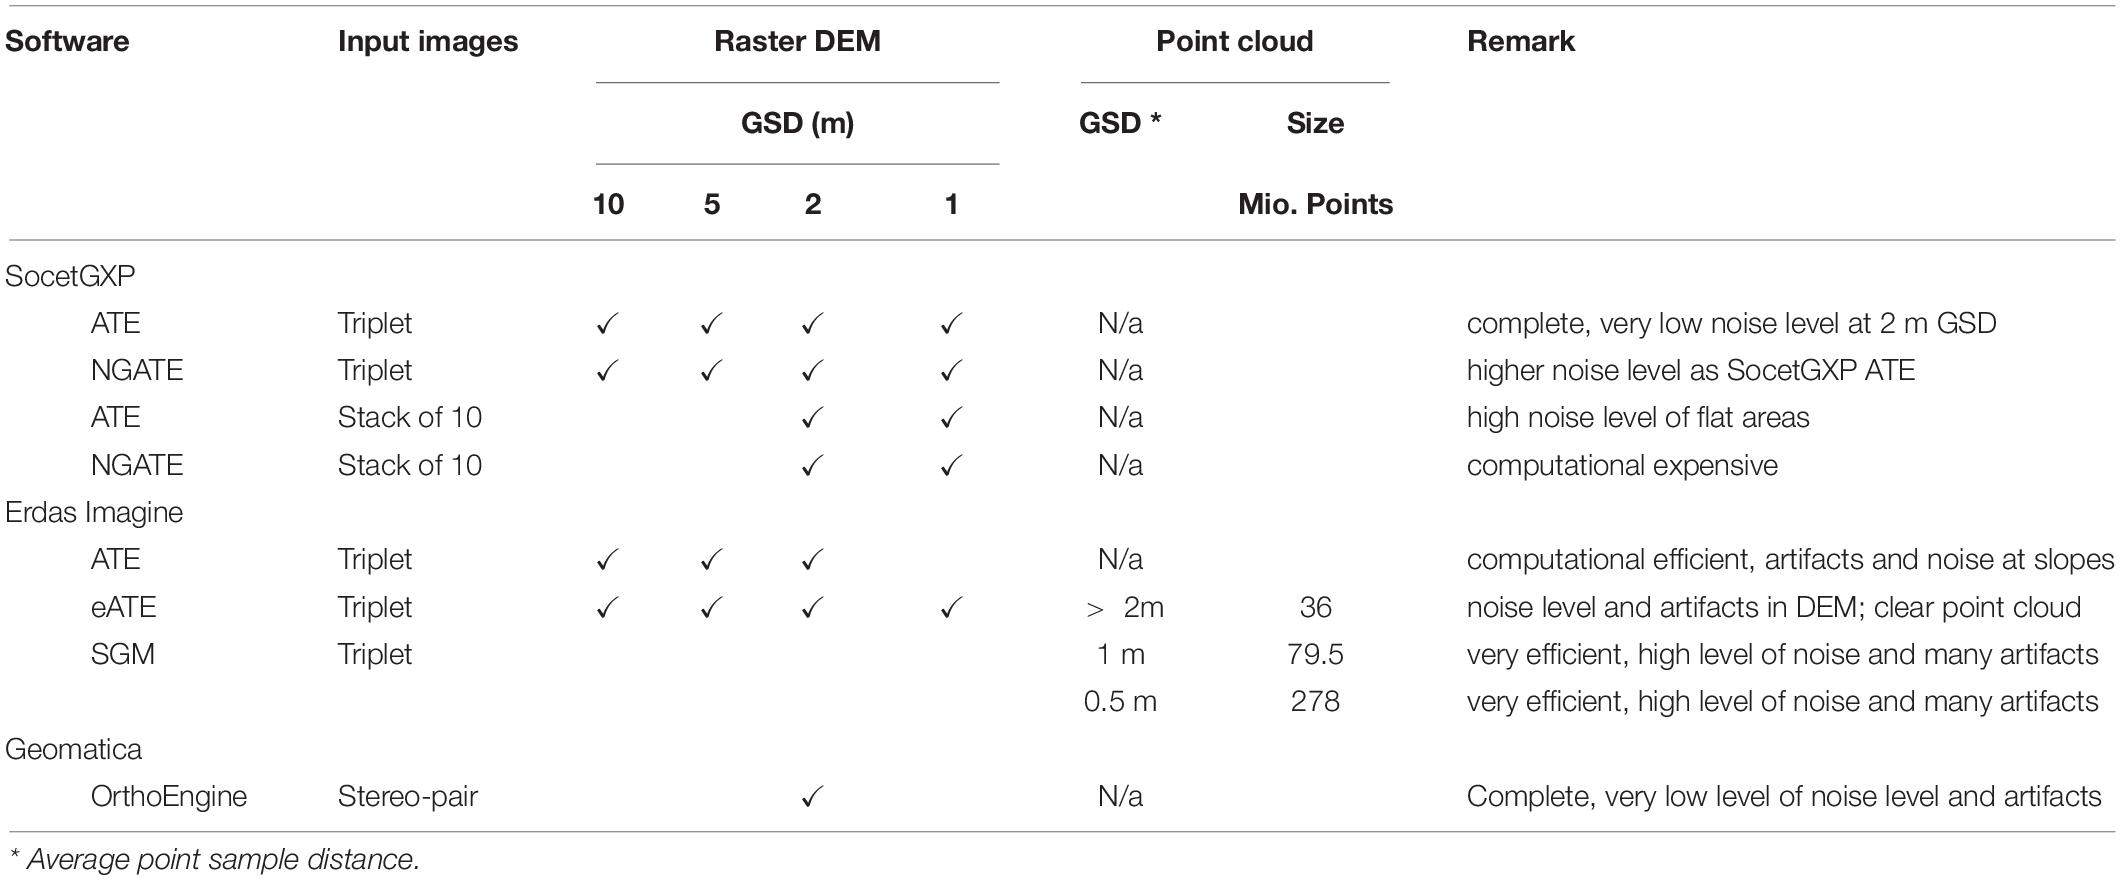
Table 3. Overview of Terrain matching experiments.
SocetGXP
The terrain extraction module in SocetGXP enables flexible customization of algorithms that can be adapted to suit different data and terrain types. The presented experiments are based on standard strategies for the ATE and NGATE algorithms. Several different methods were tested whereby ATE adaptive strategy and NGATE low-contrast strategy performed best for the employed satellite imagery.
Two series of experiments were performed based on the image triplet and the stack of images over the area of Edinburgh of the Seven Seas. Series 1 covered the full island and produced DEMs with up to 1 m GSD using the ATE and NGATE strategy. ATE provided the best performance for a DEM with 2 m GSD (Figure 8A), which shows a good level of detail and contains less noise than the DEM generated by NGATE. A higher sampling rate at 1 m GSD based on NGATE showed an increased level of noise and artifacts but no improvements in the level of detail. Series 2 only covers the northwest area of the island around the settlement. ATE and NGATE were used to generate a DEM with 2 m and 1 m GSD based on the stack with 10 satellite scenes. No improvement could be observed. However, the computational effort rose sharply and the results showed higher levels of noise and artifacts compared to the models derived from the image triplet. For urban areas, NGATE showed better performance than ATE. The DSMs depicted in Figure 9 have been generated using the ATE module with GSDs of 10, 5, 2 and 1 m with no filtering or corrections applied. In the 10 m resolution DSM, many artifacts can be identified at steep slopes (Figure 9B). The DSM with 2 m resolution (Figure 9D) provides a good trade-off showing low noise level and a high level of detail. In contrast, models with 1 m GSD derived from the MVS configuration with 10 satellite images do not show improvements but appear to include more noise and artifacts (Figures 9E,F).
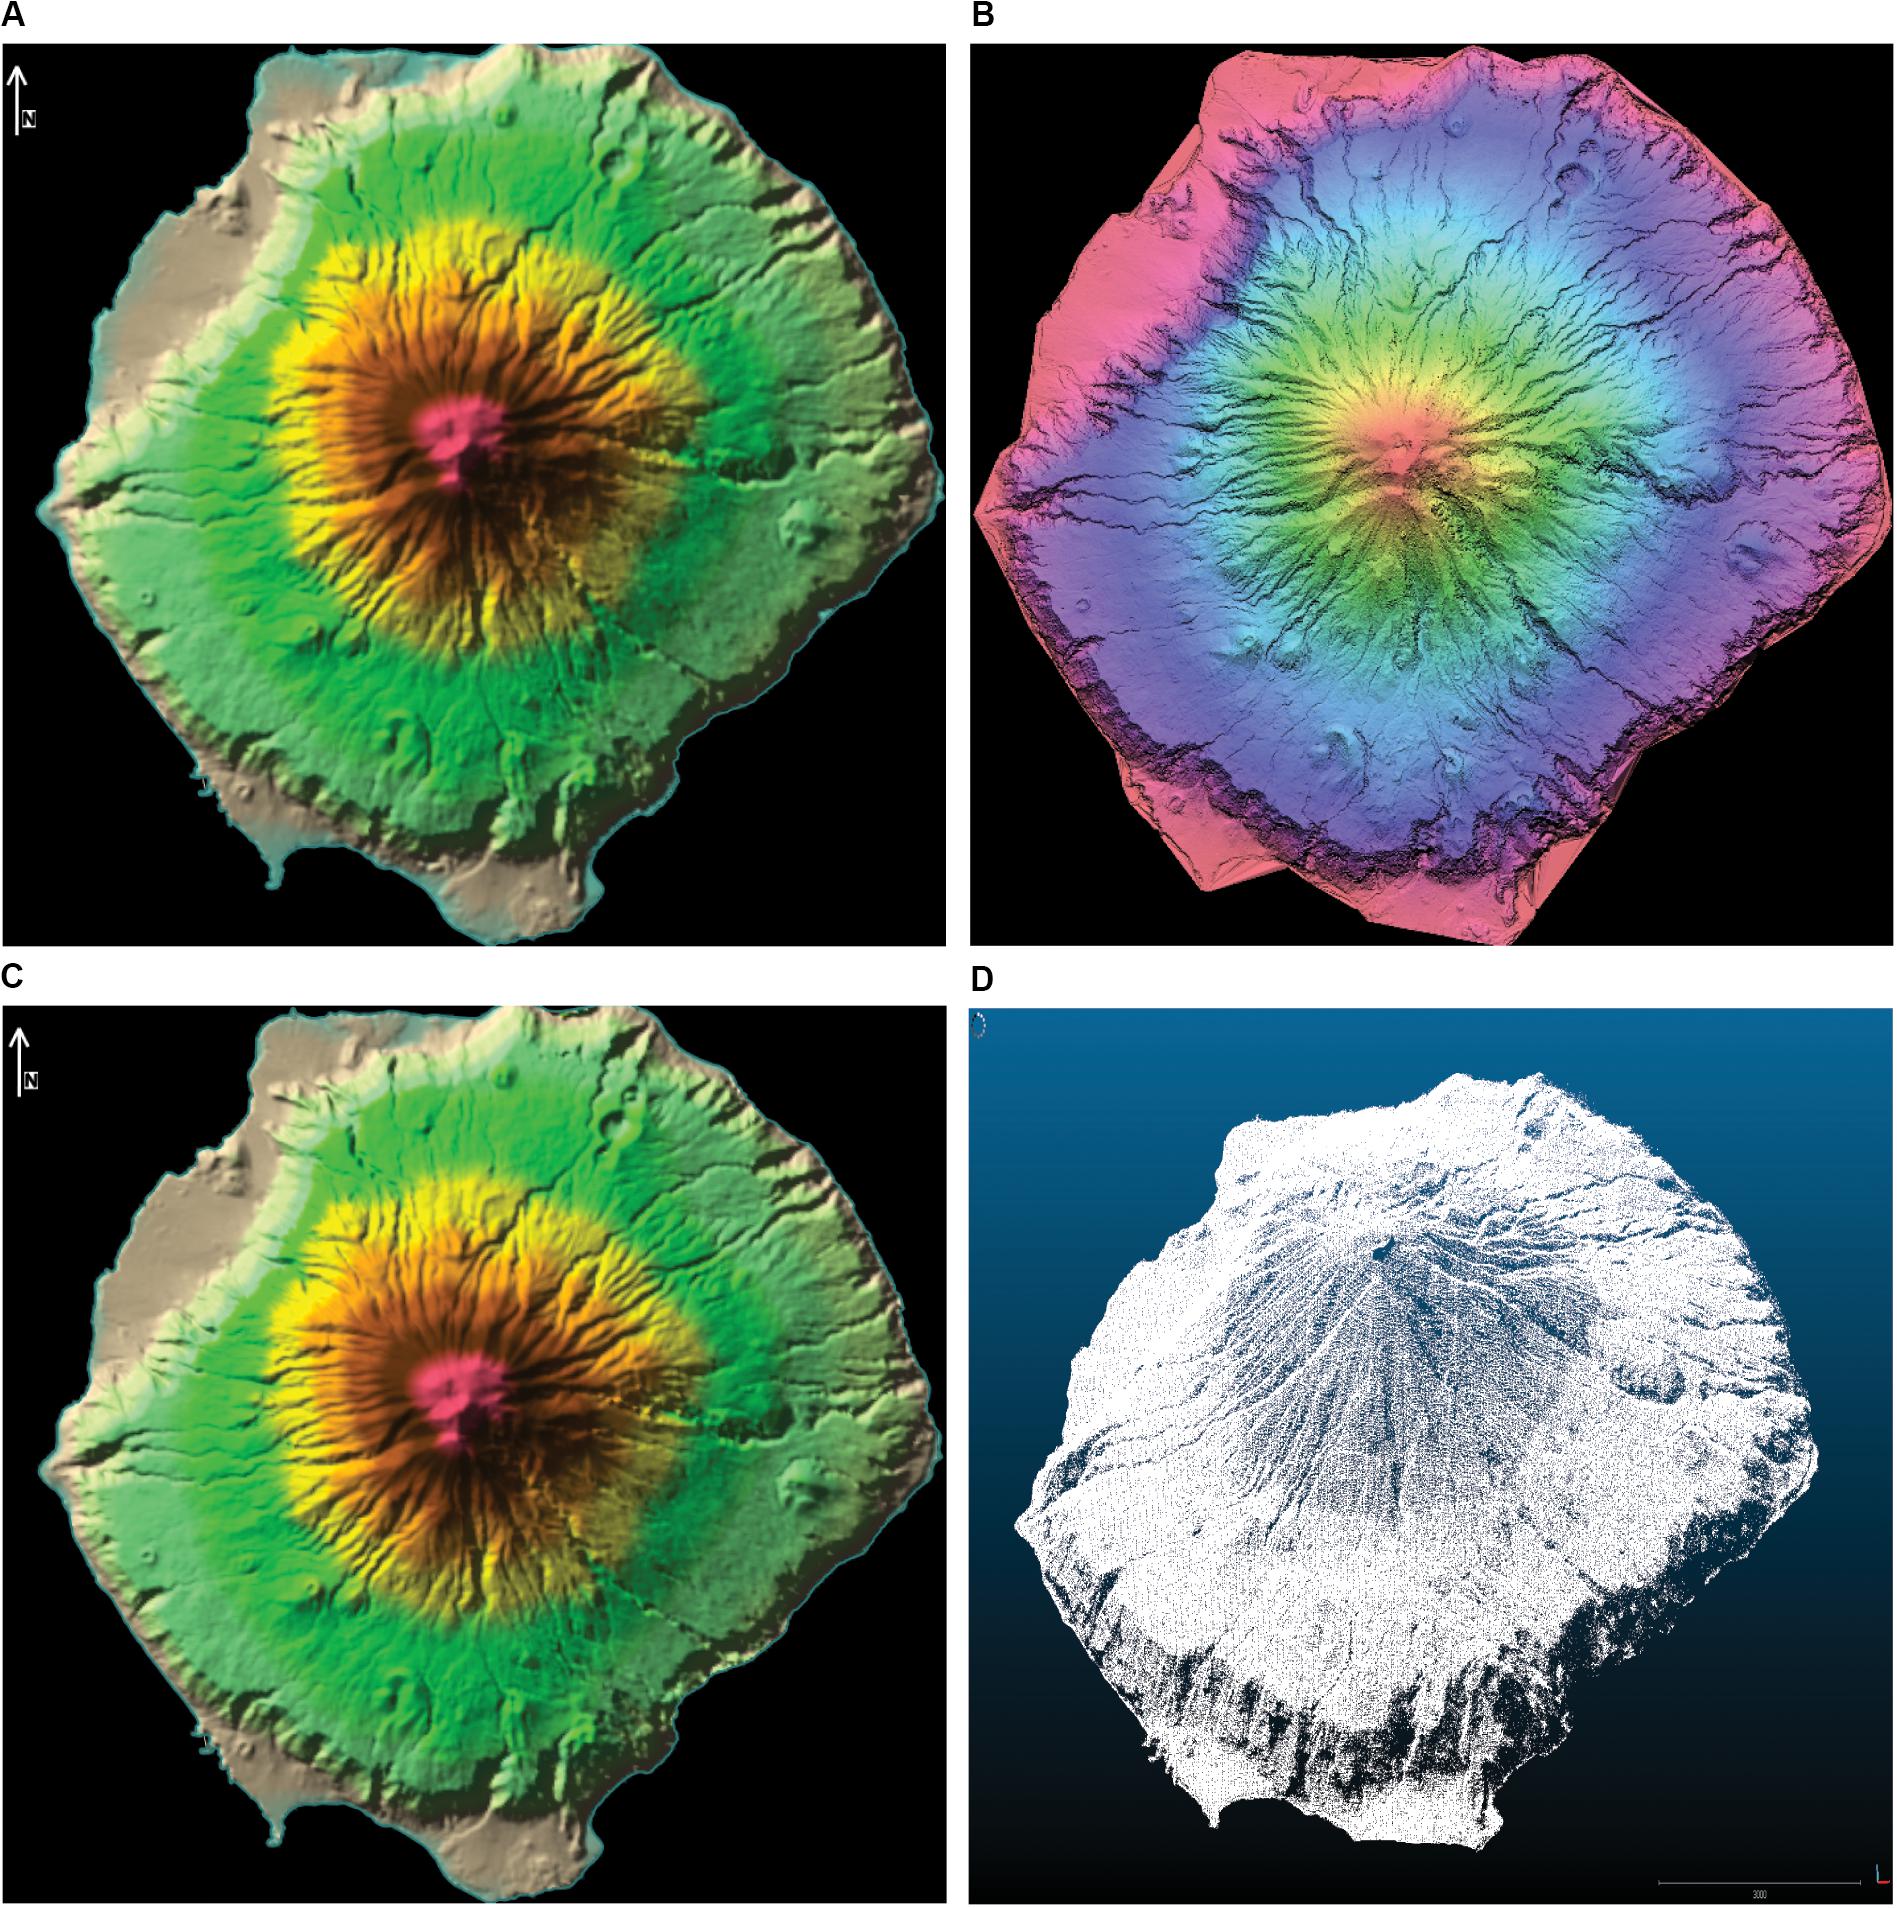
Figure 8. Raster DEM with 2m GSD generated with (A) BAE SocetGXP ATE, (B) Erdas Imagine eATE, (C) PCI Geomatica Orthoengine. (D) Point cloud generated by Erdas SGM with approx. 1 m point sampling distance.
Figure 9. (A) Medium resolution DEM with 30 m GSD. SocetGXP ATE at 10 m (B), 5 m (C), 2 m (D) GSD. SocetGXP ATE (E) and SocetGXP NGATE (F) at 1 m GSD derived from a MVS image stack.
Erdas imagine
The terrain extraction modules in Erdas Imagine require a varying level of user input and customization. SGM and ATE draw on the results of the triangulation to validate the quality of the stereo-pairs and predefine suitable parameters for stereo matching. The hierarchical approach of using the mDEM as seed model while increasing the resolution stepwise proved to be a beneficial strategy in ATE and eATE regarding computational performance, blunders and noise level. The SGM algorithm did not require any seed DEM.
While the DEMs generated by ATE appeared to be noisy, the final results from eATE showed a good level of detail with very few artifacts. The eATE module includes a very flexible terrain extraction methodology but demands a detailed technical understanding in order to balance computational performance with output quality. Matching at the highest pyramidal level provided a dense DEM at 0.5 m (approx. 1 pixel) GSD but included a high level of noise and was computationally expensive. Figure 8B shows the DEM derived by eATE at 2m GSD. The SGM module performs a pre-assessment based on the results of the triangulation to evaluate the quality of the image alignment for SGM matching. For the image triplet only the stereo-pair acquired in November 2015 provided adequate alignment quality. Dropping the quality requirements would degrade the accuracy of the final product and increase the level of noise and artifacts. The best results from SGM was derived from the single stereo-pair (Figure 8D), while the combined approach using all three stereo-pairs included a significant amount of noise and blunders. Dense point clouds were generated at pyramidal level 0 (1-pixel sample distance) with approximately 280 Million points and pyramidal level 1 (2-pixel sample distance) with approximately 80 million points. Both point clouds required intensive cleaning and filtering. With an average point spacing of approx. 1 m and a lower noise level, the SGM point cloud at pyramidal level 1 provided an adequate trade-off between sampling density and performance.
Geomatica OrthoEngine
The workflow used in Geomatica OrthoEngine did not include a triangulation. This was justifiable based on the findings of the image selection process and the results of the triangulation shown in section “Spaceborne Triangulation.” Only one stereo-pair from November 2015 was used to generate a high-quality DEM at 2 m GSD using the NCC algorithm. Higher spatial resolutions, the use of the SGM algorithm or additional stereo-pairs did not provide any substantial improvements. The results show an almost complete DEM with little noise (Figure 8C).
Point Clouds and DSMs From Drone Photogrammetry
An overview of the results of the drone survey is given in Figure 7B. The dense block of images covered the area around the harbor and a large number of perspective and panoramic views provided an almost complete overview of the surrounding mountain slopes. These additional images enabled the generation of a sparse point cloud of the neighboring areas during image matching. Due to the expected distortions and extrapolation of errors, this sparse point cloud of the mountain slopes was excluded in the final model.
Figure 4 shows the overall configuration of the image block. The image acquisition in different flying heights and orientations, perspective views of specific objects, e.g., the harbor crane, and the panoramic shots created a geometrically stable block. Table 4 summarizes the results of the aerial triangulation using different numbers of ground control and checkpoints. Only CPs were introduced in the first triangulation. A RMSE of 1.09 m in Northing, 1.12 m in Easting and 191.39 m in height showed the expected positional performance in plain but indicated a significant shift in the heights between the image position recorded by the drone and the GCN. In the second triangulation, five points and in the final triangulation all ten points were used as full GCPs. Both attempts showed positional accuracies in the range of a few centimeters, whereby the height accuracy was slightly lower than for the horizontal components. The orthophoto in Figure 10A verifies the positional accuracy. 363 from 373 images were used for camera self-calibration and the cross-correlation matrix in Figure 10D shows low correlations between the camera calibration parameters.
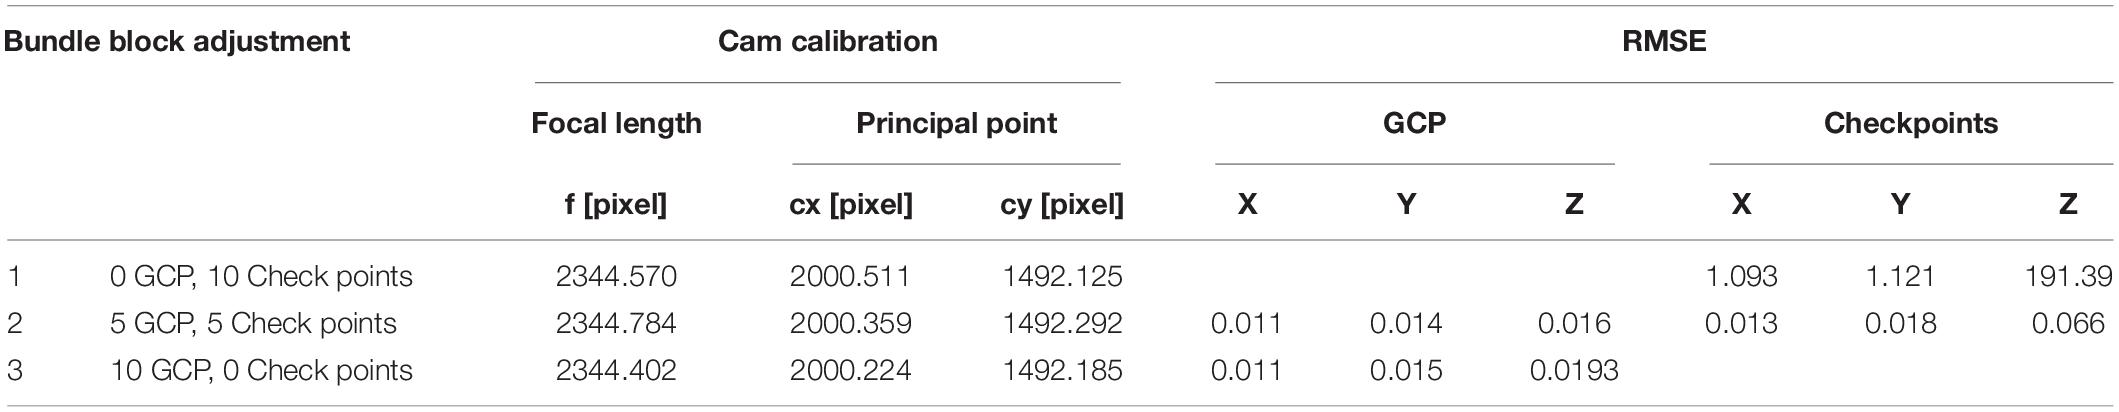
Table 4. Drone photogrammetry results of triangulation and camera calibration.
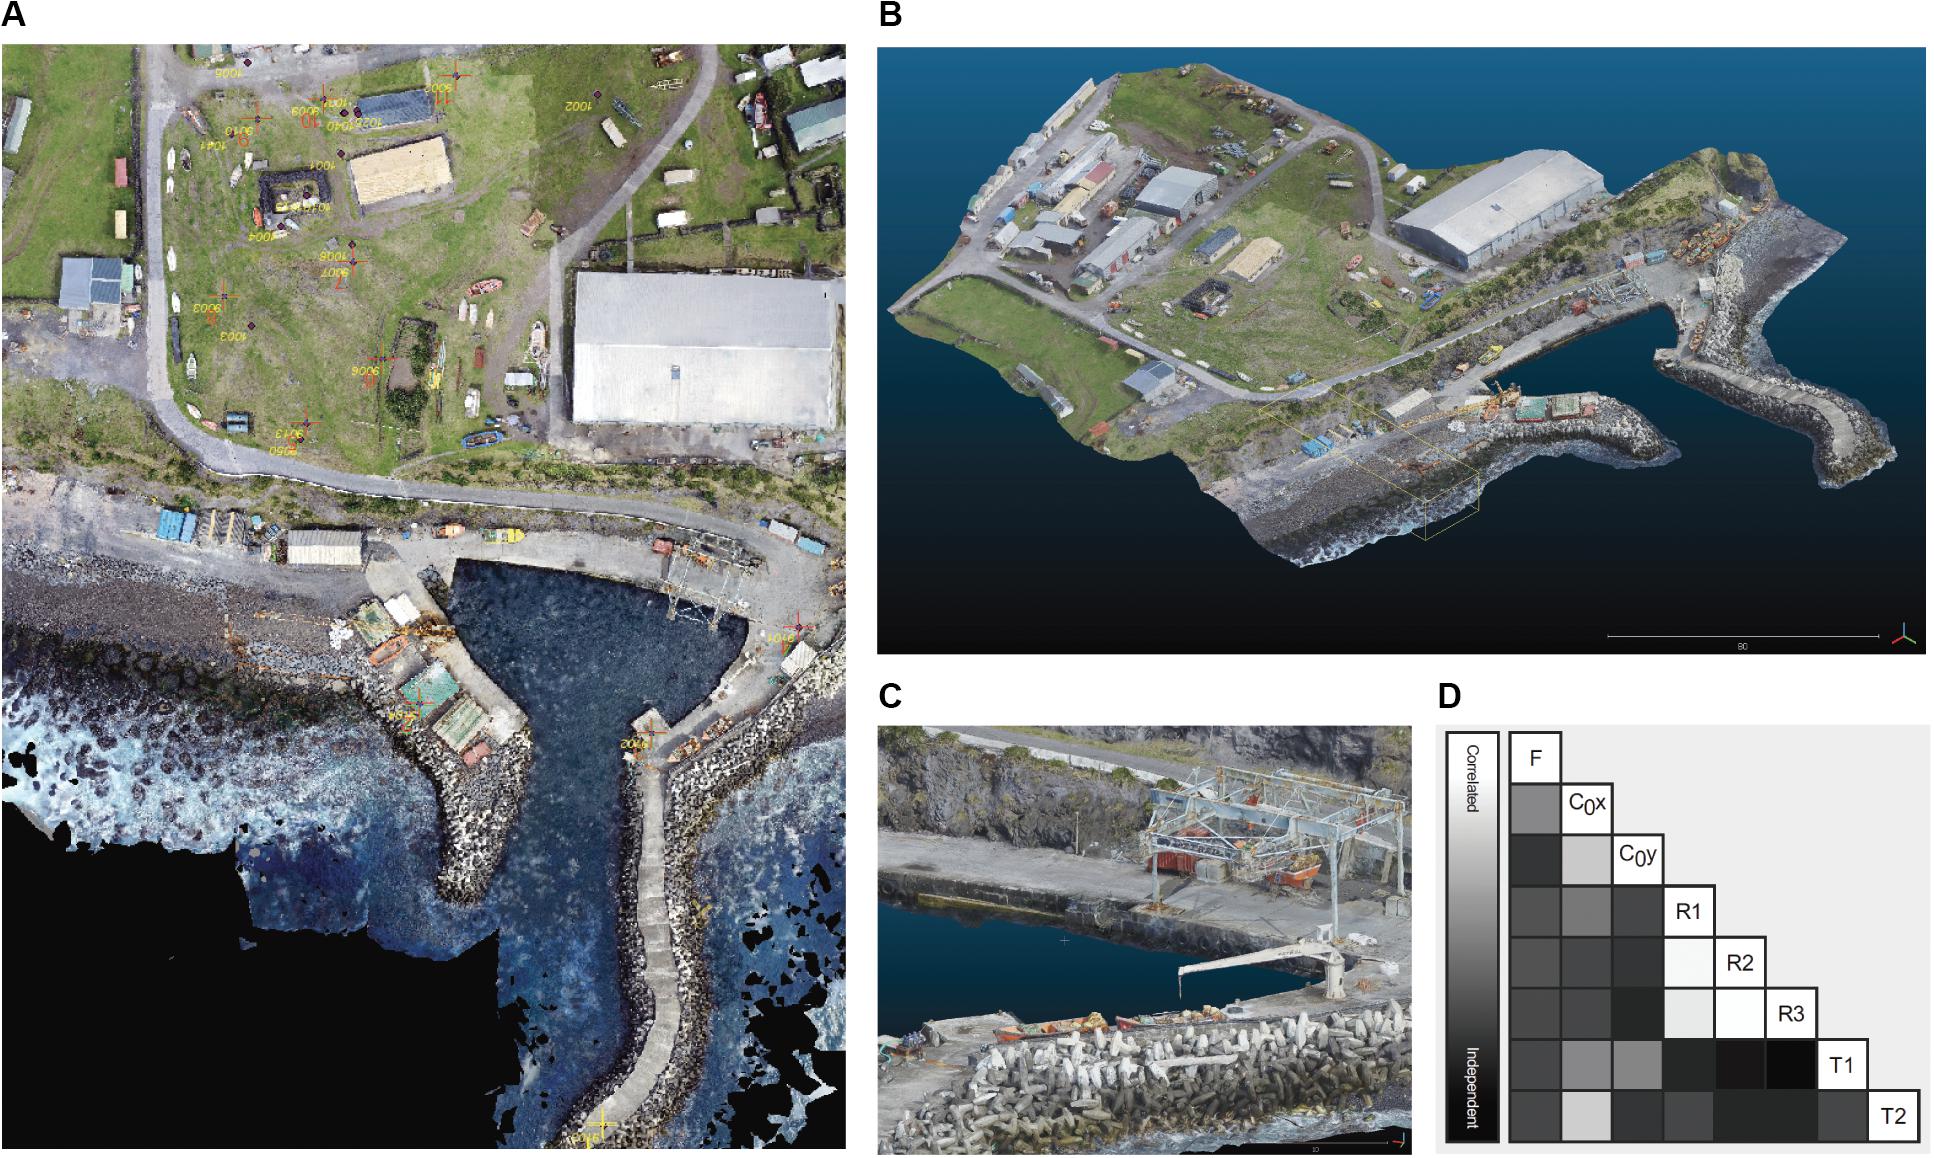
Figure 10. (A) Orthophoto generated from drone images with GCPs. (B) Overview dense point cloud from drone survey. (C) Perspective view of harbor area. (D) Cross-correlation matrix for camera calibration parameters.
Following the successful triangulation, the point cloud was generated using dense image matching. The quality of this point cloud greatly depends on the configuration and stability of the image block. Figures 10A-C give a detailed view of the harbor area. The point cloud shows a high level of detail, completeness and has a low level of noise. To avoid artifacts and distortions as seen in the top right corner of Figure 10A, the area of interest was restricted to well-captured areas of the harbor. Bordering regions were excluded from the final point cloud, DSM and orthophotos.
Point Cloud Integration From Spaceborne and Drone Photogrammetry
Regardless of the differences in spatial resolution or point sampling, the point clouds from spaceborne and drone-based data appear to be visually well-aligned as is shown in Figure 11A which gives an overview of the entire island. Figure 11B focuses on the local area showing the merged point clouds derived from spaceborne and drone imagery. In this figure the point cloud from drone photogrammetry included the extended regions of the hill slopes (Section “Drone Photogrammetry”). A visual investigation using cross-sections, cloud-to-cloud comparison and map overlays showed no obvious misalignments or rotations between spaceborne and drone-based models in the area covered by the drone survey Figures 11D,E. Although the sparse point cloud from the drone photogrammetry that covered the extended region, was immensely extrapolated, no significant distortions and wrapping effects were detected in comparison to the spaceborne model.
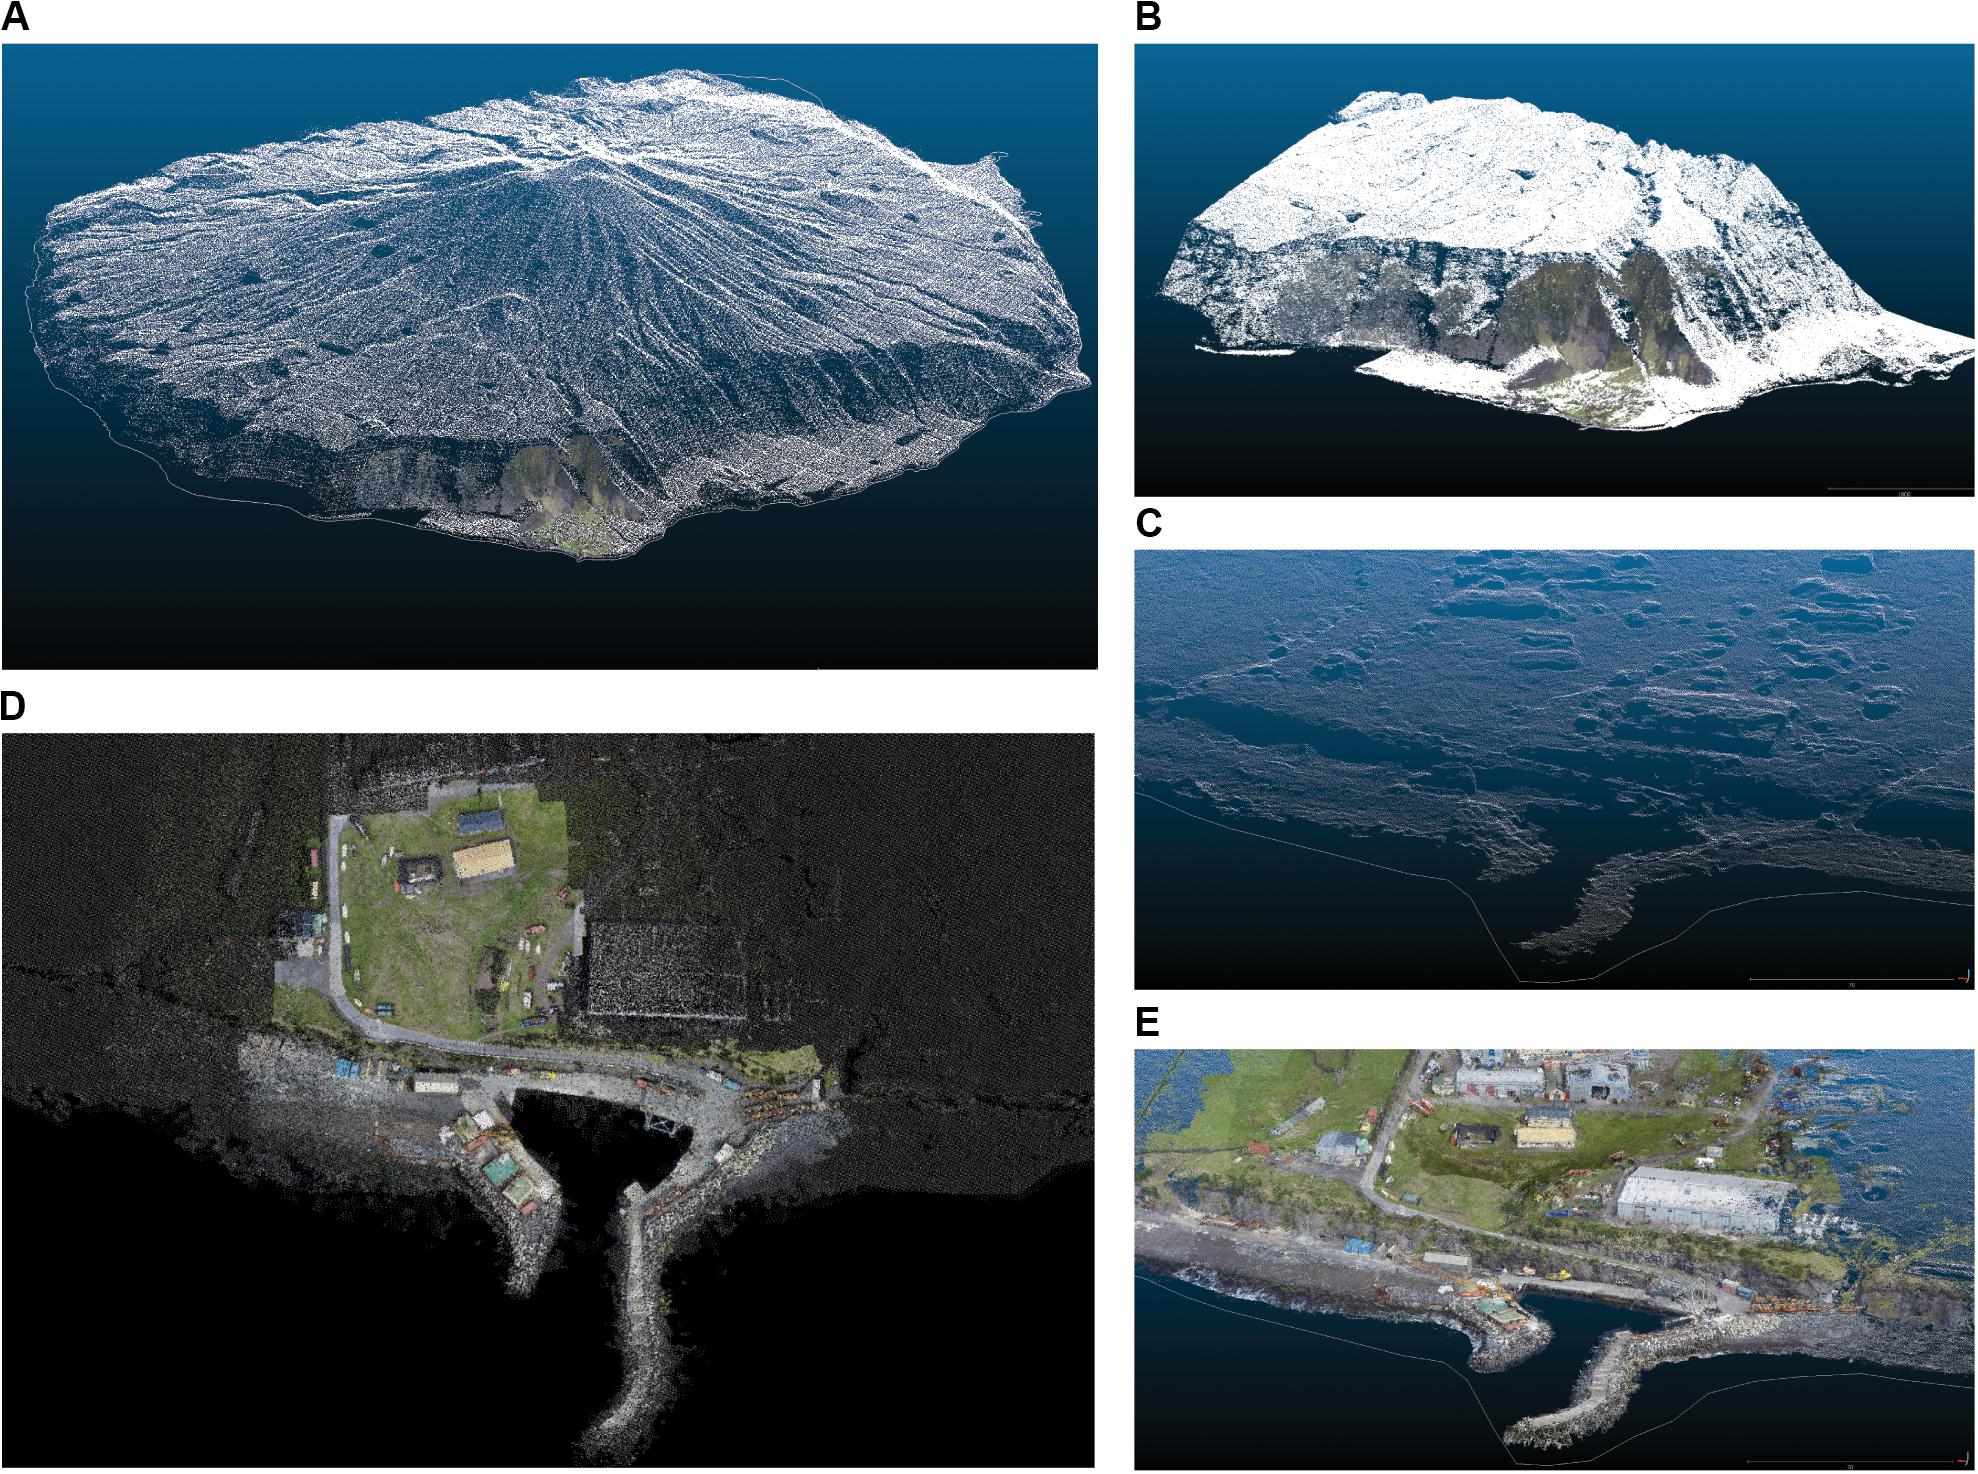
Figure 11. (A) Overview merged point clouds. (B) Area around Edinburgh of the Seven Seas. (C) Perspective view harbor area point cloud from SGM. (D) Top view of the final cloud around the harbor area. (E) Perspective view harbor area blended point clouds.
A closer examination of the harbor region showed a low level of remaining noise but poor object definition in the filtered models from the spaceborne photogrammetry (Figure 11C). No apparent differences in the level of detail between the SGM model at 1 m and 0.5 m GSD were noticed. Spaceborne and drone-based models aligned well and no apparent shift in co-registration was observed in plain (X and Y) and in height (Z). A cloud-to-cloud comparison using the ICP algorithm between the drone-based (reference) and spaceborne point clouds showed an average distance of 0.26 m with a standard deviation of 0.68 m. Despite the differences in resolutions and object definitions, this result confirms a good fit between both data sets. An additional cloud-to-cloud registration between both data sets derived a translation vector of −0.32 m in X, 0.09 m in Y and 0.25 m in Z, without any rotations. This reduced the average distance between both data sets to 0.14 m with a standard deviation of 0.53 m. Furthermore, the final comparison of the Z components shows a mean difference of 0.01 m with a standard deviation of 0.22 m. Due to its higher positional accuracy, the drone-based point cloud served as reference point cloud. Since only 3 small translations and no scales or rotations were applied, extrapolation of errors toward the full extent of the final model were avoided.
Discussion
In the absence of accurate topographic data derived from dedicated airborne mapping sensors, VHR satellite images and low-altitude drone images provide alternative data sources to generate topographic mapping data. For the presented study, a heterogeneous data set consistent of VHR imagery, low-altitude drone imagery as well as local ground control was assembled over the remote island of Tristan da Cunha with the aim to produce a surface representation with high fidelity and geometric resolution. Conventional photogrammetric workflows implemented on widely available software tools ensure reproducible results and allows to adopt this workflow to other study sites. Due to the differences in image scale and extent, both data sets where processed separately and subsequently merged into a combined point cloud. In the presented case, geodetic ground control provided sub-centimeter absolute positional accuracy for the central area of interest. This ground control was used to georeference and assess both datasets. In the absence of ground control of such accurracy, the dataset with the expected highest positional accuracy should be used to reference the other datasets.
Satellite Photogrammetry
Satellite operators have collected large archives of VHR satellite images with spatial resolution better than 1 m. These data provide an inexpensive source of imagery to generate high-resolution DEMs with 1–2 m GSD over most regions of our planet. The latest generation of highly agile VHR image satellites, e.g., WorldView3, are capable of collecting accurately georefenced images with up to 0.30 m nominal GSD in the panchromatic channel. The image archive of DigitalGlobe/Maxar comprised 100 Petabyte of images in 2016 with its fleet of satellites currently adding approximately 80 Terra Byte of image data every day. With many new satellite constellations in preparation, imagery will be available from a number of suppliers. Nevertheless, the selection and quality assessment of suitable image pairs and preprocessing is a crucial step for a successful terrain extraction. In this case study an image triplet was identified, which showed ideal conditions for the terrain extraction. The selected images provided full coverage of the island, good geometric conditions with favorable base/height ratios, high radiometric image quality without apparent atmospheric effects, no cloud coverage and low temporal decorrelation, e.g., changes in land cover.
While we detected noteworthy misalignments and shifts in the orientation of older satellite scenes, e.g., for QuickBird2, the error in the direct georeference of recent WorldView2 and WorldView3 images used in this study was detected to be below 0.5 m in Easting and Northing. This was much better as in the specification provided in DigitalGlobe/Maxar technical references, which state the absolute geolocation accuracy for a nadir image to be at 5 m circular error in 90% of cases (Digital Globe, 2014, 2016), but they are also in line with the evaluation by Poli et al. (2015). Following a consequent photogrammetric workflow, an aerial triangulation was performed to optimize the alignment between the satellite scenes. The relative alignment between stereo-pairs has a significant impact on the performance of the stereo matching algorithms and thus on the quality of the extracted DEMs.
The use of ground control needs to be considered carefully. If the reliability and accuracy of GCPs is questionable and a high a priori quality of the image orientation via direct georeference is expected, it is advisable to perform a triangulation based on tie points only. The expected accuracy of the direct georeference depends on the origin and age of the image data and should be provided as metadata. Furthermore, many scientific Calibration/Validation studies may also provide an independent assessment of VHR imagery (Poli et al., 2009; Poli and Toutin, 2010; Reinartz et al., 2010; Dowman et al., 2012; Perko et al., 2018). Since ground truth information was limited to a small area in the center of the study site, only one GCP was introduced to the spaceborne triangulation. This verified the accuracy of the direct georeference of the VHR imagery and allowed for small horizontal (or planimetric) as well as vertical corrections. The geometric and radiometric quality of the VHR images acquired by the WorldView constellations was investigated on established test sites by Angiuli et al. (2010) and Poli et al. (2015). The study confirms the accuracy of the direct georeference found in previous studies on a remote location, which adds confidence in the quality of the data source.
The assessment of the different terrain extraction modules showed that all software packages include suitable algorithms to derive high-quality DEMs. Especially the use of the NCC algorithm produced high-quality DEMs at 2 m GSD with low noise level and few blunders. Furthermore, the use of an improved ‘seed’ DEMs increased the efficiency of the terrain extraction process. The Tridicon SGM implementation was more computationally efficient and produced a denser point cloud at approximately 1 m point spacing, but also included a higher level of noise and outliers. A brute force approach based on a MVS configuration with 10 VHR images showed a higher level of noise but no noteworthy improvements at a much higher computational expense. This can be related to temporal decorrelation, lower radiometric quality, atmospheric effects, less favorable image geometry and shortcomings in the image alignment. In a successful study Loghin et al. (2020) investigated the potential and limitations of small object presentations in DSMs derived from purposely collected VHR imagery.
Drone Photogrammetry
Capabilities and endurance of small and portable multirotor drones as used in this study are still limited but are expanding all the time. The latest generation of semi-professional systems have improved positional sensors, cameras, extended battery capacity and use more sophisticated flight management software, which enable the capture of significantly larger areas. Flight management and planning software enable reliable automated missions in predefined standard configuration comparable to conventional photogrammetric blocks. Free flight missions allow the capture of bespoke image blocks but are considered difficult and do require skilled operators. The limited stability of small cameras (Gerke and Przybilla, 2016) does require frequent recalibration or self-calibration as a part of the aerial triangulation. Following the recommendation of Fraser (2018), a suitable photogrammetric block requires redundant images captured with significant overlaps, different perspective views, different flight heights, as well as a significant number of well-distributed GCPs.
In this study, it was challenging to deploy the DJI Phantom 3 drone under the harsh weather conditions. Only 2 flight missions in manual flight mode could be performed during a two weeks mission. Still, the drone survey provided a geometrically stable block of images that captured the main area of interest from a range of viewing angles and provided perspective views of the overall scene.
The absolute positioning accuracy using only the low-grade GNSS sensors onboard the drone showed good performance in Easting and Northing but had a significant bias in heights. Such height offsets are not uncommon issues when using consumer-grade drones. Inaccurate or misinterpreted information from image metadata (EXIF headers) seems to be a trivial but frequent problem, which has been reported in many discussions and investigations (Griffiths and Burningham, 2018; Bertin et al., 2020). Thus, accurate ground control information is still indispensable in order to prevent such errors. Furthermore, no boresight calibration between the positional sensor and camera position was applied. Many studies have investigated the influence of the accuracy and distribution of GCPs (Tonkin and Midgley, 2016; James et al., 2017; Martínez-Carricondo et al., 2018; Rangel et al., 2018) which highlight the importance of well-distributed and accurately determined GCPs. Ten evenly distributed GCPs were derived from the geodetic control network assure the accuracy of the model both in absolute positioning and the avoidance of distortions of the 3D model.
An increasing number of computer vision-based processing software suits offer highly automated post-processing with the generation of dense point clouds or mesh models. Many of these operate as ‘black box’ tools without the possibility to modify or customize workflows. Moreover, they provide limited information about the quality of the generated model. Software tools should provide detailed processing logs and reports which describe the results and with quantitative quality indicators. The drone photogrammetry package Pix4D used in this study provided a comprehensive quality report of the aerial triangulation, camera self-calibration estimations on the achieved relative and absolute positional accuracy of the model. Based on a strong block geometry with images captured from several flying heights and perspectives, stable and uncorrelated camera calibration parameters were obtained for both flights.
The dense point cloud from the drone photogrammetry only covered a small area of interest whereby a sparse point cloud generated based on the perspective images, provided a reasonable representation of the nearby mountain slopes which was unexpected and unreported. Based on poor geometric conditions, such point clouds are likely to include large distortions through error extrapolations. They are useful for visualizations but should be discarded for analytical applications.
Point Cloud Integration and Validation
Since the spaceborne and the low-altitude drone-based models were accurately georeferenced using the geodetic ground control, both models were merged based on their geolocation without the use of natural targets or cloud to cloud registration. Due to the difference in spatial resolution and extent, the application of a best fit cloud-to-cloud registration via an iterative closest point (ICP) algorithm requires additional thoughts to avoid the extrapolation of errors on from the local area to larger extent one hand or degradation of the positional accuracy on the other hand. Detailed metadata about the data acquisition methods, spatial resolution, relative accuracy as well as absolute positional accuracies are required to guide this process.
Filtering and cleaning remain to be an essential part of the DEM extraction process and have a significant impact on the results of any subsequent data analysis. Ideally, this step should be performed by the informed user of the DEM, who is best aware of the requirements of the intended application.
Conclusion
In this study, we used archived VHR satellite images and low altitude drone imagery to produce a high-resolution DEM over the remote island of Tristan da Cunha. The DEMs derived from VHR imagery cover the whole island and were generated following a rigorous photogrammetric workflow. We assessed the performance of the terrain extraction and dense image matching algorithms included in three widely available geospatial software packages. For the low-altitude drone survey, we used the drone photogrammetry package Pix4D to derive a dense point cloud of the harbor area and research installations with up to 500 points/m2. A geodetic survey provided ground control with sub-centimeter absolute positional accuracy in the same area. A cloud-to-cloud comparison of spaceborne and drone-based point clouds showed a tight fit based on their georeference. The co-registration of both models was optimized via small translations in plain and height and subsequently merged to a single point cloud.
We have barely touched the potential of the use of archived VHR satellite images. The high-resolution DEMs were derived from well know conventional stereophotogrammetric methods. However, image selection and preprocessing are crucial. Good-quality DEMs can be generated if suitable stereo-pairs or image triplets are available from archived data. We demonstrated the application of best practice photogrammetric workflows on widely available geospatial software suits. Multiview image matching using selected combinations of stereo-pairs should further improve the completeness and accuracy of the models in occluded regions and help to eliminate blunders. Considering a large number of available images, multi-temporal change detection, e.g., for landslides, should be possible.
Although the positional and navigational sensors of small drones have improved considerably, the use of well-distributed GCPs is still indispensable to assure geometric fidelity and the accurate georeference. Drone surveys using low-cost semi-professional drones should follow best practice recommendations for a stable photogrammetric block.
By applying a rigorous georeferenced workflow with well established and accurate control points, merging the DEMs in point clouds representation was straight forward despite the differences in geometric resolution and extent. In the absence of accurate ground control, the dataset with the expected highest positional accuracy should provide the reference to coregister all other datasets. The lack of suitable reference data prevented a thorough quantitative assessment, especially of the spaceborne DEMs. However, this is not uncommon for projects of this kind. The collection of extended ground control and reference data will be highly desirable tasks for future missions.
The study showed that archived VHR satellite imagery and low-altitude drone imagery provides two alternative data sources to generate high-resolution DEMs over regions where airborne mapping data are not available. In the presented study, we combined the strength and weaknesses of both data sources to produce a high-resolution point cloud that covers the full extent of the study site and preserves fine detail of a local area of interest. DTMs as well as orthophotos, can easily be derived from the final point cloud.
The growing archive of VHR images collected by current and future satellite fleets will allow the generation of multi-temporal high-resolution DEMs over most parts of the world and enable dedicated geo-monitoring tasks. Low-cost and simple to use drones are already a useful tool to collect high-resolution data sets over small areas. We demonstrated that both data sources combined can provide high-quality DEMs over remote regions with poor mapping.
Data Availability Statement
The extended datasets for this study are available on request to the corresponding author. The final 3D point clouds as well as 2.5 raster DEMs are available on the Pangea data repository with the article’s doi: 10.3389/feart.2020.00319.
Author Contributions
DB was responsible for the analysis of both the spaceborne and aerial photogrammetric data sets over Tristan da Cunha while FT was responsible for all installations on the island, the geodetic surveys and their analysis, the drone imagery acquisition, and the project coordination overall. Both authors contributed to the article and approved the submitted version.
Funding
DB is funded by the University of Luxembourg. The DigitalGlobe Foundation provided the satellite imagery under the umbrella of Image Grand. The installations and survey work on Tristan da Cunha were funded through projects at the University of Luxembourg (in particular SGSL) and the United Kingdom National Oceanography Centre.
Conflict of Interest
The authors declare that the research was conducted in the absence of any commercial or financial relationships that could be construed as a potential conflict of interest.
Acknowledgments
We acknowledge Hexagon Geospatial for providing access to and advice on Erdas Imagine as well as additional software licenses for the automatic terrain extraction modules, PCI Geomatics for providing Geomatica OrthoEngine software as well as professional expertise and guidance, BAE Systems for temporary access to SocketGXP, and the help and support from the community, various contract workers and local administration of Tristan da Cunha, the contributions from the IGN, France, with respect to the DORIS station and the IGS for data and satellite products. Finally we would like to thank the reviewers for their constructive input to this study.
References
Angiuli, E., Remondino, F., and Poli, D. (2010). “Radiomeric and geometric analysis of worldview-2 stereo scenes,” in Proceedings of the International Archives of the Photogrammetry, Remote Sensing and Spatial Information Sciences, Vol. XXXVIII (Calgary Alberta), 1–6.
Aschbacher, J., and Milagro-Pérez, M. P. (2012). The european earth monitoring (GMES) programme: status and perspectives. Remote Sens. Environ. 120, 3–8. doi: 10.1016/j.rse.2011.08.028
Ban, Y., Gong, P., and Giri, C. (2015). Global land cover mapping using Earth observation satellite data: recent progresses and challenges. ISPRS J. Photogramm. Remote Sens. 103, 1–6. doi: 10.1016/j.isprsjprs.2015.01.001
Bertin, S., Levy, B., Gee, T., and Delmas, P. (2020). Geomorphic change detection using cost-effective structure-from-motion photogrammetry: evaluation of direct georeferencing from consumer-grade UAS at Orewa Beach (New Zealand). Photogramm. Eng. Remote Sens. 86, 289–298. doi: 10.14358/PERS.86.5.289
Bulatov, D., Wernerus, P., and Heipke, C. (2011). Multi-view dense matching supported by triangular meshes. ISPRS J. Photogramm. Remote Sens. 66, 907–918. doi: 10.1016/j.isprsjprs.2011.06.006
Chen, J., Dowman, I., Li, S., Li, Z., Madden, M., Mills, J., et al. (2016). Information from imagery: ISPRS scientific vision and research agenda. ISPRS J. Photogramm. Remote Sens. 115, 3–21. doi: 10.1016/j.isprsjprs.2015.09.008
Colomina, I., and Molina, P. (2014). Unmanned aerial systems for photogrammetry and remote sensing: a review. ISPRS J. Photogramm. Remote Sens. 92, 79–97. doi: 10.1016/j.isprsjprs.2014.02.013
Cramer, M., Przybilla, H.-J., and Zurhorst, A. (2017). UAV cameras: overview and geometric calibration benchmark. ISPRS Int. Arch. Photogramm. Remote Sens. Spat. Inf. Sci XLII-2/W6, 85–92. doi: 10.5194/isprs-archives-XLII-2-W6-85-2017
Dach, R., Lutz, S., Walser, P., and Fridez, P. (eds) (2015). Bernese GNSS Software Version 5.2. User Manual. Bern: Astronomical Institute, University of Bern, Bern Open Publishing, doi: 10.7892/boris.72297
Day, D., Weaver, W., and Wilsing, L. (2016). Accuracy of UAS photogrammetry: a comparative evaluation. Photogramm. Eng. Remote Sens. 82, 909–914. doi: 10.14358/PERS.82.12.909
Digital Globe, (2016). Accuracy of WorldView Products – White Paper. Available online at: https://dg-cms-uploads-production.s3.amazonaws.com/uploads/document/file/38/DG_ACCURACY_WP_V3.pdf (accessed January 4, 2018).
Digital Globe, (2014). DigitalGlobe Technical Information – Core Imagery Products Guide. Available online at: http://www.geosoluciones.cl/documentos/worldview/DigitalGlobe-Core-Imagery-Products-Guide.pdf (accessed April 3, 2018)
Dowman, I. J. (1989). Topographic applications of spot data. Photogramm. Rec. 13, 155–156. doi: 10.1111/j.1477-9730.1989.tb00659.x
Dowman, I. J., Jacobsen, K., Konecny, G., and Sandau, R. (2012). High Resolution optical Satellite Imagery. Caithness: Whittles Publishing.
Fraser, C. (2018). ISPRS-Interview-Fraser.pdf. Available online at: http://www.isprs.org/tc2-symposium2018/images/ISPRS-Interview-Fraser.pdf (accessed August 30, 2018).
Fraser, C. S. (1997). Digital camera self-calibration. ISPRS J. Photogramm. Remote Sens. 52, 149–159. doi: 10.1016/S0924-2716(97)00005-1
Gerke, M., and Przybilla, H.-J. (2016). Accuracy analysis of photogrammetric UAV image blocks: influence of onboard RTK-GNSS and cross flight patterns. Photogramm. Fernerkund. Geoinform. 1, 17–30. doi: 10.1127/pfg/2016/0284
Gindraux, S., Boesch, R., and Farinotti, D. (2017). Accuracy assessment of digital surface models from unmanned aerial vehicles’ imagery on glaciers. Remote Sens. 9:186. doi: 10.3390/rs9020186
Gong, K., and Fritsch, D. (2016). A detailed study about digital surface model generation using high resolution satellite stereo imagery. ISPRS Ann. Photogramm. Remote Sens. Spat. Inf. Sci. III–1, 69–76. doi: 10.5194/isprsannals-III-1-69-2016
Griffiths, D., and Burningham, H. (2018). Comparison of pre- and self-calibrated camera calibration models for UAS-derived nadir imagery for a SfM application. Prog. Phys. Geogr. Earth Environ. 43, 215–235. doi: 10.1177/0309133318788964
Gugan, D. J., and Dowman, I. J. (1988). Accuracy and completeness of topographic mapping from spot imagery. Photogramm. Rec. 12, 787–796. doi: 10.1111/j.1477-9730.1988.tb00629.x
Guth, P. L. (2010). “Geomorphometric comparison of aster GDEM and SRTM,” in Proceedings of the Part 4th ISPRS Archives A special Joint Symposium of ISPRS Technical Commission IV & AutoCarto in conjunction with ASPRS/CaGIS 2010 Fall Specialty Conference, Vol. XXXVIII, Orlando, FL, 10.
Haala, N., Cramer, M., Weimer, F., and Trittler, M. (2012). Performance test on uav-based photogrammetric data collection. ISPRS Int. Arch. Photogramm. Remote Sens. Spat. Inf. Sci. XXXVIII-1/C22, 7–12. doi: 10.5194/isprsarchives-XXXVIII-1-C22-7-2011
Hasegawa, H., Matsuo, K., Koarai, M., Watanabe, N., Masaharu, H., and Fukushima, Y. (2000). “Dem accuracy and the base to height (B/H) ratio of stereo images,” in Proceedings of the Part B4 International Archives of Photogrammetry and Remote Sensing, Vol. XXXIII, Amsterdam, 4.
Hirschmuller, H. (2008). Stereo processing by semiglobal matching and mutual information. IEEE Trans. Pattern Anal. Mach. Intell. 30, 328–341. doi: 10.1109/TPAMI.2007.1166
Höhle, J., and Höhle, M. (2009). Accuracy assessment of digital elevation models by means of robust statistical methods. ISPRS J. Photogramm. Remote Sens. 64, 398–406. doi: 10.1016/j.isprsjprs.2009.02.003
Höhle, J., and Potuckova, M. (2011). Assessment of the Quality of Digital Terrain Models. Leuven: EuroSDR.
James, M. R., Robson, S., d’Oleire-Oltmanns, S., and Niethammer, U. (2017). Optimising UAV topographic surveys processed with structure-from-motion: Ground control quality, quantity and bundle adjustment. Geomorphology 280, 51–66. doi: 10.1016/j.geomorph.2016.11.021
Loghin, A.-M., Otepka-Schremmer, J., and Pfeifer, N. (2020). Potential of Pléiades and worldview-3 Tri-stereo DSMs to represent heights of small isolated objects. Sensors 20:2695. doi: 10.3390/s20092695
Martínez-Carricondo, P., Agüera-Vega, F., Carvajal-Ramírez, F., Mesas-Carrascosa, F.-J., García-Ferrer, A., and Pérez-Porras, F.-J. (2018). Assessment of UAV-photogrammetric mapping accuracy based on variation of ground control points. Int. J. Appl. Earth Observ. Geoinform. 72, 1–10. doi: 10.1016/j.jag.2018.05.015
Michalis, P., and Dowman, I. (2004). “A rigorous model and DEM generation for SPOT5-HRS,” in Proceedings of the International Archives of the Photogrammetry, Remote Sensing and Spatial Information Sciences, Istanbul, 6.
Muller, J. P., and Dowman, I. J. (1989). “Applications Of stereo spot for mapping,” in Proceedings of the 12th Canadian Symposium on Remote Sensing Geoscience and Remote Sensing Symposium, Vancouver, BC, 484–484. doi: 10.1109/IGARSS.1989.578746
Perko, R., Raggam, H., Schardt, M., and Roth, P. M. (2018). Very high resolution mapping with the Pléiades satellite constellation. Am. J. Remote Sens. 6, 89–99. doi: 10.11648/j.ajrs.20180602.14
Pierrot-Deseilligny, M., and Paparoditis, N. (2006). “A multiresolution and optimization-based image matching approach: an application to surface reconstruction from spot5-hrs stereo imagery,” in Proceedings of the IAPRS in ISPRS Workshop On Topographic Mapping From Space (With Special Emphasis on Small Satellites), Vol. XXXVI-1/W41, Ankara, 5.
Poli, D., Remondino, F., Angiuli, E., and Agugiaro, G. (2015). Radiometric and geometric evaluation of GeoEye-1, WorldView-2 and Pléiades-1A stereo images for 3D information extraction. ISPRS J. Photogramm. Remote Sens. 100, 35–47. doi: 10.1016/j.isprsjprs.2014.04.007
Poli, D., and Toutin, T. (2010). Review of developments in geometric modelling for high resolution satellite pushbroom sensors. Photogramm. Rec. 27, 58–73. doi: 10.1111/j.1477-9730.2011.00665.x
Poli, D., Wolff, K., and Gruen, A. (2009). “Evaluation of worldview-1 stereo scenes and related 3D products,” in Proceedings of the ISPRS Archives of the Photogrammetry, Remote Sensing and Spatial Information Science, Vol. XXXVIII-1-4-7/W5, Hannover.
Rangel, J. M. G., Gonçalves, G. R., and Pérez, J. A. (2018). The impact of number and spatial distribution of GCPs on the positional accuracy of geospatial products derived from low-cost UASs. Int. J. Remote Sens. 39, 7154–7171. doi: 10.1080/01431161.2018.1515508
Reinartz, P., Pablo, D., Krauss, T., Poli, D., Jacobsen, K., and Buyuksalih, G. (2010). “Benchmarking and quality analysis of DEM generated from high and very high resolution optical stereo satellite data,” in Proceedings of the Part 1 International Archives of Photogrammetry and Remote Sensing - ISSN: 1682-1777, Vol. XXXVIII, Calgary, AB.
Rexer, M., and Hirt, C. (2014). Comparison of free high resolution digital elevation data sets (ASTER GDEM2, SRTM v2.1/v4.1) and validation against accurate heights from the Australian National Gravity Database. Aust. J. Earth Sci. 61, 213–226. doi: 10.1080/08120099.2014.884983
Robinson, N., Regetz, J., and Guralnick, R. P. (2014). EarthEnv-DEM90: a nearly-global, void-free, multiscale smoothed, 90m digital elevation model from fused ASTER and SRTM data. ISPRS J. Photogramm. Remote Sens. 87, 57–67. doi: 10.1016/j.isprsjprs.2013.11.002
Rudowski, V. (2004). “Synthesis of studies relating to HRS DTM production,” in Proceedings of the Part B1 ISPRS Archives, Vol. XXXV, Istanbul, 11.
Schumann, G. J.-P., Moller, D. K., and Mentgen, F. (2016). High-accuracy elevation data at large scales from airborne single-pass SAR interferometry. Front. Earth Sci. 3:88. doi: 10.3389/feart.2015.00088
Shortridge, A. (2006). Shuttle radar topography mission elevation data error and its relationship to land cover. Cartogr. Geogr. Inf. Sci. 33, 65–75. doi: 10.1559/152304006777323172
Shortridge, A., and Messina, J. (2011). Spatial structure and landscape associations of SRTM error. Remote Sens. Environ. 115, 1576–1587. doi: 10.1016/j.rse.2011.02.017
Strecha, C., Pylvänäinen, T., and Fua, P. (2010). “Dynamic and scalable large scale image reconstruction,” in Proceedings of the 2010 IEEE Computer Society Conference on Computer Vision and Pattern Recognition, San Francisco, CA, 406–413. doi: 10.1109/CVPR.2010.5540184
Tachikawa, T., Kaku, M., Iwasaki, A., Gesch, D. B., Oimoen, M. J., Zhang, Z., et al. (2011). ASTER Global Digital Elevation Model Version 2 – Summary of Validation Results. Available online at: http://pubs.er.usgs.gov/publication/70005960 (accessed August 31, 2018).
Theodossiou, E. I., and Dowman, I. J. (1990). Heighting accuracy of SPOT. Photocramm. Eng. Remote Sens. 56:7.
Tighe, M. L., and Chamberlain, D. (2009). Accuracy Comparison of the Srtm, Aster, Ned, Nextmap§USA Digital Terrain Model Over Several USA Study Sites. Technical Report. Englewood, CO: Intermap Technologies, 12.
Tonkin, T. N., and Midgley, N. G. (2016). Ground-control networks for image based surface reconstruction: an investigation of optimum survey designs using UAV derived imagery and structure-from-motion photogrammetry. Remote Sens. 8:786. doi: 10.3390/rs8090786
USGS, (2018). EarthExplorer. Available online at: https://earthexplorer.usgs.gov/ (accessed August 30, 2018).
Walker, S. (2007). “New features in SOCET SET§,” in Photogrammetric Week 2007, ed. D. Fritsch, (Stuttgart: Wichmann Verlag).
Woodworth, P. (2020). Wave setup at Tristan da Cunha. Afr. J. Mar. Sci. 42, 233–245. doi: 10.2989/1814232X.2020.1776390
Zhang, B. (2006). “Towards a higher level of automation in softcopy photogrammetry: NGATE and LIDAR processing in SOCET SET,” in Proceedings of the GeoCue Corporation 2nd Annual Technical Exchange Conference, Nashville, TN.
Keywords: digital elevation model, drone photogrammetry, VHR satellite imagery, Tristan da Cunha, multiscale data fusion
Citation: Backes DJ and Teferle FN (2020) Multiscale Integration of High-Resolution Spaceborne and Drone-Based Imagery for a High-Accuracy Digital Elevation Model Over Tristan da Cunha. Front. Earth Sci. 8:319. doi: 10.3389/feart.2020.00319
Received: 10 October 2018; Accepted: 07 July 2020;
Published: 08 September 2020.
Edited by:
Paul Bates, University of Bristol, United KingdomReviewed by:
Ahmed Kenawy, Mansoura University, EgyptBrian C. Gunter, Georgia Institute of Technology, United States
Copyright © 2020 Backes and Teferle. This is an open-access article distributed under the terms of the Creative Commons Attribution License (CC BY). The use, distribution or reproduction in other forums is permitted, provided the original author(s) and the copyright owner(s) are credited and that the original publication in this journal is cited, in accordance with accepted academic practice. No use, distribution or reproduction is permitted which does not comply with these terms.
*Correspondence: Dietmar J. Backes, DJBackes@outlook.com