the Creative Commons Attribution 4.0 License.
the Creative Commons Attribution 4.0 License.
 | 07 Sep 2020
Technical note: Measurements and data analysis of sediment–water oxygen flux using a new dual-optode eddy covariance instrument
Peter Berg
Alireza Merikhi
Sediment–water oxygen fluxes are widely used as a proxy for organic carbon production and mineralization at the seafloor. In situ fluxes can be measured non-invasively with the aquatic eddy covariance technique, but a critical requirement is that the sensors of the instrument are able to correctly capture the high-frequency variations in dissolved oxygen concentration and vertical velocity. Even small changes in sensor characteristics during deployment as caused, e.g. by biofouling can result in erroneous flux data. Here we present a dual-optode eddy covariance instrument (2OEC) with two fast oxygen fibre sensors and document how erroneous flux interpretations and data loss can effectively be reduced by this hardware and a new data analysis approach. With deployments over a carbonate sandy sediment in the Florida Keys and comparison with parallel benthic advection chamber incubations, we demonstrate the improved data quality and data reliability facilitated by the instrument and associated data processing. Short-term changes in flux that are dubious in measurements with single oxygen sensor instruments can be confirmed or rejected with the 2OEC and in our deployments provided new insights into the temporal dynamics of benthic oxygen flux in permeable carbonate sands. Under steady conditions, representative benthic flux data can be generated with the 2OEC within a couple of hours, making this technique suitable for mapping sediment–water, intra-water column, or atmosphere–water fluxes.


The significant role of sediments in the marine cycles of matter (Walsh, 1988; Johnson et al., 1999; Jahnke, 2010; Bauer et al., 2013) emphasizes the need for reliable benthic flux data. Where currents and benthic photosynthesis influence interfacial flux at the seafloor, the aquatic eddy covariance technique is a preferred tool for determining benthic oxygen fluxes, as it permits flux measurements with minimal disturbance of bottom flow and light. This technique derives vertical oxygen flux from time series of rapid simultaneous measurements of vertical flow velocity changes and associated oxygen changes at a fixed point above the sediment surface. Since its introduction by Berg et al. (2003), the strength of this non-invasive technique has been demonstrated in marine and freshwater settings (Berg et al., 2013; Chipman et al., 2016; Hume et al., 2011; Reimers et al., 2012; Rheuban et al., 2014a; Lorrai et al., 2010; Attard et al., 2019; Rodil et al., 2019) including environments (e.g. permeable sediments, seagrass beds, coral reefs, hard bottoms, sea ice) that pose challenges to other flux-measuring techniques (Berg et al., 2009, 2020; Brand et al., 2008; Crusius et al., 2008; Glud et al., 2010; McGinnis et al., 2014; Berg and Pace, 2017; Long et al., 2013; Long et al., 2012).
The main challenge of the present aquatic eddy covariance instrumentation is associated with the high-frequency oxygen measurements. The microelectrodes typically used for these measurements (sensor tip <100 µm) break easily during deployments in energetic coastal environments (Chipman et al., 2012; Berg et al., 2017), and their stirring sensitivity and signal drift add further uncertainties to the oxygen data (Gundersen et al., 1998; Holtappels et al., 2015; Reimers et al., 2016). To improve the reliability of the flux measurements, eddy covariance instruments with dual microelectrodes were developed (e.g. Attard et al., 2014; McGinnis et al., 2011; Rodil et al., 2019; de Froe et al., 2019; Rovelli et al., 2015)
An alternative to the electrochemical microelectrodes are optical sensors (optodes or optrodes) that use the luminescence characteristics of an oxygen-sensitive dye for oxygen concentration measurements (Klimant et al., 1995; Holst et al., 1998; Bittig et al., 2018; Wang and Wolfbeis, 2014). Optodes consume no oxygen and may have very low or no stirring sensitivity (Holtappels et al., 2015; Berg et al., 2016, 2017). Compared to microelectrodes, we have observed that they are less susceptible to signal drift and keep their calibration over longer time. Because they are not sensitive to sulfides, optodes are the superior sensor in hypoxic environments or near anoxic sediment surfaces. Weaknesses of optodes include the bleaching of the sensor dye over time, their non-linear calibration with decreasing resolution at high oxygen concentrations, and the interference of strong light with the optical measurements (Lehner et al., 2015). Although most optodes are more robust than microelectrodes, they can break due to particle collision. In long-term measurements, the bleaching effect can be reduced through interval measurements. The non-linear calibration can be described by a function based on the Stern–Volmer equation (Stern and Volmer, 1919; Wang and Wolfbeis, 2014) that allows reliable conversion of the optode signal to concentration data, but the decreasing resolution at high oxygen concentrations remains. The light interferences typically are only an issue in very shallow water and can be eliminated by protective fibre coatings.
Irrespective of the technology, the readings of the oxygen sensors can be biased by attachment of particles, bacteria, or algal cells, which can affect the sensor signal through shielding of the sensor tip and metabolic processes (Smith et al., 2007; Delauney et al., 2010). Mineral particles may be impenetrable to gases, while organic particles may be sufficiently dense or oxygen consuming such that oxygen diffusion through them is reduced, (Zetsche et al., 2020; Ploug and Passow, 2007) thereby decreasing and delaying oxygen transport to the sensing surface. The ensuing increase in the response time of the sensor dampens the oxygen signal and thereby reduces the calculated flux. Berg et al. (2015) explained how the resulting time offset between the oxygen and the velocity data can cause significant overestimation or underestimation of the flux. The most common particles attaching to sensors may be marine snow particles (Fig. 1a), sticky aggregates of various organic and inorganic particles glued together by extracellular polymeric substances (EPS) (Alldredge and Silver, 1988). Bacteria and phytoplankton cells commonly contained in these particles can cause both oxygen consumption and oxygen production, thereby affecting the signals of the oxygen sensor and the fluxes calculated from these readings. As an example, we observed oxygen flux increases up to 4.4 mmol m−2 h−1 caused by photosynthesis and decreases up to −5.2 mmol m−2 h−1 caused by respiration of microbes contained in marine snow attached to the oxygen sensor.
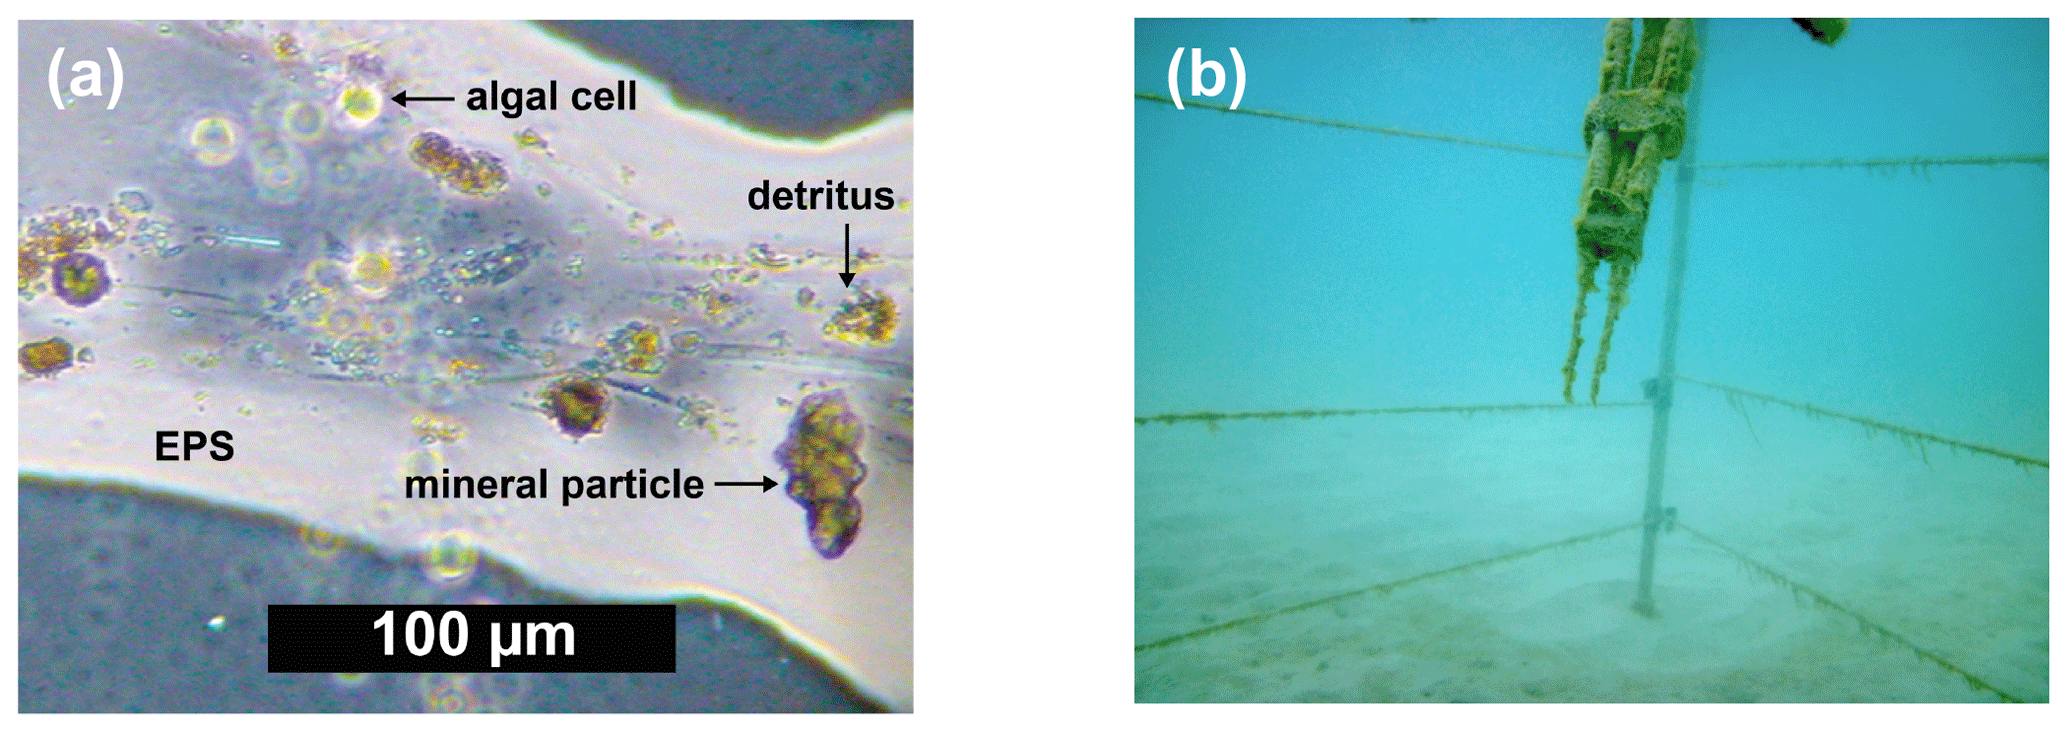
Figure 1(a) Microscopic image of marine snow particle showing organic and inorganic particles embedded in an gelatinous EPS matrix. (b) Close up of optode sensors with biofouling accumulated during a 1-week-long deployment.
While substantial biofouling (Fig. 1b) may be obvious through the changes in signal magnitude and dynamics it causes, minor biofouling is not detectable without a reference. Small deviations in the response time and magnitude of the sensor signal, however, can produce large differences between the measured and true flux (Berg et al., 2015). Some biofouling can be reduced by coating the sensor with antibiotics, but such treatments cannot prevent the adherence of marine snow or detritus particles (Navarro-Villoslada et al., 2001).
With the advantages of being relatively robust compared to microelectrodes and less expensive, optodes are predisposed to become the preferable sensor type for aquatic eddy covariance measurements (Chipman et al., 2012; Berg et al., 2016). The recent development of small, programmable oxygen meters with low power consumption that can read fibre optodes with short response times has made optode technology suitable and accessible for aquatic eddy covariance measurements. The goals of this study were (1) to develop an eddy covariance instrument with dual optodes that through parallel oxygen measurements allows improved quality control of the oxygen data and thereby more reliable oxygen fluxes, (2) to develop a data evaluation procedure for the dual optode eddy covariance data sets that helps in identifying compromised optode signals, and (3) to demonstrate the performance of this instrument through deployment in an inner shelf environment with dynamic changes in sediment–water flux.
2.1 Instrument development
The eddy covariance instrument we developed uses two Pyroscience™ FireSting O2-Mini oxygen meters (specifications listed in Table A1 in Appendix A, now sold in combination with the Pyroscience™ sub-port, FSO2-SUBPORT) that read two ultra-high-speed Pyroscience™ OXR430-UHS retractable oxygen mini-sensors (Table A2 in Appendix A). The FireSting O2-Mini oxygen meters were supplied with the output power of the acoustic Doppler velocimeter (ADV; see below). The measuring principle of the Pyroscience™ fibre optodes is based on an indicator dye responding to orange-red light excitation (610–630 nm) and lifetime detection in the near infrared (NIR, 760–790 nm), which reduces cross-sensitivity and interferences (e.g. due to ambient light or fluorescent substances in the water). The ultra-high-speed OXR430-UHS optodes achieve response times (t90) of 150 to 300 ms (Merikhi et al., 2018) and thus can capture all oxygen fluctuations at the temporal resolution required by the eddy covariance technique (Lorrai et al., 2010; Donis et al., 2015), preventing loss of flux contributions at high turbulence frequencies (McGinnis et al., 2008). The 430 µm diameter optical fibre of these optodes is robust relative to microelectrodes. Our previous field measurements indicated that when operated continuously at a measuring frequency of ∼8 Hz, the useful lifetime of the OXR430-UHS typically was 3 to 7 d before the signal decreased to a level preventing reliable data interpretation (Markus Huettel, unpublished data). The signal drift over this period was negligible (<0.03 %). The optodes for the in situ measurements were selected for similar fast response times (<300 ms) established using the jet-nozzle method introduced by Merikhi et al. (2018). The ADV used for this eddy instrument was a Nortek Vector, which is a single-point current meter capable of measuring velocity and current direction in a small measuring volume (14 mm diameter, 14 mm height, user-specified) at rates up to 64 Hz (Table A3). Together with the current flow measurements, the Vector records pressure and temperature, as well as the compass direction and tilt of the instrument. The internal data logger of the Vector stored the current velocity data simultaneously with the two analogue signals produced by the O2-Mini oxygen meters. The recordings were referenced to Eastern Daylight Time (EDT), which is 4 h behind Coordinated Universal Time (UTC −04:00). All times in this text, graphs and legends thus are presented in EDT. An external battery with a capacity of 200 Wh connected to the Vector provided power for continuous measurements of up to 1 week duration.
The instruments were mounted on a tripod (width 120 cm, height 100 cm; Fig. 2) made of rectangular 304-grade stainless steel tubes (2 cm × 2 cm cross section), with legs consisting of stainless steel rods that were 1.3 cm in diameter with 20 cm diameter base plates. An extension arm held the ADV in the centre of the frame. The underwater housing (AGO Environmental Electronics) containing the oxygen meters with supply voltage regulator (Dimension Engineering) and the external battery pack (4 × Nortek lithium-ion 12 V, 50 Wh) were attached to the horizontal upper bar of the tripod. All electrical cables used Impulse™ wet pluggable micro-inline connectors. The two optodes were linked through two custom-made (Markus Huettel) underwater housing fibre-feed-through plugs with standard ST-connectors to the FireSting O2-Minis. A stainless steel rod (8 mm diameter) with adjustable holders and aligned with the x direction of the ADV, positioned the two optodes parallel to each other and at a 45∘ downward angle. The sensing tips of the optodes were 10 mm apart from each other and located at 30 mm horizontal distance from the lower edge of the ADV measuring volume (Fig. 2b). This distance prevents any disturbance of the flow in the measuring volume of the ADV and any interference with the acoustic pulses of the Vector. A PAR-light sensor (Odyssey® Submersible Photosynthetic Active Radiation Logger) installed above the ADV logged light intensity at 5 min intervals throughout the deployments. An Aanderaa Seaguard RCM multi-sensor probe, installed with its sensors at the same height as the ADV measuring volume at 5 m distance from the tripod, recorded oxygen and temperature reference data.
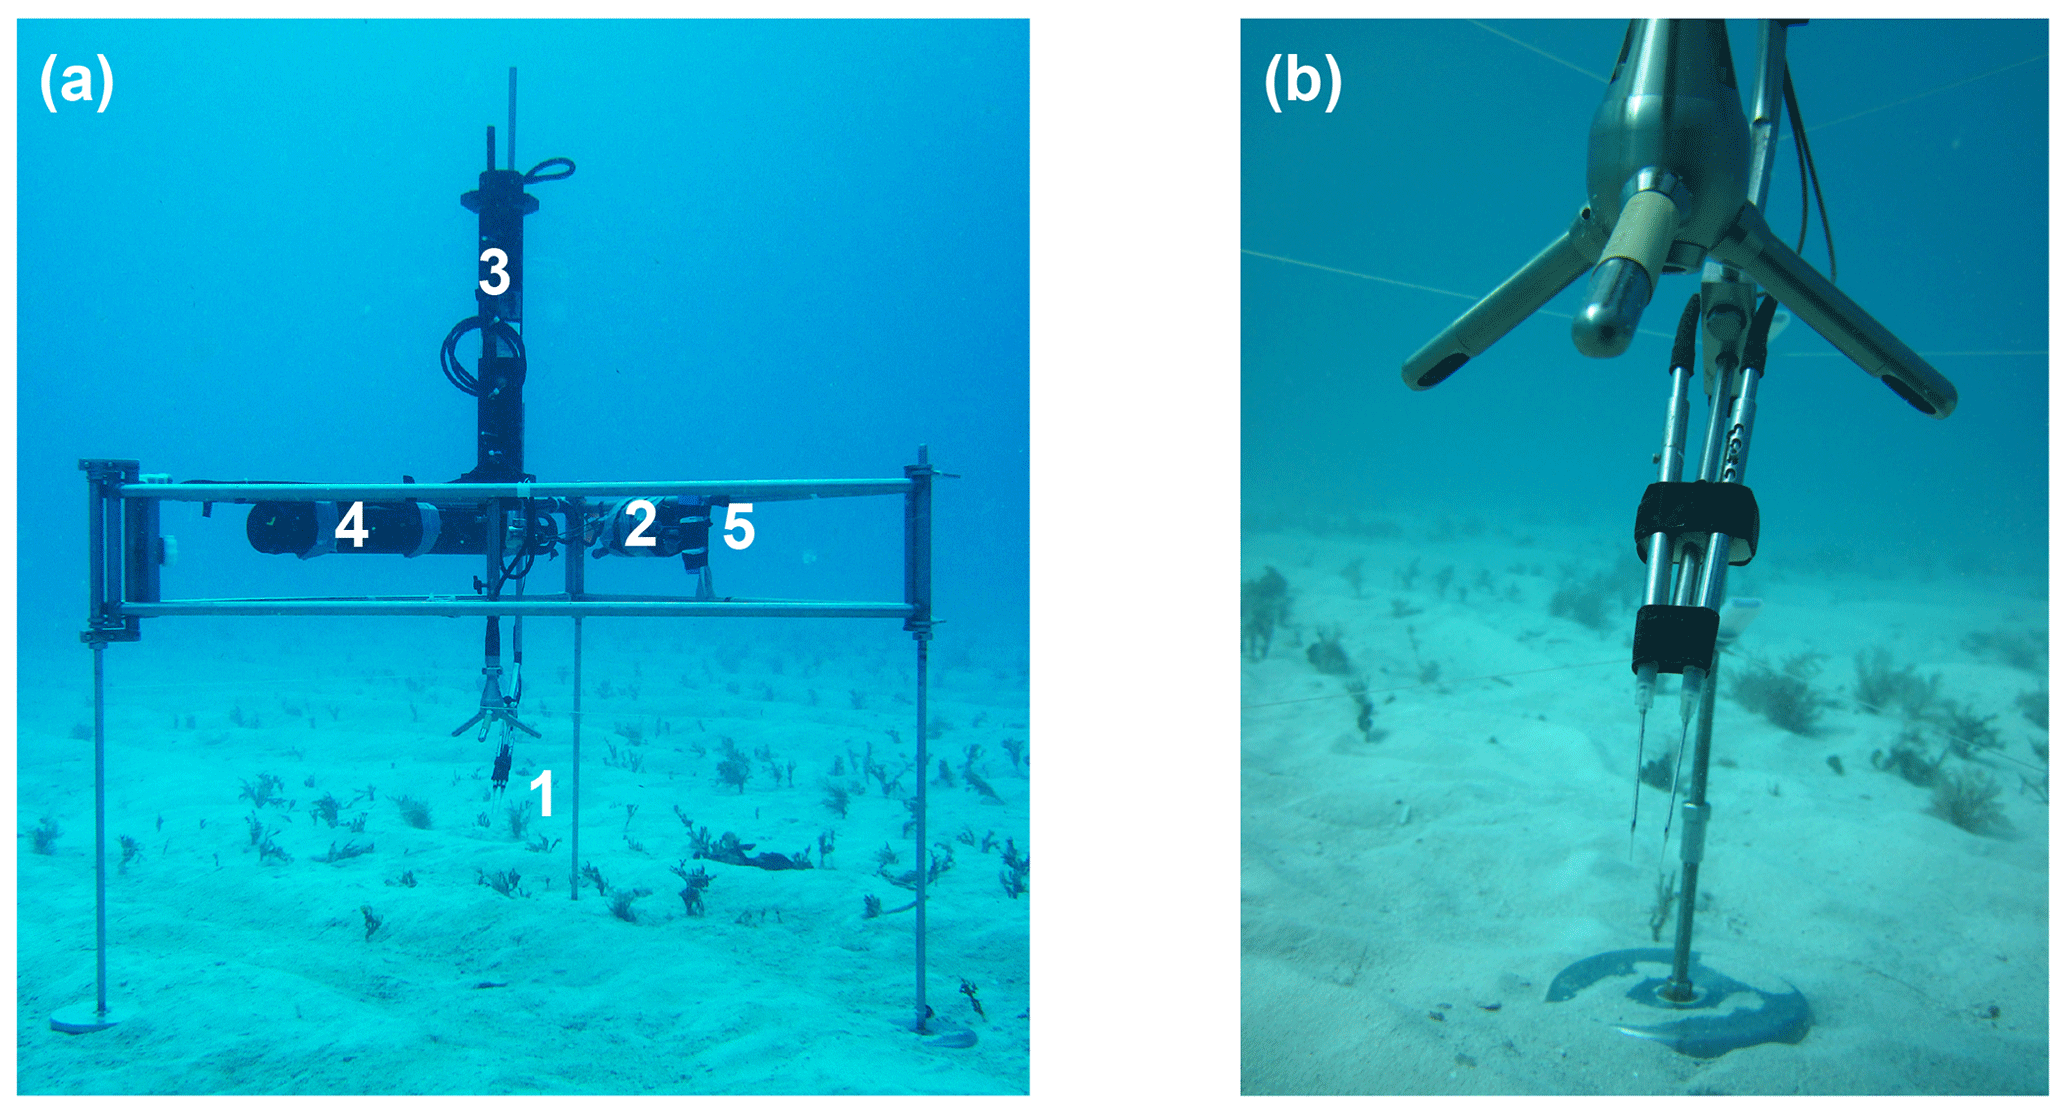
Figure 2(a) The eddy covariance instrument with dual fibre optode sensors at the study site. The tripod carries the optodes (1), underwater housing with oxygen meters reading the optodes (2), acoustic Doppler velocimeter (ADV) (3) battery pack (4), and light logger (5). (b) Close-up of the two optode sensors.
2.2 Field tests
The performance of the dual-optode eddy covariance instrument (2OEC) was tested through three deployments on 14–15 August 2013 (Case C), 16–17 August 2013 (Case A), and 10–11 April 2014 (Case B) in a subtropical inner shelf environment with relatively constant salinity (35–36) and temperatures (April: 25 ∘C ± 0.8 ∘C; August: 30 ∘C ± 0.5 ∘C) approximately 9 km south of Long Key in the Florida Keys (24∘43.52′ N, 80∘49.85′ W). The site was located at 9±1 m water depth near the centre of a large flat carbonate platform covered with coral sand. The unobstructed, fairly steady current flows across the platform and the relatively uniform surface roughness (ripple topography <10 cm) produced similar turbulent diffusivity throughout the deployments. The highly permeable carbonate sand (permeability: . m2) had a median grain size of 440 µm and was inhabited by microphytobenthos (2–6 µg Chl a g−1 sed. dw, sediment dry weight) and sparsely distributed (<20 m−2) Halimeda sp. Macroalgae (Fig. 2a). In the clear water (turbidity <8 NTU, nephelometric turbidity units) light intensities at the seafloor reached up to 300 µE m−2 s−1. The current flow conditions during all deployments were moderate (average mean flow velocity of 5 to 20 cm s−1; significant wave height <0.7 m), and the weather was generally sunny with some scattered clouds. Prior to the deployments, the oxygen optodes were calibrated in ambient seawater (water bubbled with air or with sodium sulfite addition), with the calibration data stored on the Vector logger. The measuring volume of the ADV was adjusted to be ∼35 cm above the sediment–water interface. Scuba divers positioned the instrument at the seafloor such that the Vector's x direction was aligned with the main bottom flow direction, which was in northeast–southwest direction. The instrument was typically deployed in the morning at 09:00–10:00 EDT and retrieved 24 h later. During the first hour after deployment, no flux data were collected to allow temperature adjustment of the instruments. Before downloading the data from the Vector, the calibration of the oxygen sensors was repeated and stored with the data file.
2.3 Data processing
Velocity data with acoustic beam correlations <50 % were replaced through linear interpolation of the neighbouring velocity values. The effect of wave rotation was corrected by rotating flow velocity vectors until SD(uy) and SD(uz) reached a minimum (SD represents 1 standard deviation). Oxygen data were not cleaned or despiked prior to flux calculations. Oxygen fluxes were calculated using the EddyFlux 3.2 software package (Peter Berg, unpublished) as follows. Vertical velocity data and oxygen concentration data were reduced from 64 Hz to 8 Hz through averaging, which lessened data noise while maintaining sufficient resolution for resolving high-frequency eddies. The fluctuating component of the oxygen concentrations was determined through Reynolds decomposition, i.e. oxygen base concentrations were determined for 15 min intervals through linear detrending and subtracted from the instantaneous oxygen data to arrive at the instantaneous oxygen fluctuations O2′. Instantaneous vertical velocity changes Vz′ were determined through Reynolds decomposition analogous to the oxygen fluctuations. The time lag caused by the 30 mm horizontal distance between flow and oxygen measurement locations were corrected according to Berg et al. (2015) through applying time shift corrections that yielded the most negative (night) or most positive (day) cross-correlations of the oxygen fluctuation and vertical movement. Oxygen fluxes then were calculated by averaging the product of instantaneous oxygen fluctuation and instantaneous vertical velocity change over time: O (Berg et al., 2003). At our measuring height of 35 cm above the seafloor, the diurnal fluctuation in mean water column oxygen concentration can result in substantial changes in the oxygen inventory of the water column below the measuring volume, which can bias the local eddy flux measurements. To correct for this effect, an oxygen storage term, calculated as dC∕ dth, was subtracted from the measured eddy flux to determine the benthic oxygen flux (dC∕ dt = change of the average oxygen concentration over time, calculated through linear detrending of the measured oxygen data over 15 min intervals; h= height of the measuring volume) (Rheuban et al., 2014b). Acceleration or deceleration of current flows can alter the oxygen concentration profile and thereby modulate vertical flux (Holtappels et al., 2013). Our measurements indicated that the temporal flux variations caused by transient velocity changes largely cancelled out over time (Rheuban et al., 2014b), and a correction for transient velocity changes was not applied. For the comparison of the temporal evolution of the fluxes that were determined using the recordings of the two optodes, we calculated the cumulative fluxes over the duration of the deployments. The slopes of the increasing cumulative fluxes during daylight and decreasing cumulative fluxes during night-time were assessed for hourly time intervals. Standard deviations of the fluxes reflect the deviations between three separate slope determinations. All error estimates are reported as ±1 standard deviation.
2.4 Advection chamber deployments
In August 2013, three advection chambers were deployed parallel to the eddy covariance instrument to allow comparison with an independent flux data set produced by a different method. Benthic advection chambers present an in situ incubation technique that can account for some of the current and light effects influencing benthic flux (Janssen et al., 2005a; Huettel and Gust, 1992b). The rotation of a stirring disc (15 cm diameter) within these cylindrical chambers (30 cm height, 19 cm inner diameter) produces a radial pressure gradient at the surface of the enclosed sediment that is similar in magnitude to the pressure gradient generated by bottom currents interacting with present ripple topography (Huettel and Rusch, 2000). For the deployments at our study site, the pressure gradient in the chambers was set to 0.2 Pa cm−1, corresponding to the gradient produced by a 10 cm s−1 bottom flow deflected by a ripple of 7 cm height (Huettel and Gust, 1992a). In highly permeable sediments, the pressure gradient in the chamber causes pore water flow through the surface layer of the enclosed sediment, thereby mimicking the pore water exchange occurring in the surrounding rippled seabed. The transparent chamber and stirring disc allow penetration of light to the enclosed sediment (∼10 % loss in PAR through light attenuation caused by the acrylic), permitting benthic photosynthesis in the chamber. The acrylic cylinder of the chambers was pushed 12 cm into the sand sediment, resulting in a chamber water volume of 5 L. A Hach Rigid O2 optode mounted in the chamber lid collected oxygen concentrations at 15 min time intervals. The fluxes were calculated from the changes of the oxygen concentration in the water column of the chamber over time. Chamber incubations ran for 24 h, after which the lid was opened to allow re-equilibration with the ambient water before starting the next measurement cycle. Although flow, light, and water composition changes within the chamber are not identical to the external conditions and cause an inherent bias, the daily fluxes measured by these chambers are considered to be close (within a factor ∼2) to the true fluxes (DeBeer et al., 2005; Cook et al., 2007; Janssen et al., 2005a), and this technique has been deployed successfully in numerous investigations of shallow permeable sediments (e.g. Huettel and Gust, 1992b; Eyre et al., 2013, 2018; Glud, 2008; Cyronak et al., 2013; Santos et al., 2011; Janssen et al., 2005b).
3.1 Instrument deployments
The 2OEC improves the reliability of measured fluxes. The deployment of 16–17 August 2013 (Case A, Fig. 3) was characterized by moderate bottom currents averaging 3.6±2.2 cm s−1 (35 cm above sediment) with sustained peak velocities of 8.0 cm s−1 (Fig. 3a) and relatively low light intensities at the seafloor <100 µE m−2 s−1 during daytime hours (Fig. 3e). The good agreement of the independent O2 readings of both fibre optodes and the Seaguard reference optode (Fig. 3b) implied that the optodes maintained their calibration throughout the deployment. Identical corrections were applied to P and Q optode data sets when calculating fluxes (Fig. 3c), which included corrections for change in average water oxygen concentration, time lag, and wave rotation. The conformity of the 15 min cumulative fluxes calculated from the two fibre optode signals (Fig. 3d) and the agreement of the cumulative flux curves over the time course of the deployment (Fig. 3e) corroborated the flux estimates. The flux increase during daylight and decrease during night-time could be represented well by linear regression (R2>0.9). The slopes of the cumulative flux curves over the time course of the deployment (Fig. 3e) revealed daytime fluxes of 3.4±0.6 (P) and 3.4 ±0.4 mmol m−2 h−1 (Q) and night-time fluxes of (P) and mmol m−2 h−1 (Q). The close agreement between the fluxes calculated from the two optode signals supported an average daytime flux of 3.4±0.7 (P, Q) and night-time flux of mmol m−2 h−1 (P, Q) for Case A.
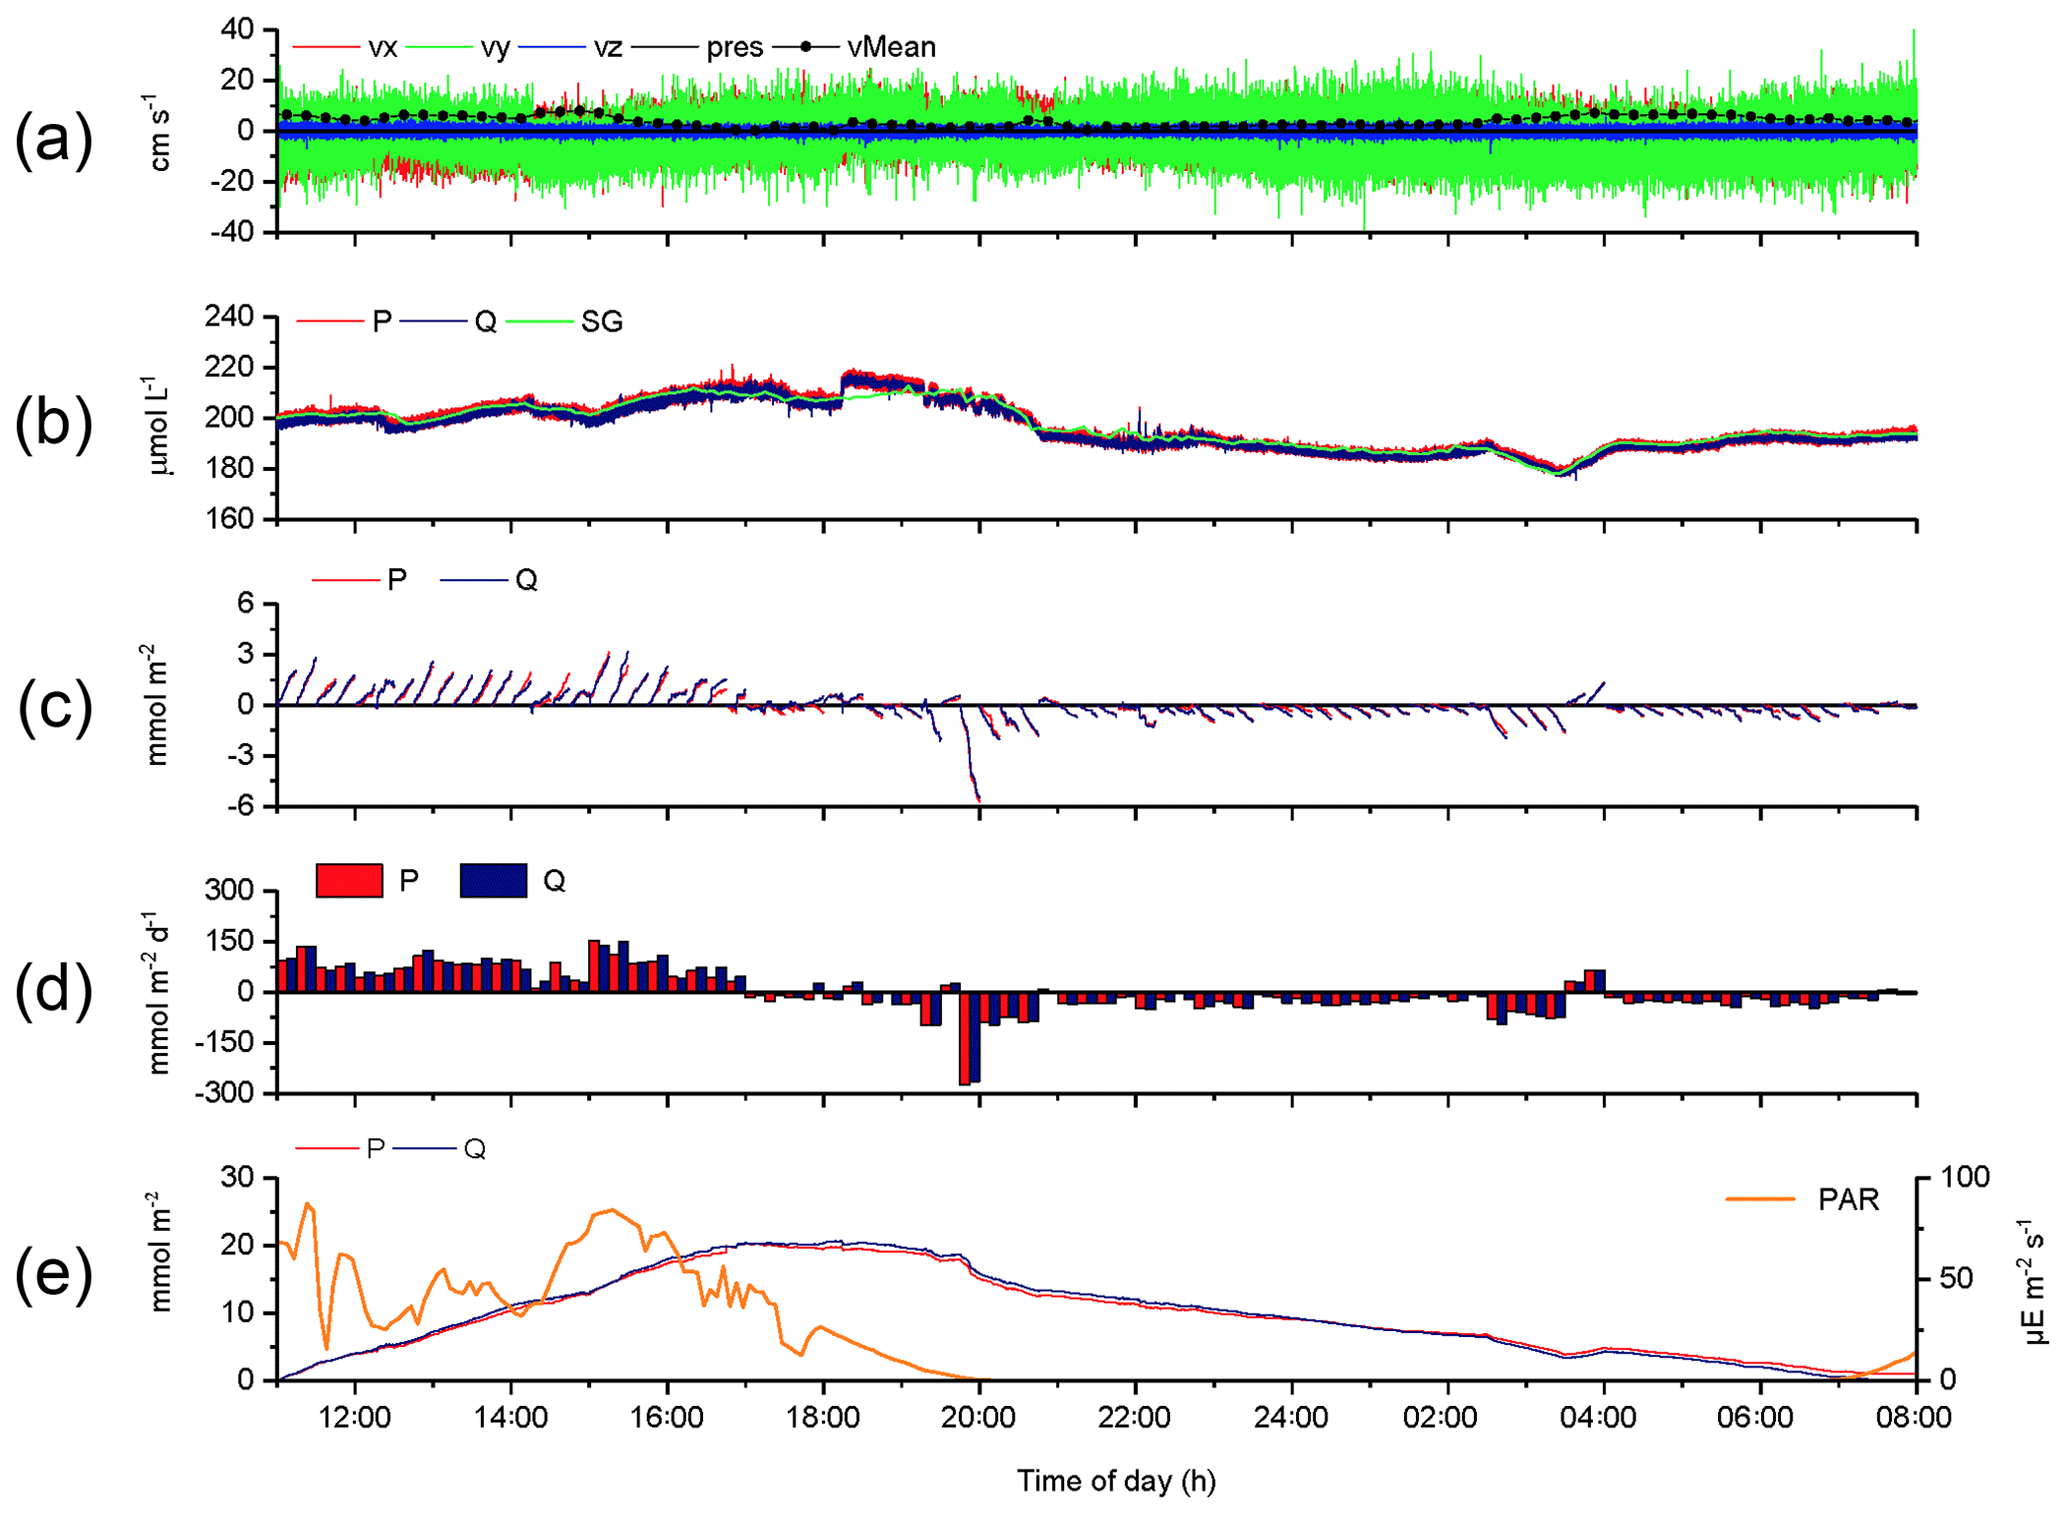
Figure 3Case A, 2OEC deployment of 16–17 August 2013. (a) Horizontal x (red) and y (green) and vertical z (blue) bottom flow components and mean current velocity (black circles). (b) Oxygen concentrations measured by the two optodes P (red) and Q (blue) and the Seaguard planar optode (green). (c) Time-lag-, wave-rotation- and storage-corrected cumulative fluxes plotted for 15 min intervals. (d) Average 15 min fluxes, (e) cumulative fluxes, and PAR light intensity at the seafloor (orange line). Graphs produced with Origin® 2017 (OriginLab) software.
Analysis of the differences between optode P- and optode Q-based fluxes indicated that changes in environmental settings and changes in optode characteristics produced the discrepancies. In general, differences between the P and Q 15 min fluxes were larger during daytime than nighttime, or when changing direction at sunset, as well as when fluxes were near zero (Fig. 4a). Patchy distribution of microphytobenthos and their photosynthetic oxygen production may result in a more uneven oxygen distribution in the bottom currents during daytime (Bartoli et al., 2003; Jesus et al., 2005; MacIntyre et al., 1996). Likewise, the patchy distribution of macrofauna and its activity peak near sunset (Wenzhofer and Glud, 2004) may be responsible for enhanced heterogeneity in the oxygen distribution in the bottom currents and could enhance differences between the parallel-measured fluxes at sunset. Figure 4b–f depict the effects of the corrections that were equally applied to optode P and Q data sets to account for changes in environmental parameters and time lag error when calculating the respective fluxes. Corrections for instrument tilt were not required for our three deployments, and rotating the average flow velocity Vectors did not produce significant changes in the fluxes. During the first 4 h of the deployment, the raw, unprocessed cumulative fluxes (no corrections applied) derived from both optode signals were nearly identical before differences increased (Fig. 4b). Correction for temporal change in the average water oxygen concentration (Fig. 4c) led to slight rate increases in the cumulative fluxes during the day and night. The correction for time lag between current flow and oxygen signal mostly had an effect during the last 7 h of the deployment (Fig. 4d), possibly due to a minor growth of biofilm on the optodes. Correction for wave rotation caused a small rate increase in fluxes, which was more pronounced during night-time (Fig. 4e). Simultaneous application of the above corrections resulted in a nearly perfect agreement between the cumulative fluxes calculated from the two optode signals (Fig. 4f). Temporal flux variations caused by transient velocity changes did not have a significant impact on the cumulative flux as indicated by the good agreement between the fluxes derived from the eddy covariance measurements and those recorded in parallel benthic advection chamber measurements as reported below.
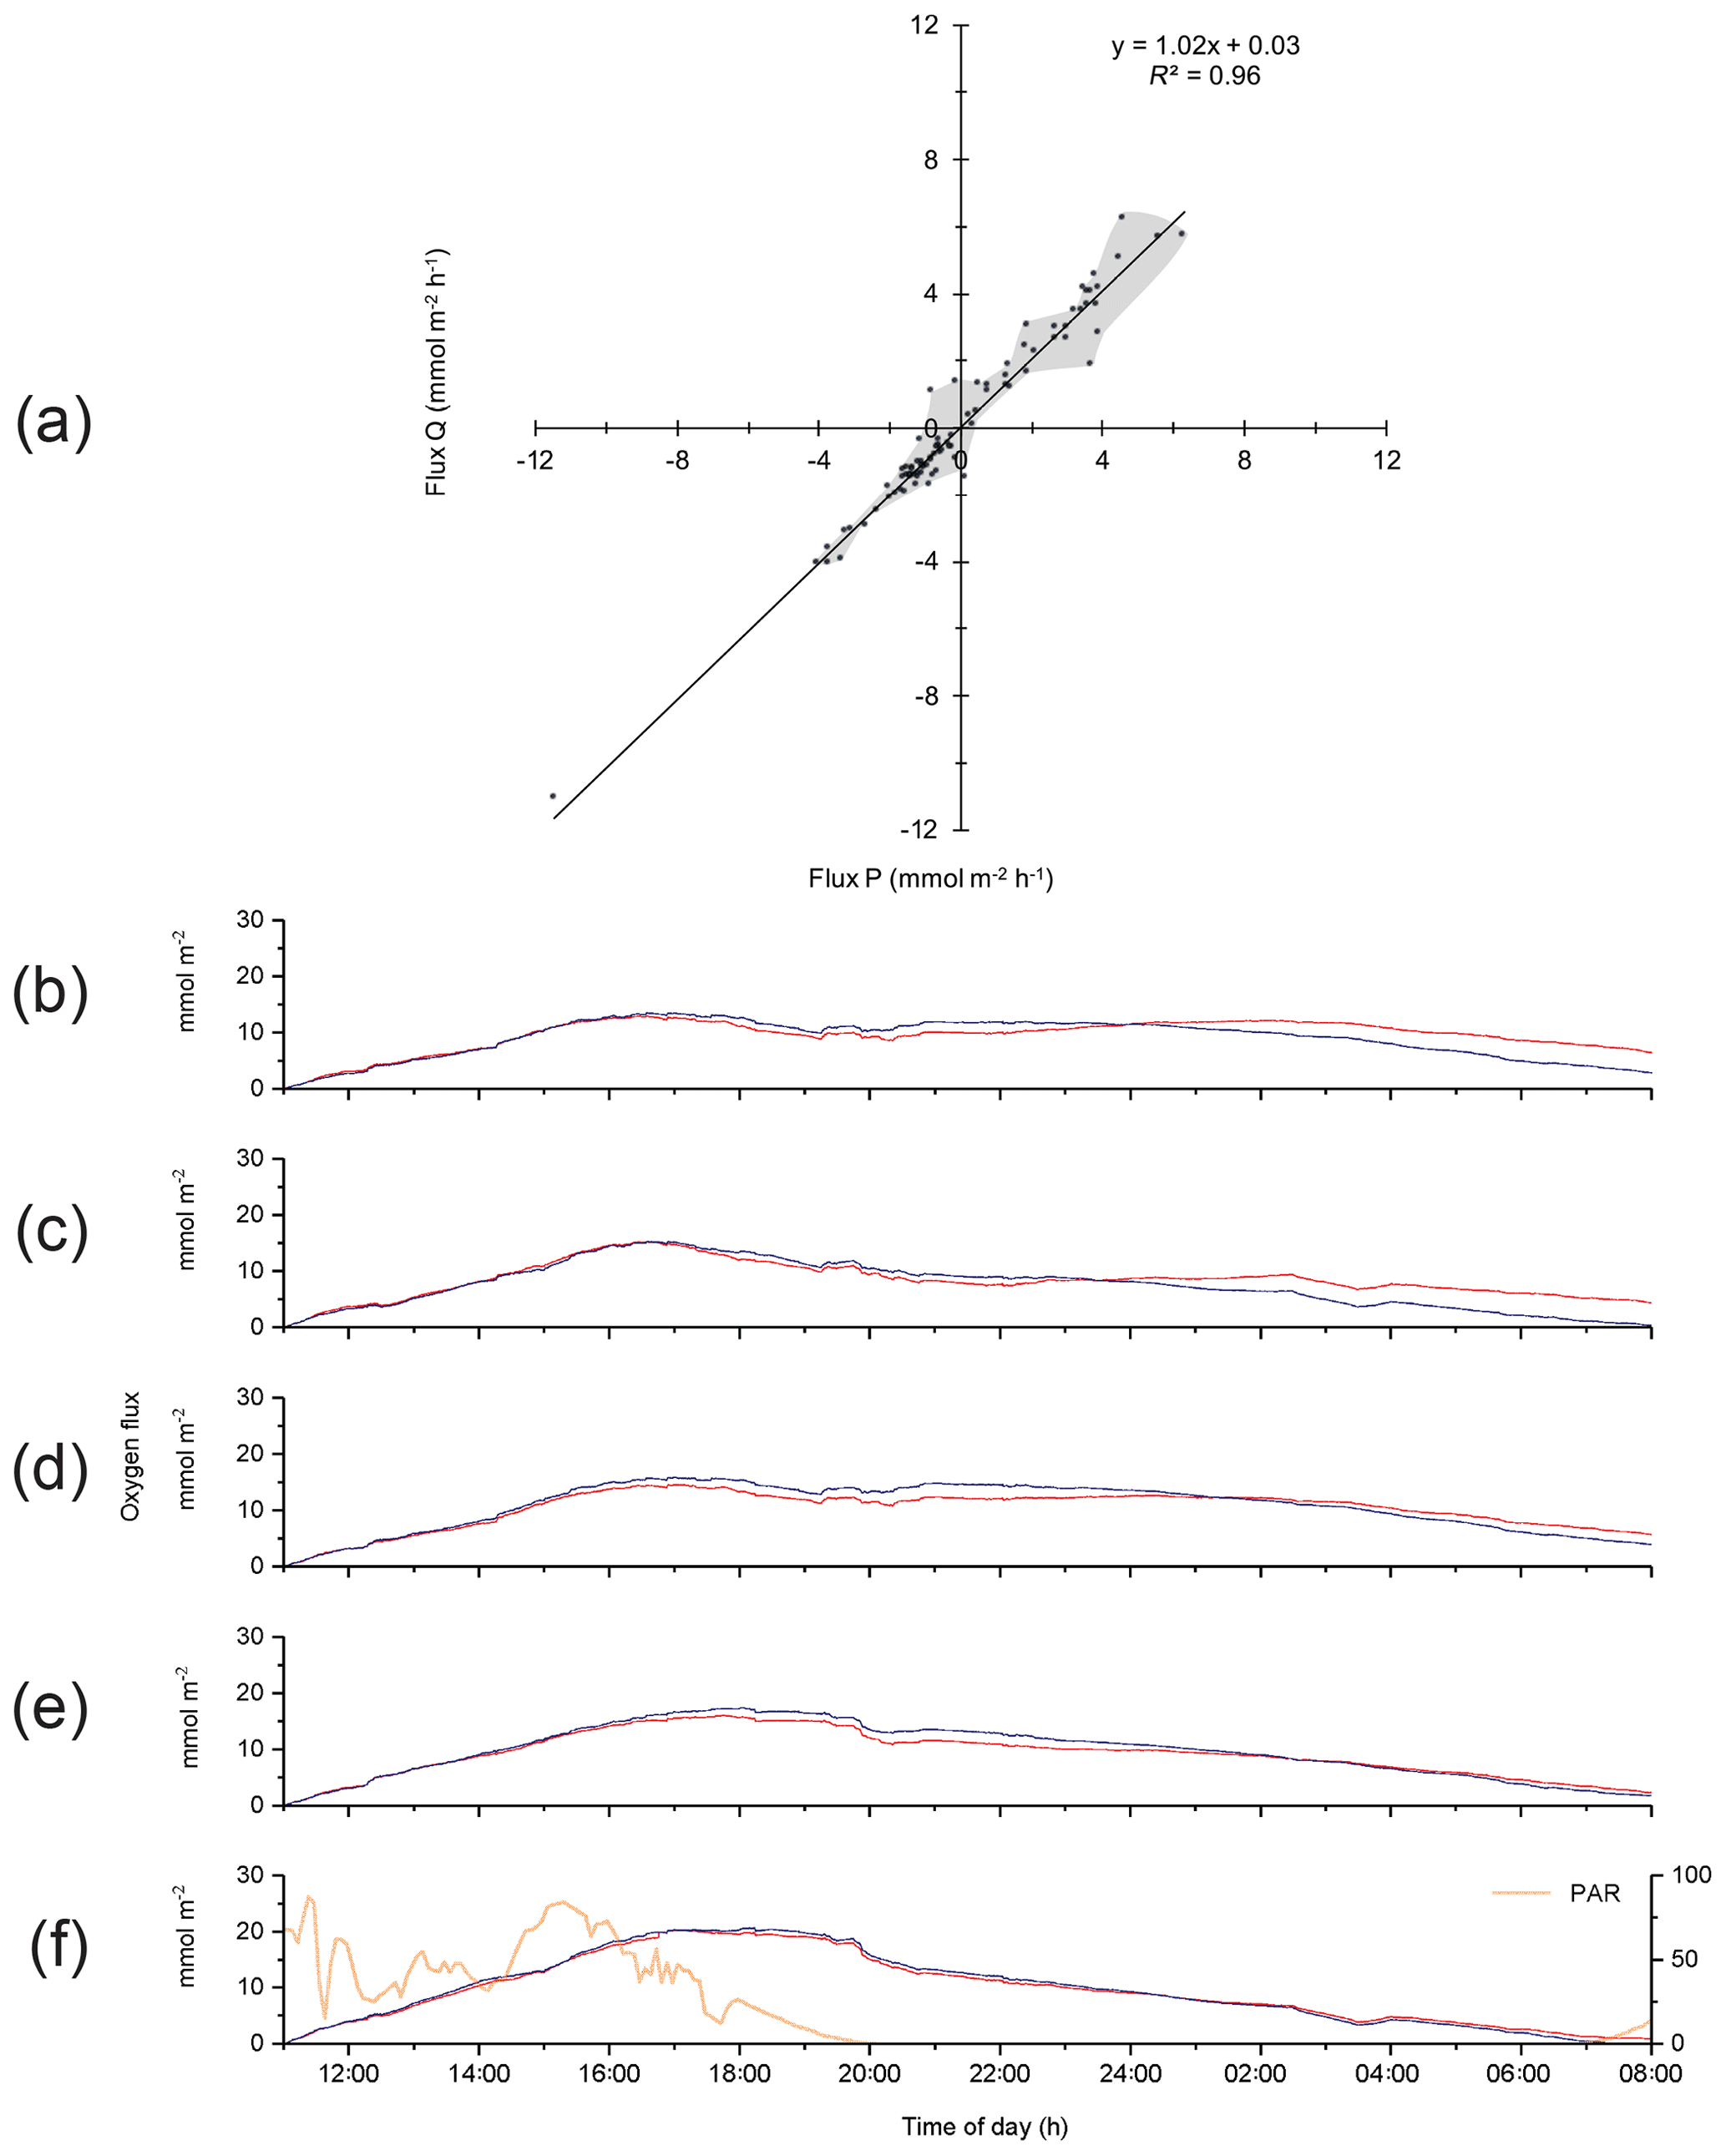
Figure 4(a) Comparison between the 15 min fluxes based on optode P and Q signals for Case A. Grey shading depicts the envelope of the measured fluxes except the extreme value at −11.5, −11.0 mmol m−2 h−1. (b)–(f) Effects of the corrections applied to the flux calculations on cumulative flux: (b) cumulative fluxes calculated from the two optode signals without any correction (raw data); (c) correction for temporal changes in the average water oxygen concentration; (d) time lag correction; (e) correction for wave rotation; and (f) all corrections used in (c), (d), and (e) applied together, with the change in PAR light over time shown.
The parallel optode measurements confirmed short-term changes, e.g. the concentration step in the oxygen record at 18:14 EDT (Fig. 3b) caused by the change of the tide (high tide: 18:16 EDT) and associated change in flow direction. The slower Seaguard oxygen sensor did not pick up this abrupt step. The temporarily increased benthic oxygen consumption near 20:00 EDT, coinciding with sunset, may have resulted from decomposition of highly degradable photosynthesis products accumulating in the sediment during daytime (Koopmans et al., 2020) and the aforementioned activity burst of the macrofauna at sunset (Wenzhofer and Glud, 2004). The parallel measurements also confirmed transient flux changes, e.g. a ∼30 min period of reduced light after 14:00 EDT temporarily lowered fluxes by ∼45 mmol m−2 d−1. The ∼90 min O2 concentration and flux dip at 02:45–04:15 EDT was caused by a reversing shift in the main flow direction (), which changed the origin of the water reaching the sensors and thereby the footprint area interrogated by the instrument (Berg et al., 2007). A correlation between 15 min O2 fluxes and average water O2 concentration changes (up to −0.16 mmol m−2 h−1/mmol−1 L−1 h−1) supported that transient O2 changes had to be corrected for when calculating the benthic flux. The weak correlation between 15 min O2 fluxes and short-term mean current flow changes (−0.03 mmol m−2 h−1/cm−1 s−1 h−1) indicated that transient current changes had a relatively small effect on the calculated flux.
The 2OEC allows for detection of compromised flux data. During the deployment in April 2014 (Case B, Fig. 5), bottom currents were higher compared to Case A, averaging 8.4±2.8 cm s−1 with sustained peak velocities reaching 16 cm s−1 (Fig. 5a). In this deployment, the Seaguard instrument was installed at a greater distance (∼10 m) from the eddy covariance instrument, resulting in larger discrepancies between the signals of the fibre optodes and the planar optode of the Seaguard instrument; nevertheless, the Seaguard data confirmed the magnitude and main trends of the fibre optode O2 concentrations (Fig. 5b). At 4 h into the deployment, the signals of optode P started to deviate from those of optode Q, culminating in maximum differences in the respective 15 min fluxes at 17:00–17:15 EDT (Fig. 5c, d). A comparison of the cumulative cospectra for that period (Fig. 6) indicated that the P optode may have been compromised through attachment of a marine snow particle containing O2-producing organisms. The steeper increase of the P optode 17:00 EDT curve (Fig. 6) at the dominant wave frequency (0.2–0.3 Hz) suggested that wave orbital motion enhanced the flux, possibly by producing oscillating movement of the particle attached to the sensor tip. After 18:00 EDT, the cumulative fluxes based on P and Q signals agreed again (Fig. 5e), suggesting that the particle was washed off the sensor. After excluding the compromised data collected between 14:00 and 18:00 EDT, the fluxes calculated based on the two optode signals agreed well: daytime: 3.4±0.6 (P) and 3.3±0.3 mmol m−2 h−1 (Q); night-time (P) and mmol m−2 h−1 (Q); daytime average 3.3±0.7 mmol m−2 h−1 (P, Q); night-time average mmol m−2 h−1 (P, Q).
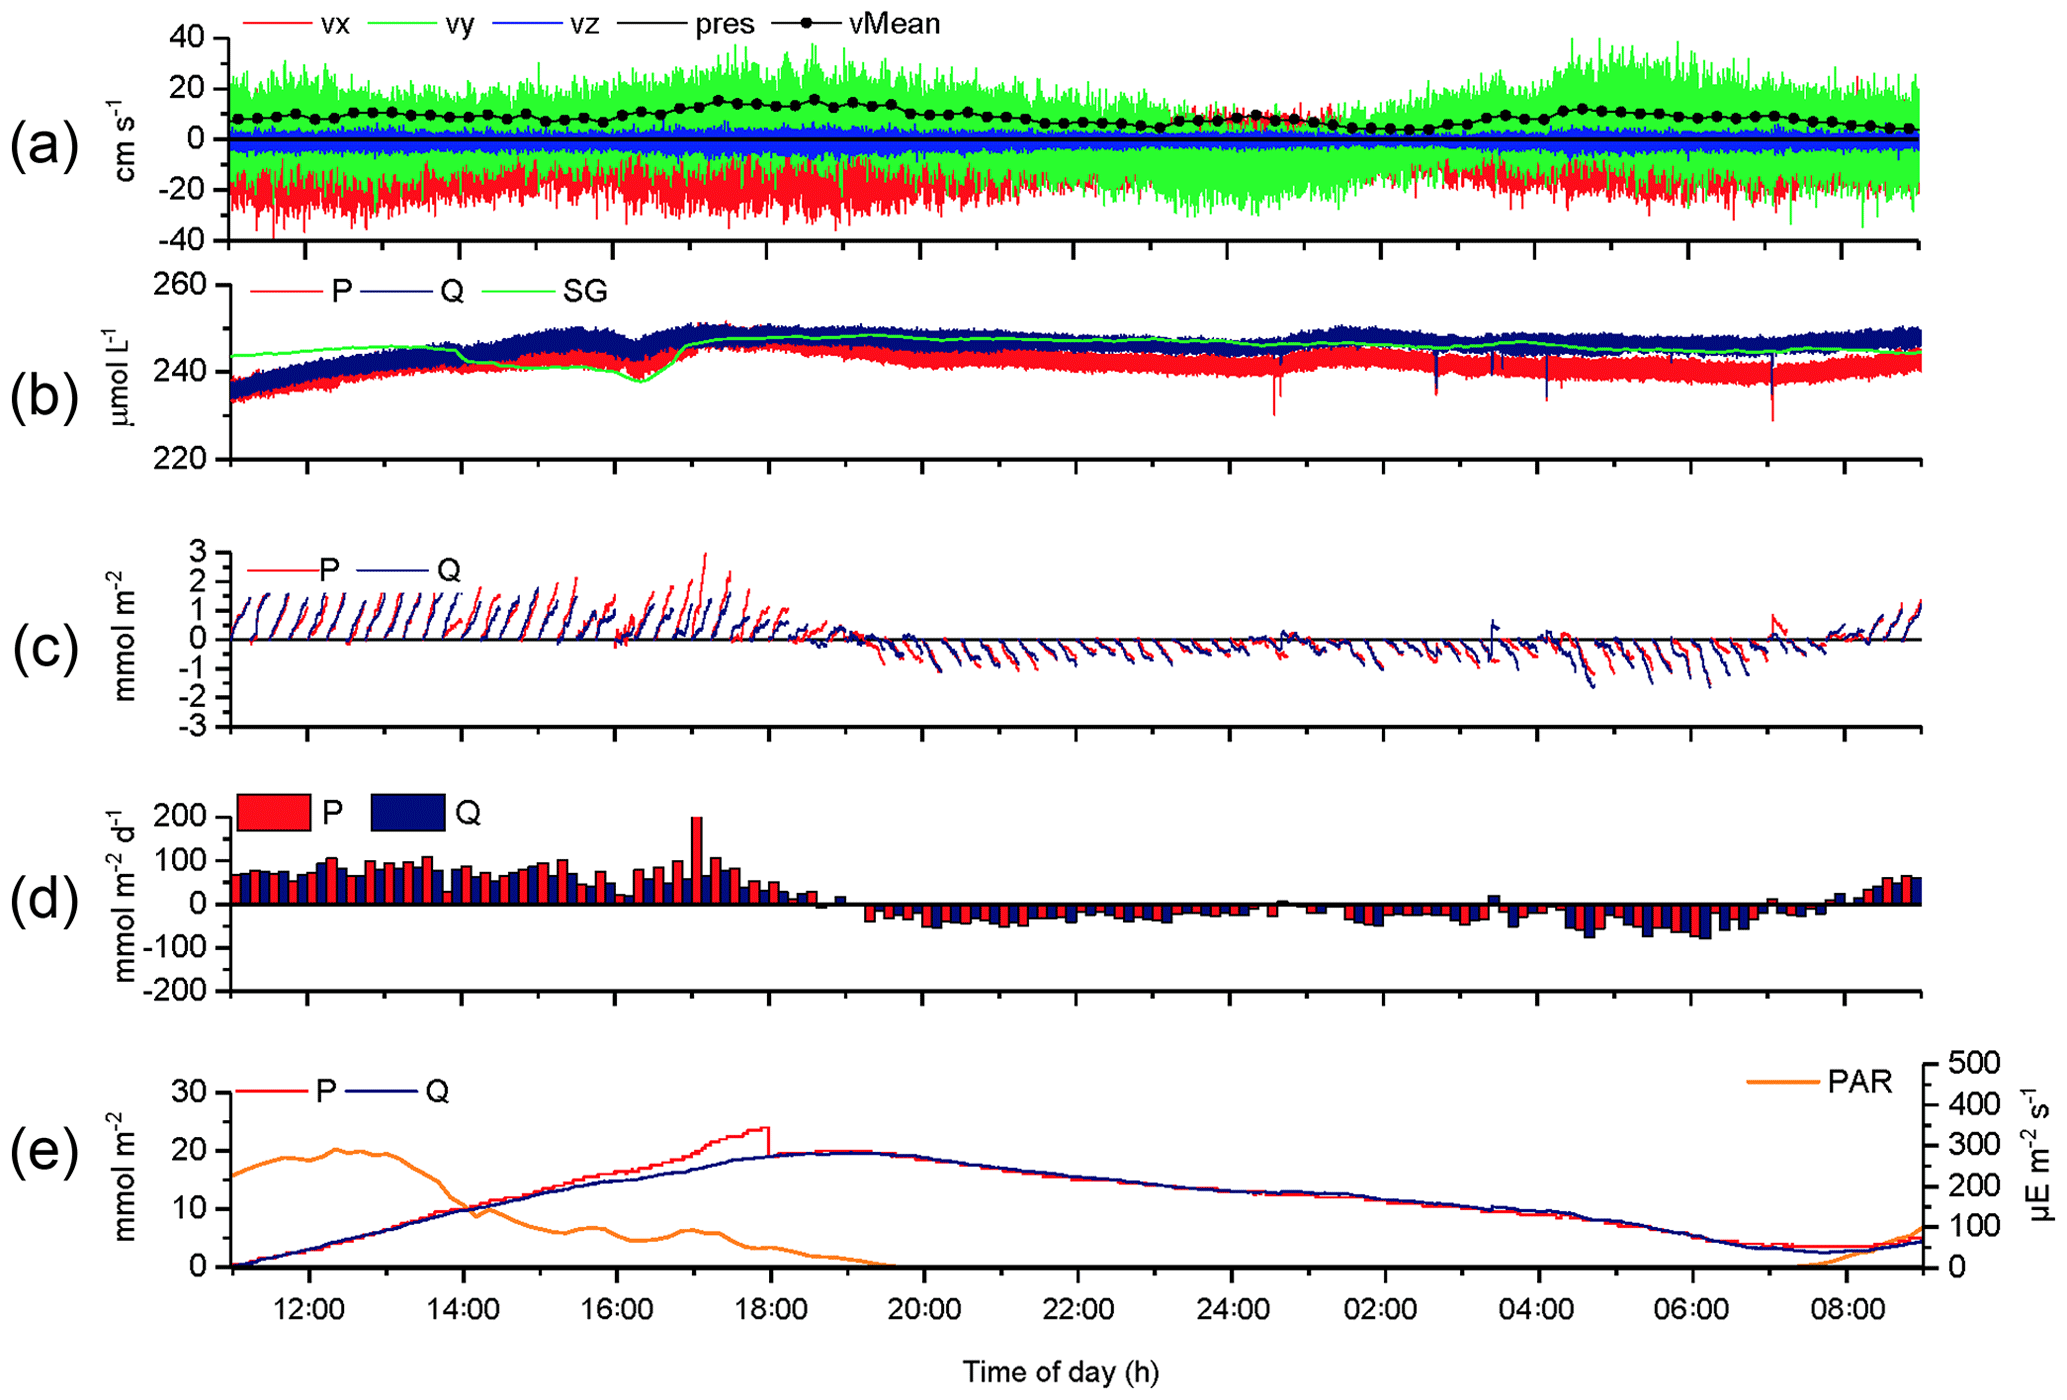
Figure 5Case B, 2OEC deployment of 10–11 April 2014. Between 15:00 and 18:00 EDT, optode P was compromised (likely by marine snow attachment), and this phase was excluded from the calculations for average daytime and night-time fluxes. P cumulative flux at 18:00 EDT was intentionally reduced by 5 mmol m−2 to allow for comparison of the two cumulative fluxes based on P and Q data (e). For further explanation of the panels, see Fig. 3.
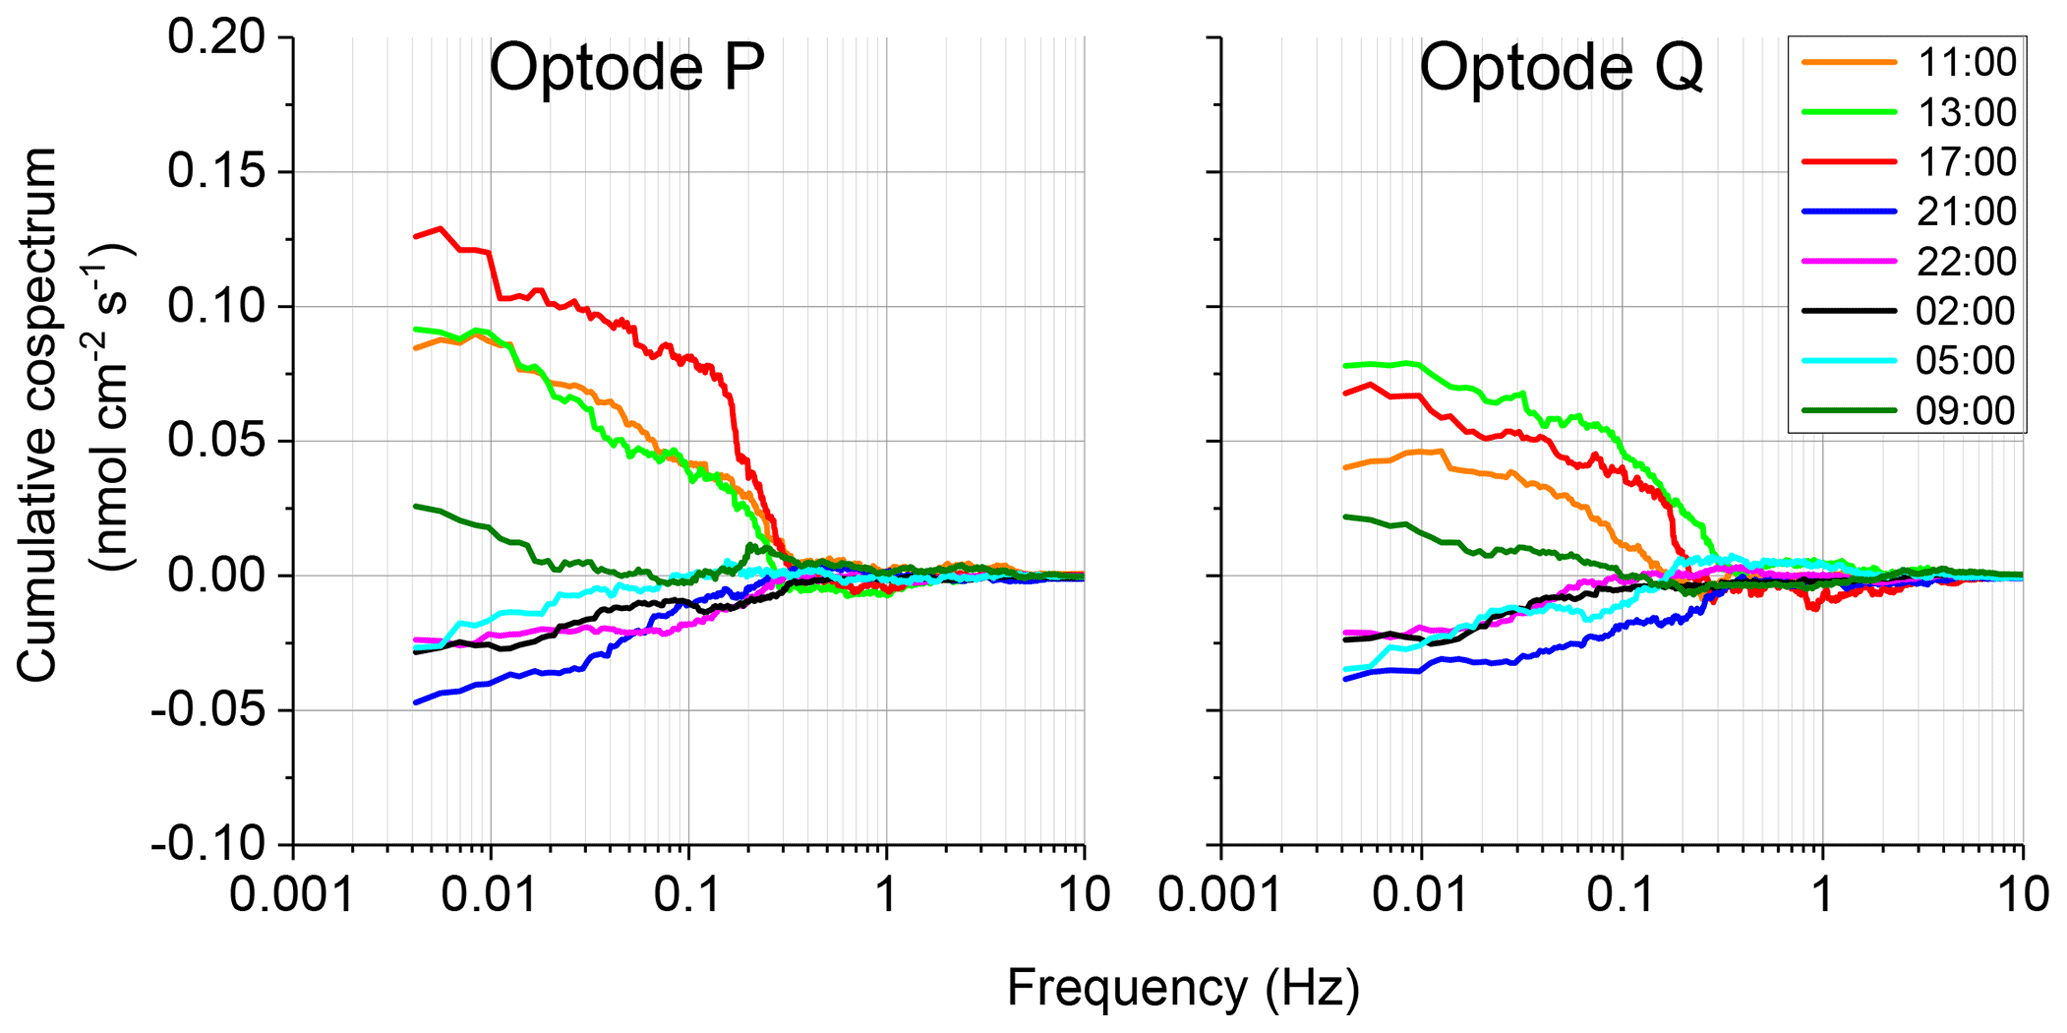
Figure 6Case B, 10–11 April 2014 2OEC deployment. Comparison of the cospectra for the two optodes P, Q at 17:00 EDT revealed a steeper slope at the wave frequency 0.2–0.3 Hz. Cospectra processed using the SpectraVer1.2 software (Peter Berg, unpublished).
The 2OEC can reduce data loss, as exemplified by the Case C (Fig. 7, 14–15 August 2013 deployment, bottom currents 5.8±3.1 cm s−1). Although the oxygen concentrations recorded by the 2OEC and the Seaguard optodes agreed during the deployment (Fig. 7b), optode P was compromised over extended time periods likely due to a particle caught by the sensor. After almost identical fluxes during the first hour (P: 4.0±0.4; Q: 4.1±0.3 mmol m−2 h−1; Fig. 7e), the cumulative optode P flux decreased relative to the optode Q-based flux, despite ongoing benthic photosynthetic oxygen production. This decline in P cumulative flux levelled out at 20:00 EDT and remained steady until 22:00 EDT before the trajectories of the two cumulative fluxes matched again. The following good agreement between P and Q cumulative fluxes between 22:00 and 05:00 EDT (P: ; Q: mmol m−2 h−1; Fig. 7e) indicated that sensor P resumed normal operation. Such a sensor recovery can be observed when water currents remove particles that had attached to the sensor disturbing its signal. The identification of the drop in cumulative P flux as an artefact was supported by the comparison with sensor Q, which produced the typical circadian cumulative flux pattern with a steady increase during the light phase until sunset and decrease thereafter throughout the dark phase. After 05:00 EDT, still during dark conditions, the increase in cumulative P flux and divergence from the cumulative Q flux suggested that sensor P then lost its calibration, which occurs when the sensor loses some of the dye coating that produces the signal (e.g. through particle impact). The temporary good agreement of the cumulative fluxes based on P and Q optode readings permitted salvaging sections of the flux record and thereby allowed at least rough estimates for daytime and night-time fluxes for this deployment. (daytime: 4.3±2.6 mmol m−2 h−1; night-time: mmol m−2 h−1; Fig. 7d). The parallel chamber deployments supported these estimates.
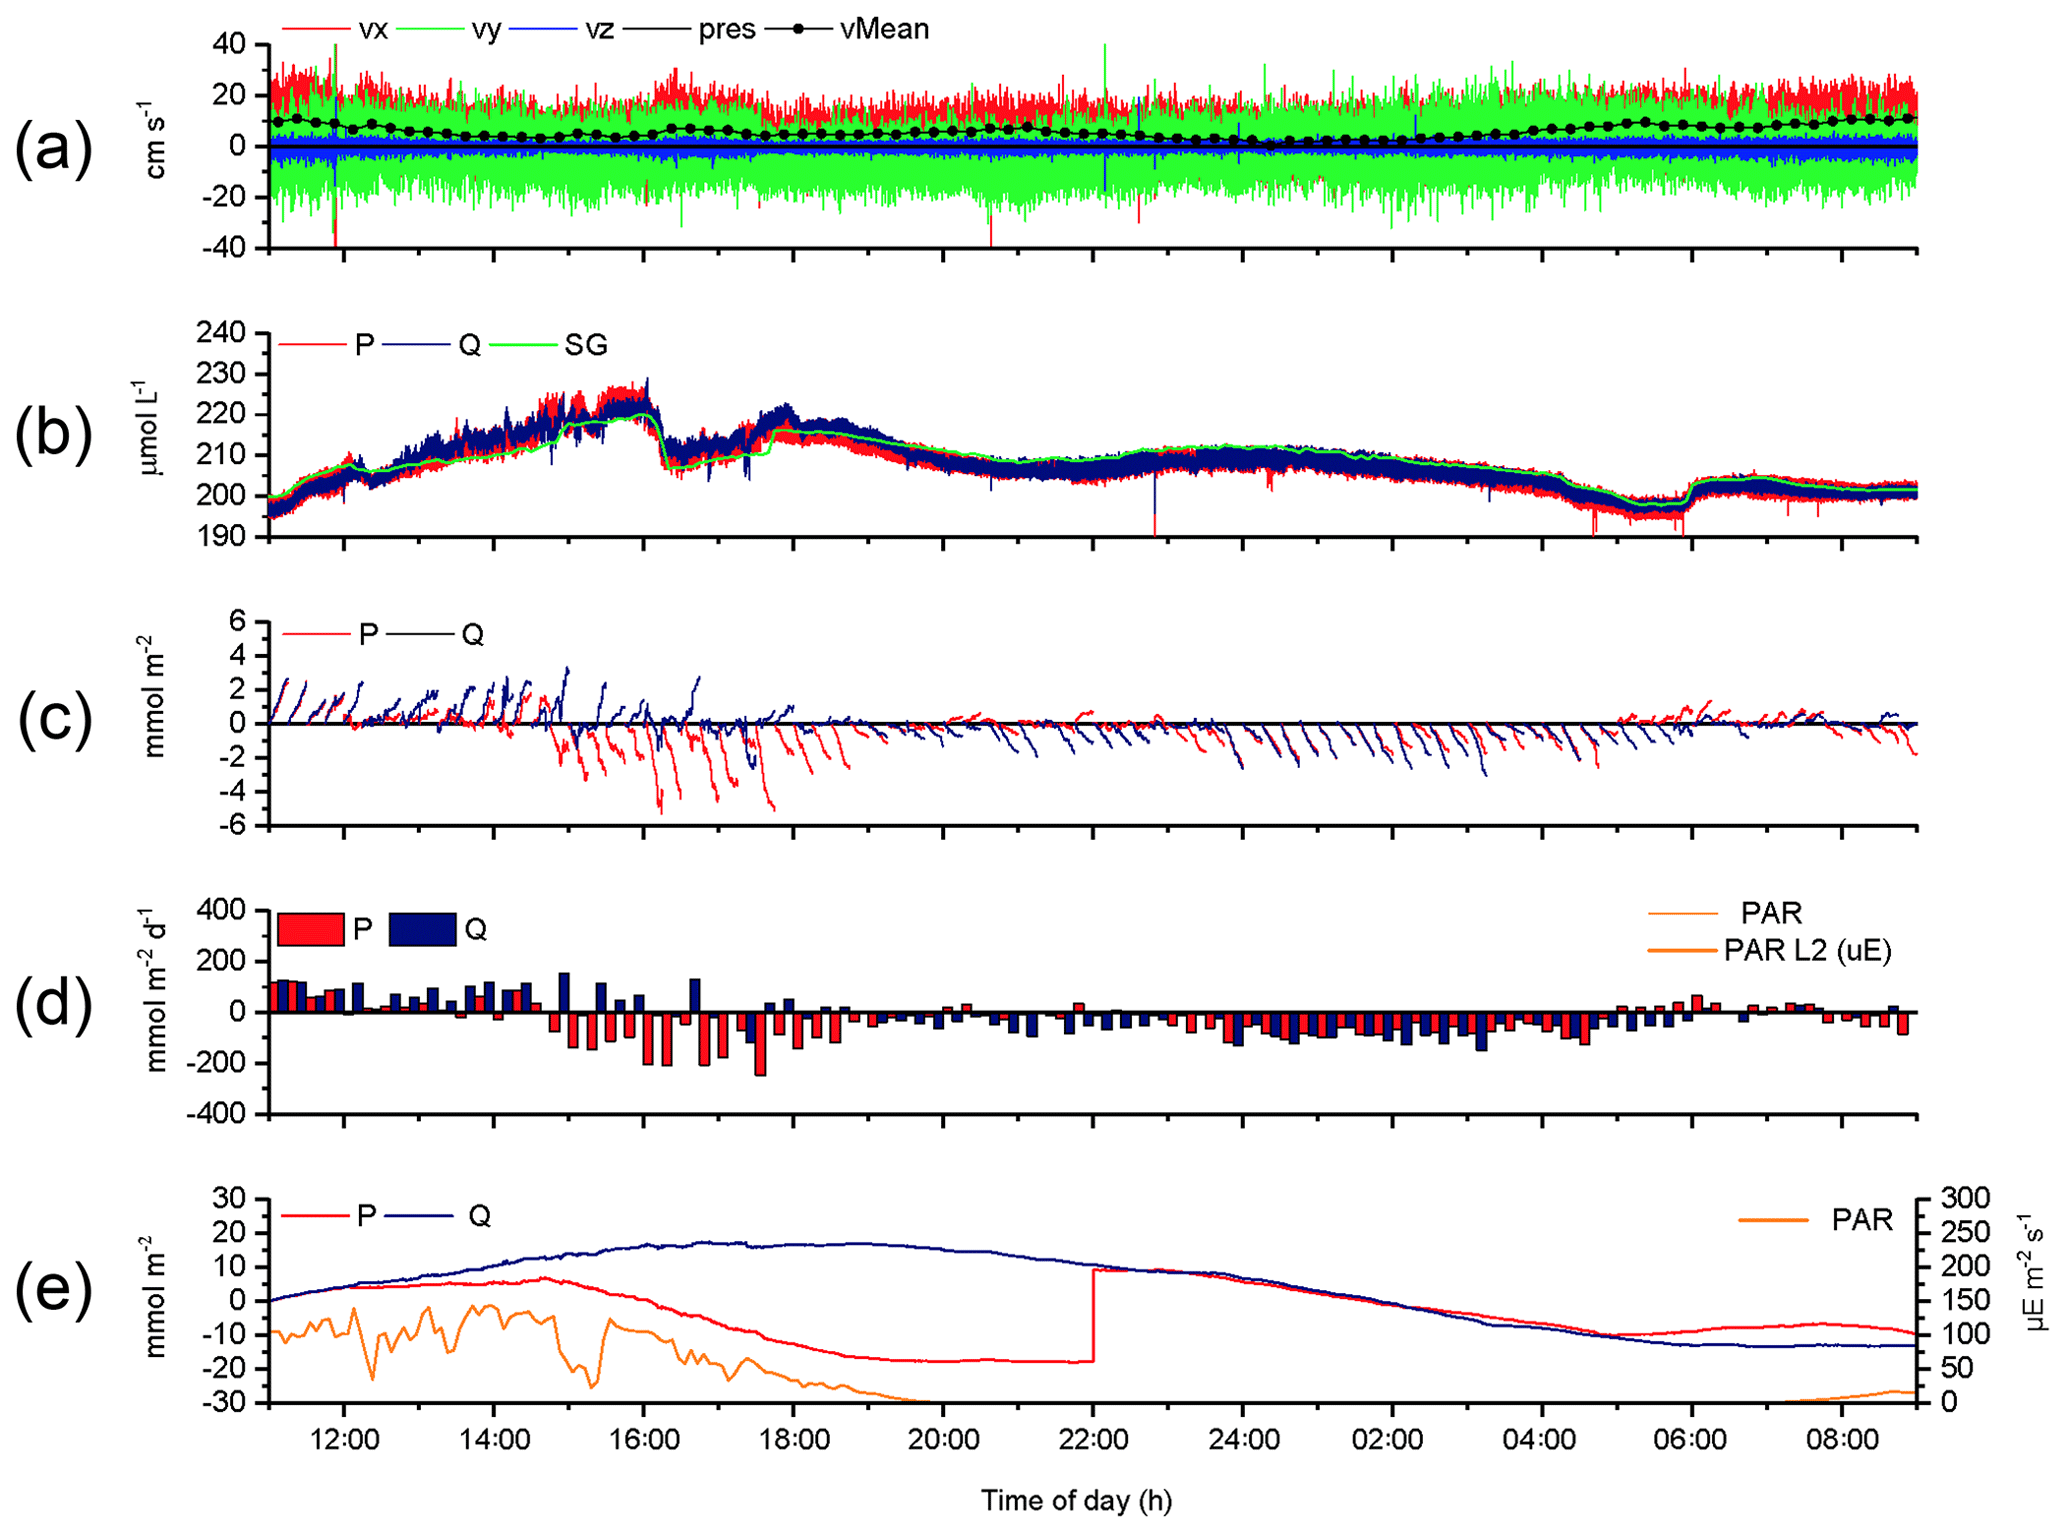
Figure 7Case C, 2OEC deployment of 14–15 August 2013. Between 12:00 and 22:00 EDT, optode P was compromised (likely by particle attachment). This also occurred between 05:00 and 09:00 EDT (loss of calibration). These phases were excluded from the calculations for average daytime and night-time fluxes. P cumulative flux at 22:00 EDT was intentionally increased by 27 mmol m−2 to allow for comparison of the two cumulative fluxes based on P and Q data (e). For explanations of the panels, see Fig. 3.
3.2 Differences between P and Q fluxes and comparison with advection chamber fluxes
After exclusion of flux intervals compromised by biofouling (Case A: no exclusion; Case B: 14:00–18:00 EDT; Case C: 12:00–22:00 EDT, 05:00–09:00 EDT), the differences between P and Q optode fluxes derived from the slopes of the cumulative flux curves (Figs. 3e, 5e, 7e) averaged 2.3 %, −0.1 %, and −4.7 % during daytime and 1.7 %, 16.2 %, and −3.2 % during night-time for the three deployments, respectively. These smaller than 20 % differences between P and Q optode fluxes strengthened the flux estimates. Fluxes determined with the 2OEC were further supported by the fluxes measured with the advection chambers conducted parallel to the eddy covariance measurement during the August 2013 deployments (Cases A and C; see Fig. 8). The average chamber daytime fluxes for the two deployments (3.9±3.0 mmol m−2 h−1) were similar to the respective eddy covariance fluxes (3.7±0.9 mmol m−2 h−1) (Fig. 8c), although the chamber night-time fluxes ( mmol m−2 h−1) exceeded those of the eddy covariance instrument ( mmol m−2 h−1) by a factor of 1.4 (Fig. 8c). This discrepancy was caused by the smaller night-time fluxes recorded by the 2OEC during the second August 2013 deployment (Case A, Fig. 8b); however, the differences between average eddy and average chamber fluxes were statistically not significant (Fig. 8c).
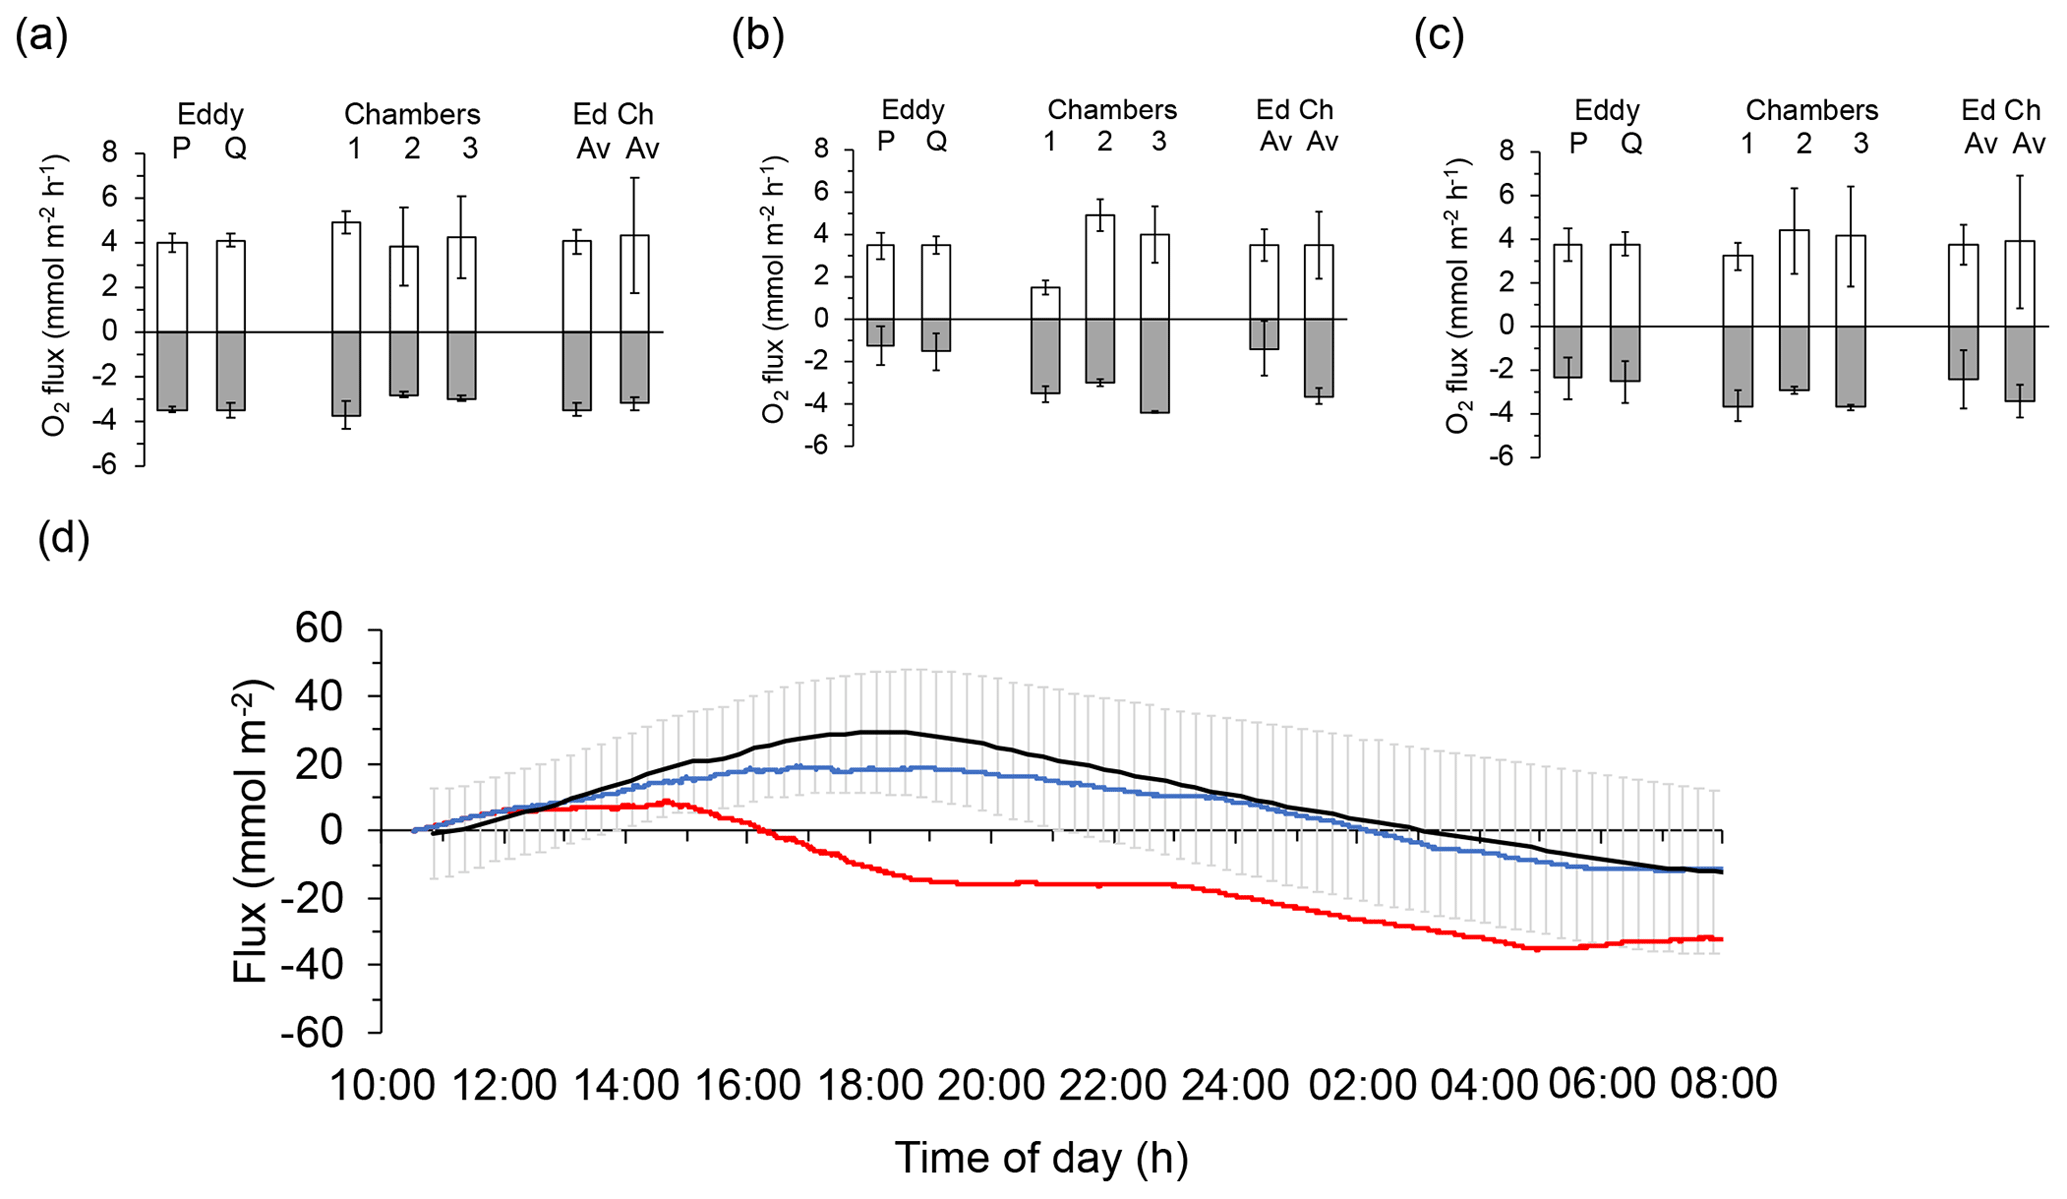
Figure 8Comparison of the daytime and night-time fluxes recorded with the eddy covariance instrument and the benthic advection chambers: (a) 14–15 August deployments (Case C), (b) 16–17 August deployments (Case A), and (c) averages of the two August deployments. Light columns present daytime fluxes, and dark columns present night-time fluxes. Columns on the right side of graphs (a), (b), and (c) labelled “Ed” depict the average of the fluxes based on sensors P and Q shown in the respective graph, and columns labelled “Ch” depict the average of the fluxes recorded with the three chambers shown in the respective graph. Error bars represent standard deviation including error propagation. (d) Comparison of cumulative flux measured with the chambers (black line showing the average of the three chamber replicates and the standard deviation of the individual measuring points) and the 2OEC (red line: optode P; blue line: optode Q) during the 14–15 August deployments (Case C). The chamber fluxes confirmed that optode P was temporarily compromised during this deployment. Error bars depict standard deviation.
The small and rapid changes in concentration and flow the aquatic eddy covariance instrumentation must record for accurate flux determination make the technique sensitive to even small disturbances affecting the measuring process (Reimers et al., 2012). By using two oxygen sensors recording in parallel, the 2OEC allows detection of measuring artefacts and thereby can enhance the reliability of the flux determinations. The functionality of the 2OEC and the ranges of fluxes it recorded were supported by the general agreement between the 2OEC fluxes and advection chamber fluxes measured parallel to the eddy flux recordings.
A perfect conformity of eddy and chamber fluxes cannot be expected due to fundamental differences between the open, non-invasive eddy covariance and the closed, invasive chamber measuring principles. Although marine sandy sediments such as those investigated here may appear homogeneous, bottom current patterns and patchy colonization by, e.g. algae and macrofauna cause some spatial and temporal variability in organic matter content and associated microbial metabolic activities that may influence interfacial solute fluxes (Kourelea et al., 2004; Ricart et al., 2015; Wilde and Plante, 2002; Attard et al., 2019). The fluxes recorded by the 2OEC originated from a sediment surface area of approximately 40 m2 upstream of the instrument (Berg et al., 2007), and the location of this footprint area moved with flow direction. The 2OEC therefore integrated some of the natural spatial variability of the flux, and the movement of the footprint area and changes in bottom flow velocity are reflected in the measured fluxes. In contrast, each chamber enclosed the same surface area of about 0.03 m2 and applied the same constant pressure gradient at the sediment surface throughout each deployment. The exclusion of flow variations, temporal water composition changes, and some of the light affected the fluxes measured by the chambers. These differences between the two flux-measuring techniques may explain some of the discrepancies in dark fluxes observed between 2OEC and chambers during the 16–17 August 2013 deployment (Fig. 8b) and emphasize the need for including natural bottom currents and light and for integrating over larger surface areas when assessing benthic interfacial fluxes.
The 2OEC improves detection of sensor fouling. This is significant as the most common and most unnoticed cause for aquatic eddy covariance measuring errors is likely the attachment of marine snow particles or biofilms to the solute sensor (extreme case shown in Fig. 1b). Through physical separation of the sensing surface from the water, such fouling increases sensor response time, which decreases the measured rates of oxygen change and the temporal alignment of oxygen and flow data. Furthermore, biological and chemical reactions in such organic coatings can produce or consume oxygen and thereby compromise flux calculations. As the growth of a biofilm on the sensor may be gradual, the detection of the onset of flux bias caused by biofouling may be impossible in a single-sensor instrument. A very good agreement of the cumulative fluxes calculated from the two 2OEC optodes as seen in Case A is a strong indication that the sensors measured correctly (Fig. 3), while differences between the cumulative fluxes as observed in Case C are indicative of sensor malfunction (Fig. 7e).
The comparison of the cumulative fluxes can reveal even short or small deviations of the sensor signal as, e.g. caused by a temporary attachment of a marine snow particle (Fig. 5e). If one of the two parallel measuring sensors showed a temporary increase or drop in oxygen as found in Cases B and C, we attributed this to the biofouling of that sensor, and in situ inspections of the sensors confirmed biofouling. Marine snow was present in the water at the study site partly due to its proximity to coral reefs that release mucus to the water (Wild et al., 2004). In Case B, unusual contributions to optode P fluxes in the wave frequency band (0.2 to 0.3 Hz) that were not mirrored in optode Q, identified optode P as compromised starting at 15:00 EDT for a ∼3 h duration (Fig. 6). A marine snow particle with photosynthesizing organisms attached to the tip of the oxygen sensor P may have caused the erroneous flux estimates. Oxygen concentration in the centre of such aggregates during light conditions can be increased by 85 % relative to the surrounding water (Ploug and Jorgensen, 1999) or even by 180 % within the sticky millimetre-sized gelatinous colonies of Phaeocystis spp., a common global bloom-forming phytoplankton organism (Ploug et al., 1999). The movement of such an attached photosynthesizing particle by wave orbital motion can synchronize vertical current flow oscillations and the effect of the particle on the oxygen reading (e.g. increased oxygen due to photosynthesis) and thereby lead to erroneous flux estimates (Fig. 9).
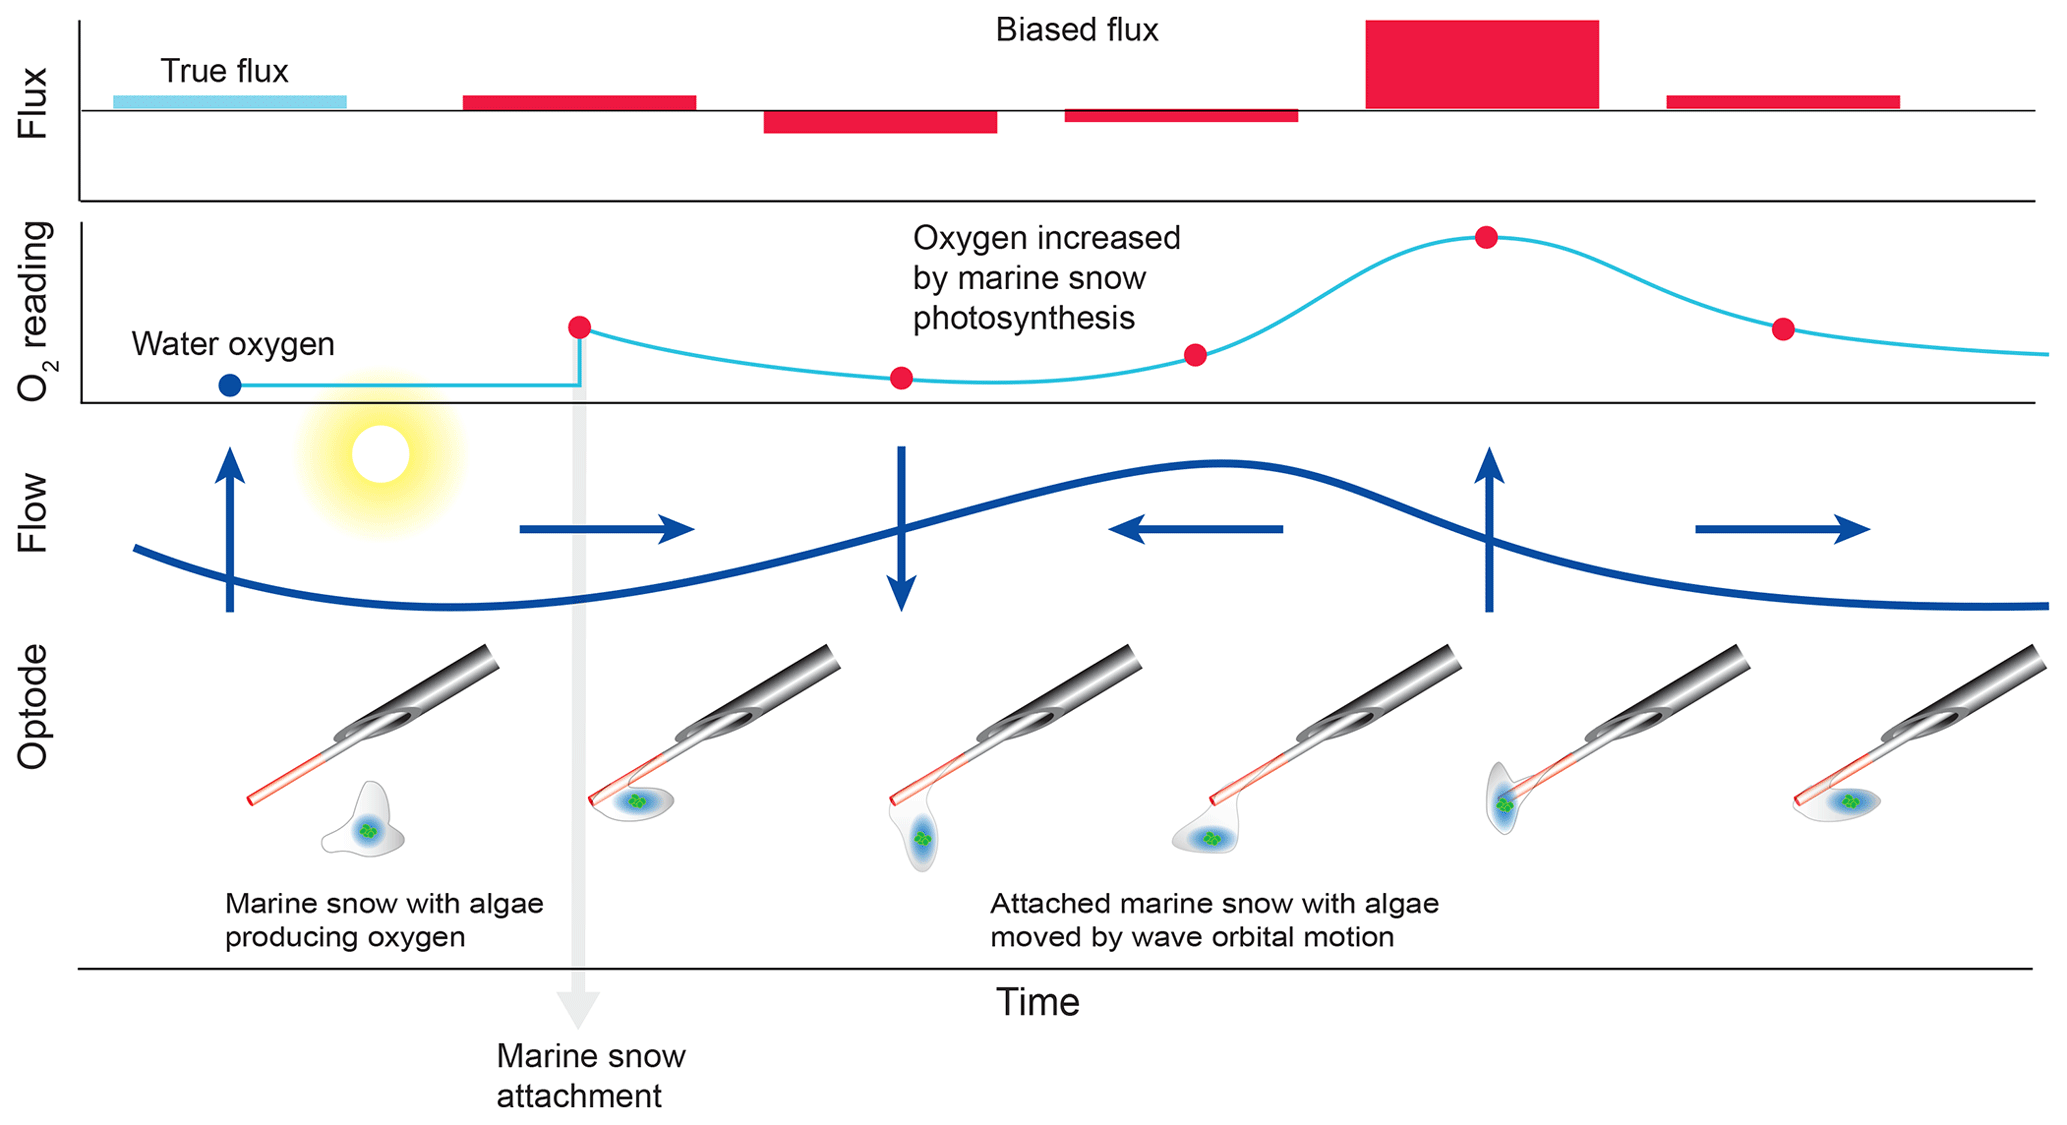
Figure 9False flux increase caused by the rhythmical deformation of a marine snow particle attached to an oxygen fibre optode. Erroneous fluxes result when wave orbital motion modulates the distance between photosynthesizing organisms contained in the gelatinous marine snow particle and the sensing surface of the optode.
In single-sensor eddy covariance instruments, obvious temporary sensor malfunctions typically flag long sections or the entire deployment as compromised because it is difficult to determine with certainty when and for how long the sensor reading has been biased. The relatively frequent occurrence of sensor fouling therefore causes substantial losses in data, time and funds. The dual sensor approach can reduce such losses because it allows identifying periods of unbiased measurements within partly compromised data records.

Figure 10Comparison of flux estimates generated by eddy covariance instruments equipped with either a Unisense microelectrode, a Pyroscience fibre optode, or a Rinko planar optode. (a) Comparison of time-lag-corrected fluxes for two burst intervals (each burst is 15 min long. During burst 1–9, the sensors faced away from the flow, while in bursts 11–28, they faced the flow. (b) Cumulative co-spectra of O2 flux vs. frequency for the three sensors. Blue lines represent the uncorrected data, and red lines represent data after time lag correction.
The reliability of the flux data hinges on unbiased sensor data that can capture temporal variability of current flow and the oxygen it carries, which may change as rapidly as 1–3 Hz (McGinnis et al., 2008; Kuwae et al., 2006). The ADV used in the 2OEC can produce calibrated current data non-invasively at a frequency of 64 Hz, while the fibre optode has a slower response time (200–300 ms, Merikhi et al., 2018), and its placement near the ADV measuring volume could affect current flow measurements and thereby bias the flux calculations. A cylindrical sensor placed in the path of the flow upstream the ADV measuring volume can shed a vortex street, thereby compromising the flow in the measuring volume and the flux estimates based on the flow measurements. Depending on the flow Reynolds number, such vortices may extend between 5 to 20 times the diameter of the cylinder downstream of the sensor (Green, 2012). By using the Pyroscience fibre optode for the 2OEC, one of the smallest and fastest oxygen sensors presently available, potential errors caused by the disturbance of the flow and interference with the acoustic pulses of the Doppler velocimeter can be avoided. At the turbulent Reynolds numbers typical for our study site (17 000 < Re <157 000, with ; current velocity u=0.017–0.157 m s−1; length scale being water depth d=10 m; kinematic viscosity m2 s−1), the vortices shed by the 430 µm fibre exposed to the water currents extend between 2 and 10 mm downstream of the fibre. Since the tips were placed at 30 mm horizontal distance from the lower edge of the ADV measuring volume, turbulence caused by fibre–flow interaction could not reach the ADV measuring volume. Similarly, the sensor tips at that distance did not interfere with the acoustic pulses of the ADV, and when initially positioning the optode tips, we confirmed that the fibres did not cause any disturbances in the ADV signal.
The Pyroscience fibre optode used with the 2OEC is one of the smallest and fastest oxygen sensors available, and a comparison with the most common oxygen sensors presently utilized for aquatic eddy covariance (Table A4) favours the selection of this sensor for many field settings. For this comparison, three eddy covariance instruments equipped with either (1) one Unisense electrochemical microelectrode (Berg et al., 2019), (2) one JFE Advantech Rinko planar optode (Berg et al., 2016), or (3) one Pyroscience fibre optode were deployed side by side (i.e. 10 m spacing) at our study site 3–4 December 2016. All instruments used the same type of tripod and ADV and the oxygen sensors were mounted at a 45∘ downward angle and at the same height as described for the 2OEC. The three different sensors measured very similar fluxes when the current flow approached the sensor tips from the front, as shown in Fig. 10a (burst 11 to 28). This changed when the flow approached the sensors from the back. The RINKO sensor under such flow conditions may self-shade its planar optode, which may result in an underestimation of the fluxes at higher frequencies (0.1–1.0 Hz, Fig. 10b), as seen in burst 1 to 9 (Fig. 10a), and possibly also disturb the flow in the Vector flow measuring volume. In environments with unidirectional current, however, the Rinko sensor facing the flow can produce very clean flux data, due to its relatively large sensing surface (Berg and Pace, 2017). There were no significant differences between the fluxes based on the fibre optode and the microelectrode for the reversed flow, supporting the choice of the sturdier fibre optodes for oxygen measurements with aquatic eddy covariance instruments in settings with changing flow direction.
We propose using the agreement or disagreement between the fluxes calculated from the signals of two independently measuring optodes as a tool to assess the quality of the measured fluxes. The nearly identical cumulative fluxes calculated from the two optodes in our August (Case A) and April (Case B) deployments strongly imply that the dynamics of the fluxes were measured accurately by the system. Likewise, the near linearity of the cumulative flux increase during daytime and decrease during night-time (Figs. 3e, 5e), and the very similar slopes of these cumulative flux curves support that the measurements recorded representative fluxes. The good agreement of the fluxes measured with the eddy covariance instrument and the fluxes measured independently with a very different method (advection chambers; see Fig. 8a, b, d) indicate that the magnitudes of the fluxes recorded by the 2OEC were correct. The deployments of the 2OEC in the Florida Keys sand flat revealed that biofouling frequently affects the aquatic eddy covariance measurements even in such an oligotrophic environment with very clear water containing low amounts of phytoplankton, bacteria and particles. Further developments of the aquatic eddy covariance technique therefore may benefit from installations of devices that monitor (e.g. with a camera) and reduce or prevent biofouling (e.g. through a cleaning mechanism). This project intended to improve the reliability of the aquatic eddy covariance technique and the procedures of data analysis in order to promote this powerful technique. The advantages of 2OEC flux measurements over invasive measurements (e.g. benthic chambers) may be most significant for deployments in continental margins. The magnitudes of biogeochemical benthic processes increase with decreasing water depth, with benthic fluxes reaching the highest rates and dynamics in the shelf environment (Huettel et al., 2014; Middelburg et al., 2005; Jahnke, 2010; Bauer et al., 2013; Reimers et al., 2004). Here light bottom currents and waves may strongly influence benthic fluxes (Gattuso et al., 2006). The relatively high fluxes and daytime oxygen release recorded at our oligotrophic sandy study site, supported by flux measurements from similar subtropical and tropical carbonate environments (Bednarz et al., 2015; Rao et al., 2012; Wild et al., 2005, 2009; Glud et al., 2008), emphasize the need for instrumentation that reliably can take light and flow at the seafloor into account when measuring benthic fluxes. The 2OEC is a powerful tool that meets these requirements, and its high temporal resolution and integration over a relative large sediment surface area can provide new insights into the oxygen dynamics and carbon cycling of benthic systems.
Table A1Specifications of the Pyroscience™ FireSting O2-Mini oxygen meter. This oxygen meter has recently been replaced by the Pyroscience™ PICO-O2, which is similar to the FireSting O2-Mini but is more compact. The FireSting O2-Mini oxygen meter is still available in combination with the Pyroscience™ sub-port (FSO2-SUBPORT).
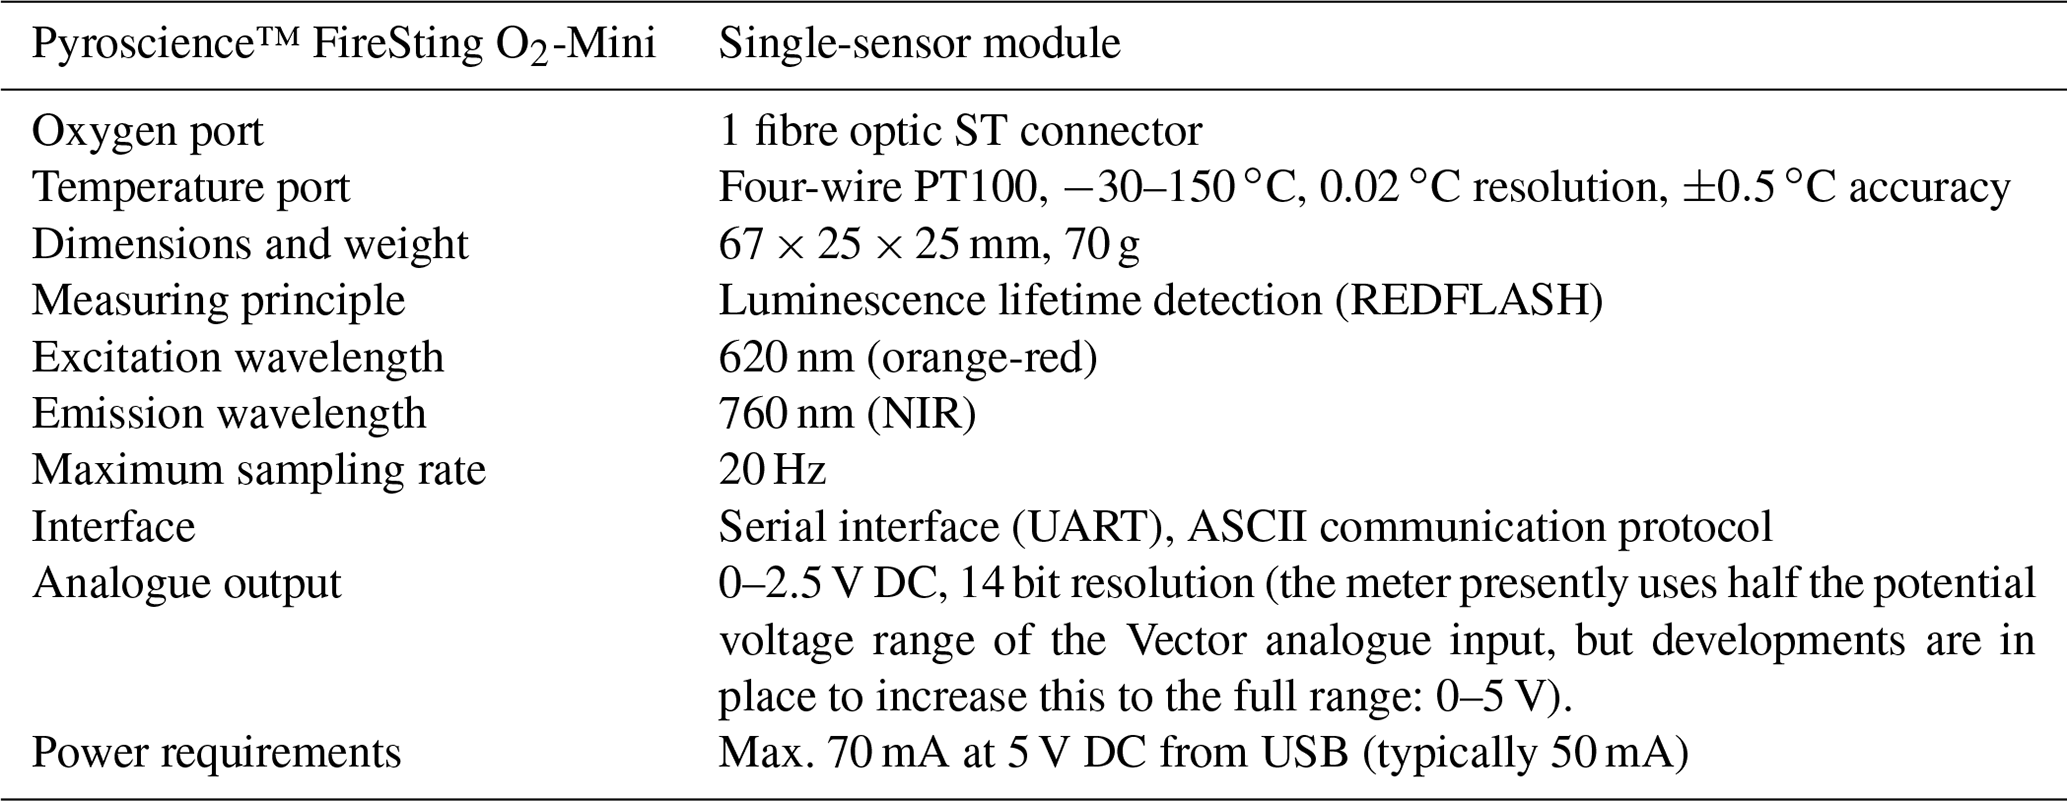
Table A2Specifications of the Pyroscience™ OXR430-UHS retractable oxygen mini-sensors.
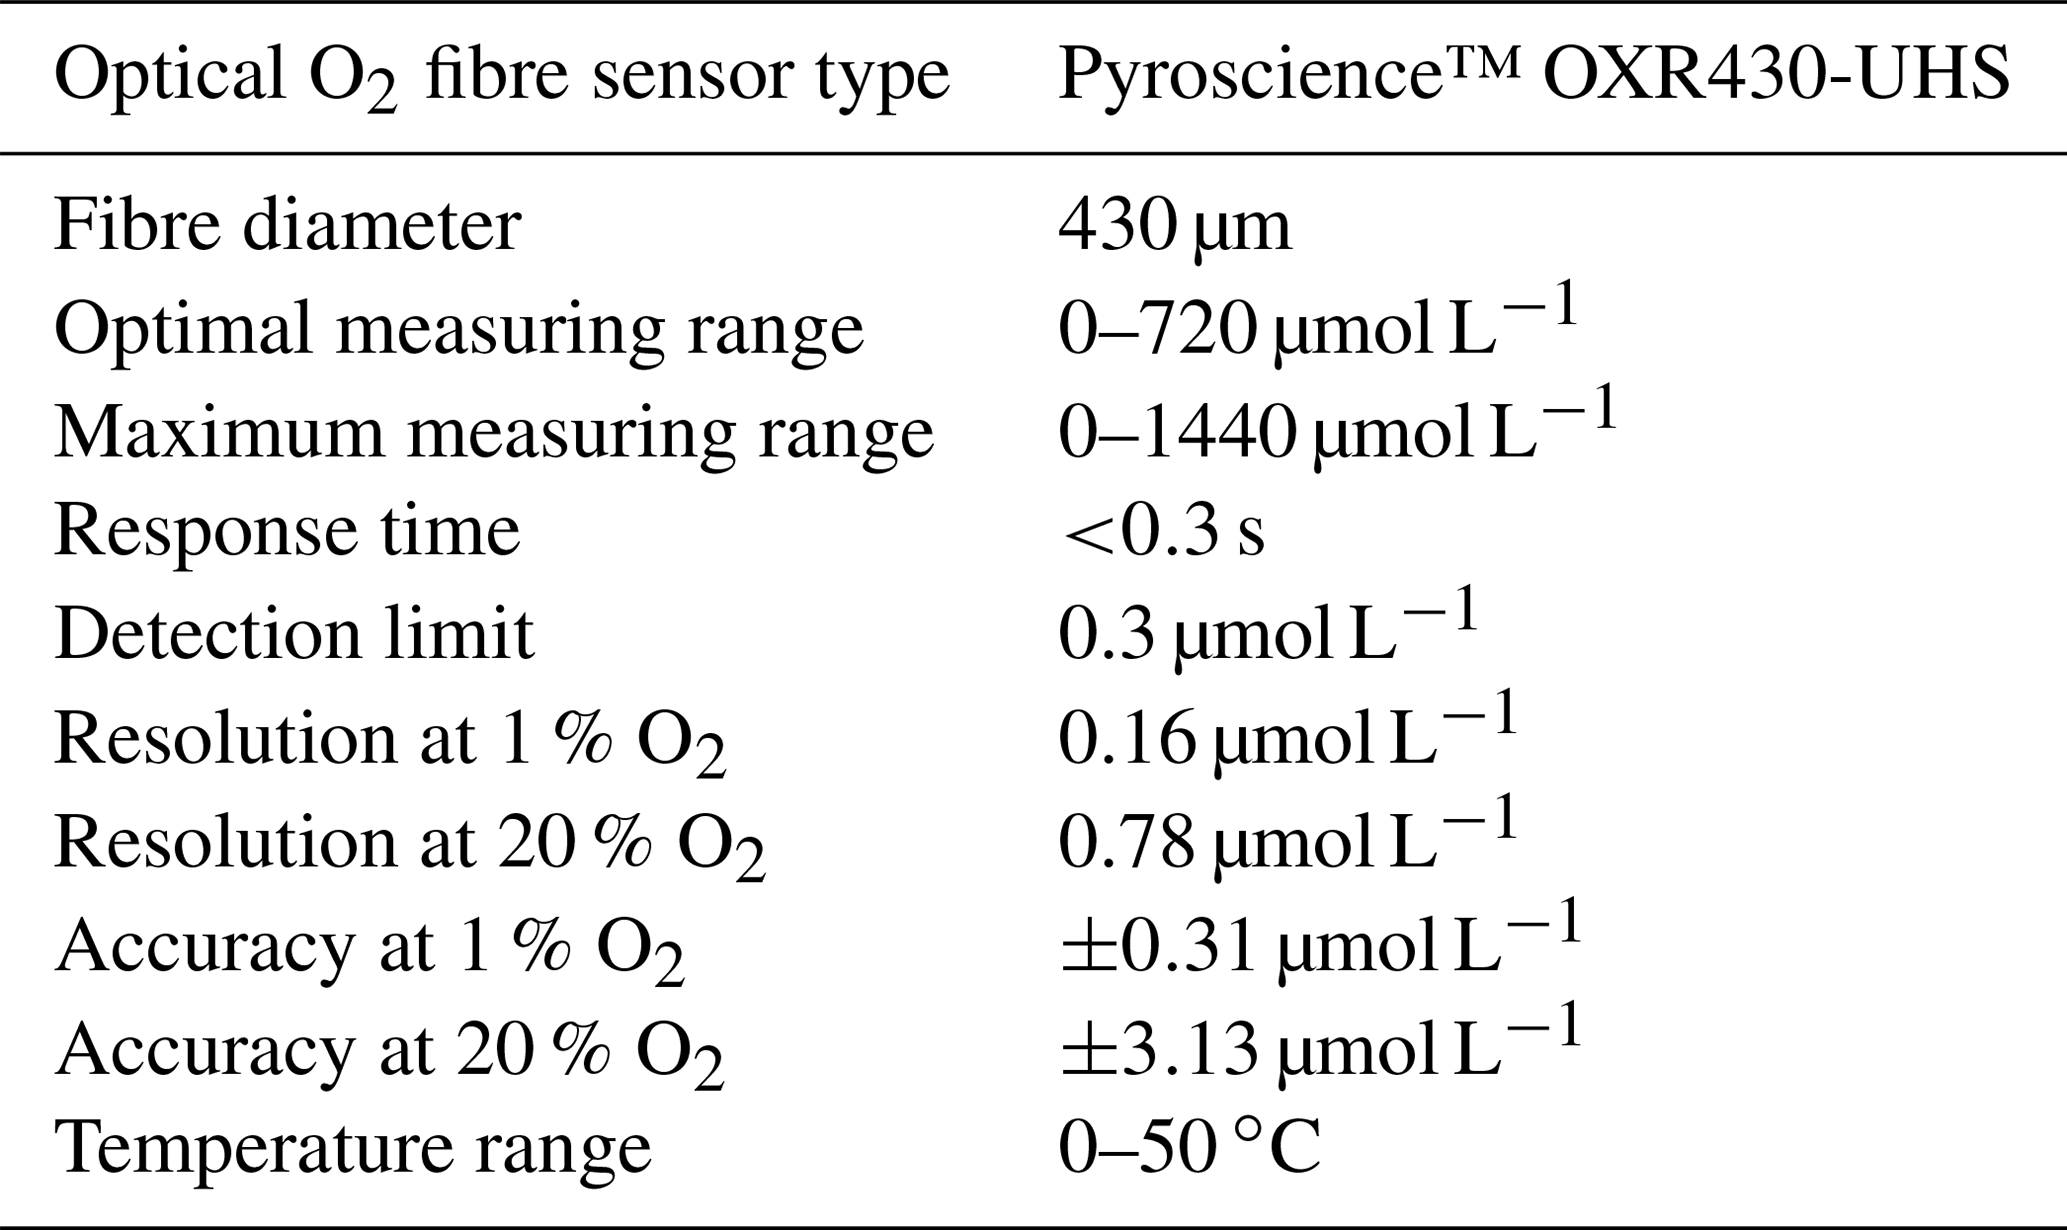
Table A3Specifications of the Nortek Vector acoustic Doppler velocimeter.
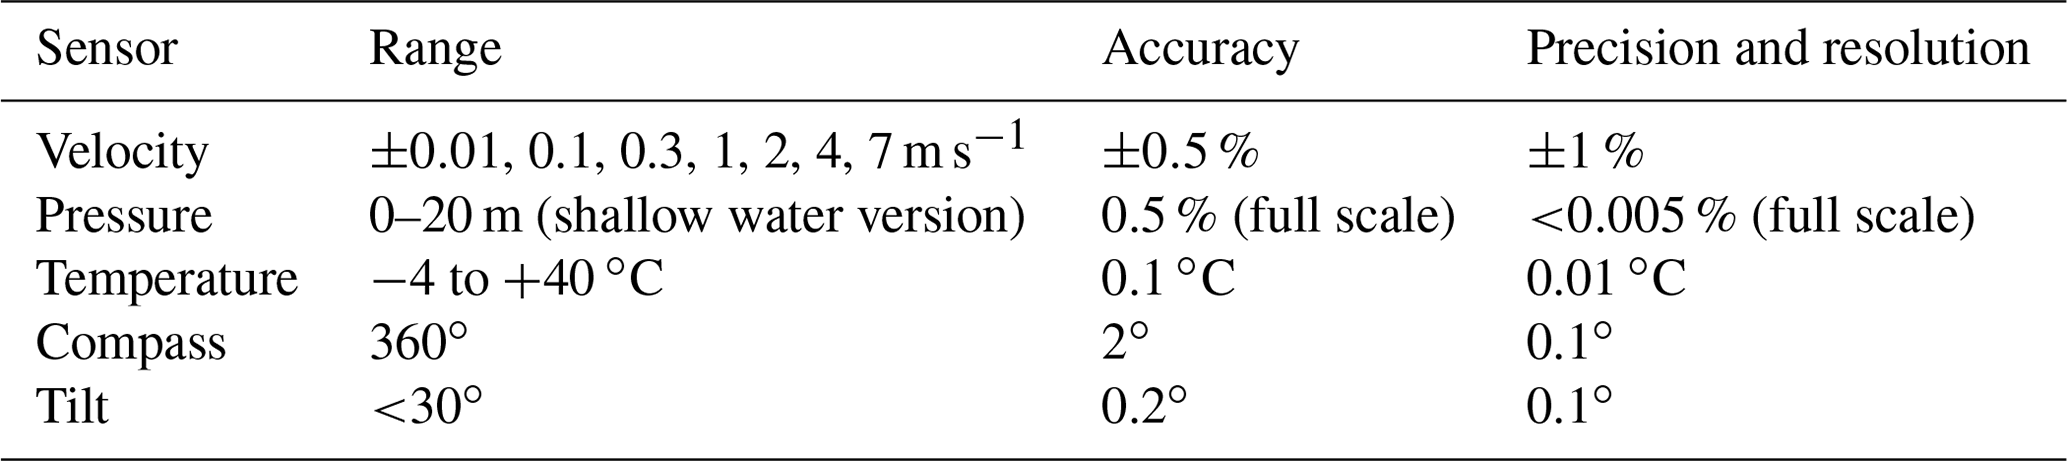
Table A4The specifications of the oxygen microelectrode, Rinko planar optode, and Pyroscience fibre optode.

The current flow and oxygen data collected with the 2OEC during the August 2013 and April 2014 deployments are available at the Biological and Chemical Oceanography Data Management Office (BCO-DMO, https://www.bco-dmo.org/, last access: 1 September 2020) under https://doi.org/10.26008/1912/bco-dmo.812523.1 (Huettel et al., 2020).
MH designed and assembled the 2OEC instrument. MH, PB and AM deployed the 2OEC and analysed the data. MH prepared the manuscript with contributions from all co-authors.
The authors declare that they have no conflict of interest.
We thank the staff of the FIO Florida Keys Marine Laboratory for their help with instrument deployment and sample collection. We would also like to thank DSO Chris Peters and the staff of the FSU coastal marine lab for providing SCUBA support. Brian W. Wells, Pascal Brignole, Lee Russell, and Natalie Geyer helped with the chamber deployments. We would like to extend our special thanks to referees Clare Reimers and Karl Attard. Their questions and comments greatly helped to improve the first version of this paper. The research was conducted under NOAA permit no. FKNMS-2012-137-A2.
This research has been supported by the National Science Foundation, Division of Ocean Sciences (grant nos. OCE-1334117, OCE-1851290, and OCE-1061364).
This paper was edited by Tyler Cyronak and reviewed by Karl Attard and Clare Reimers.
Alldredge, A. L. and Silver, M. W.: Characteristics, dynamics and significance of marine snow, Prog. Oceanogr., 20, 41–82, https://doi.org/10.1016/0079-6611(88)90053-5, 1988.
Attard, K. M., Glud, R. N., McGinnis, D. F., and Rysgaard, S.: Seasonal rates of benthic primary production in a Greenland fjord measured by aquatic eddy correlation, Limnol. Oceanogr., 59, 1555–1569, 2014.
Attard, K. M., Rodil, I. F., Glud, R. N., Berg, P., Norkko, J., and Norkko, A.: Seasonal ecosystem metabolism across shallow benthic habitats measured by aquatic eddy covariance, Limnol. Oceanogr. Lett., 4, 79–86, https://doi.org/10.1002/lol2.10107, 2019.
Bartoli, M., Nizzoli, D., and Viaroli, P.: Microphytobenthos activity and fluxes at the sediment-water interface: interactions and spatial variability, Aquat. Ecol., 37, 341–349, https://doi.org/10.1023/B:AECO.0000007040.43077.5f, 2003.
Bauer, J. E., Cai, W.-J., Raymond, P. A., Bianchi, T. S., Hopkinson, C. S., and Regnier, P. A. G.: The changing carbon cycle of the coastal ocean, Nature, 504, 61–70, https://doi.org/10.1038/nature12857, 2013.
Bednarz, V. N., van Hoytema, N., Cardini, U., Naumann, M. S., Al-Rshaidat, M. M. D., and Wild, C.: Dinitrogen fixation and primary productivity by carbonate and silicate reef sand communities of the Northern Red Sea, Mar. Ecol. Prog. Ser., 527, 47–57, https://doi.org/10.3354/meps11224, 2015.
Berg, P. and Pace, M. L.: Continuous measurement of air-water gas exchange by underwater eddy covariance, Biogeosciences, 14, 5595–5606, https://doi.org/10.5194/bg-14-5595-2017, 2017.
Berg, P., Roy, H., Janssen, F., Meyer, V., Jorgensen, B. B., Huettel, M., and de Beer, D.: Oxygen uptake by aquatic sediments measured with a novel non-invasive eddy-correlation technique, Mar. Ecol.-Prog. Ser.s, 261, 75–83, 2003.
Berg, P., Roy, H., and Wiberg, P. L.: Eddy correlation flux measurements: The sediment surface area that contributes to the flux, Limnol. Oceanogr., 52, 1672–1684, 2007.
Berg, P., Glud, R. N., Hume, A., Stahl, H., Oguri, K., Meyer, V., and Kitazato, H.: Eddy correlation measurements of oxygen uptake in deep ocean sediments, Limnol. Oceanogr.-Method., 7, 576–584, 2009.
Berg, P., Long, M. H., Huettel, M., Rheuban, J. E., McGlathery, K. J., Howarth, R. W., Foreman, K. H., Giblin, A. E., and Marino, R.: Eddy correlation measurements of oxygen fluxes in permeable sediments exposed to varying current flow and light, Limnol. Oceanogr., 58, 1329–1343, https://doi.org/10.4319/lo.2013.58.4.1329, 2013.
Berg, P., Reimers, C. E., Rosman, J. H., Huettel, M., Delgard, M. L., Reidenbach, M. A., and Ozkan-Haller, H. T.: Technical note: Time lag correction of aquatic eddy covariance data measured in the presence of waves, Biogeosciences, 12, 6721–6735, https://doi.org/10.5194/bg-12-6721-2015, 2015.
Berg, P., Koopmans, D. J., Huettel, M., Li, H., Mori, K., and Wuest, A.: A new robust oxygen-temperature sensor for aquatic eddy covariance measurements, Limnol. Oceanogr.-Method., 14, 151–167, https://doi.org/10.1002/lom3.10071, 2016.
Berg, P., Delgard, M. L., Reimers, C., Glud, R., Huettel, M., and Pace, M.: Non-invasive Flux Measurements at the Benthic Interface: the Aquatic Eddy Covariance Technique. 1, ASLO, ASLO e-Lectures, 1–50, 2017.
Berg, P., Delgard, M. L., Polsenaere, P., McGlathery, K. J., Doney, S. C., and Berger, A. C.: Dynamics of benthic metabolism, O2, and pCO2 in a temperate seagrass meadow, Limnol. Oceanogr., 64, 2586–2604, https://doi.org/10.1002/lno.11236, 2019.
Bittig, H. C., Kortzinger, A., Neill, C., van Ooijen, E., Plant, J. N., Hahn, J., Johnson, K. S., Yang, B., and Emerson, S. R.: Oxygen Optode Sensors: Principle, Characterization, Calibration, and Application in the Ocean, Front. Mar. Sci., 4, 1–25, https://doi.org/10.3389/fmars.2017.00429, 2018.
Brand, A., McGinnis, D. F., Wehrli, B., and Wueest, A.: Intermittent oxygen flux from the interior into the bottom boundary of lakes as observed by eddy correlation, Limnol. Oceanogr., 53, 1997–2006, https://doi.org/10.4319/lo.2008.53.5.1997, 2008.
Chipman, L., Huettel, M., Berg, P., Meyer, V., Klimant, I., Glud, R., and Wenzhoefer, F.: Oxygen optodes as fast sensors for eddy correlation measurements in aquatic systems, Limnol. Oceanogr.-Method., 10, 304–316, https://doi.org/10.4319/lom.2012.10.304, 2012.
Chipman, L., Berg, P., and Huettel, M.: Benthic Oxygen Fluxes Measured by Eddy Covariance in Permeable Gulf of Mexico Shallow-Water Sands, Aquat. Geochem., 22, 529–554, https://doi.org/10.1007/s10498-016-9305-3, 2016.
Cook, P. L. M., Wenzhofer, F., Glud, R. N., Janssen, F., and Huettel, M.: Benthic solute exchange and carbon mineralization in two shallow subtidal sandy sediments: Effect of advective pore-water exchange, Limnol. Oceanogr., 52, 1943–1963, 2007.
Crusius, J., Berg, P., Koopmans, D. J., and Erban, L.: Eddy correlation measurements of submarine groundwater discharge, Mar. Chem., 109, 77–85, https://doi.org/10.1016/j.marchem.2007.12.004, 2008.
Cyronak, T., Santos, I. R., McMahon, A., and Eyre, B. D.: Carbon cycling hysteresis in permeable carbonate sands over a diel cycle: Implications for ocean acidification, Limnol. Oceanogr., 58, 131–143, https://doi.org/10.4319/lo.2013.58.1.0131, 2013.
DeBeer, D., Wenzhofer, F., Ferdelman, T. G., Boehme, S. E., Huettel, M., van Beusekom, J. E. E., Bottcher, M. E., Musat, N., and Dubilier, N.: Transport and mineralization rates in North Sea sandy intertidal sediments, Sylt-Romo Basin, Wadden Sea, Limnol. Oceanogr., 50, 113–127, 2005.
de Froe, E., Rovelli, L., Glud, R. N., Maier, S. R., Duineveld, G., Mienis, F., Lavaleye, M., and van Oevelen, D.: Benthic Oxygen and Nitrogen Exchange on a Cold-Water Coral Reef in the North-East Atlantic Ocean, Front. Mar. Sci., 6, 1–13, https://doi.org/10.3389/fmars.2019.00665, 2019.
Delauney, L., Compère, C., and Lehaitre, M.: Biofouling protection for marine environmental sensors, Ocean Sci., 6, 503–511, https://doi.org/10.5194/os-6-503-2010, 2010.
Donis, D., Holtappels, M., Noss, C., Cathalot, C., Hancke, K., Polsenaere, P., Wenzhofer, F., Lorke, A., Meysman, F. J. R., Glud, R. N., and McGinnis, D. F.: An Assessment of the Precision and Confidence of Aquatic Eddy Correlation Measurements, J. Atmos. Ocean. Technol., 32, 642–655, https://doi.org/10.1175/jtech-d-14-00089.1, 2015.
Eyre, B. D., Santos, I. R., and Maher, D. T.: Seasonal, daily and diel N2 effluxes in permeable carbonate sediments, Biogeosciences, 10, 2601–2615, https://doi.org/10.5194/bg-10-2601-2013, 2013.
Eyre, B. D., Cyronak, T., Drupp, P., De Carlo, E. H., Sachs, J. P., and Andersson, A. J.: Coral reefs will transition to net dissolving before end of century, Science, 359, 908–911, https://doi.org/10.1126/science.aao1118, 2018.
Gattuso, J.-P., Gentili, B., Duarte, C. M., Kleypas, J. A., Middelburg, J. J., and Antoine, D.: Light availability in the coastal ocean: impact on the distribution of benthic photosynthetic organisms and their contribution to primary production, Biogeosciences, 3, 489–513, https://doi.org/10.5194/bg-3-489-2006, 2006.
Glud, R. N.: Oxygen dynamics of marine sediments, Mar. Biol. Res., 4, 243–289, 2008.
Glud, R. N., Eyre, B. D., and Patten, N.: Biogeochemical responses to mass coral spawning at the Great Barrier Reef: Effects on respiration and primary production, Limnol. Oceanogr., 53, 1014–1024, 2008.
Glud, R. N., Berg, P., Hume, A., Batty, P., Blicher, M. E., Lennert, K., and Rysgaard, S.: Benthic O2 exchange across hard-bottom substrates quantified by eddy correlation in a sub-Arctic fjord, Mar. Ecol.-Prog. Ser., 417, 1–12, https://doi.org/10.3354/meps08795, 2010.
Green, S.: Periodic Vortex Shedding from Structures, in: Fluid Vortices, Technology and Engineering, Springer Science and Business Media, 536–539, 2012.
Gundersen, J. K., Ramsing, N. B., and Glud, R. N.: Predicting the signal of O2 microsensors from physical dimensions, temperature, salinity, and O2 concentration, Limnol. Oceanogr., 43, 1932–1937, 1998.
Holst, G., Kohls, O., Klimant, I., Koenig, B., Kuehl, M., and Richter, T.: A modular luminescence lifetime imaging system for mapping oxygen distribution in biological samples, Sensor Actuat. B-Chem., 51, 163–170, 1998.
Holtappels, M., Glud, R. N., Donis, D., Liu, B., Hume, A., Wenzhofer, F., and Kuypers, M. M. M.: Effects of transient bottom water currents and oxygen concentrations on benthic exchange rates as assessed by eddy correlation measurements, J. Geophys. Res.-Ocean., 118, 1157–1169, https://doi.org/10.1002/jgrc.20112, 2013.
Holtappels, M., Noss, C., Hancke, K., Cathalot, C., McGinnis, D. F., Lorke, A., and Glud, R. N.: Aquatic Eddy Correlation: Quantifying the Artificial Flux Caused by Stirring-Sensitive O2 Sensors, Plos One, 10, 1–20, https://doi.org/10.1371/journal.pone.0116564, 2015.
Huettel, M. and Gust, G.: Impact Of Bioroughness On Interfacial Solute Exchange In Permeable Sediments, Mar. Ecol. Prog. Ser., 89, 253–267, 1992a.
Huettel, M. and Gust, G.: Solute Release Mechanisms From Confined Sediment Cores In Stirred Benthic Chambers and Flume Flows, Mar. Ecol. Prog. Ser., 82, 187–197, 1992b.
Huettel, M. and Rusch, A.: Transport and degradation of phytoplankton in permeable sediment, Limnol. Oceanogr., 45, 534–549, 2000.
Huettel, M., Berg, P., and Kostka, J. E.: Benthic Exchange and Biogeochemical Cycling in Permeable Sediments, Ann. Rev. Mar. Sci., 6, 23–51, https://doi.org/10.1146/annurev-marine-051413-012706, 2014.
Huettel, M., Berg, P., and Merkihi, A.: Current flow and oxygen concentrations recorded by the 2OEC-instrument in the Florida Keys from August 2013 and April 2014, Biological and Chemical Oceanography Data Management Office (BCO-DMO), (Version 1) Version Date 2020-05-2, https://doi.org/10.26008/1912/bco-dmo.812523.1, 2020.
Hume, A. C., Berg, P., and McGlathery, K. J.: Dissolved oxygen fluxes and ecosystem metabolism in an eelgrass (Zostera marina) meadow measured with the eddy correlation technique, Limnol. Oceanogr., 56, 86–96, https://doi.org/10.4319/lo.2011.56.1.0086, 2011.
Jahnke, R.: Global Synthesis, in: Carbon and Nutrient Fluxes in Continental Margins, edited by: Liu, K. K., Atkinson, L. P., Quinones, R., and Talaure-McManus, L., Springer, 597–615, 2010.
Janssen, F., Faerber, P., Huettel, M., Meyer, V., and Witte, U.: Pore-water advection and solute fluxes in permeable marine sediments (I): Calibration and performance of the novel benthic chamber system Sandy, Limnol. Oceanogr., 50, 768–778, 2005a.
Janssen, F., Huettel, M., and Witte, U.: Pore-water advection and solute fluxes in permeable marine sediments (II): Benthic respiration at three sandy sites with different permeabilities (German Bight, North Sea), Limnol. Oceanogr., 50, 779–792, 2005b.
Jesus, B., Brotas, V., Marani, M., and Paterson, D. M.: Spatial dynamics of microphytobenthos determined by PAM fluorescence, Estuar. Coast. Shelf Sci., 65, 30–42, https://doi.org/10.1016/j.ecss.2005.05.005, 2005.
Johnson, K. S., Chavez, F. P., and Friederich, G. E.: Continental-shelf sediment as a primary source of iron for coastal phytoplankton, Nature, 398, 697–700, 1999.
Klimant, I., Meyer, V., and Kuehl, M.: Fiber-optic oxygen microsensors, a new tool in aquatic biology, Limnol. Oceanogr., 40, 1159–1165, 1995.
Koopmans, D., Holtappels, M., Chennu, A., Weber, M., and de Beer, D.: High Net Primary Production of Mediterranean Seagrass (Posidonia oceanica) Meadows Determined With Aquatic Eddy Covariance, Front. Mar. Sci., 7, 1–13, https://doi.org/10.3389/fmars.2020.00118, 2020.
Kourelea, E., Vafidis, D., Chintiroglou, C. C., Trontsios, G., and Chicharo, L.: Temporal variations in fine sand assemblages in the North Aegean sea (Eastern Mediterranean), Int. Rev. Hydrobiol., 89, 175–187, https://doi.org/10.1002/iroh.200310672, 2004.
Kuwae, T., Kamio, K., Inoue, T., Miyoshi, E., and Uchiyama, Y.: Oxygen exchange flux between sediment and water in an intertidal sandflat, measured in situ by the eddy-correlation method, Mar. Ecol. Prog. Ser., 307, 59–68, https://doi.org/10.3354/meps307059, 2006.
Lehner, P., Staudinger, C., Borisov, S. M., Regensburger, J., and Klimant, I.: Intrinsic Artefacts in Optical Oxygen Sensors-How Reliable are our Measurements?, Chem.-Eur. J., 21, 3978–3986, https://doi.org/10.1002/chem.201406037, 2015.
Long, M. H., Koopmans, D., Berg, P., Rysgaard, S., Glud, R. N., and Sogaard, D. H.: Oxygen exchange and ice melt measured at the ice-water interface by eddy correlation, Biogeosciences, 9, 1957–1967, https://doi.org/10.5194/bg-9-1957-2012, 2012.
Long, M. H., Berg, P., de Beer, D., and Zieman, J. C.: In Situ Coral Reef Oxygen Metabolism: An Eddy Correlation Study, Plos One, 8, 1–11, https://doi.org/10.1371/journal.pone.0058581, 2013.
Lorrai, C., McGinnis, D. F., Berg, P., Brand, A., and Wuest, A.: Application of Oxygen Eddy Correlation in Aquatic Systems, J. Atmos. Ocean. Technol., 27, 1533–1546, https://doi.org/10.1175/2010jtecho723.1, 2010.
MacIntyre, H. L., Geider, R. J., and Miller, D. C.: Microphytobenthos: The ecological role of the “secret garden” of unvegetated, shallow-water marine habitats, 1. Distribution, abundance and primary production, Estuaries, 19, 186–201, https://doi.org/10.2307/1352224, 1996.
McGinnis, D. F., Berg, P., Brand, A., Lorrai, C., Edmonds, T. J., and Wuest, A.: Measurements of eddy correlation oxygen fluxes in shallow freshwaters: Towards routine applications and analysis, Geophys. Res. Lett., 35, 1–5, 2008.
McGinnis, D. F., Cherednichenko, S., Sommer, S., Berg, P., Rovelli, L., Schwarz, R., Glud, R. N., and Linke, P.: Simple, robust eddy correlation amplifier for aquatic dissolved oxygen and hydrogen sulfide flux measurements, Limnol. Oceanogr.-Method., 9, 340–347, https://doi.org/10.4319/lom.2011.9.340, 2011.
McGinnis, D. F., Sommer, S., Lorke, A., Glud, R. N., and Linke, P.: Quantifying tidally driven benthic oxygen exchange across permeable sediments: An aquatic eddy correlation study, J. Geophys. Res.-Ocean., 119, 6918–6932, https://doi.org/10.1002/2014jc010303, 2014.
Merikhi, A., Berg, P., Meyer, V., and Huettel, M.: Jet-nozzle method for measuring response times of scalar sensors used in liquids and gases, Limnol. Oceanogr.-Method., 16, 475–483, https://doi.org/10.1002/lom3.10259, 2018.
Middelburg, J. J., Duarte, C. M., and Gattuso, J. P.: Respiration in coastal benthic communities, in: Respiration in Aquatic Ecosystems (Oxford Biology) (Hardcover), edited by: del Giorgio, P. A., P. J. l. B. W., Oxford University Press, 206–225, 2005.
Navarro-Villoslada, F., Orellana, G., Moreno-Bondi, M. C., Vick, T., Driver, M., Hildebrand, G., and Liefeith, K.: Fiber-optic luminescent sensors with composite oxygen-sensitive layers and anti-biofouling coatings, Anal. Chem., 73, 5150–5156, https://doi.org/10.1021/ac015517n, 2001.
Ploug, H. and Jorgensen, B. B.: A net-jet flow system for mass transfer and microsensor studies of sinking aggregates, Mar. Ecol. Prog. Ser., 176, 279–290, https://doi.org/10.3354/meps176279, 1999.
Ploug, H. and Passow, U.: Direct measurement of diffusivity within diatom aggregates containing transparent exopolymer particles, Limnol. Oceanogr., 52, 1–6, 2007.
Ploug, H., Stolte, W., Epping, E. H. G., and Jorgensen, B. B.: Diffusive boundary layers, photosynthesis, and respiration of the colony-forming plankton algae, Phaeocystis sp, Limnol. Oceanogr., 44, 1949–1958, https://doi.org/10.4319/lo.1999.44.8.1949, 1999.
Rao, A. M. F., Polerecky, L., Ionescu, D., Meysman, F. J. R., and de Beer, D.: The influence of pore-water advection, benthic photosynthesis, and respiration on calcium carbonate dynamics in reef sands, Limnol. Oceanogr., 57, 809–825, https://doi.org/10.4319/lo.2012.57.3.0809, 2012.
Reimers, C. E., Stecher III, H. A., Taghon, G. L., Fuller, C. M., Huettel, M., Rusch, A., Ryckelynck, N., and Wild, C.: In situ measurements of advective solute transport in permeable shelf sands, Cont. Shelf Res., 24, 183–201, 2004.
Reimers, C. E., Oezkan-Haller, H. T., Berg, P., Devol, A., McCann-Grosvenor, K., and Sanders, R. D.: Benthic oxygen consumption rates during hypoxic conditions on the Oregon continental shelf: Evaluation of the eddy correlation method, J. Geophys. Res.-Ocean., 117, 1–18, https://doi.org/10.1029/2011jc007564, 2012.
Reimers, C. E., Ozkan-Haller, H. T., Albright, A. T., and Berg, P.: Microelectrode Velocity Effects and Aquatic Eddy Covariance Measurements under Waves, J. Atmos. Ocean. Technol., 33, 263–282, https://doi.org/10.1175/jtech-d-15-0041.1, 2016.
Rheuban, J. E., Berg, P., and McGlathery, K. J.: Ecosystem metabolism along a colonization gradient of eelgrass (Zostera marina) measured by eddy correlation, Limnol. Oceanogr., 59, 1376–1387, https://doi.org/10.4319/lo.2014.59.4.1376, 2014a.
Rheuban, J. E., Berg, P., and McGlathery, K. J.: Multiple timescale processes drive ecosystem metabolism in eelgrass (Zostera marina) meadows, Mar. Ecol. Prog. Ser., 507, 1–13, https://doi.org/10.3354/meps10843, 2014b.
Ricart, A. M., York, P. H., Rasheed, M. A., Perez, M., Romero, J., Bryant, C. V., and Macreadie, P. I.: Variability of sedimentary organic carbon in patchy seagrass landscapes, Mar. Pollut. Bull., 100, 476–482, https://doi.org/10.1016/j.marpolbul.2015.09.032, 2015.
Rodil, I. F., Attard, K. M., Norkko, J., Glud, R. N., and Norkko, A.: Towards a sampling design for characterizing habitat-specific benthic biodiversity related to oxygen flux dynamics using Aquatic Eddy Covariance, Plos One, 14, 1–29, https://doi.org/10.1371/journal.pone.0211673, 2019.
Rovelli, L., Attard, K. M., Bryant, L. D., Flogel, S., Stahl, H., Roberts, J. M., Linke, P., and Glud, R. N.: Benthic O2 uptake of two cold-water coral communities estimated with the non-invasive eddy correlation technique, Mar. Ecol. Prog. Ser., 525, 97–104, https://doi.org/10.3354/meps11211, 2015.
Santos, I. R., Glud, R. N., Maher, D., Erler, D., and Eyre, B. D.: Diel coral reef acidification driven by porewater advection in permeable carbonate sands, Heron Island, Great Barrier Reef, Geophys. Res. Lett., 38, 1–5, https://doi.org/10.1029/2010gl046053, 2011.
Smith, M. J., Kerr, A., and Cowling, M. J.: Effects of marine biofouling on gas sensor membrane materials, J. Environ. Monitor., 9, 1378–1386, https://doi.org/10.1039/b714187b, 2007.
Stern, O. and Volmer, M.: The fading time of fluorescence, Phys. Z., 20, 183–188, 1919.
Walsh, J. J.: On the nature of continental shelves, Academic Press, New York, 520 pp., 1988.
Wang, X. D. and Wolfbeis, O. S.: Optical methods for sensing and imaging oxygen: materials, spectroscopies and applications, Chem. Soc. Rev., 43, 3666–3761, https://doi.org/10.1039/c4cs00039k, 2014.
Wenzhofer, F. and Glud, R. N.: Small-scale spatial and temporal variability in coastal benthic O2 dynamics: Effects of fauna activity, Limnol. Oceanogr., 49, 1471–1481, 2004.
Wild, C., Huettel, M., Klueter, A., Kremb, S. G., Rasheed, M. Y. M., and Jorgensen, B. B.: Coral mucus functions as an energy carrier and particle trap in the reef ecosystem, Nature, 428, 66–70, 2004.
Wild, C., Rasheed, M., Jantzen, C., Cook, P., Struck, U., Huettel, M., and Boetius, A.: Benthic metabolism and degradation of natural particulate organic matter in carbonate and silicate reef sands of the northern Red Sea, Mar. Ecol.-Prog. Ser., 298, 69–78, 2005.
Wild, C., Naumann, M. S., Haas, A., Struck, U., Mayer, F. W., Rasheed, M. Y., and Huettel, M.: Coral sand O2 uptake and pelagic-benthic coupling in a subtropical fringing reef, Aqaba, Red Sea, Aquat. Biol., 6, 133–142, https://doi.org/10.3354/ab00181, 2009.
Wilde, S. B. and Plante, C. J.: Spatial heterogeneity of bacterial assemblages in marine sediments: The influence of deposit feeding by Balanoglossus aurantiacus, Estuar. Coast. Shelf Sci., 55, 97–107, https://doi.org/10.1006/ecss.2001.0889, 2002.
Zetsche, E. M., Larsson, A. I., Iversen, M. H., and Ploug, H.: Flow and diffusion around and within diatom aggregates: Effects of aggregate composition and shape, Limnol. Oceanogr., 65, 1818–1833, https://doi.org/10.1002/lno.11420, 2020.