
Abstract
Atmospheric non-thermal plasma is gaining increasing attention for various applications including food, medical and healthcare technologies because of its unique capability in producing reactive species. In spite of its promising potential, generating non-thermal plasma over large and complex geometries such as the human body or a narrow channel is still challenging and is limiting the use of atmospheric non-thermal plasma. In this study, we propose two new electrode systems, printed and knitted electrodes, to enhance scalability and flexibility of a conventional atmospheric non-thermal plasma source. The flexibilities of both electrode systems are quantified for varying curvatures to generate non-thermal plasma over complex geometries. Moreover, both electrode systems are assessed for varying system size to assess the ability of large scale plasma geometries. Electrical and optical diagnostics including Optical Emission Spectroscopy (OES), are used to monitor the property of plasma generated by these systems. The present study shows that both printed and knitted electrodes can produce non-thermal plasma, however both have certain limitations. Concluding from these findings, a schematic of new hybrid electrode system for the treatment of large surfaces or narrow long channels is proposed to eradicate these limitations.
Export citation and abstract BibTeX RIS

Original content from this work may be used under the terms of the Creative Commons Attribution 4.0 licence. Any further distribution of this work must maintain attribution to the author(s) and the title of the work, journal citation and DOI.
1. Introduction
An atmospheric non-thermal plasma, also known as cold plasma, is operating at room temperature and atmospheric pressure. Non-thermal plasma has high electron temperatures at significantly lower gas temperatures in comparison to thermal plasma in the equilibrium state because it is in a non-equilibrium state, where the energy is mainly stored in the electrons [1, 2]. Non-thermal plasma contains reactive chemical species and high electron density reaching up to 1020 m−3 [1]. These unique physical and chemical characteristics of non-thermal plasma bring a broad spectrum of potential plasma applications in flow control [3], water purification [4] and decontamination of surfaces [5], wound healing [6] and cancer treatment [7, 8].
The physical and chemical properties of non-thermal plasma can be varied by using different discharge methods, which need different electrode configurations [9]. Figure 1 shows the schematics of various non-thermal plasma sources, such as plasma jet, corona discharge, dielectric barrier discharge (DBD) or micro hollow cathode discharge (MHCD). A corona discharge can generate non-thermal plasma with low operating temperature and atmospheric pressure, suitable for surface treatment [10] and biomedical applications [11]. However treatment of larger areas requiring a scalable system is limited, due to the highly localized plasma generation region at an electrode tip [2]. Compared to a corona discharge, a micro hollow cathode discharge allows for an easier manufacturing of large micro-electrode- arrays from individual MHCD units to achieve larger geometries [12]. However, its high operating temperature make it unsuitable for use on thermally sensitive materials such as in biomedical applications [12]. A plasma jet has low operating temperature and applications are commonly used for biomedical applications [13, 14], such as cancer treatment [8] and wound management [6, 15]. The localized generation of plasma and the need of a shielding gas of most systems can increase the system complexity and operating cost [16]. Compared to these discharge methods, DBD plasma sources can operate without a shielding gas at low temperatures and simple fabrications methods offer good scalability opportunities, thus making it a promising candidate for various potential non-thermal plasma applications.
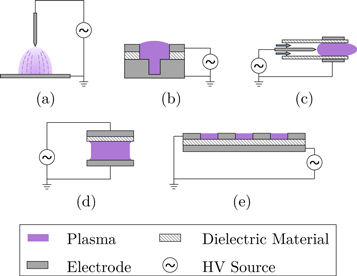
Figure 1. Schematics of various non-thermal plasma sources: (a) Corona discharge; (b) Micro hollow cathode discharges (MHCD); (c) Jet plasma; (d) Volume dielectric barrier discharge; (e) surface DBD plasma source.
Download figure:
Standard image High-resolution imageAs shown in figure 1(d), volume DBD plasma sources consist of two electrodes, a dielectric layer and an air gap between them. Various configurations depending on desired plasma properties and geometries for specific applications are possible [9]. As can be seen in figure 1(e), a surface DBD has a planar electrode configuration, with the electrodes arranged on either side of the dielectric material and plasma being generated across the electrode surface. Conventional surfaces DBD plasma sources are generally limited to be used against flat surfaces, due to their rigid dielectric and electrode materials. Some existing flexible plasma devices overcome the rigidity by including a flexible array arrangement [17] or flexible dielectric and electrode material [16]. However these are also still for smaller treatment areas of around 10 cm2 [18, 19]. Plasma actuators, used for flow control applications, are mostly aiming only at a length extension of the electrode for the use in full-scale applications. Multiple DBDs actuators in an assembly can be used, not only to achieve larger sizes, but also for to introduce a controllability for a localized plasma generation [28, 29]. However, existing DBD systems leave a demand for large scale and flexible electrode systems with the generation of a uniformly constant plasma.
The remaining challenges on DBD plasma sources is the fabrication of reliable flexible and scalable DBD plasma sources for the uniform plasma generation over large and complex surfaces. Fully scalable and flexible DBD plasma sources, generating uniform plasma, can further improve the effectiveness of non-thermal plasma application, such as surface treatment or decontamination. In addition to the challenge of generating uniform plasma across large and complex surfaces, the treatment success depends sensitively on the on the gap distance between plasma layer and treated surface [17, 20]. This study we focus on the challenge to generate uniform plasma over large and complex surfaces, by proposing two new flexible and scalable plasma sources. The first plasma source promotes the flexibility of an electrode system by decreasing the thickness of electrode and dielectric material through adapting printed electronics, which will be referred to as 'printed electrode'. The second proposed plasma sources is using flexible materials on electrodes with a new 3D coaxial mesh electrode configuration, which will be called 'knitted electrode'. In this paper we will first describe the two new plasma sources and the applied diagnostics methods. This is followed by the assessment of both systems in terms of flexibility and scalability. Finally we provide a discussion of advantages and limitations of both electrode systems, concluding by introducing a new schematic of a hybrid electrode systems.
2. Electrode systems and diagnostics
Both new plasma sources, using printed and knitted electrode systems, and the diagnostics methods for the assessment of the flexibility and scalability are presented.
2.1. Printed electrode
The basic concept of a printed electrode is applying printed electronics on flexible dielectric substrates for the fabrication of a flexible plasma source. Figure 2(a) shows the schematic of a printed plasma source based on a surface DBD configuration. Both powered and grounded electrode geometries are printed on a thin dielectric film using a Dimatix material printer (DMP2831) with a conductive silver nanoparticle ink (SunTronic U5714, SunChemical). The printed electrodes have been cured at 150 °C for 30 minutes to ensure the strength and conductivity of the printed electrode [21]. The thickness of the printed electrode is limited to 1 μm, in order to ensures sufficient flexibility and maximal current [22]. The electrical safety of a plasma source is improved by encasing the high voltage electrode with dielectric insulation. Figure 2(b) shows more detailed views of the printed electrode system. As can be seen, the printed pattern has slightly uneven edges and surface. This is mainly caused by the surface tension and viscosity of the ink [23] and in extreme cases can lead to a non-uniform generation of plasma. Therefore, we need to precisely adjust ink droplet size and placement and to tune the viscosity of a conductive nanoparticle ink to obtain better regularity of the printed edges and surface [24].
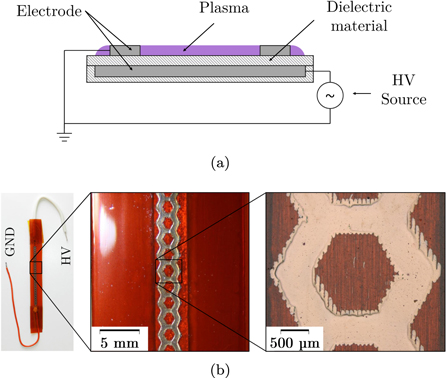
Figure 2. (a) A schematic of a printed electrode (b) Inkjet-printed electrode system on a flexible dielectric substrate.
Download figure:
Standard image High-resolution image2.2. Knitted electrode
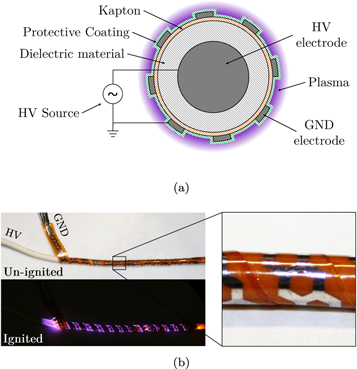
Figure 3(a) shows the schematic of a plasma source using a knitted electrode. It is using a coaxial electrode configuration with flexible dielectric materials to ensure the flexibility of a plasma source. The knitted electrode manly consists of a coaxial power and an exposed meshed ground electrode. The power electrode is sufficiently thick to withstand the induced heat of the high voltage load. A ground electrode is fabricated by braiding tinned copper wire around the dielectric material. The mesh braiding coverage of a ground electrode can affects the properties of the generated plasma, because non-thermal plasma will be formed in the air exposed area on the outside of the dielectric material and the braided ground electrode.
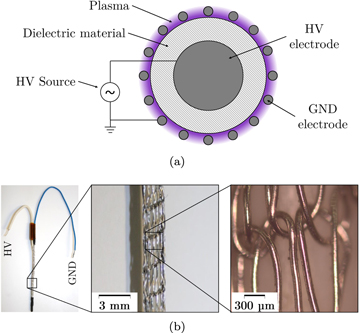
Figure 3. (a) A schematic of a coaxial knitted electrode (b) Picture of a manufactured knitted electrode.
Download figure:
Standard image High-resolution image2.3. Experimental arrangement
Figure 4 shows a schematic of the experimental configuration for testing the operation of flexible plasma sources using printed and knitted electrodes. The electrode systems are powered by AC high voltage using a high-voltage amplifier (Trek 20/20C-HS) with a maximum peak voltage, Vpp , of 20 kV and a variable frequency, f. A function generator is used to control the operating voltage and frequency of the sinusoidal input signal. In this study, the operating conditions for both plasma systems are maintained constant to allow a better relative comparison for the flexibility and scalability assessment. The plasma sources using printed and knitted electrodes are operated with a frequency of 2 kHz with voltages of 8kVpp and 10kVpp, respectively. The experimental setup contains various electrical and optical diagnostic tools, such as voltage and current sensor, a CMOS sensor and optical emission spectroscopy (OES).
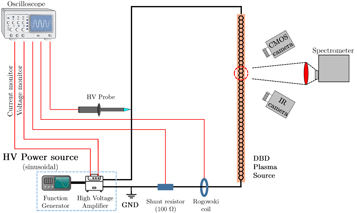
Figure 4. A schematic of an experimental configuration for assessing the flexible plasma system using printed and knitted electrode systems.
Download figure:
Standard image High-resolution image2.4. Diagnostics
Electrical, optical and chemical characteristics of plasma can be used to assess both printed and knitted electrodes in terms of flexibility and scalability. The flexibility of an electrode is evaluated by measuring intensity and uniformity of generated plasma over non-flat surfaces. Electrodes having the same length are wrapped around nylon rods having three different diameters of 6 mm, 10 mm and 20 mm. Figure 5 shows the flexibility assessment setup for the printed electrode system wrapped around the nylon rod with 6 mm diameter.

Figure 5. Flexibility testing of exemplary from plasma source using printed electrode (example shown for printed electrode system).
Download figure:
Standard image High-resolution imageFigure 6 shows the schematic of experimental setup assessing the scalability of electrode systems by monitoring their performance against varying system length and width. Three different lengths, which are 64 mm, 128 mm and 256 mm, are used to evaluate the scalability of connecting electrodes. The varying electrode length is an elongation of the plasma area and will be refereed to as a series connection of the electrodes. Through connecting several electrodes in parallel, we have assess the ability to scale the width of a plasma system. The width scalability assessment evaluates and compares assemblies of four short (4 × 64 mm), two medium (2 × 128 mm) and one long (1 × 256 mm) electrode. All three parallel assemblies amount the same overall length of electrode and plasma area, to ensure a constant power density.
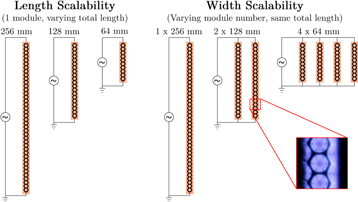
Figure 6. A circuit schematic of scalability assessment of developed plasma sources (example shown for printed electrode system).
Download figure:
Standard image High-resolution imageThe electrical characteristics of both new electrode systems is quantified by using electrical diagnostics, consisting of voltage and current sensors, to determine the power intensity of the generated plasma. The power intensity, defined as the average power per unit length of electrode, is an important parameter, which can be used for the design and optimisation of scalable and flexible plasma sources. The average power consumption, Pave , is obtained by evaluating the the area inside a Lissajous curve as:

The power intensity is a basic parameter to characterize the electrical properties of plasma, as a varying power intensity measurements can indicate varying plasma properties. In this study, this characteristic is used when assessing the flexibility and scalability of electrode systems. A fully scalable electrode system will show constant power intensity for varying length and width scales, of the plasma sources. However a deviation in power density will be a sign of changed plasma properties, consequently indicating inadequate scalability of the electrode systems. The equivalent applies to the flexibility assessment, where a fully flexible plasma source will show a constant power intensity for varying curvatures of the electrode system. High curvatures may lead to geometrical deformation of the electrode system, resulting in a changed capacitance, thus changed electrical properties. Consequently, a variation in power intensity indicates changed electrical properties and an inadequate flexibility performance, likely due to geometrical deformation of the electrode system.
As an optical diagnostics tool, image processing is used to assess the intensity and uniformity of the generated plasma across both tested electrode system. As shown in figure 7 the recorded images of the plasma are divided into several sections. On each section, the image intensity value, Iimg , is obtained as:

where Rij
, Gij
and Bij
are the pixel intensities of the respective RGB part of the image section and n and m the width and height of the image section respectively. The intensities across all sections of an electrode are averaged to the mean image intensity value  . This mean image intensity,
  , quantifies the overall intensity of the generated plasma, whereas the standard deviation, σimg
, across all sections indicates the uniformity of the generated plasma across the electrode. For the flexibility and scalability assessment, both image intensity,
, quantifies the overall intensity of the generated plasma, whereas the standard deviation, σimg
, across all sections indicates the uniformity of the generated plasma across the electrode. For the flexibility and scalability assessment, both image intensity,  , and intensity deviation, σimg
, are normalised to describe relative intensity and uniformity, respectively. A constant relative intensity is indicating, that the strength of generated plasma is similar to the baseline case, which is a flat plasma source having a 256 mm long electrode. A deviation from the baseline case indicates varying strength of the generated plasma, which will conclude an inadequate scalability (or flexibility) of the electrode system. A low intensity deviation, σimg
, is indicating the intensity of generated plasma is uniform across the electrode surfaces. However, an increase of the intensity deviation indicates a non-uniform plasma generation across the electrode, thus reducing the the scalability (or flexibility) of the plasma source. Consequently, a fully scalable and flexible plasma source is showing constant relative intensity and low intensity deviation values.
, and intensity deviation, σimg
, are normalised to describe relative intensity and uniformity, respectively. A constant relative intensity is indicating, that the strength of generated plasma is similar to the baseline case, which is a flat plasma source having a 256 mm long electrode. A deviation from the baseline case indicates varying strength of the generated plasma, which will conclude an inadequate scalability (or flexibility) of the electrode system. A low intensity deviation, σimg
, is indicating the intensity of generated plasma is uniform across the electrode surfaces. However, an increase of the intensity deviation indicates a non-uniform plasma generation across the electrode, thus reducing the the scalability (or flexibility) of the plasma source. Consequently, a fully scalable and flexible plasma source is showing constant relative intensity and low intensity deviation values.
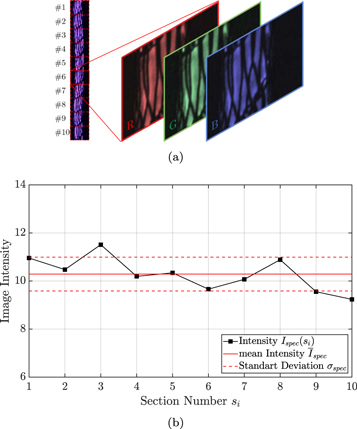
Figure 7. (a) Schematic of image intensity and uniformity assessment (b) Image intensity and uniformity values, exemplary shown on the the knitted electrode.
Download figure:
Standard image High-resolution imageThe chemical properties of the generated plasma are analysed with optical emission spectroscopy (OES) as a simple and non-invasive diagnostic technique. The Ocean Optics HR-4000 spectrometer is coupled with a 100 μm optical fiber to measure the intensity of the emitted light from the plasma from 200 nm to 1100 nm. It mainly measures the intensity of nitrogen emission of the plasma and can provides the baseline measurement of further plasma parameters. The spectra from the plasma emission are recorded from the same physical area of approx. 4.5 mm2 for both electrode systems. The integration time of the recording has to be adjusted to both electrode configurations due to the varying discharge characteristic and overall intensity. The integration time is 15 seconds for the printed electrode and 30 seconds for the knitted electrode. Figure 8(a) shows an example of the recorded spectra from the plasma emission from a printed electrode system. The major emission peaks of the second positive system of N2 (C–B) and the first negative system of  (B–X) can be seen in the wavelength range from 300 to 440 nm. As atmospheric non-thermal plasmas have mean electron energies in the range of few eV, only a small fraction of electrons possessed energies that exceed these elementary processes. Therefore, the relative low intensity of
  (B–X) at 391 nm is indicative of this small number of highly energetic electrons. The emission of atomic oxygen at 777 nm and 845 nm can currently not been detected, even though the required energy for these transitions is well below the threshold for emission at 391 nm. This is mainly due to high quenching rates from collisions with N2 and O2 molecules [25].
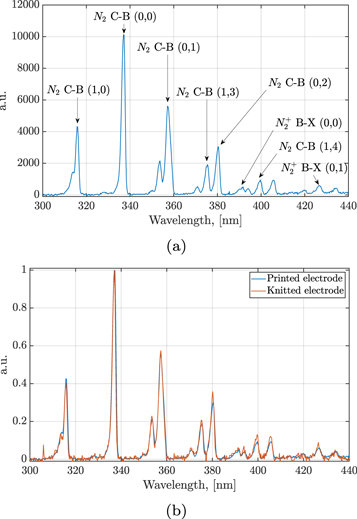
Figure 8. (a) Emission Spectra for printed electrode system of 256 mm length. (b) Normalised emission spectra for printed and knitted electrode systems.
Download figure:
Standard image High-resolution imageThe spectra for the differing tested electrode configuration all show similar pattern of emission peaks, thus similar chemical composition of the plasma. The only difference in the emission spectra for various electrode configuration is the varying overall emission intensity. Figure 8(b) shows the normalised spectral intensity for the printed and knitted electrode system and as can be seen when normalised, the pattern of the emission peaks remains similar. The varying overall emission intensity can be quantified by deriving the integrated spectral intensity Ispec as:

which will allow for a relative comparison between the varying electrode configuration. For a relative comparison, the spectral intensity Ispec is normalises using the 256 mm and flat electrode systems for the scalability and flexibility assessment respectively. Constant spectral intensity Ispec values for various size scales and curvatures are an indication of a fully scalable and flexible electrode system.
3. Results and discussion
3.1. Printed electrode
Figure 9 shows the plasma emission images for air plasma produced by the developed plasma system using the printed electrodes with 8 kV at 2 kHz. For a better comparison, the images only show a small section of the actual full length of the respective electrode system. Figure 9(a) and (b) show the images of the generated plasma by using various size of printed electrodes connected in serial and parallel, respectively. A total length of an electrode is maintained constant over the printed electrode connected in parallel to ensure same power intensity per unit length. The relative intensities measured from the images are used to assess the scalability of a plasma system with a printed electrode connected in serial and parallel. Figure 10 shows the derived relative plasma intensity and uniformity values of the printed electrodes connected in series and parallel. The mean image intensity,  , is the normalized mean value across all sections along the printed electrode, which indicates the overall intensity. The intensity deviation, σimg
, across all sections quantifies the uniformity. As can be seen, the image intensity,
, is the normalized mean value across all sections along the printed electrode, which indicates the overall intensity. The intensity deviation, σimg
, across all sections quantifies the uniformity. As can be seen, the image intensity,  , only show a small variation for different length and width scales, with values ranging from 0.9–1. The intensity deviation, σimg
, ranges below 0.022, indicating a highly uniform generation of plasma across the electrodes. As can be seen, a plasma system using a printed electrode can be scaled by connecting electrodes in either series or parallel without affecting its relative intensity and global uniformity of the generated plasmas.
, only show a small variation for different length and width scales, with values ranging from 0.9–1. The intensity deviation, σimg
, ranges below 0.022, indicating a highly uniform generation of plasma across the electrodes. As can be seen, a plasma system using a printed electrode can be scaled by connecting electrodes in either series or parallel without affecting its relative intensity and global uniformity of the generated plasmas.
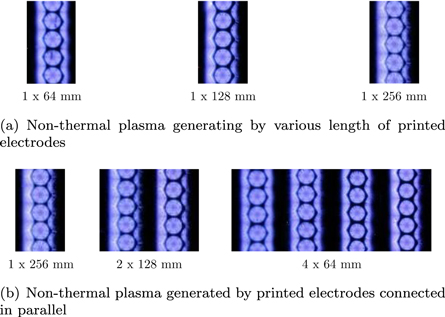
Figure 9. Air plasma emission images of the developed plasma sources using printed electrodes with 8 kV at 2 kHz.
Download figure:
Standard image High-resolution image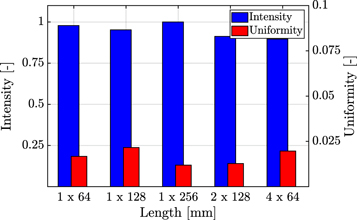
Figure 10. Relative intensities and uniformities of plasmas generated using the various size of printed electrodes.
Download figure:
Standard image High-resolution imageFigure 11 shows the calculated power consumptions Pave of plasma sources using printed electrodes. As can be seen, the power consumptions increase linearly with the system length, with a long 256 mm long printed electrode system requires 1.86 W, a 128 mm medium long plasma source 0.85 W and a 64 mm short plasma source 0.44 W. The power intensity per unit length of the different length scales of electrode systems remains mostly constant with 7.27 W m−1, 6.56 W m−1 and 6.88 W m−1 for the long, medium and short electrode. The power intensities of parallel connected electrodes are 6.95 W m−1 and 7.38 W m−1 for two and four parallel connections, respectively, compared to a single electrode having the power intensity of 7.27 W m−1. The power intensity is not significantly affected by connecting printed electrode system either in series and parallel. The normalised spectral intensities, Ispec , of serially and parallel connected electrodes are mostly conserved, with fluctuations in a range of +/− 11% and 4 %, respectively. Thus, a plasma system using printed electrode can be easily scaled by connecting electrode in series and/or parallel configuration.
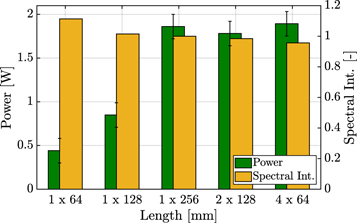
Figure 11. Power and spectral intensities of printed electrodes connected in series and parallel.
Download figure:
Standard image High-resolution imageThe flexibility is assessed by deforming the printed electrode systems at various bending curvatures to assess the ability to generate uniform plasmas over non-flat surfaces. Figure 12 shows that the generated plasma using printed electrodes has constant intensity and uniformity over various curvatures. Figure 13 shows the derived relative the intensity and uniformity values of plasmas generated by printed electrode over non-flat surfaces. A plasma system using a printed electrode can generate plasmas over non-flat surfaces while maintaining constant relative intensity, with mean intensities values,  , ranging from 0.99–1.02. The intensity deviation, σimg
, for the flexibility assessment ranges from 0.03 to 0.06. For smaller curvatures, the images show a more distorted view of the electrode pattern near the edge region of the testing rod. Theses image areas are neglect for the calculation of the image intensities and intensity deviation. However an increase of intensity deviation, σimg
, due to to the image distortion can still be seen for smaller curvatures.
, ranging from 0.99–1.02. The intensity deviation, σimg
, for the flexibility assessment ranges from 0.03 to 0.06. For smaller curvatures, the images show a more distorted view of the electrode pattern near the edge region of the testing rod. Theses image areas are neglect for the calculation of the image intensities and intensity deviation. However an increase of intensity deviation, σimg
, due to to the image distortion can still be seen for smaller curvatures.

Figure 12. Air plasma emission images of the developed plasma sources using printed electrodes over non-flat surfaces having various curvatures.
Download figure:
Standard image High-resolution image
Figure 13. Relative intensities and uniformities of plasmas generated using printed electrodes over non-flat surfaces having various curvatures.
Download figure:
Standard image High-resolution imageFigure 14 shows the power consumption of the printed electrode system for various curvatures. As can be seen, the power consumption remains mostly constant with fluctuations of +/− 11%, ranging from 2.24 W to 2.47 W. The power intensity for the flexibility assessment with 8.75 W m−1 ranges above the power intensity for the scalability assessment with only 7.27 W m−1 for the same length of electrode. This variation stems from the use of different protective coatings on the printed electrodes during the scalability (acrylic resin) and flexibility (Polydimethylsiloxane (PDMS)) assessment. The coating is an added dielectric layer, protecting the printed electrode pattern from erosion and oxidation. Depending on the coating composition, it can change the electrode systems capacitance and consequently lead to varying discharge characteristic. The derived normalized spectral intensity Ispec , as shown in figure 14 fluctuates by +/− 16% for varying curvatures of the printed electrode system.

Figure 14. Power and spectral intensities of printed electrodes using printed electrodes over non-flat surfaces having various curvatures.
Download figure:
Standard image High-resolution image3.2. Knitted electrode
Figure 15 shows the plasma emission images for air plasma produced by the developed plasma system using knitted electrodes with 10 kV at 2 kHz. Figure 15(a) shows the image sections of the generated plasma by using various size of printed electrodes connected in serial. Figure 15(b) shows plasma emission over the printed electrode connected in parallel, where the total length of an electrode is maintained constant to ensure same power intensity per unit length. The relative intensities measured from the images are used to assess the scalability of a plasma system with a printed electrode connected in serial and parallel. Figure 16 shows the the calculated normalised image intensity,  , and intensity deviation, σimg
. The normalized image intensity for varying length and width scales of the knitted electrode ranging from 0.67 to 1, which indicates a larger intensity fluctuations for varying scaling conditions. The intensity deviation, σimg
, serving as a measure of uniformity across the electrode, ranges up to 0.080. This increased intensity deviation compared to the printed electrode system (σimg
< 0.022), indicates a less uniform plasma generation across the knitted electrode configuration. The larger fluctuations in intensity and uniformity for the knitted electrode system can be related to the geometrical configuration. The ground electrode is knitted around the dielectric material, whereby the fabrication process leaves a leaving minimal gap between knitted electrode and dielectric. This gap can vary circumferentially around the coaxial electrode, but also along the electrode axis, even in a flat electrode configuration. Already minimal changes in the electrode geometry can results in local changes of the plasma sources capacitance, which leads to a non-uniform plasma generation [9].
, and intensity deviation, σimg
. The normalized image intensity for varying length and width scales of the knitted electrode ranging from 0.67 to 1, which indicates a larger intensity fluctuations for varying scaling conditions. The intensity deviation, σimg
, serving as a measure of uniformity across the electrode, ranges up to 0.080. This increased intensity deviation compared to the printed electrode system (σimg
< 0.022), indicates a less uniform plasma generation across the knitted electrode configuration. The larger fluctuations in intensity and uniformity for the knitted electrode system can be related to the geometrical configuration. The ground electrode is knitted around the dielectric material, whereby the fabrication process leaves a leaving minimal gap between knitted electrode and dielectric. This gap can vary circumferentially around the coaxial electrode, but also along the electrode axis, even in a flat electrode configuration. Already minimal changes in the electrode geometry can results in local changes of the plasma sources capacitance, which leads to a non-uniform plasma generation [9].
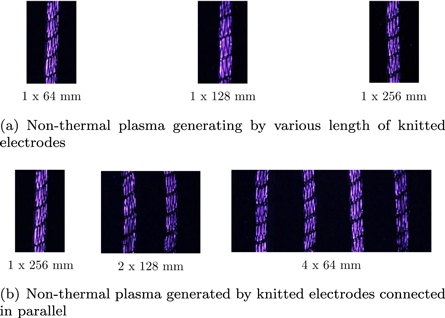
Figure 15. Air plasma emission images of the developed plasma sources using knitted electrodes.
Download figure:
Standard image High-resolution image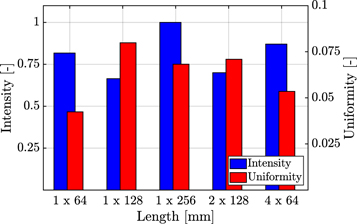
Figure 16. Relative intensities and uniformities of plasmas generated using the various size of knitted electrodes.
Download figure:
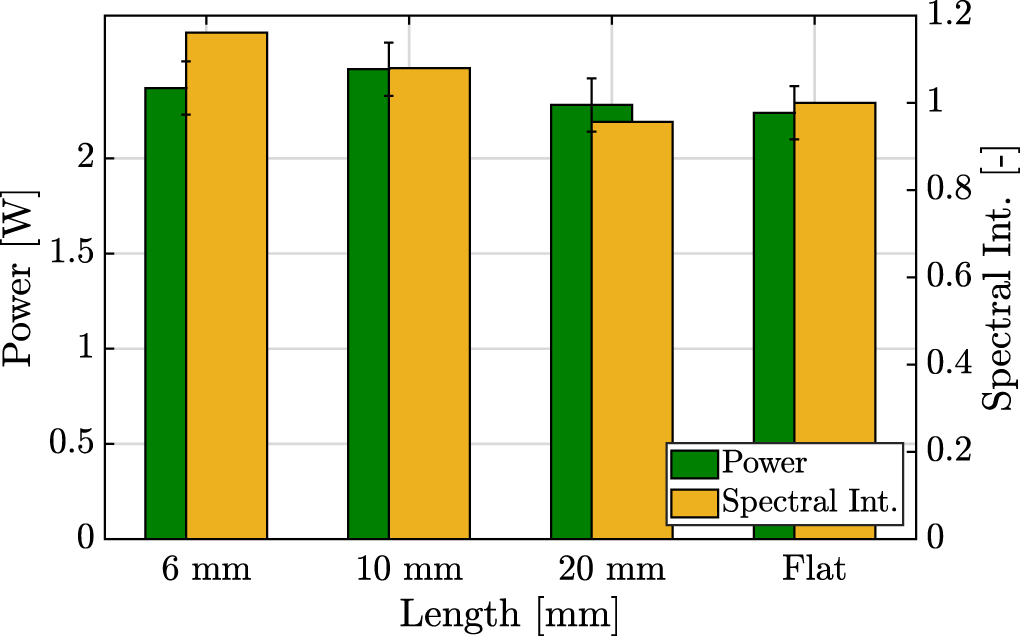
Standard image High-resolution imageIn figure 17 the calculated power consumptions of plasma sources using knitted electrodes for the scalability assessment can be seen. A similar behaviour as seen from the power consumption of the printed electrode system can be observed, with constant power intensity per unit length of electrode. One long 256 mm long knitted electrode system requires 0.96 W, a 128 mm medium long plasma source 0.52 W and a 64 mm short plasma source 0.27 W. The power intensities per unit length for varying length scales remains mostly constant with 3.75 W m−1, 4.06 W m−1 and 4.22 W m−1 for a long, medium and short plasma source, respectively. The power intensities of two parallel connected electrodes is 4.08 W m−1 and 4.31 W m−1 for four parallel connections, compared to 3.75 W m−1 of a single electrode. These fluctuations fall within the measurement uncertainty, thus indicating no significant affect by connecting printed electrode system either in series and parallel. The normalised spectral intensities, Ispec , of serially and parallel connected electrodes are showing fluctuations in a range of 43 % and 45 %, respectively. This larger increase of spectral intensity can be related back to the highly fluctuating plasma intensity across the electrode, already observe with in the recorded images. As the OES systems only records spectra from a small area of 4.5 mm2 on the electrode system, using it for a non-uniform plasma bares the risk of highly fluctuating recordings of the spectral intensity. Thus, a plasma system using knitted electrode shows limitations in generating a uniform plasma for varying length and width scales.

Figure 17. Power and spectral intensities of knitted electrodes connected in series and parallel.
Download figure:
Standard image High-resolution imageFor the flexibility assessment, the knitted electrode has been deformed at various bending curvatures to assess the ability to generate uniform plasmas over deformed electrodes. Figure 18 shows the plasma emission images using a knitted electrode over non-flat surfaces having various curvatures. The images clearly show a decrease of overall intensity and uniformity of plasma generation across the curved plasma sources. With a decrease in diameter, the plasma generation appears patchy, leaving various areas across the electrode un-ignited. The non-uniform plasma generation can be related to the geometrical configuration of the knitted electrode system. Increased curvatures, aggravate geometrical displacement of the electrode system. These added geometrical displacement introduces increasing gaps, which result in a local change of the plasma sources capacitance, which leads to the non-uniform plasma generation. In figure 19 the normalised image intensity,  , and intensity deviation,
  , are shown for varying curvatures. As can be seen, the observation from the images translate to the the normalized image intensity, showing a decrease of
  with decreasing curvatures, ranging from 0.23 to 1. The intensity deviation, σimg
, ranges up to 0.095. In comparison to the scalability assessment of the knitted electrode system, but also to the assessment of the printed electrode systems, this highlights the non-uniform character of the plasma generation.
with decreasing curvatures, ranging from 0.23 to 1. The intensity deviation, σimg
, ranges up to 0.095. In comparison to the scalability assessment of the knitted electrode system, but also to the assessment of the printed electrode systems, this highlights the non-uniform character of the plasma generation.
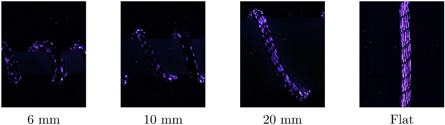
Figure 18. Air plasma emission images of the developed plasma sources using knitted electrodes over non-flat surfaces having various curvatures.
Download figure:
Standard image High-resolution image
Figure 19. Relative intensities and uniformities of plasmas generated using knitted electrodes over non-flat surfaces having various curvatures.
Download figure:
Standard image High-resolution imageFigure 20 shows the power consumption of the printed electrode system for various curvatures, with decreasing power consumption for higher curvatures. The power intensity of the plasma source with a rod curvature of 10 mm diameter reduces down to 2.34 W m−1, compared to 3.75 W m−1 of a knitted electrode in a flat configuration. Due to non-uniform plasma generation, only a smaller area of the knitted electrode is being ignited, thus the power consumptions reduced accordingly. The assessment of the normalized spectral intensity with regards to its flexibility, shows that a decrease in curvature diameters, shows a decreased normalized spectral intensity. In reference to a flat plasma source, for a 10 mm curvature diameter, a reduction of 95% of spectral intensity is measured. This reduced spectral intensity correlates with the reduced image intensity and uniformity, even though the effect is more prominent with the recorded spectra. The non-uniform plasma generation can result in the unintended 'recording' of a non-ignited patch on the knitted electrode.
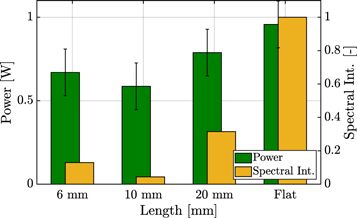
Figure 20. Power and spectral intensities of printed electrodes using knitted electrodes over non-flat surfaces having various curvatures.
Download figure:
Standard image High-resolution image3.3. Hybrid electrode
The scalability and flexibility assessment of both, the printed and knitted electrode systems, has highlighted advantages but also limitations of both plasma sources. The system scalability of a plasma source using a printed electrode is good for generating plasmas over large surfaces. However, the stiffness of the dielectric substrate of the plasma sources only allows for a directional flexibility. This allows the plasma source to be bend around curvatures as presented in this study, but limits a full omni-directional flexibility of the electrode system. Due to the thickness of the dielectric substrate, which needs to be sufficiently thick to ensure the electrical safety of the plasma sources, the flexibility of a plasma system can be reduced. As a plasma system using a printed electrode cannot provide omni-directional flexibility, a printed electrode system is difficult to be used for generating plasmas over complex non-flat surfaces.
Further, the printed electrode material is exposed to a bombardment of high-energy particles during the plasma discharge. This can oxidise and erode a printed thin electrode layer, which can reduce the lifetime of a plasma system [26]. The degradation of electrodes can result in the change of electrode geometry, thus affecting the properties of the generated plasmas and limiting the lifetime of a plasma source [9]. Applying protective coating on a printed electrode can improve the efficiency and reliability of a plasma system for long-term operation by preventing direct contact between a printed electrode and plasma [27]. Figure 21 shows the surfaces of the coated printed electrodes using Polydimethylsiloxane (PDMS) and Acrylic resin after 15 min of plasma generation. Compared to uncoated printed electrode experiencing signification amount of erosion after an extended operating time (15 min), the coated plasma sources have significantly reduced the erosion of printed electrodes.

Figure 21. Surface of printed electrodes: (a) Before ignition without coating; (b) After 15 min. ignition with 6 kV at 3 kHz without coating (c) After 15 min. ignition with 6 kV at 3 kHz with acrylic resin coating (b) After 15 min. ignition with 6 kV at 3 kHz with PDMS coating.
Download figure:
Standard image High-resolution imageCompared to a printed electrode, a plasma source using a knitted electrode has a better omni-directional flexibility. However the knitted electrode systems has a non-uniform plasma generation. Varying electrode gap distance and geometrical deformation can influence the generated plasma intensities and uniformity through changing electrode capacitance. Therefore, a plasma system using a knitted electrode has a limited capability to generate uniform plasmas over non-flat surfaces.
Figure 22(a) shows a schematic of a hybrid electrode system which can alleviate the disadvantages of both printed and knitted electrodes. A hybrid electrode is a coaxial electrode system consisting of a fully insulated power electrode and a printed ground electrode. The printed electrode is covered with a protective coating to improve the efficiency and reliability of the plasma source during long-term application. A printed ground electrode of very thin material layer minimizes the weight of the hybrid electrode system in comparison to the use of a knitted electrode. The printed ground electrode of the hybrid electrode system can improve the uniform plasma generation by reducing the deformation of ground electrode and improve the omni-directional flexibility of a plasma system by employing a coaxial configuration. One manufacturing approach is the use of a thin width of dielectric substrate, such as Kapton, with printed electrode patterns wrapped around and bonded to a insulated power electrode. In figure 22(b) the manufactured plasma source with a hybrid electrode can be seen. The picture of the ignited hybrid electrode shows plasma ignition along the full length, thus demonstrates the feasibility of the design. However it can be seen, that the plasma predominantly appears in the gaps between the individual dielectric Kapton strips, therefore special care is required during the manufacture process to ensure a uniform plasma generation.
Figure 22. (a) Schematic of hybrid electrode systems (b) Picture of an ignited and ignited hybrid design.
Download figure:
Standard image High-resolution image
4. Conclusion
Generating plasma across large and complex surfaces is one of the technical challenges remaining for the wide use of non-thermal plasma for biomedical and environmental applications. In this study, we have proposed two new plasma sources, a 'printed electrode' and 'knitted electrode', to improve the limitation of conventional plasma source through promoting the scalability and flexibility of electrode systems. A printed electrode system uses printed electronic techniques to fabricate thin electrodes on flexible dielectric substrates. A knitted electrode with a 3D coaxial electrode configuration uses a flexible knitted mesh electrode. The capability of both electrode systems with regards to flexibility and scalability has been investigated through electrical and optical diagnostics. The plasma source using a printed electrode system offers scalability and flexibility. However, it is a directional flexible system thus limiting its ability to generate plasma on omni-directional complex surfaces. Compared to a printed electrode, a knitted electrode system can be use for a fully-flexible plasma source, but the generated plasma uniformity is reduced by the deformation of the electrode geometry. The limitations of both, printed and knitted electrode can be improved by combining a flexible coaxial configuration with a printed ground electrode to a new hybrid electrode systems. The hybrid electrode system improves the omni-directional flexibility and reducing deformation of the electrode geometry, thus ensures flexibility and scalability of the plasma source and maximises the uniformity of a generated non-thermal plasma.
Acknowledgments
This work is sponsored by the Engineering and Physical Sciences Research Council—EPSRC (1939331) and the Defence Science and Technology Laboratory—DSTL (DSTLX-1000126208).